Embed Size (px)
Citation preview

Investor Update
01/13/2015
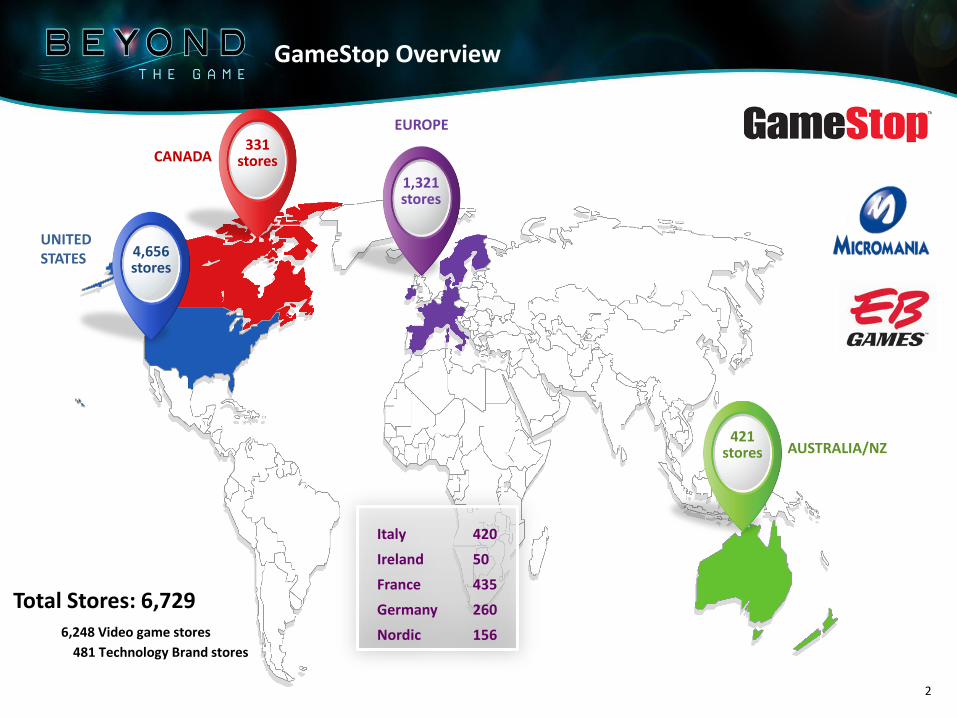
Total Stores: 6,7296,248 Video game stores
481 Technology Brand stores
331stores
1,321stores
4,656stores
421stores
CANADA
UNITED STATES
EUROPE
AUSTRALIA/NZ
Italy 420
Ireland 50
France 435
Germany 260
Nordic 156
2
GameStop Overview

Video Game Brands Platform
GameStop maintains a leadership position in the $22.4bn worldwide gaming market
30-34% next-gen console market share (U.S.)
48-52% next-gen software market share (U.S.)
Leading retailer in the fast growing digital business (26%+ CAGR from 2011-2013)
Unique in-store customer experience
Highly successful loyalty program with 40 million global members
Game Informer is the #1 digital magazine globally
Established buy-sell-trade program drives differentiation from competitors and enhanced profitability
Overview
3

GameStop’s Unique Formula
Vendor RelationshipsMultichannel
GameInformer Magazine
Buy – Sell – Trade
PowerUp Rewards
Informed Associates
4

Our Strategic Plan
Maximize Brick & Mortar Stores
Capture leading market share of new console cycle Utilize stores to grow digital sales Apply retail expertise to Tech Brands
Build on our Distinct Pre-owned Business
Expand the value assortment to increase sales and gross profit dollars Gain market share in Value channel
Own the Customer
Capitalize on our international loyalty program, now with 40 million members in 14 countries around the world
Digital Growth
DLC, Kongregate, Steam wallet, PC Downloads, Console Network cards
Disciplined Capital Allocation
Return 100% of our FCF to shareholders through buyback and dividend unless a better opportunity arises
5

We are delivering on our plan…
29M members in the U.S. and 11M internationally
PowerUp Loyalty
5% reduction in video game footprint over the last 3 years; 481 new Tech Brand stores
Consolidated store footprint
More than $2.0B of capital returned: $1.69B worth of shares repurchased + $382M of dividends paid*
Meaningful capital allocation program
Digital & Mobile growth $2.69B of digital receipts and $989M of mobile revenue since 2011
6
*LTD shares repurchased through January 4th 2015 and total cash dividends paid through December 16th 2014

The New Console Cycle Has Arrived
Hardware Growth Software Growth
57%
142%
22%
100%
TotalRetail
GME Total Retail
GME
In dollarsIn dollarsCompares life to date, or first 14 months, combined dollar growth of the PS4 and Xbox One to the PS3 and Xbox 360
Source: The NPD Group
In millions$0
$100,000,000
$200,000,000
$300,000,000
$400,000,000
$500,000,000
$600,000,000
Jan Feb Mar Apr May June July Aug Sept Oct Nov Dec
2014 Combined Industry Next vs. Current Gen SW Dollar Sales
Combined Current Gen Combined Next Gen
7
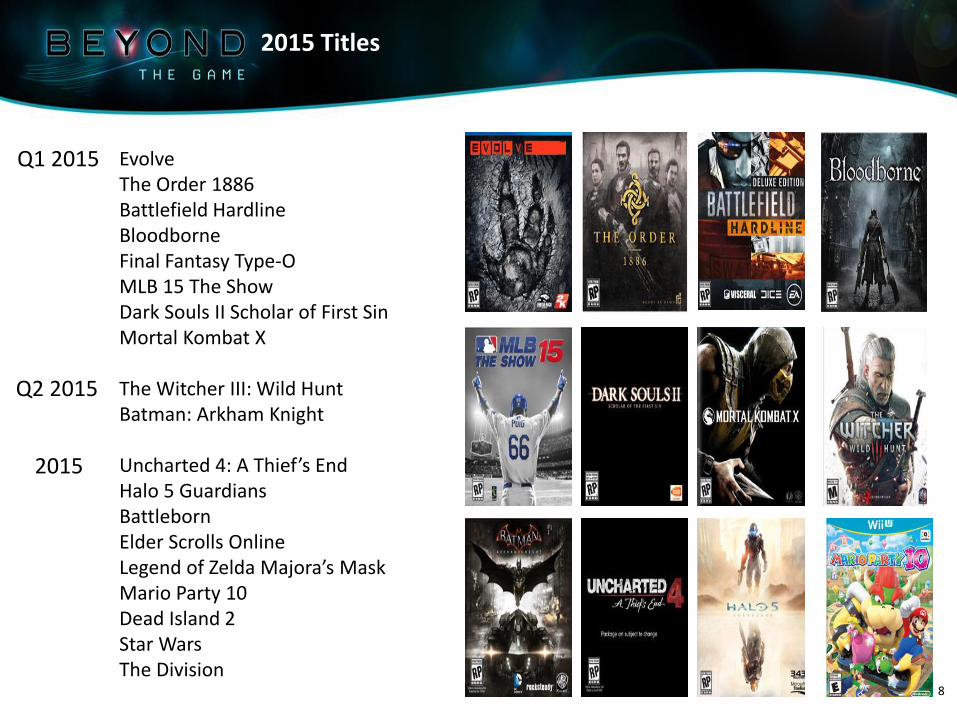
2015 Titles
8
EvolveThe Order 1886Battlefield HardlineBloodborneFinal Fantasy Type-OMLB 15 The ShowDark Souls II Scholar of First SinMortal Kombat X
The Witcher III: Wild HuntBatman: Arkham Knight
Uncharted 4: A Thief’s EndHalo 5 GuardiansBattlebornElder Scrolls OnlineLegend of Zelda Majora’s MaskMario Party 10Dead Island 2Star WarsThe Division
Q1 2015
Q2 2015
2015

1 in 5
American households have a PUR
card
Source: PowerUp data – Q3 2014
High spend gamers Well beyond gaming
PowerUp Rewards
78% 5X 3XOf Overall U.S. Sales
Non-member profitability
Avg. annual spend, 3x >
category
9
U.S. membership eclipsed 29 million members since launching in 2010, while International membership is over 11 million members
Leveraging PowerUp to drive Technology Brands new store openings

Pre-Owned / Value
Unique form of currency
Significant amount of trade credit dollars provided to consumers annually
70% of credit funds new game purchases
30% of Xbox One and PS4 console sales enabled by trade credits
Consumers assign an estimated $20 residual value to physical games
Gross margins of 42%-48%
Unique, complex, pricing algorithms that control the buy and sell side sales price to effectively manage inventory levels
Superior assortment planning and in-store visual merchandising around top-selling pre-owned games
Sophisticated, in-house systems built to comply with thousands of U.S. municipal code laws around accepting trades
Global, high-tech refurbishment operations capable of repairing millions of hardware and software units annually
GameStop is the industry leader with advanced refurbishment operations and inventory management systems
12
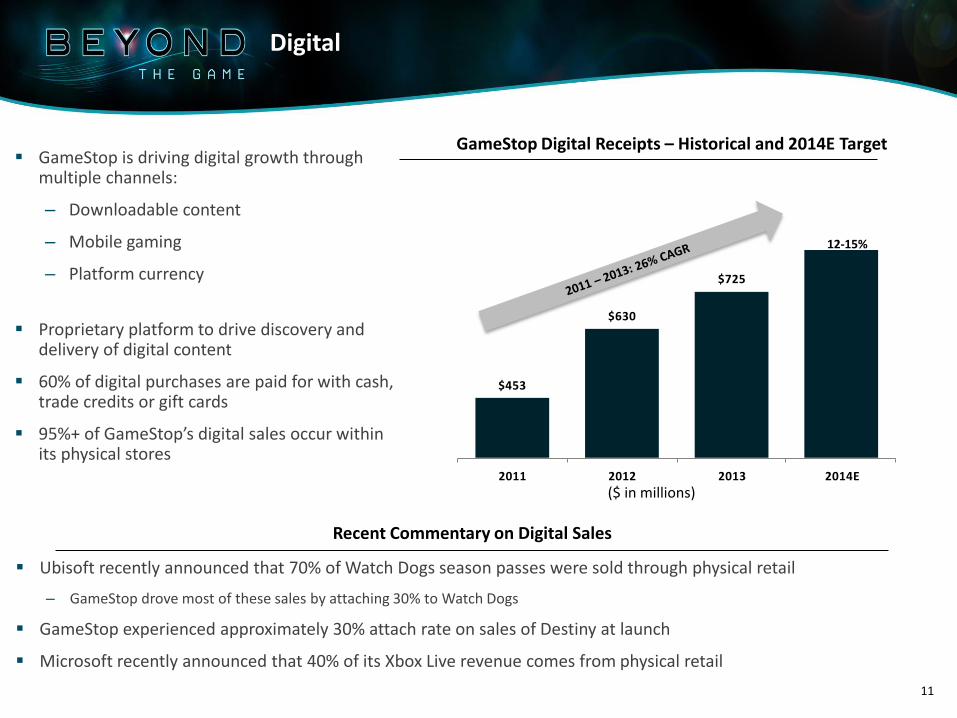
Digital
GameStop Digital Receipts – Historical and 2014E Target
($ in millions)
12-15%
Recent Commentary on Digital Sales
$453
$630
$725
2011 2012 2013 2014E
GameStop is driving digital growth through multiple channels:
– Downloadable content
– Mobile gaming
– Platform currency
Proprietary platform to drive discovery and delivery of digital content
60% of digital purchases are paid for with cash, trade credits or gift cards
95%+ of GameStop’s digital sales occur within its physical stores
Ubisoft recently announced that 70% of Watch Dogs season passes were sold through physical retail
– GameStop drove most of these sales by attaching 30% to Watch Dogs
GameStop experienced approximately 30% attach rate on sales of Destiny at launch
Microsoft recently announced that 40% of its Xbox Live revenue comes from physical retail
11

Multichannel is driving growth at GameStop
Q3 Multichannel sales up +20% driven by Pick-Up @ Store
Q3 Pick-Up in store revenue up 91%+
GameStop ranks in the top 25 retail websites in terms of total traffic (comScore)
of surveyed customers say they plan on visiting a store to purchase a product they saw on GameStop.com80%
20%
91%
25TOP
Multichannel
12

Technology Brands Overview

20042002 2006 2008 2010 2012 2014
Digital & DLC
Apple and Wireless
Mobile and Tablets
1996 2000
Gaming & Entertainment
GameStop’s History of Change
14
GameStop 1.0 GameStop 2.0 GameStop 3.0

GameStop Transferable Competencies
Ability to deploy capital in ways that diversify the underlying business, manage balance sheet risk and enhance / increase shareholder value
Deep Real Estate Knowledge
Robust Talent Development
Practices
Customer Loyalty Program Creation and
Implementation
Buy – Sell – Trade Model
Financial Discipline
Landlord relationships Portfolio management Rapid growth experience
Hiring Training Multi-unit management expertise
Inventory balancing Pricing algorithms Refurbishment capabilities Secondhand dealer compliance
PowerUp Rewards in U.S. plus 13 countries worldwide
We will leverage our core competencies in Video Games retailing to also become a leader in the Technology Brands segments
15
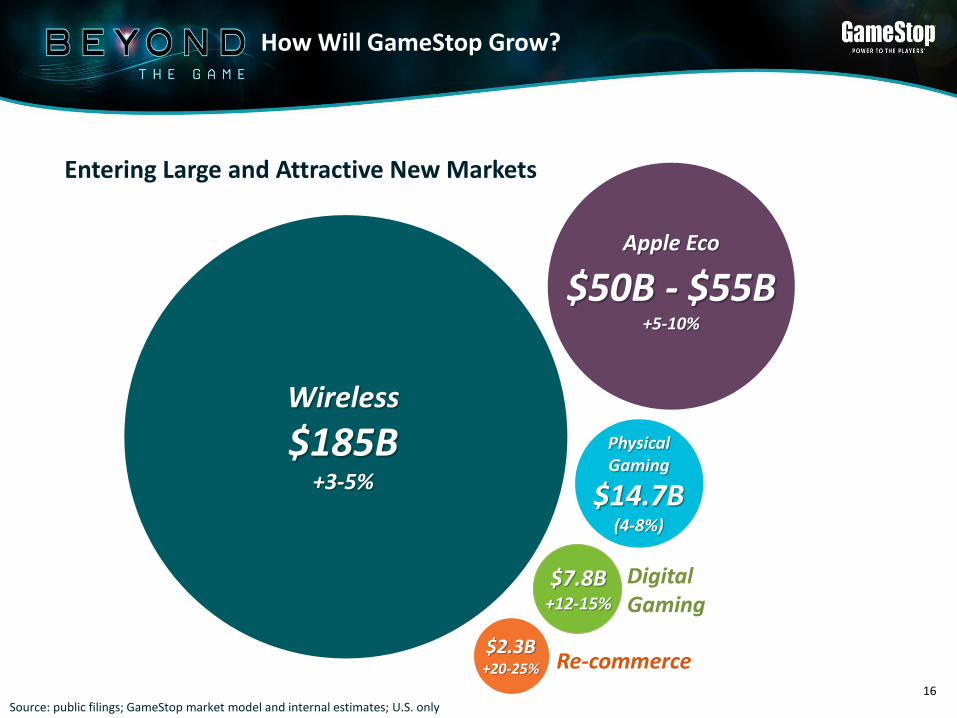
Wireless
$185B+3-5%
Entering Large and Attractive New Markets
Apple Eco
$50B - $55B+5-10%
PhysicalGaming
$14.7B(4-8%)
Digital Gaming
$7.8B+12-15%
Re-commerce$2.3B
+20-25%
How Will GameStop Grow?
Source: public filings; GameStop market model and internal estimates; U.S. only16

Technology Brands Platform
New segment added to the business in Q4 FY’13
Products include new and pre-owned mobile devices, wireless service, consumer electronics, non-gaming accessories and related accessories
Incremental opportunity with trade-in of pre-owned electronic devices
Long-term dealer arrangement / licensing agreements with AT&T and Apple
Key Brands
17
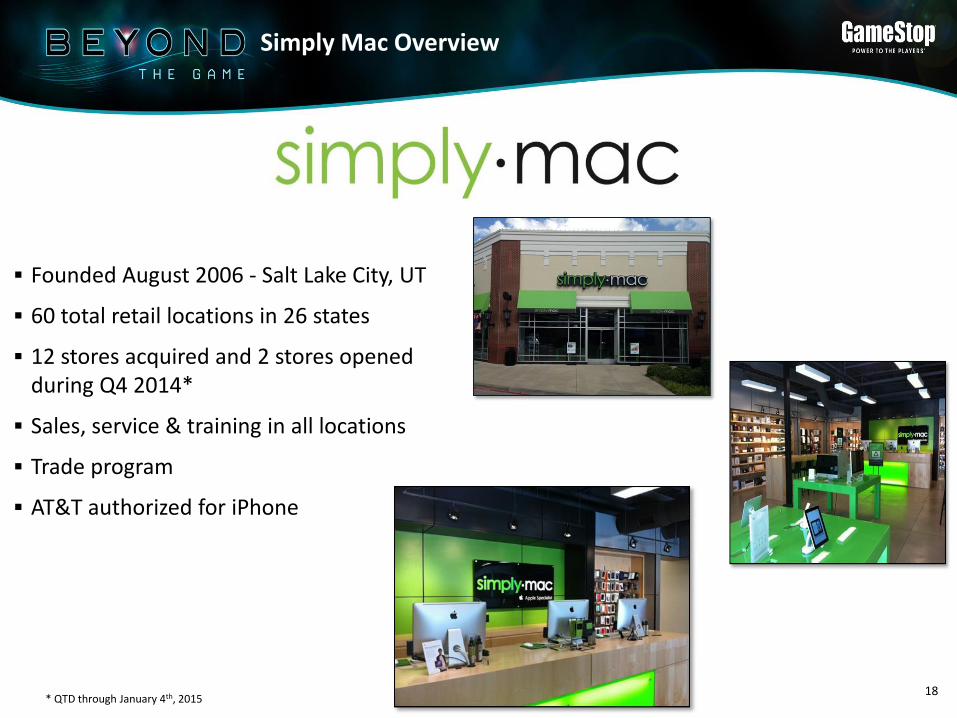
Simply Mac Overview
Founded August 2006 - Salt Lake City, UT
60 total retail locations in 26 states
12 stores acquired and 2 stores opened during Q4 2014*
Sales, service & training in all locations
Trade program
AT&T authorized for iPhone
18* QTD through January 4th, 2015

Spring Mobile Overview
AT&T reseller with AT&T branded stores
90 stores in September 2013
Acquired by GameStop November 2013
358 stores today
141 stores (14 resellers) acquired in the last year
#1 rated AT&T reseller
19

2,200
1,679
782
203
Exclusive Distribution and Dealer Fragmentation
0-10
11-30>50
Local Dealer Fragmentation (# of stores)Exclusive Distribution (# of stores) (1)
(16%)
(33%)
(44%)
(7%)AT&T Corporate
Locations
31-50
Total SpringDoors
Total Other National Dealers
Total Local Dealer Doors
(10%)
(86%)
86% of local dealers have 10 stores or less
GameStop’s leading position as an AT&T dealer coupled with significant market fragmentation provides a meaningful opportunity to continue to grow through accretive acquisitions
Spring Mobile is the 3rd largest AT&T national dealer
(1) As of February 1, 2014.(2) As of January 4, 2015
Acquisitions: 203 stores and 20 dealers to date (2)
20
358

Final Statistics – Results
Pre-paid wireless stores in partnership with AT&T
One of the largest Cricket dealers nationwide
We currently operate 63 stores in 6 markets
Selling Cricket service in 2,000 GameStop stores
New brands give us more flexibility in our real estate portfolio
Cricket Wireless Overview
21

Projected Technology Brands Growth
Store Growth Revenue Growth EBIT Growth
218
1,000
$63
$1,000$75
-$0.2
2013 2016E 2013 2016E 2013 2016E
In millions In millions
22

GameStop’s New Positioning
GameStop is a family of specialty retailers that makes your favorite technologies affordable and simple
23

Financial Overview

2014 Holiday Sales Results
2014 Holiday Sales Actuals
Total Sales
Comp SSS
$2.94 billion
25
New Hardware
New Software
Accessories
Pre-owned/Value
Digital
Mobile and CE
Other
-3.1%
-6.7%
$713.0 million
$1,143.0 billion
$560.0 million
$216.7 million
$53.2 million
$132.1 million
$122.4 million
-32.0%
5.8%
-1.3%
5.9%
3.9%
28.1%
28.8%
Growth

Q4 & FY2014 Guidance
Q4 2014 FY 2014
Comp SSS
Income Tax Rate
Operating Margin
Net Income (in millions)
-2.5% to -1.0%
36.5% - 37.5%
Weighted average shares outstanding
Diluted earnings per share
110,000,000
$2.08 - $2.24
+3.0% to +4.0%
36.5% - 37.5%
6.5% - 7.0%
$398 - $433
113,500,000
$3.40 - $3.5526

Disciplined + Balanced Allocation
Capital Allocation
$120 - $125
$35 - $40
$50 - $100
$150$250 - $300
Dividend M&A Buyback
2014E Capital Deployment: 2014E:Capital Expenditures
International Stores
Technology Brands Stores
Video Game Stores
$35 - $40
$30 - $35$85 - $90
In Millions In Millions
27

Investor Takeaways
Maximize leadership position in video game category to drive topline and net income growth
Expand participation in CE and mobile segments through growth in our Technology Brands
Increase total shareholder return from share appreciation and dividend growth
Grow terminal value of GameStop through diversification
28