Embed Size (px)
Citation preview

,
Investor Relations PresentationNovember, 2018.

AGENDACOMPANY OVERVIEW1
MAIN BUSINESS DIVISIONS3
FINANCIALS4
APPENDIX: EARNINGS RELEASE 3Q185
CAR RENTAL
FLEET RENTAL
SEMINOVOS
1
2
3
2
COMPETITIVE ADVANTAGES2
3
1973
Founded in Belo Horizonte with 6
VW Beetles
1979
Expasion to 11 capital cities
becoming marketleader in 1981
1984
Expansionstrategy
by adjacencies: Franchising
1991
Expansion strategyby adjacencies:
Seminovos
1992
Internationalizationthrough Franchising
1997
PE firm DL&J enters ata market cap of
US$150 mm
1999
Expansion strategy byadjacencies: Fleet
Rental
2005
IPO with a Market Cap ofUS$295 mm
2014
Beginning ofDigital Transformation
2017
Strategic partnershipwith Hertz -
Phase I: Rise to #1 Phase II: ExpansionPhase III:
Reaching ScalePhase IV: Digital Transformation
COMPANY HISTORY:MILESTONES
2018
Market CapUS$3.8 Billion (09/30/18)
2006
50,000 cars
2011
100,000 cars
150,000 cars
+222,000 cars
1982
1.000 cars
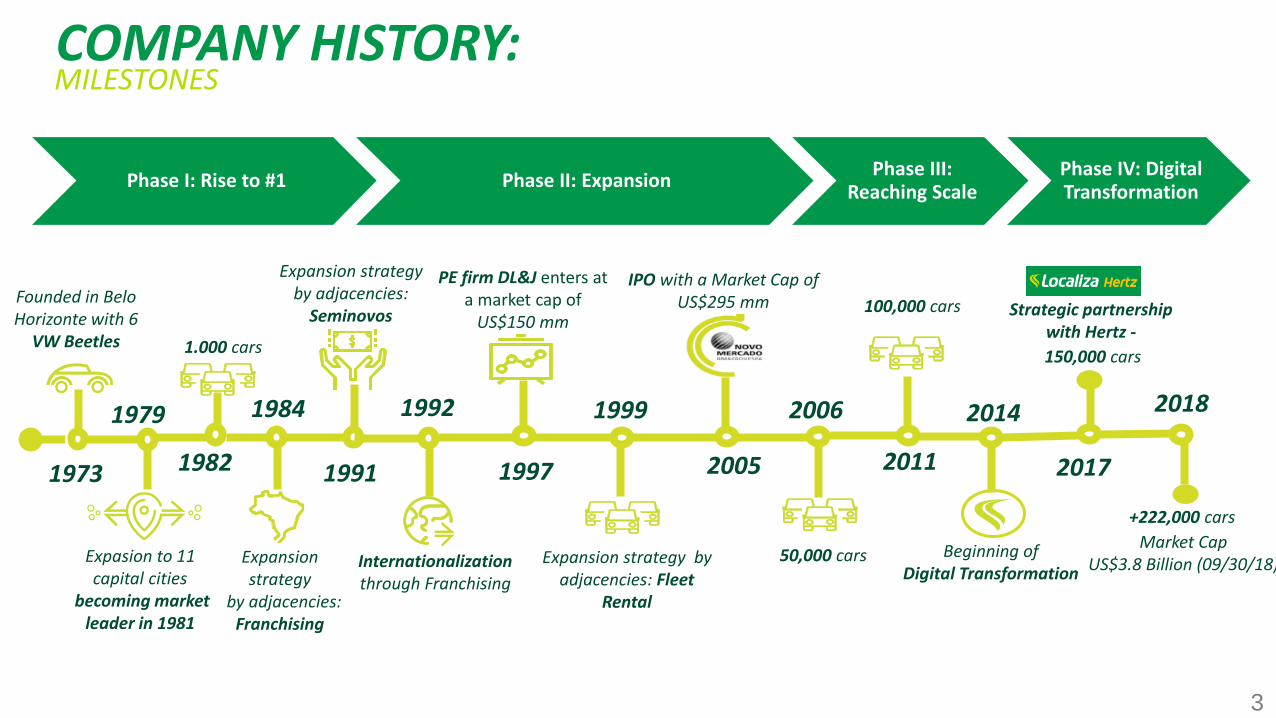
INTEGRATED BUSINESS PLATFORM
THIS INTEGRATED PLATFORM GIVES LOCALIZA
FLEXIBILITY AND SUPERIOR PERFORMANCE
4
• 156,436 CARS• 8.3 MILLION CLIENTS• 395 LOCATIONS• 4,788 EMPLOYEES
CAR RENTAL FLEET RENTAL
•51,236 CARS• +1,000 CLIENTS• 304 EMPLOYEES
USED CAR SALES
• 48% SOLD TO FINAL CONSUMER• 101 STORES• 67 CITIES• 1,317 EMPLOYEES
FRANCHISING• 14,505 CARS• 127 LOCATIONS IN BRASIL • 61 LOCATIONS IN SOUTH AMERICA• 33 EMPLOYEES
SYNERGIES:BARGAINING POWER
COST REDUCTIONCROSS SELLING
OVERHEAD AND SUPPORT: 1,335 EMPLOYEES
3Q18
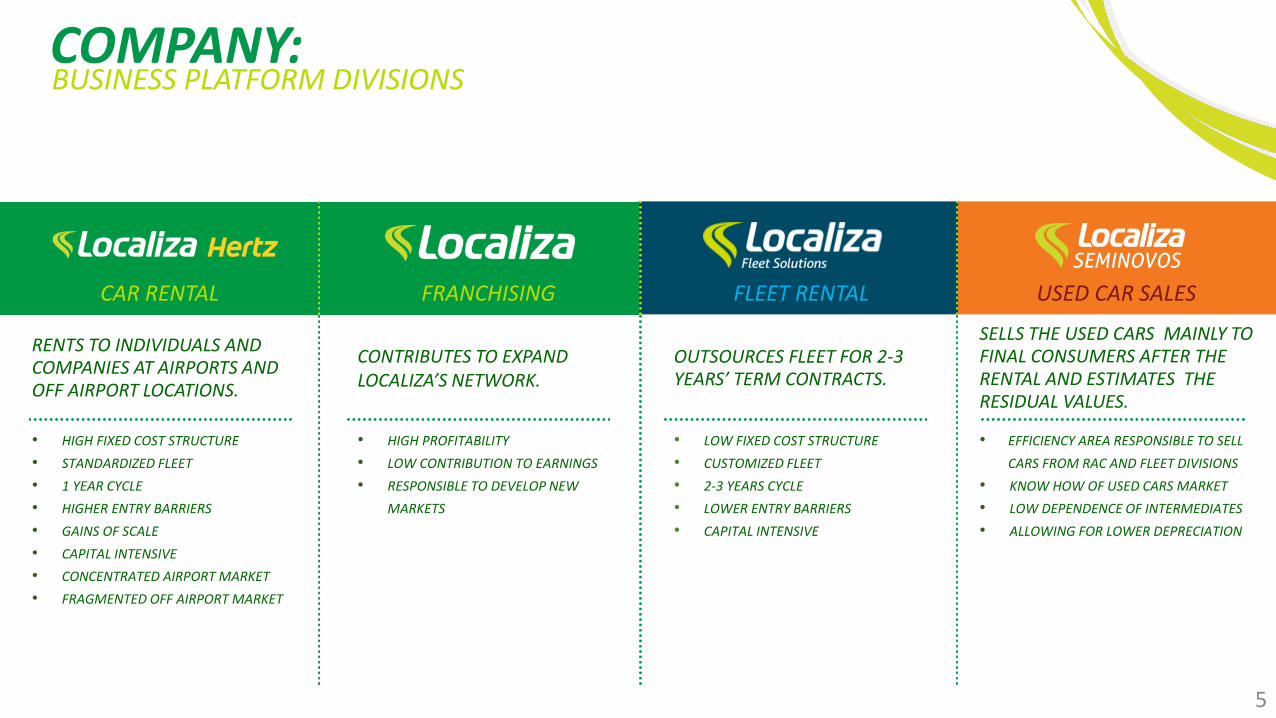
COMPANY:BUSINESS PLATFORM DIVISIONS
CAR RENTAL FRANCHISING FLEET RENTAL USED CAR SALES
5
• HIGH FIXED COST STRUCTURE
• STANDARDIZED FLEET
• 1 YEAR CYCLE
• HIGHER ENTRY BARRIERS
• GAINS OF SCALE
• CAPITAL INTENSIVE
• CONCENTRATED AIRPORT MARKET
• FRAGMENTED OFF AIRPORT MARKET
RENTS TO INDIVIDUALS AND COMPANIES AT AIRPORTS AND OFF AIRPORT LOCATIONS.
CONTRIBUTES TO EXPAND LOCALIZA’S NETWORK.
• HIGH PROFITABILITY
• LOW CONTRIBUTION TO EARNINGS
• RESPONSIBLE TO DEVELOP NEW
MARKETS
• LOW FIXED COST STRUCTURE
• CUSTOMIZED FLEET
• 2-3 YEARS CYCLE
• LOWER ENTRY BARRIERS
• CAPITAL INTENSIVE
OUTSOURCES FLEET FOR 2-3 YEARS’ TERM CONTRACTS.
SELLS THE USED CARS MAINLY TO FINAL CONSUMERS AFTER THE RENTAL AND ESTIMATES THE RESIDUAL VALUES.
• EFFICIENCY AREA RESPONSIBLE TO SELL
CARS FROM RAC AND FLEET DIVISIONS
• KNOW HOW OF USED CARS MARKET
• LOW DEPENDENCE OF INTERMEDIATES
• ALLOWING FOR LOWER DEPRECIATION
6
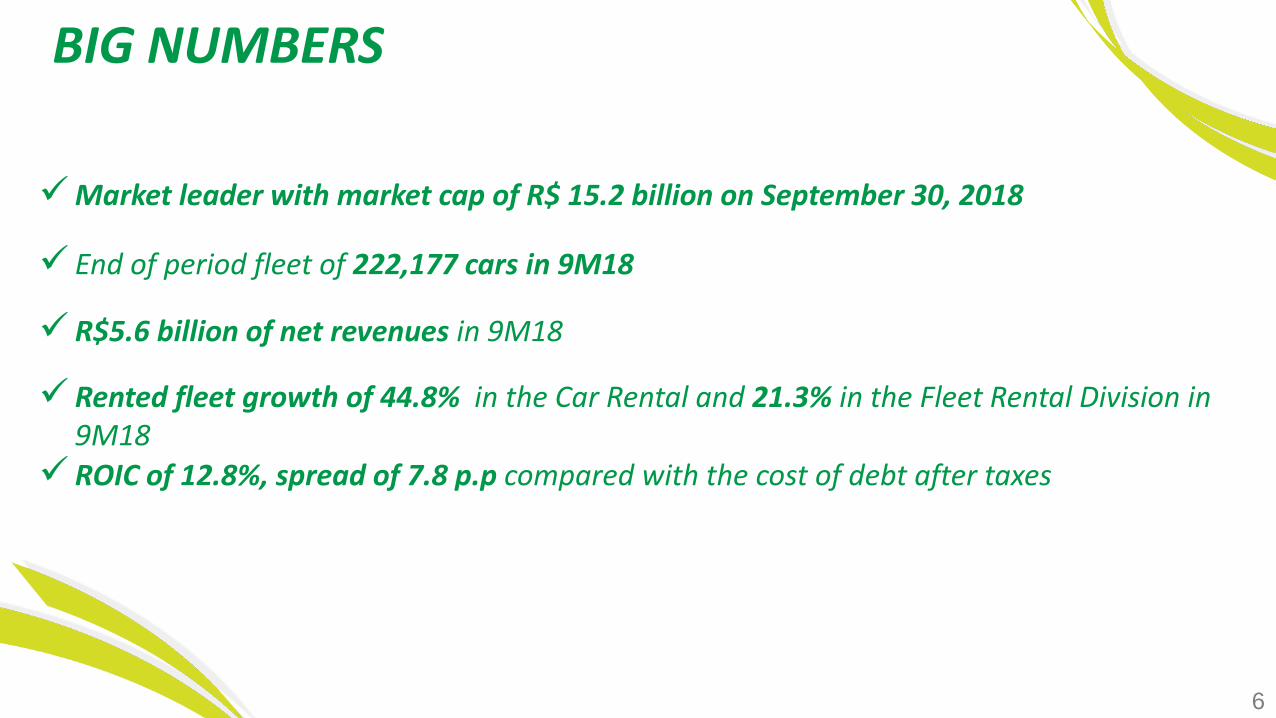
BIG NUMBERS
✓Market leader with market cap of R$ 15.2 billion on September 30, 2018
✓ End of period fleet of 222,177 cars in 9M18
✓ R$5.6 billion of net revenues in 9M18
✓ Rented fleet growth of 44.8% in the Car Rental and 21.3% in the Fleet Rental Division in 9M18
✓ ROIC of 12.8%, spread of 7.8 p.p compared with the cost of debt after taxes
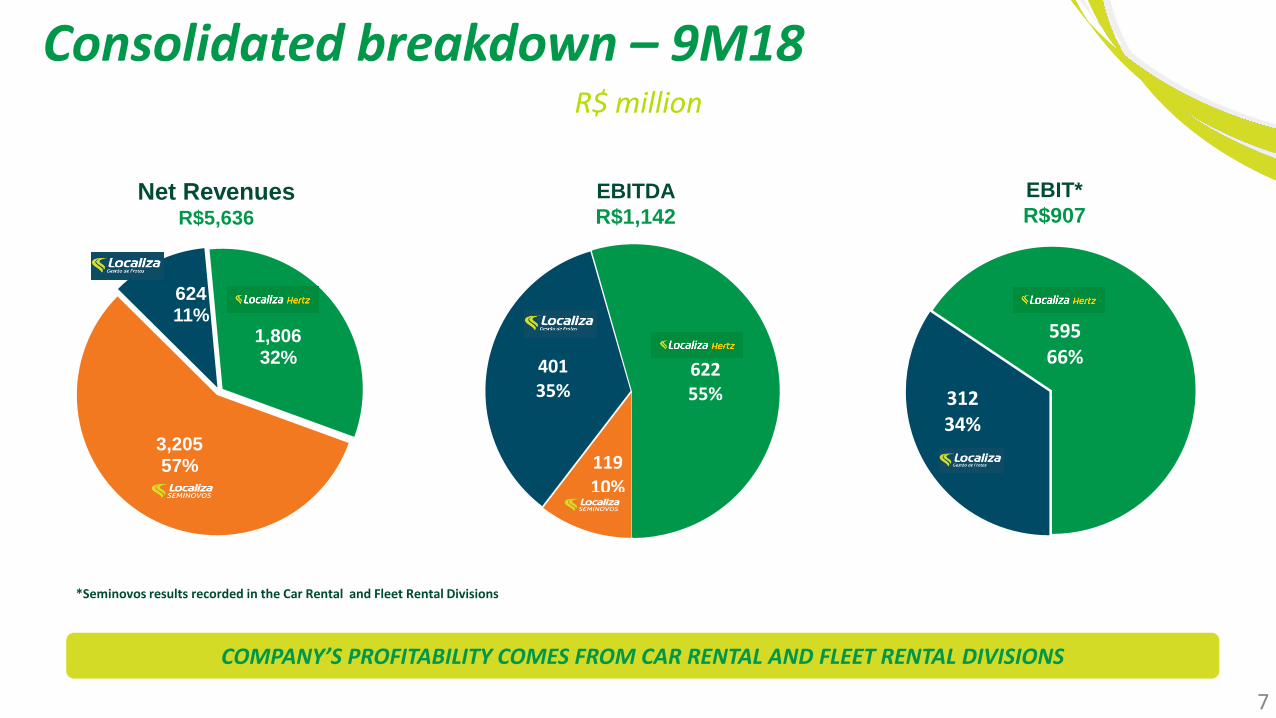
Net RevenuesR$5,636
EBITDA
R$1,142
EBIT*
R$907
Consolidated breakdown – 9M18R$ million
7
*Seminovos results recorded in the Car Rental and Fleet Rental Divisions
COMPANY’S PROFITABILITY COMES FROM CAR RENTAL AND FLEET RENTAL DIVISIONS
11910%
40135%
62255% 312
34%
59566%
3,205 57%
624 11%
1,806 32%

AGENDACOMPANY OVERVIEW1
MAIN BUSINESS DIVISIONS3
FINANCIALS4
APPENDIX: EARNINGS RELEASE 3Q185
CAR RENTAL
FLEET RENTAL
SEMINOVOS
1
2
3
8
COMPETITIVE ADVANTAGES2

COMPETITIVE ADVANTAGES
PROFITABILITY COMES FROM RENTAL DIVISIONS
CASH TO RENEW THE FLEET OR PAY DEBT
RAISING MONEY
BUYINGCARS
ALUGUELDE CARS
SELLINGCARS
9
RENTINGCARS
45 YEARS OF EXPERIENCE IN MANAGING ASSETS AND GENERATING VALUE.
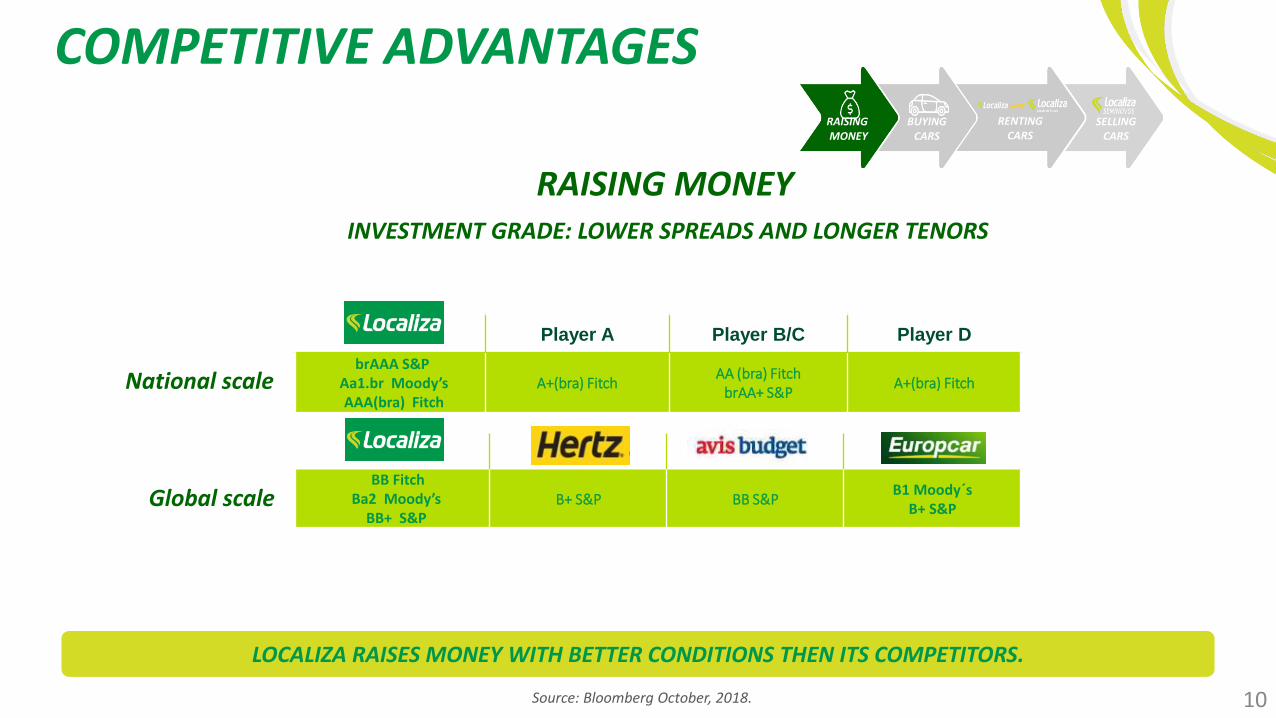
COMPETITIVE ADVANTAGES
RAISING MONEYINVESTMENT GRADE: LOWER SPREADS AND LONGER TENORS
Source: Bloomberg October, 2018.
BB FitchBa2 Moody’s
BB+ S&PB+ S&P BB S&P
B1 Moody´sB+ S&P
Player A Player B/C Player D
brAAA S&P Aa1.br Moody’sAAA(bra) Fitch
A+(bra) FitchAA (bra) Fitch
brAA+ S&PA+(bra) FitchNational scale
Global scale
10
RAISING MONEY
BUYINGCARS
SELLINGCARS
RENTINGCARS
LOCALIZA RAISES MONEY WITH BETTER CONDITIONS THEN ITS COMPETITORS.
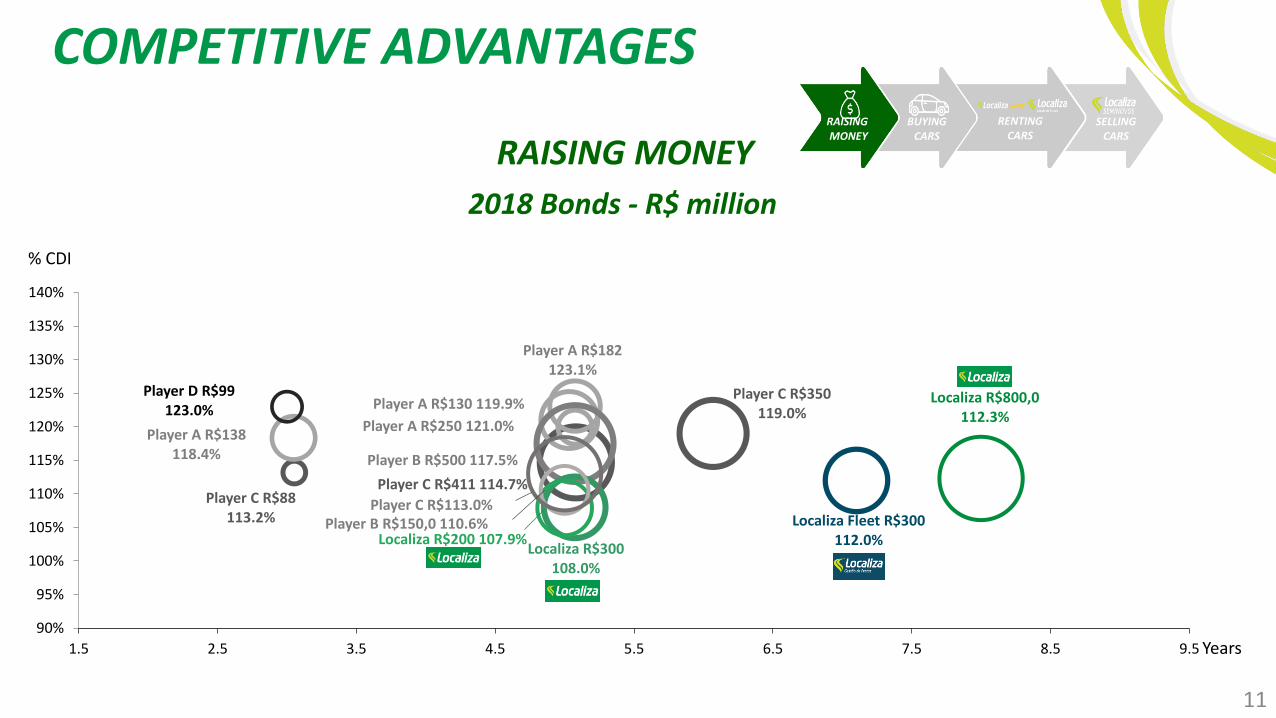
COMPETITIVE ADVANTAGES
11
RAISING MONEY
2018 Bonds - R$ million
% CDI
Years
RAISING MONEY
BUYINGCARS
SELLINGCARS
RENTINGCARS
Player C R$411 114.7%Player C R$88
113.2%
Player C R$350119.0%
Player A R$138118.4%
Player A R$182 123.1%
Player A R$130 119.9%
Player A R$250 121.0%
Player B R$500 117.5%
Localiza R$300108.0%
Localiza Fleet R$300112.0%
Player D R$99123.0%
Localiza R$200 107.9%
Localiza R$800,0112.3%
Player B R$150,0 110.6%Player C R$113.0%
90%
95%
100%
105%
110%
115%
120%
125%
130%
135%
140%
1.5 2.5 3.5 4.5 5.5 6.5 7.5 8.5 9.5
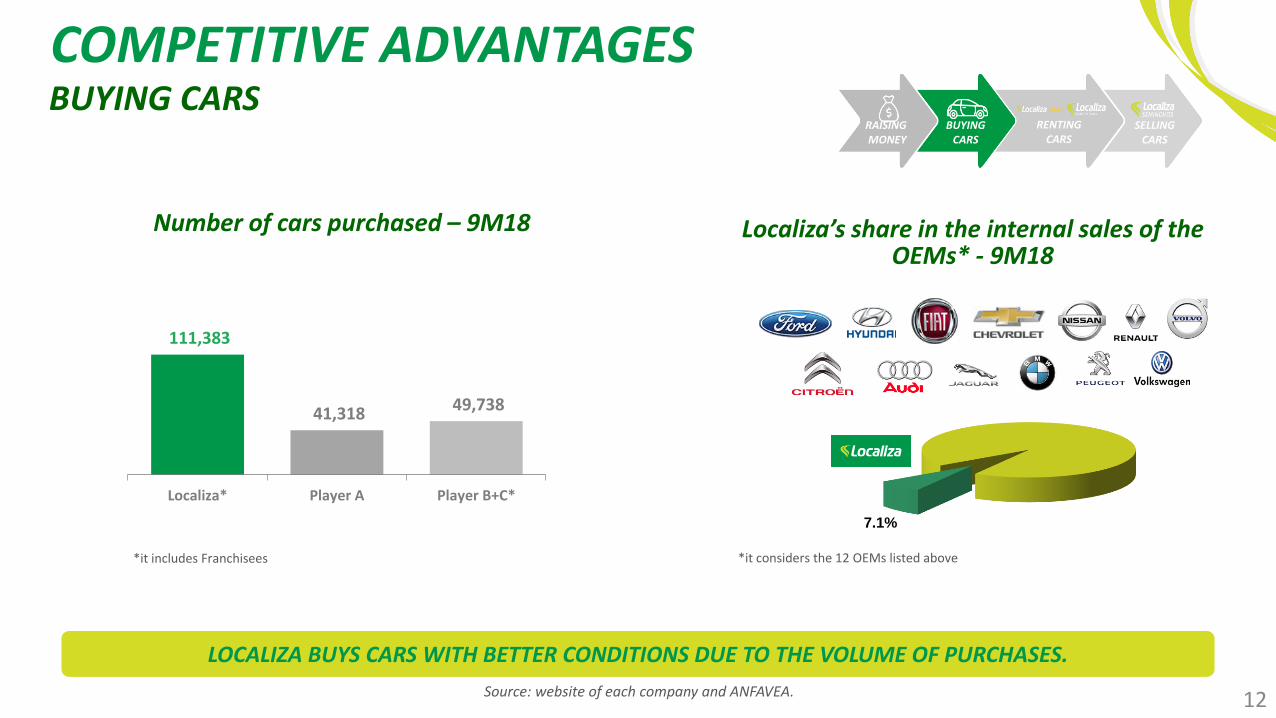
Number of cars purchased – 9M18 Localiza’s share in the internal sales of the OEMs* - 9M18
Source: website of each company and ANFAVEA. 12
COMPETITIVE ADVANTAGESBUYING CARS
111,383
41,318 49,738
Localiza* Player A Player B+C*
*it includes Franchisees
7.1%
LOCALIZA BUYS CARS WITH BETTER CONDITIONS DUE TO THE VOLUME OF PURCHASES.
RAISING MONEY
BUYINGCARS
SELLINGCARS
RENTINGCARS
*it considers the 12 OEMs listed above
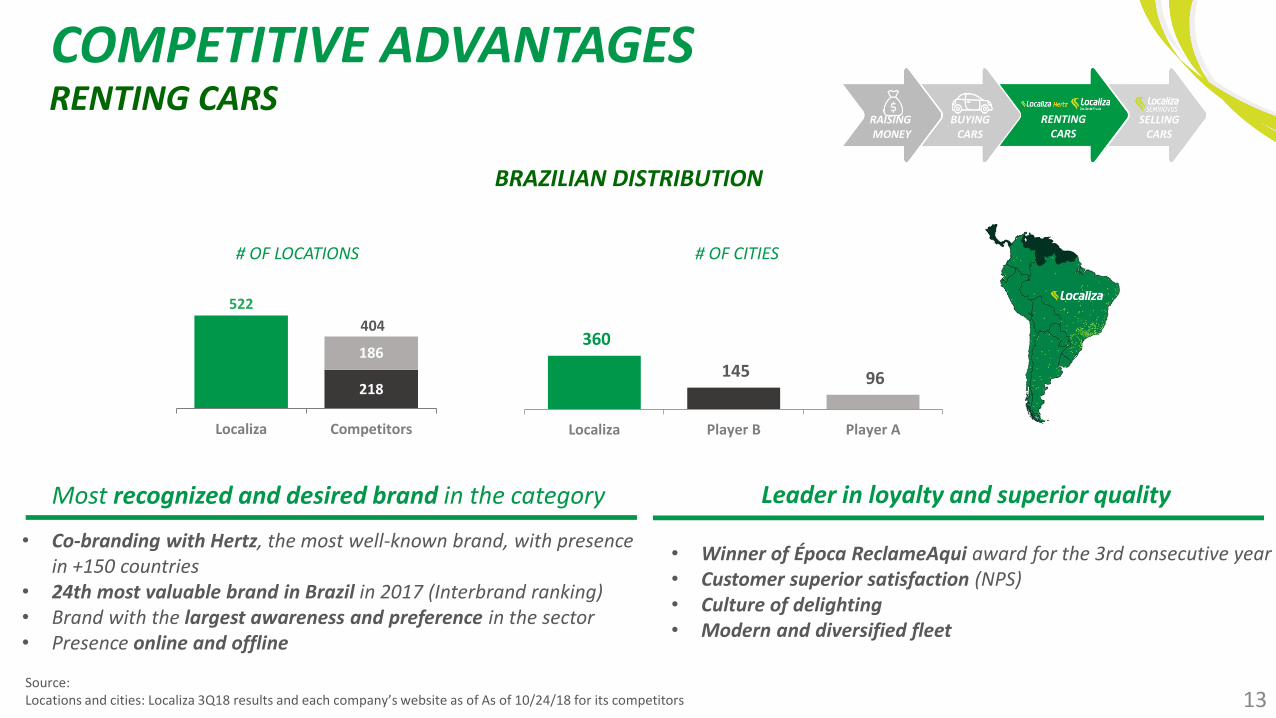
Most recognized and desired brand in the category
13
• Co-branding with Hertz, the most well-known brand, with presence in +150 countries
• 24th most valuable brand in Brazil in 2017 (Interbrand ranking) • Brand with the largest awareness and preference in the sector• Presence online and offline
• Winner of Época ReclameAqui award for the 3rd consecutive year • Customer superior satisfaction (NPS) • Culture of delighting• Modern and diversified fleet
Leader in loyalty and superior quality
COMPETITIVE ADVANTAGESRENTING CARS
BRAZILIAN DISTRIBUTION
# OF LOCATIONS # OF CITIES
522
218
186
404
Localiza Competitors
360
145 96
Localiza Player B Player A
RAISING MONEY
BUYINGCARS
SELLINGCARS
RENTINGCARS
Source: Locations and cities: Localiza 3Q18 results and each company’s website as of As of 10/24/18 for its competitors
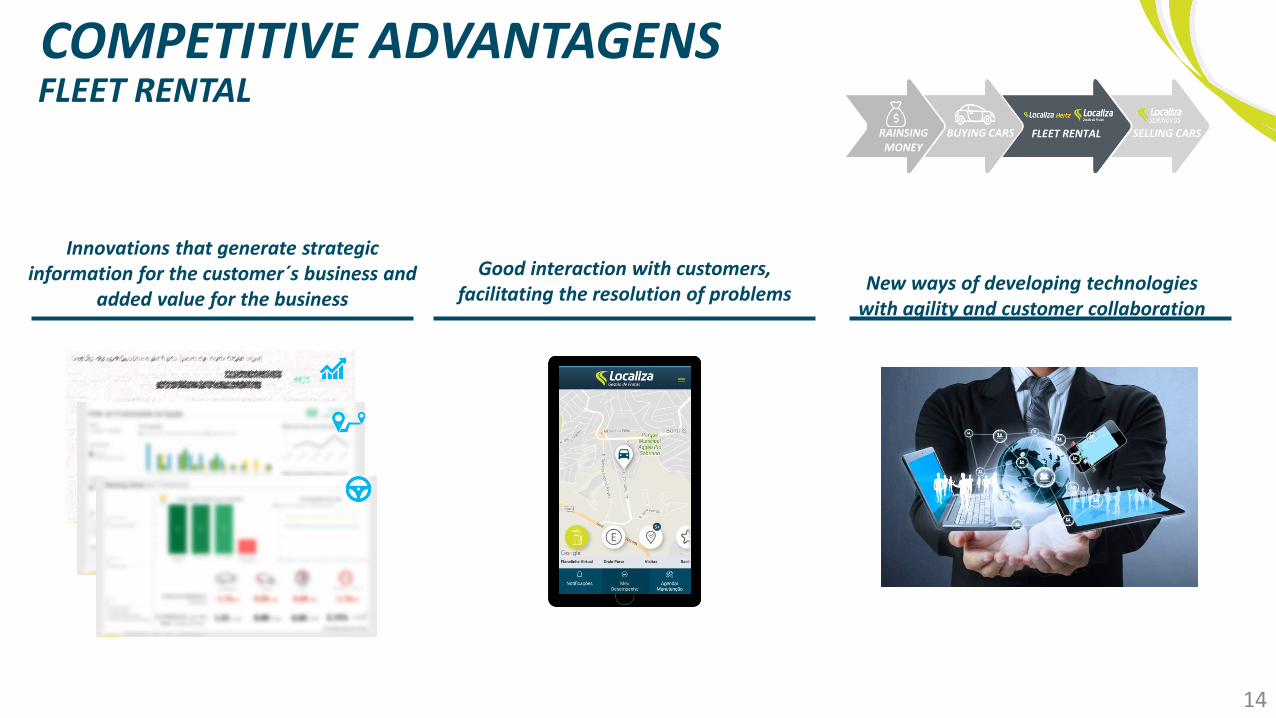
COMPETITIVE ADVANTAGENS
14
RAINSINGMONEY
BUYING CARS SELLING CARSFLEET RENTAL
New ways of developing technologies with agility and customer collaboration
Innovations that generate strategic information for the customer´s business and
added value for the business
Good interaction with customers, facilitating the resolution of problems
FLEET RENTAL
15
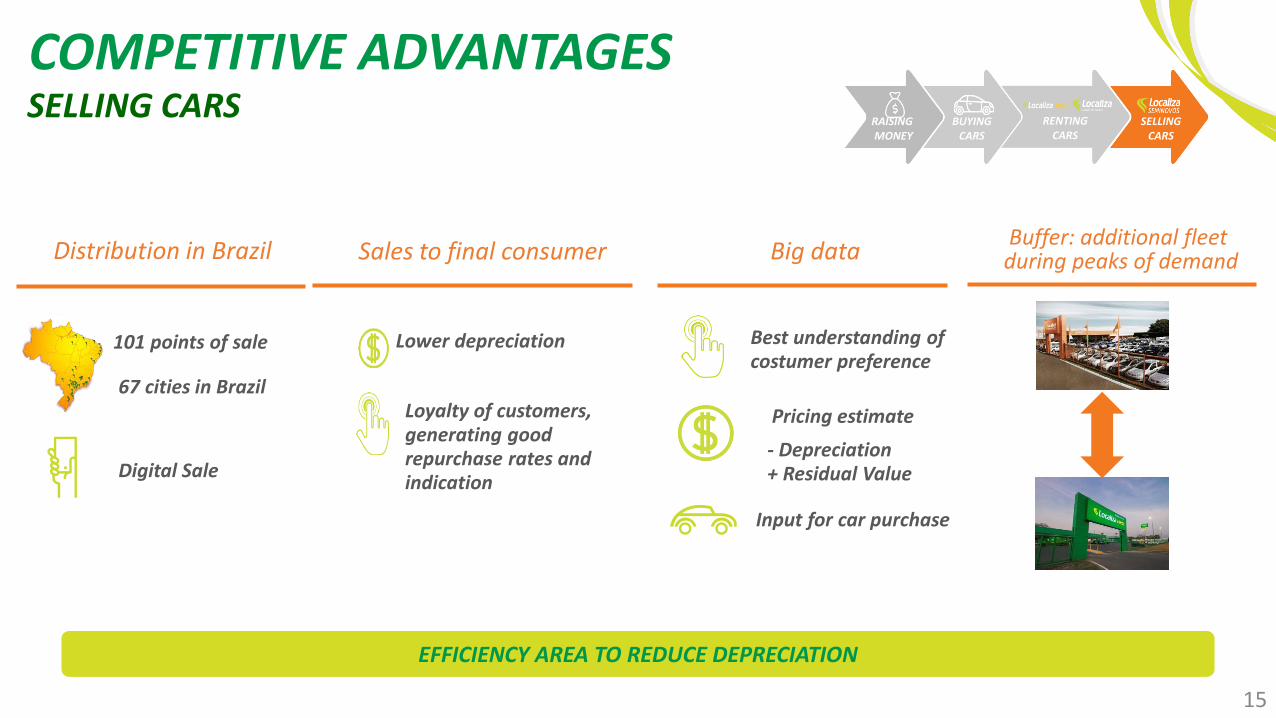
Distribution in Brazil
Digital Sale
101 points of sale
67 cities in Brazil
COMPETITIVE ADVANTAGESSELLING CARS
Big data
Best understanding of costumer preference
Pricing estimate
- Depreciation+ Residual Value
Input for car purchase
Buffer: additional fleet during peaks of demandSales to final consumer
Lower depreciation
Loyalty of customers, generating good repurchase rates and indication
EFFICIENCY AREA TO REDUCE DEPRECIATION
RAISING MONEY
BUYINGCARS
SELLINGCARS
RENTINGCARS
16
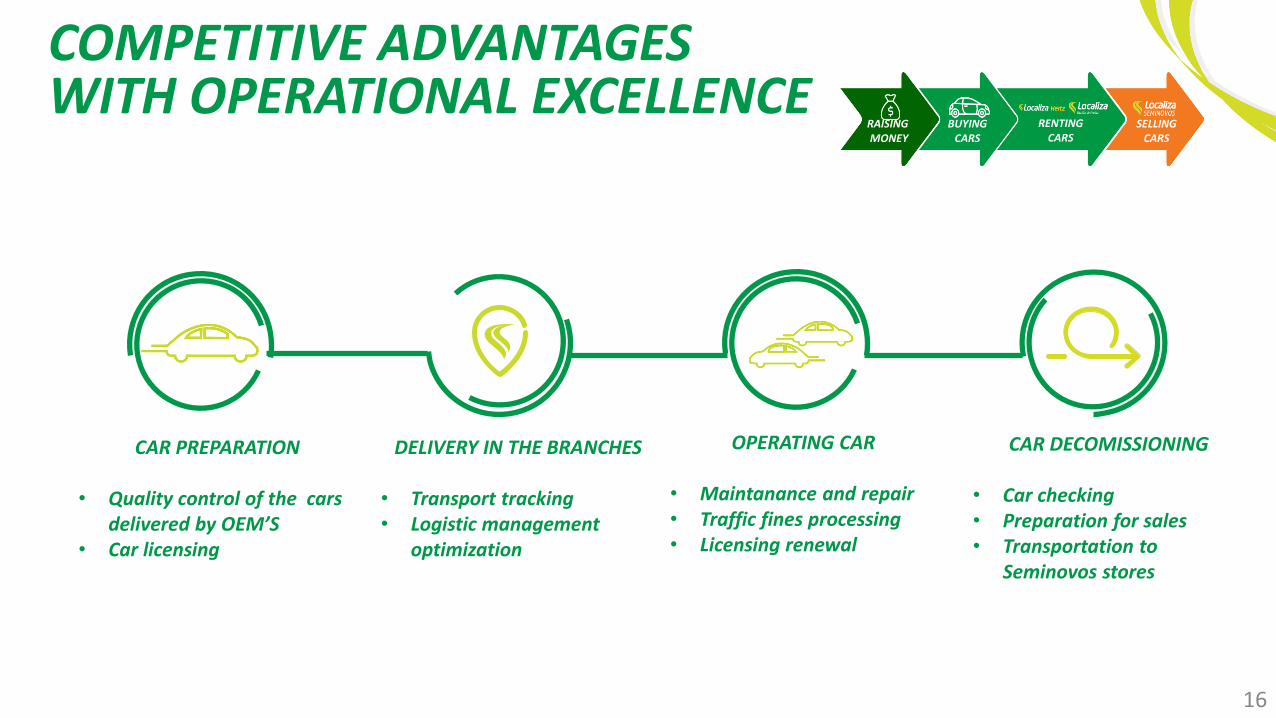
COMPETITIVE ADVANTAGESWITH OPERATIONAL EXCELLENCE
CAR PREPARATION
• Quality control of the cars delivered by OEM’S
• Car licensing
DELIVERY IN THE BRANCHES
• Transport tracking• Logistic management
optimization
OPERATING CAR
• Maintanance and repair• Traffic fines processing• Licensing renewal
CAR DECOMISSIONING
• Car checking • Preparation for sales• Transportation to
Seminovos stores
RAISING MONEY
BUYINGCARS
SELLINGCARS
RENTINGCARS
17
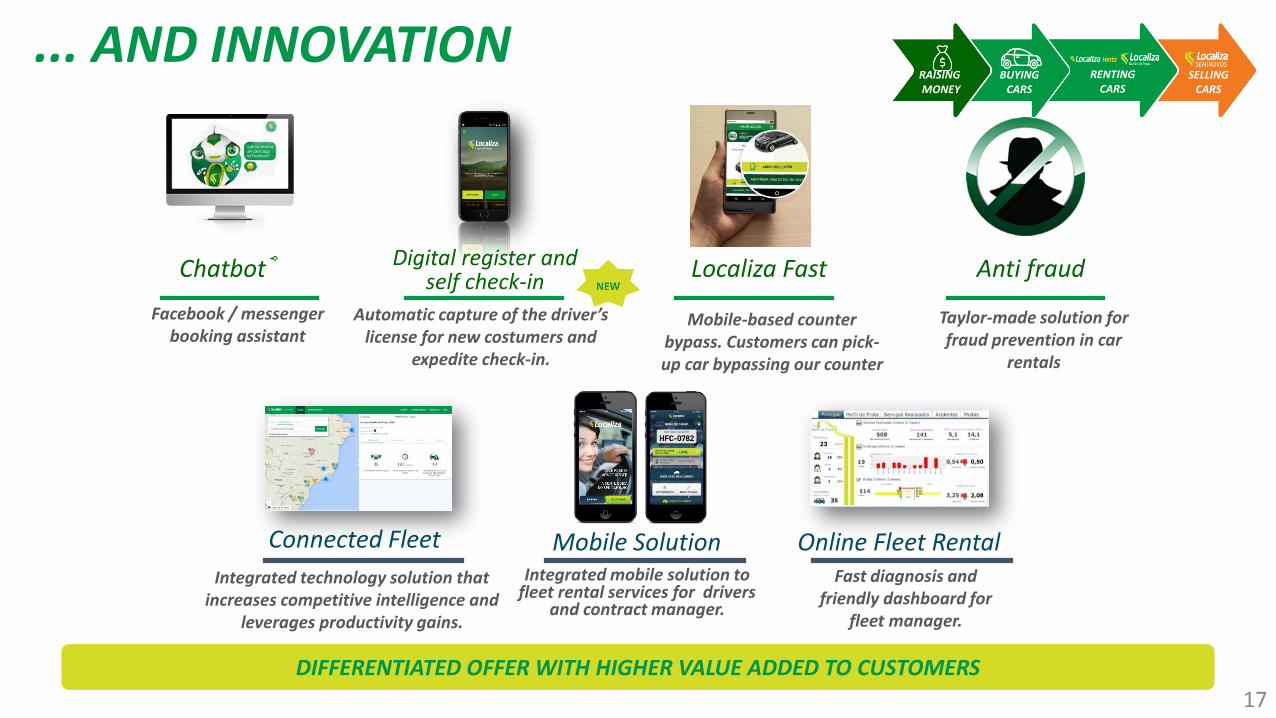
Anti fraudLocaliza FastChatbot® Digital register and self check-in
Taylor-made solution for fraud prevention in car
rentals
Mobile-based counterbypass. Customers can pick-up car bypassing our counter
Facebook / messengerbooking assistant
Automatic capture of the driver’s license for new costumers and
expedite check-in.
Connected Fleet Mobile SolutionIntegrated mobile solution to
fleet rental services for drivers and contract manager.
Online Fleet RentalFast diagnosis and
friendly dashboard for fleet manager.
Integrated technology solution that increases competitive intelligence and
leverages productivity gains.
RAISING MONEY
BUYINGCARS
SELLINGCARS
RENTINGCARS
... AND INNOVATION
DIFFERENTIATED OFFER WITH HIGHER VALUE ADDED TO CUSTOMERS
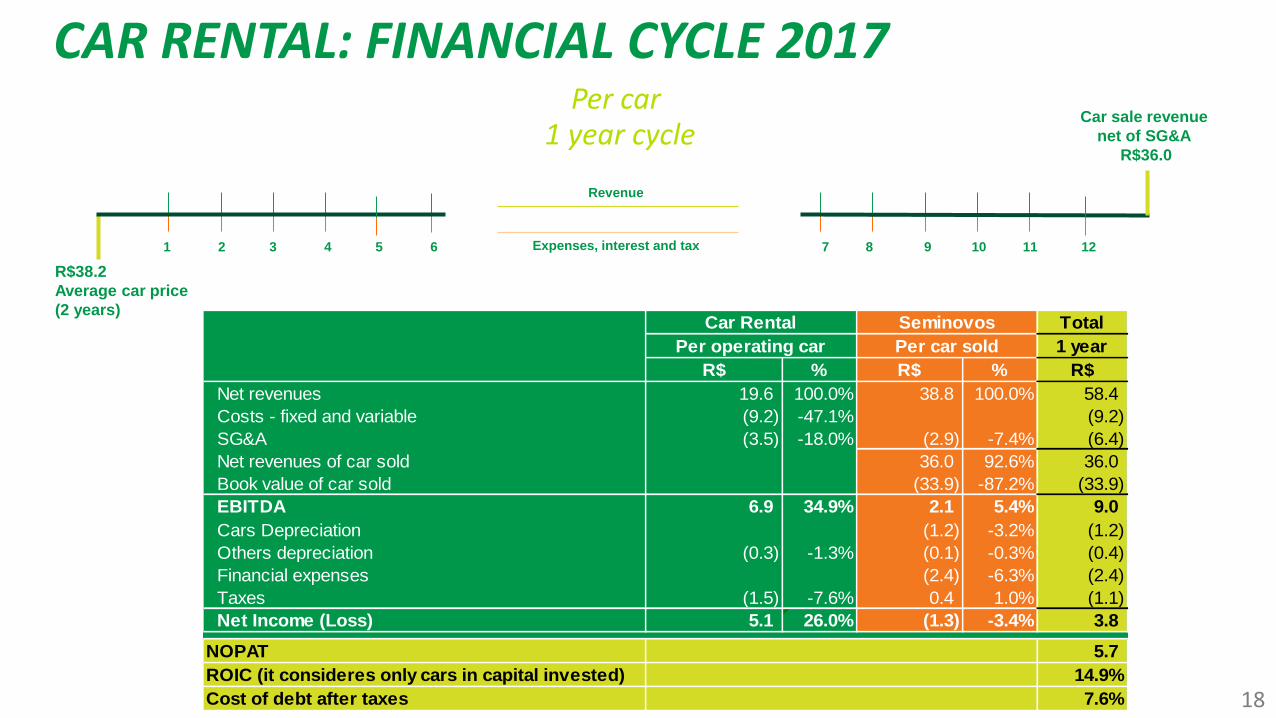
R$38.2
Average car price
(2 years)
Car sale revenue
net of SG&A
R$36.01 year cycle
1 2 3 4 5 6 7 8 9 10 11 12Expenses, interest and tax
Revenue
CAR RENTAL: FINANCIAL CYCLE 2017Per car
18
Total
1 year
R$ % R$ % R$
Net revenues 19.6 100.0% 38.8 100.0% 58.4
Costs - fixed and variable (9.2) -47.1% (9.2)
SG&A (3.5) -18.0% (2.9) -7.4% (6.4)
Net revenues of car sold 36.0 92.6% 36.0
Book value of car sold (33.9) -87.2% (33.9)
EBITDA 6.9 34.9% 2.1 5.4% 9.0
Cars Depreciation (1.2) -3.2% (1.2)
Others depreciation (0.3) -1.3% (0.1) -0.3% (0.4)
Financial expenses (2.4) -6.3% (2.4)
Taxes (1.5) -7.6% 0.4 1.0% (1.1)
Net Income (Loss) 5.1 26.0% (1.3) -3.4% 3.8
NOPAT 5.7
ROIC (it consideres only cars in capital invested) 14.9%
Cost of debt after taxes 7.6%
Car Rental Seminovos
Per car soldPer operating car
1 2 3 4 5 6 31 32 33 34 35 36Expenses, interest and tax
Revenue
Car sale revenue
net of SG&A
R$31.8
R$43.1
Average car price
(3 years)
3 year cycle
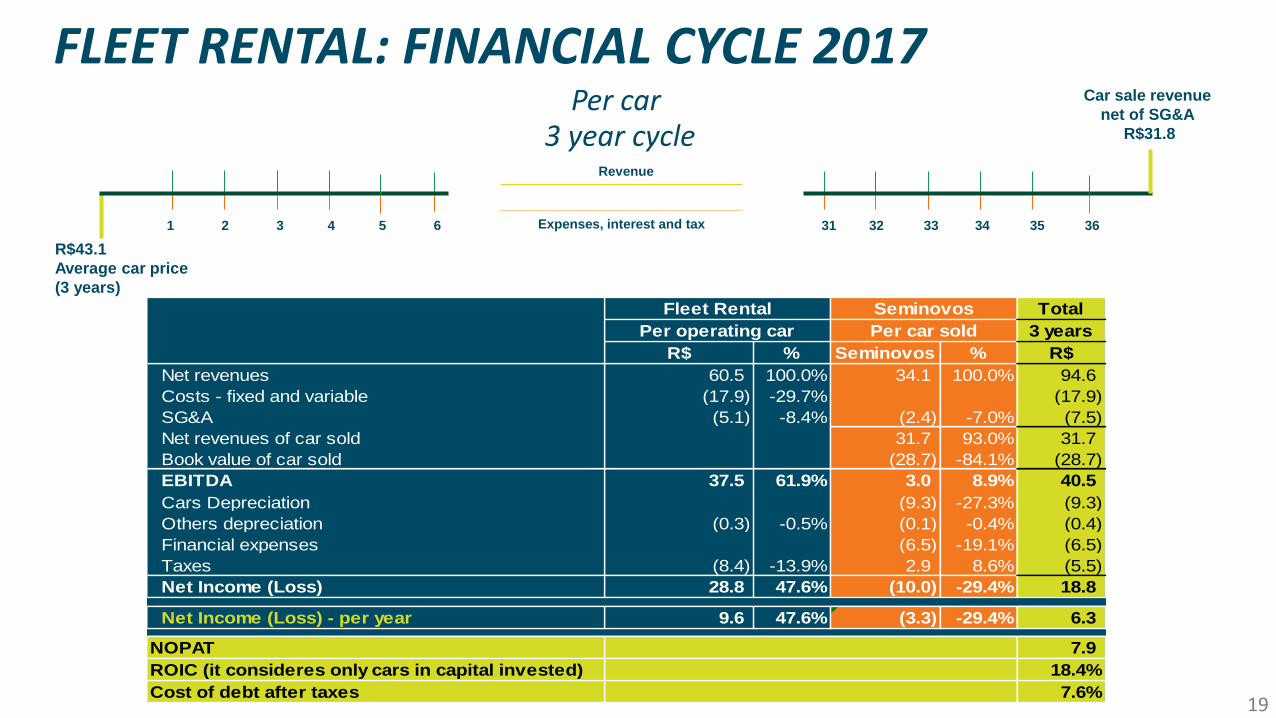
FLEET RENTAL: FINANCIAL CYCLE 2017Per car
19
Total
3 years
R$ % Seminovos % R$
Net revenues 60.5 100.0% 34.1 100.0% 94.6
Costs - fixed and variable (17.9) -29.7% (17.9)
SG&A (5.1) -8.4% (2.4) -7.0% (7.5)
Net revenues of car sold 31.7 93.0% 31.7
Book value of car sold (28.7) -84.1% (28.7)
EBITDA 37.5 61.9% 3.0 8.9% 40.5
Cars Depreciation (9.3) -27.3% (9.3)
Others depreciation (0.3) -0.5% (0.1) -0.4% (0.4)
Financial expenses (6.5) -19.1% (6.5)
Taxes (8.4) -13.9% 2.9 8.6% (5.5)
Net Income (Loss) 28.8 47.6% (10.0) -29.4% 18.8
Net Income (Loss) - per year 9.6 47.6% (3.3) -29.4% 6.3
NOPAT 7.9
ROIC (it consideres only cars in capital invested) 18.4%
Cost of debt after taxes 7.6%
Per operating car
Fleet Rental Seminovos
Per car sold
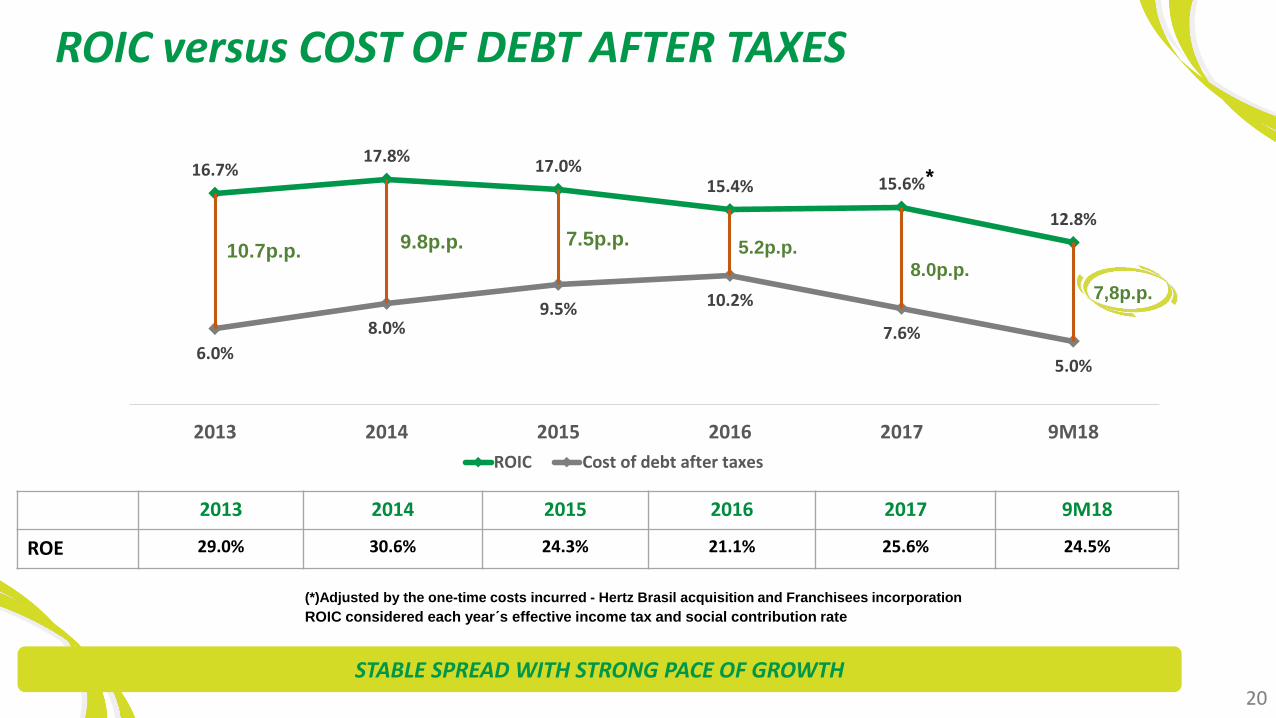
ROIC versus COST OF DEBT AFTER TAXES
ROIC considered each year´s effective income tax and social contribution rate
(*)Adjusted by the one-time costs incurred - Hertz Brasil acquisition and Franchisees incorporation
2013 2014 2015 2016 2017 9M18
ROE 29.0% 30.6% 24.3% 21.1% 25.6% 24.5%
20
16.7%17.8%
17.0%15.4% 15.6%
12.8%
6.0%
8.0%9.5% 10.2%
7.6%
5.0%
2013 2014 2015 2016 2017 9M18
ROIC Cost of debt after taxes
9.8p.p.10.7p.p.7.5p.p. 5.2p.p.
8.0p.p.
*
7,8p.p.
STABLE SPREAD WITH STRONG PACE OF GROWTH

AGENDACOMPANY OVERVIEW1
MAIN BUSINESS DIVISIONS3
FINANCIALS4
APPENDIX: EARNINGS RELEASE 3Q185
CAR RENTAL
FLEET RENTAL
SEMINOVOS
1
2
3
21
COMPETITIVE ADVANTAGES2
22
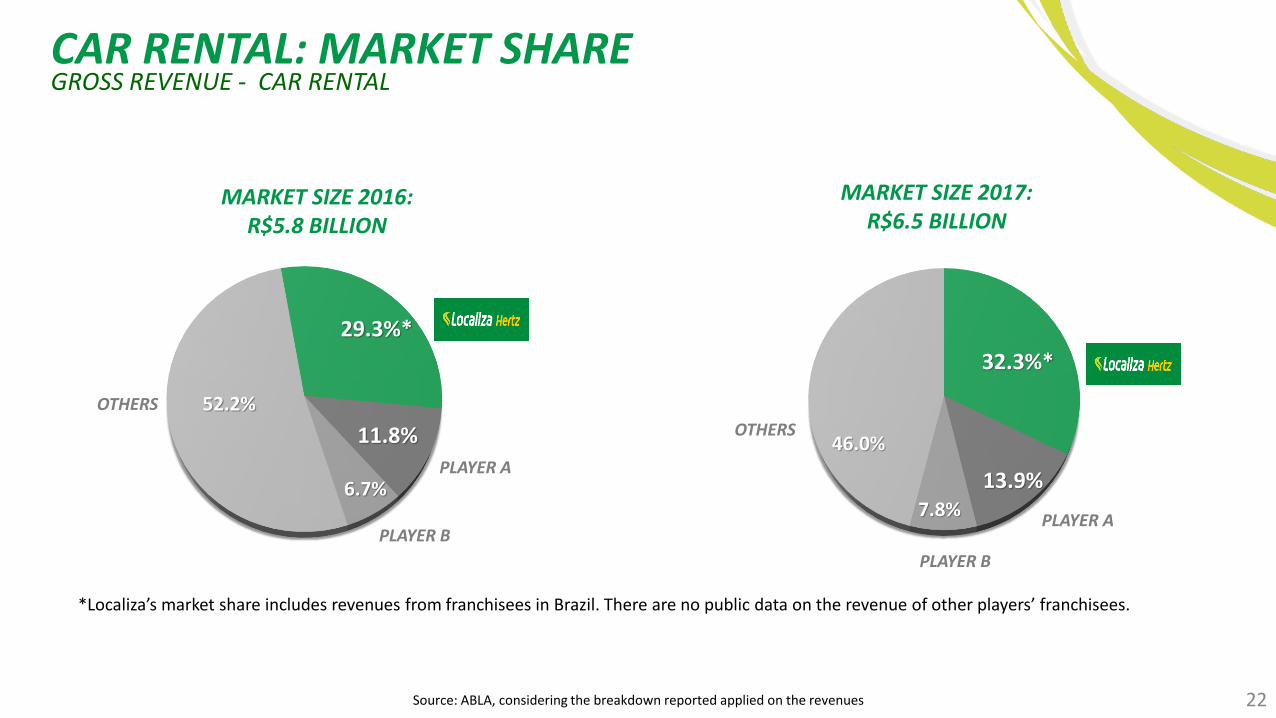
MARKET SIZE 2016:R$5.8 BILLION
OTHERS
MARKET SIZE 2017:R$6.5 BILLION
CAR RENTAL: MARKET SHAREGROSS REVENUE - CAR RENTAL
Source: ABLA, considering the breakdown reported applied on the revenues
OTHERS
29.3%*
11.8%
6.7%
52.2%
32.3%*
13.9%7.8%
46.0%
PLAYER B
PLAYER A
PLAYER B
PLAYER A
*Localiza’s market share includes revenues from franchisees in Brazil. There are no public data on the revenue of other players’ franchisees.
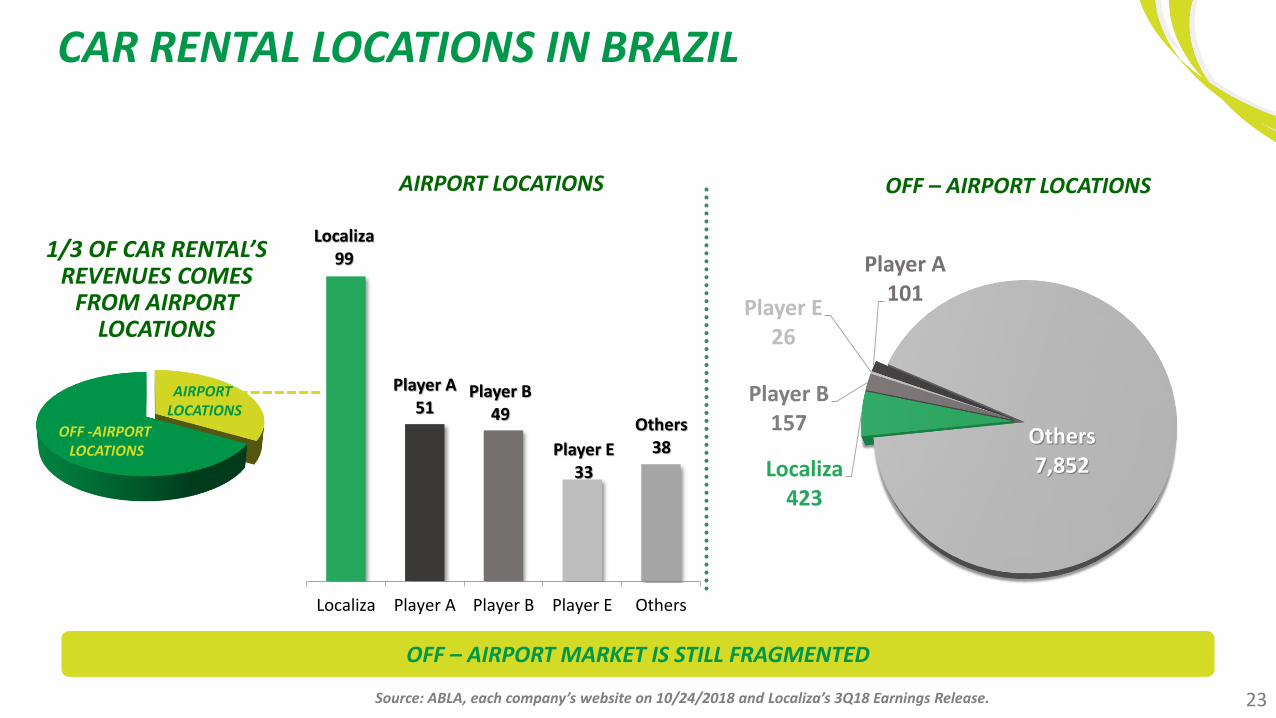
CAR RENTAL LOCATIONS IN BRAZIL
AIRPORT LOCATIONS OFF – AIRPORT LOCATIONS
Localiza423
Player B157
Player E26
Player A101
Others7,852
23Source: ABLA, each company’s website on 10/24/2018 and Localiza’s 3Q18 Earnings Release..
1/3 OF CAR RENTAL’S REVENUES COMES
FROM AIRPORT LOCATIONS
OFF -AIRPORT LOCATIONS
AIRPORT LOCATIONS
OFF – AIRPORT MARKET IS STILL FRAGMENTED
Localiza99
Player A51
Player B49
Player E33
Others38
Localiza Player A Player B Player E Others
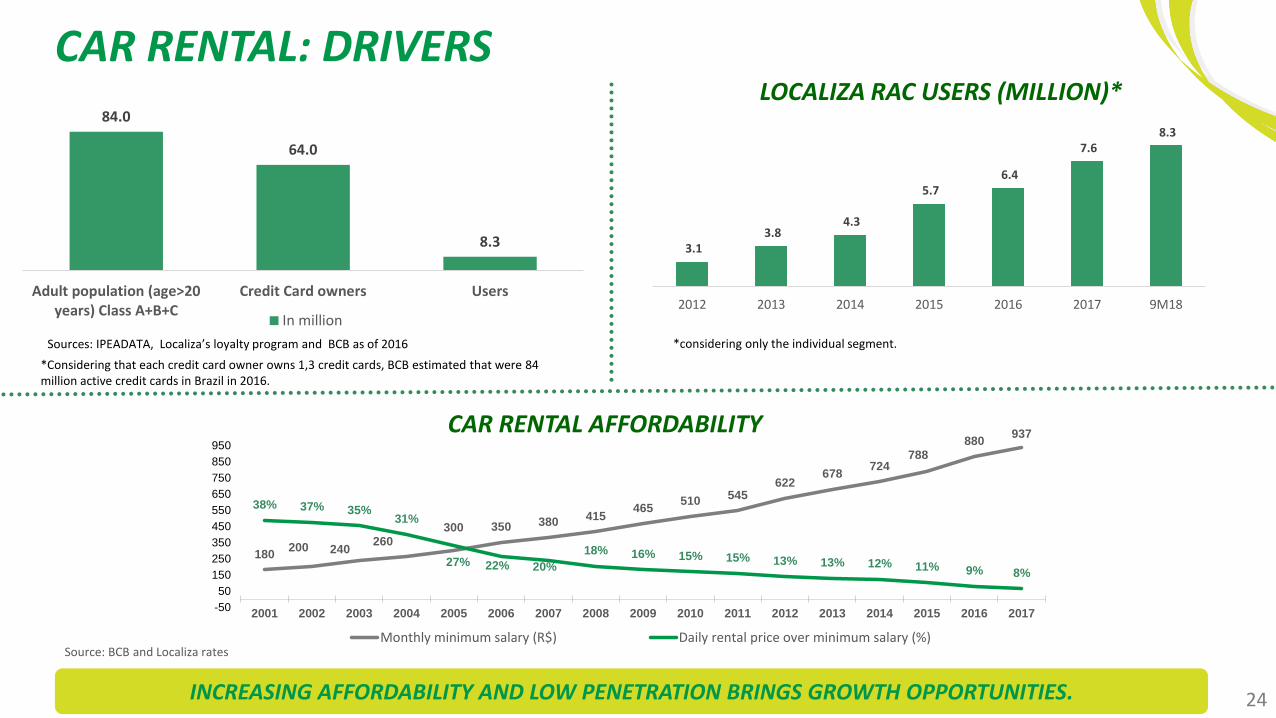
180200 240
260300 350 380
415465
510545
622678
724788
880937
38% 37% 35%31%
27% 22% 20%
18% 16% 15% 15% 13% 13% 12% 11% 9% 8%
-50
50
150
250
350
450
550
650
750
850
950
2001 2002 2003 2004 2005 2006 2007 2008 2009 2010 2011 2012 2013 2014 2015 2016 2017
Monthly minimum salary (R$) Daily rental price over minimum salary (%)
CAR RENTAL AFFORDABILITY
Source: BCB and Localiza rates
Sources: IPEADATA, Localiza’s loyalty program and BCB as of 2016
*Considering that each credit card owner owns 1,3 credit cards, BCB estimated that were 84 million active credit cards in Brazil in 2016.
CAR RENTAL: DRIVERS
24INCREASING AFFORDABILITY AND LOW PENETRATION BRINGS GROWTH OPPORTUNITIES.
3.1 3.8
4.3
5.7 6.4
7.6 8.3
2012 2013 2014 2015 2016 2017 9M18
LOCALIZA RAC USERS (MILLION)*84.0
64.0
8.3
Adult population (age>20years) Class A+B+C
Credit Card owners Users
In million
*considering only the individual segment.
CAR RENTAL: DRIVERS
25
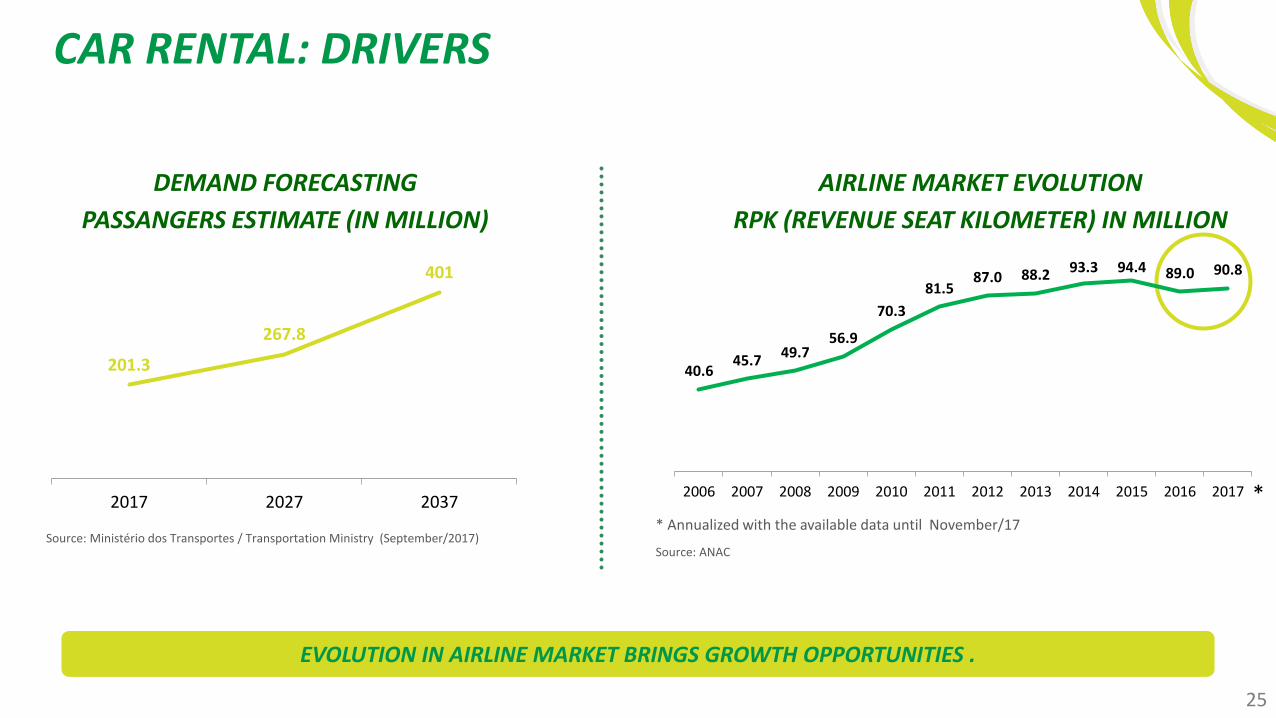
*
40.645.7
49.756.9
70.3
81.587.0 88.2 93.3 94.4 89.0 90.8
2006 2007 2008 2009 2010 2011 2012 2013 2014 2015 2016 2017
AIRLINE MARKET EVOLUTION
RPK (REVENUE SEAT KILOMETER) IN MILLION
* Annualized with the available data until November/17
Source: ANAC
DEMAND FORECASTING
PASSANGERS ESTIMATE (IN MILLION)
Source: Ministério dos Transportes / Transportation Ministry (September/2017)
EVOLUTION IN AIRLINE MARKET BRINGS GROWTH OPPORTUNITIES .
201.3
267.8
401
2017 2027 2037

AGENDACOMPANY OVERVIEW1
MAIN BUSINESS DIVISIONS3
FINANCIALS4
APPENDIX: EARNINGS RELEASE 3Q185
CAR RENTAL
FLEET RENTAL
SEMINOVOS
1
2
3
26
COMPETITIVE ADVANTAGES2
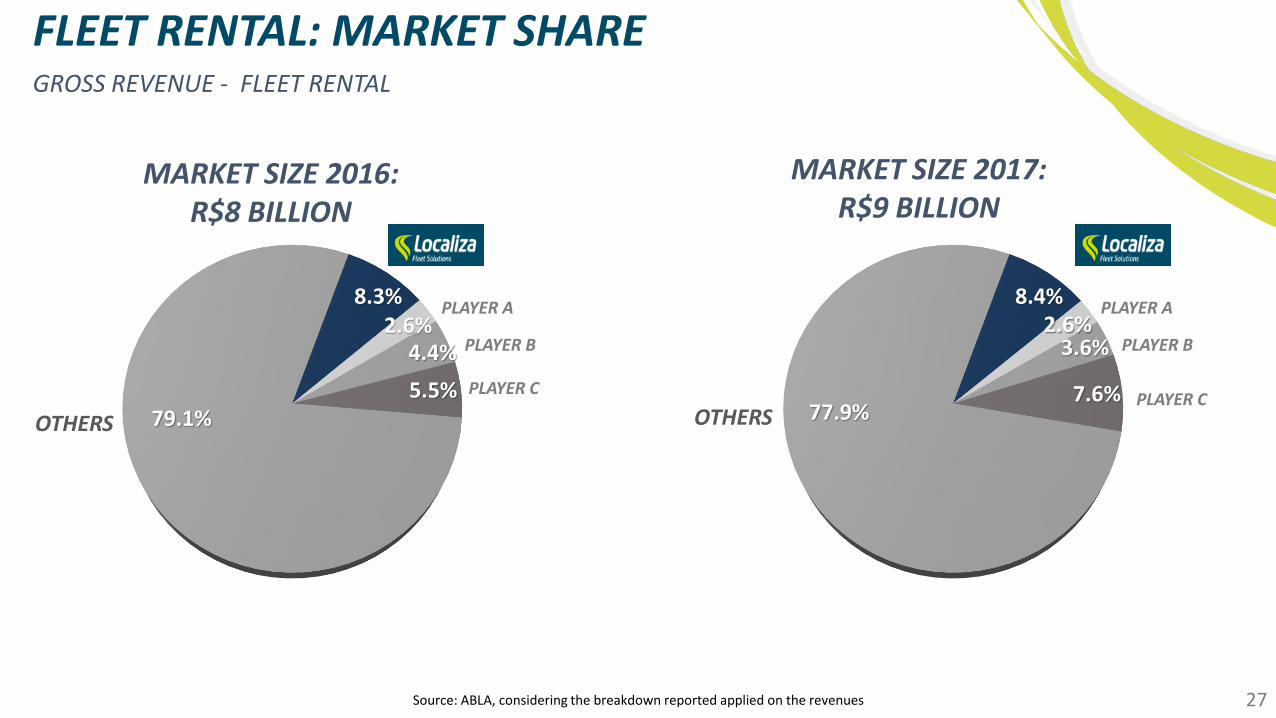
FLEET RENTAL: MARKET SHAREGROSS REVENUE - FLEET RENTAL
27Source: ABLA, considering the breakdown reported applied on the revenues
MARKET SIZE 2017:R$9 BILLION
MARKET SIZE 2016:R$8 BILLION
8.4%2.6%
3.6%
7.6%77.9%OTHERS
PLAYER B
PLAYER C
PLAYER A 8.3%
2.6%4.4%
5.5%79.1%OTHERS
PLAYER B
PLAYER C
PLAYER A
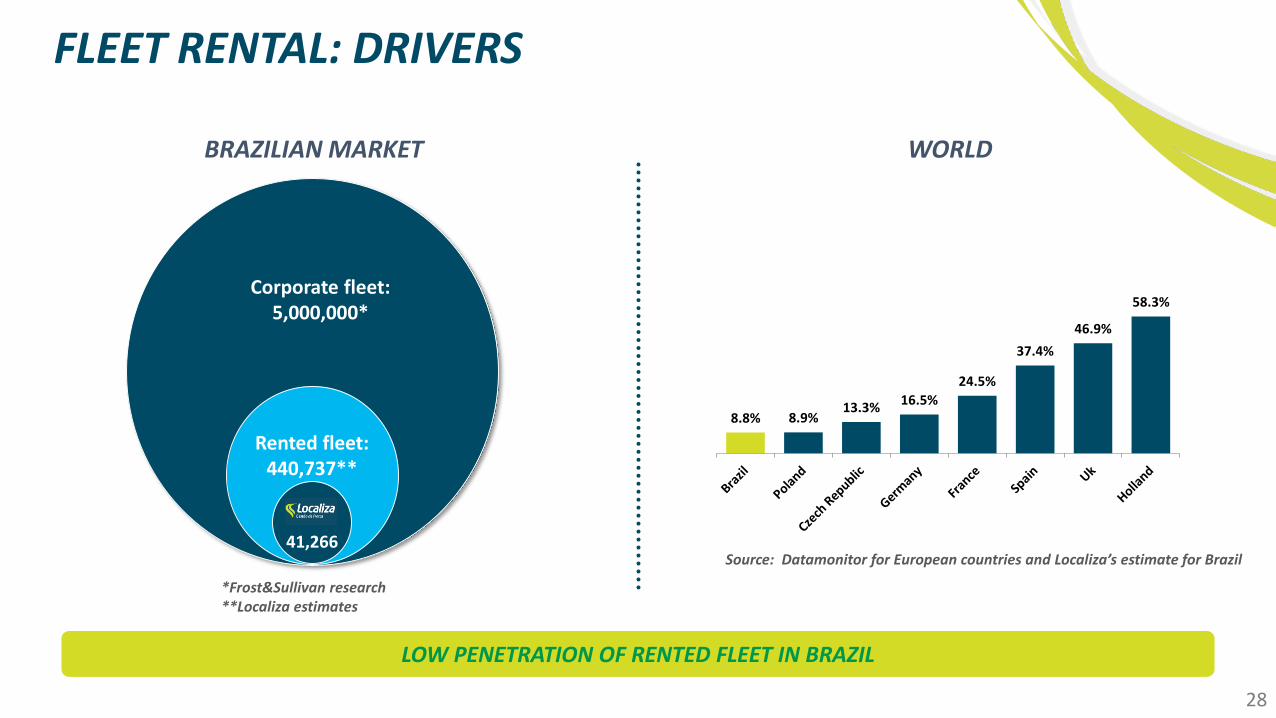
FLEET RENTAL: DRIVERS
28
Corporate fleet:5,000,000*
Rented fleet:440,737**
41,266
BRAZILIAN MARKET
*Frost&Sullivan research **Localiza estimates
WORLD
8.8% 8.9%13.3%
16.5%
24.5%
37.4%
46.9%
58.3%
Source: Datamonitor for European countries and Localiza’s estimate for Brazil
LOW PENETRATION OF RENTED FLEET IN BRAZIL

AGENDACOMPANY OVERVIEW1
MAIN BUSINESS DIVISIONS3
FINANCIALS4
APPENDIX: EARNINGS RELEASE 3Q185
CAR RENTAL
FLEET RENTAL
SEMINOVOS
1
2
3
29
COMPETITIVE ADVANTAGES2
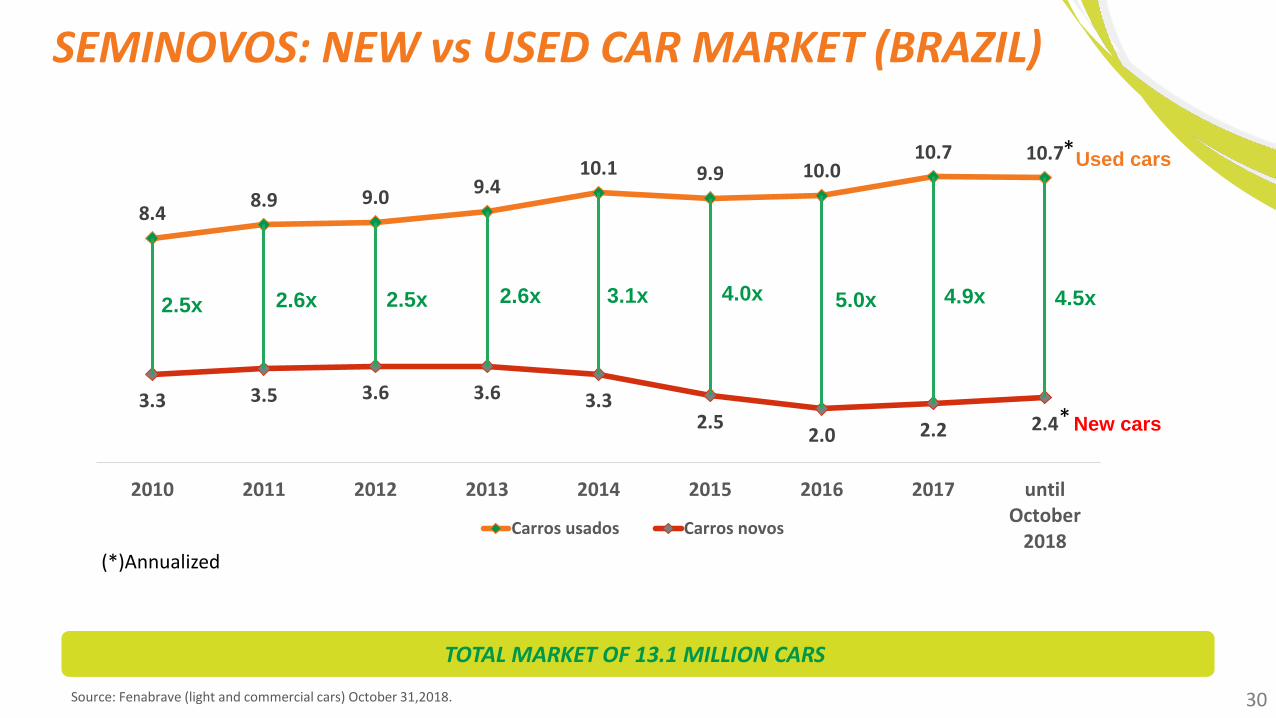
SEMINOVOS: NEW vs USED CAR MARKET (BRAZIL)
Source: Fenabrave (light and commercial cars) October 31,2018. 30
New cars
Used cars
TOTAL MARKET OF 13.1 MILLION CARS.
8.48.9 9.0
9.410.1 9.9 10.0
10.7 10.7
3.3 3.5 3.6 3.6 3.32.5
2.0 2.2 2.4
2010 2011 2012 2013 2014 2015 2016 2017 untilOctober
2018Carros usados Carros novos
*
*
(*)Annualized
2.5x 2.5x2.6x 2.6x 3.1x 4.0x 5.0x 4.9x 4.5x
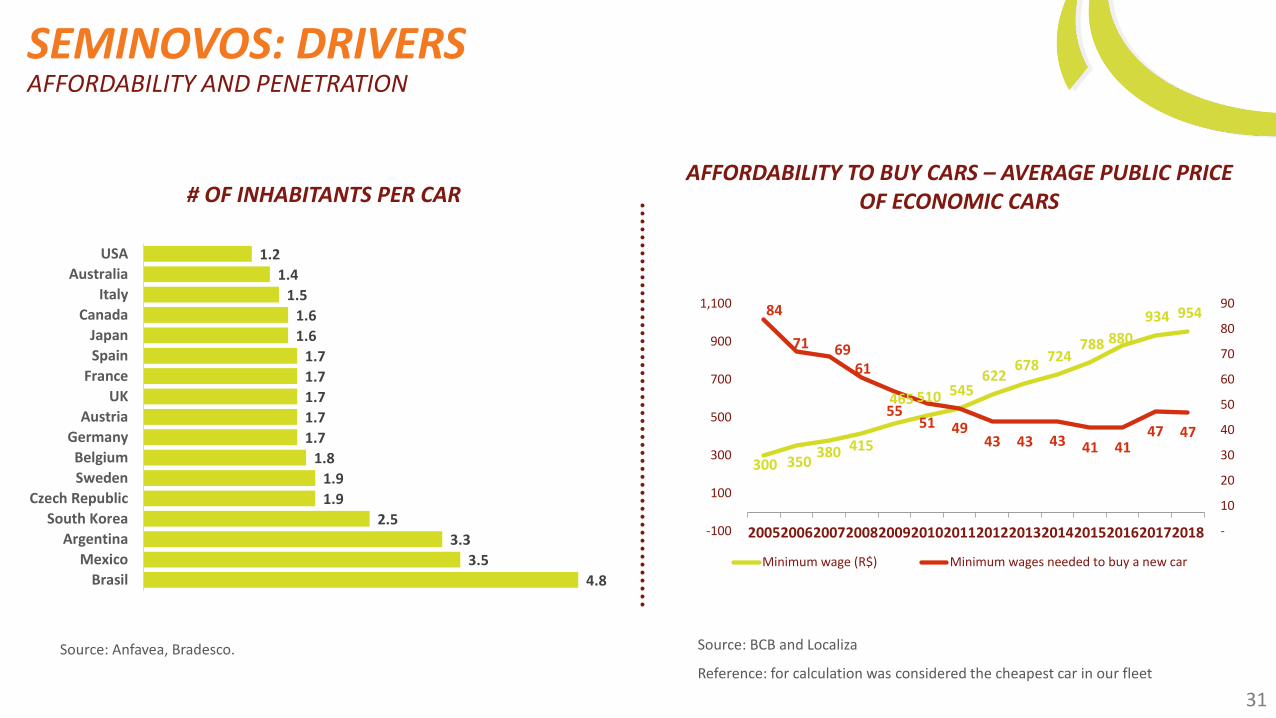
SEMINOVOS: DRIVERS
# OF INHABITANTS PER CARAFFORDABILITY TO BUY CARS – AVERAGE PUBLIC PRICE
OF ECONOMIC CARS
AFFORDABILITY AND PENETRATION
Source: Anfavea, Bradesco. Source: BCB and Localiza
Reference: for calculation was considered the cheapest car in our fleet
31
300 350 380 415
465 510 545 622
678 724
788 880
934 954 84
71 6961
5551 49
43 43 43 41 4147 47
-
10
20
30
40
50
60
70
80
90
-100
100
300
500
700
900
1,100
20052006200720082009201020112012201320142015201620172018
Minimum wage (R$) Minimum wages needed to buy a new car
4.8
3.5
3.3
2.5
1.9
1.9
1.8
1.7
1.7
1.7
1.7
1.7
1.6
1.6
1.5
1.4
1.2
Brasil
Mexico
Argentina
South Korea
Czech Republic
Sweden
Belgium
Germany
Austria
UK
France
Spain
Japan
Canada
Italy
Australia
USA
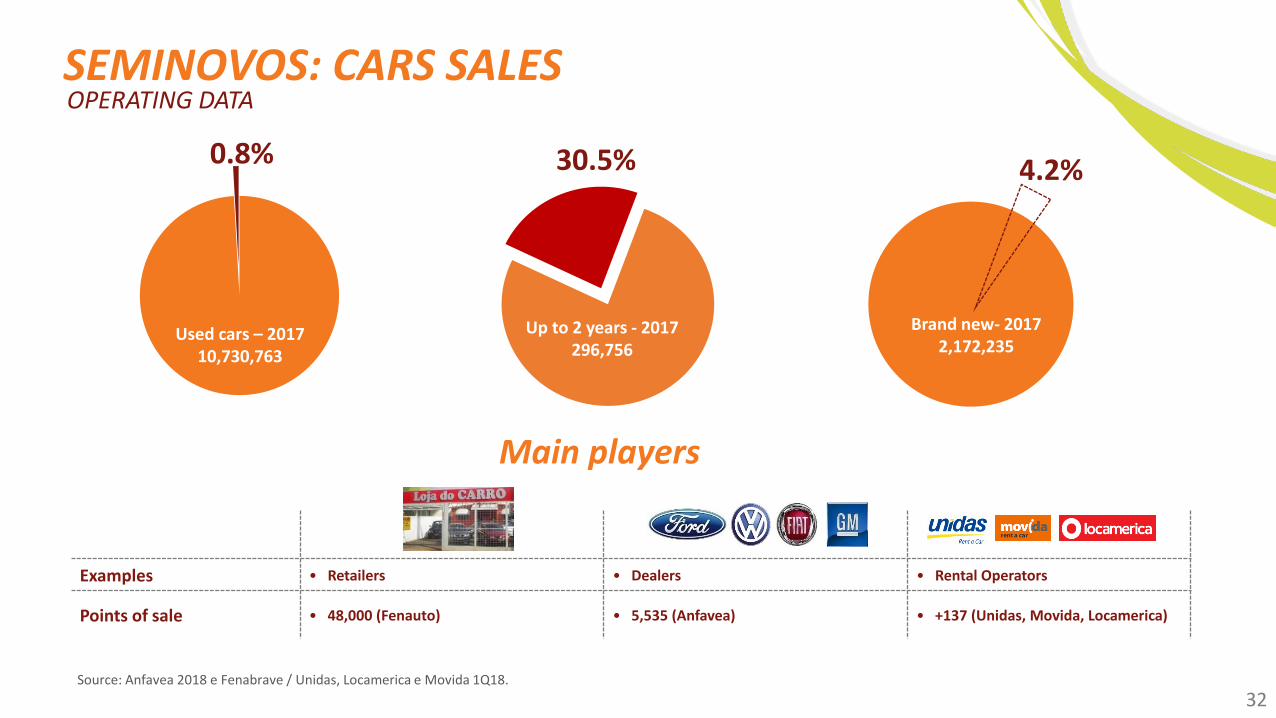
30.5%
Up to 2 years - 2017296,756
SEMINOVOS: CARS SALESOPERATING DATA
0.8%
Used cars – 201710,730,763
4.2%
Main players
Examples • Retailers • Dealers • Rental Operators
Points of sale • 48,000 (Fenauto) • 5,535 (Anfavea) • +137 (Unidas, Movida, Locamerica)
Source: Anfavea 2018 e Fenabrave / Unidas, Locamerica e Movida 1Q18.
32
Brand new- 20172,172,235

AGENDACOMPANY OVERVIEW1
MAIN BUSINESS DIVISIONS3
FINANCIALS4
APPENDIX: EARNINGS RELEASE 3Q185
CAR RENTAL
FLEET RENTAL
SEMINOVOS
1
2
3
33
COMPETITIVE ADVANTAGES2
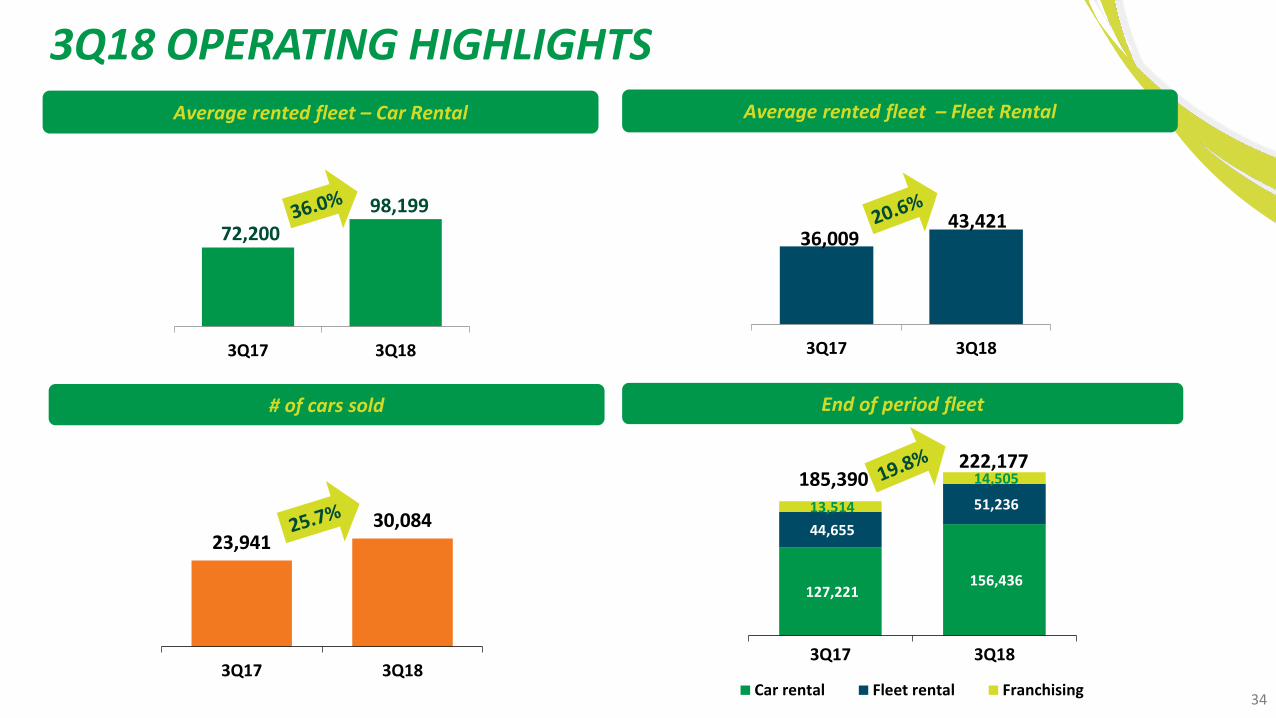
34
# of cars sold
Average rented fleet – Car Rental
End of period fleet
Average rented fleet – Fleet Rental
3Q18 OPERATING HIGHLIGHTS
127,221 156,436
44,655
51,236 13,514
14,505 185,390 222,177
3Q17 3Q18
Car rental Fleet rental Franchising
23,941 30,084
3Q17 3Q18
72,200
98,199
3Q17 3Q18
36,009 43,421
3Q17 3Q18
35
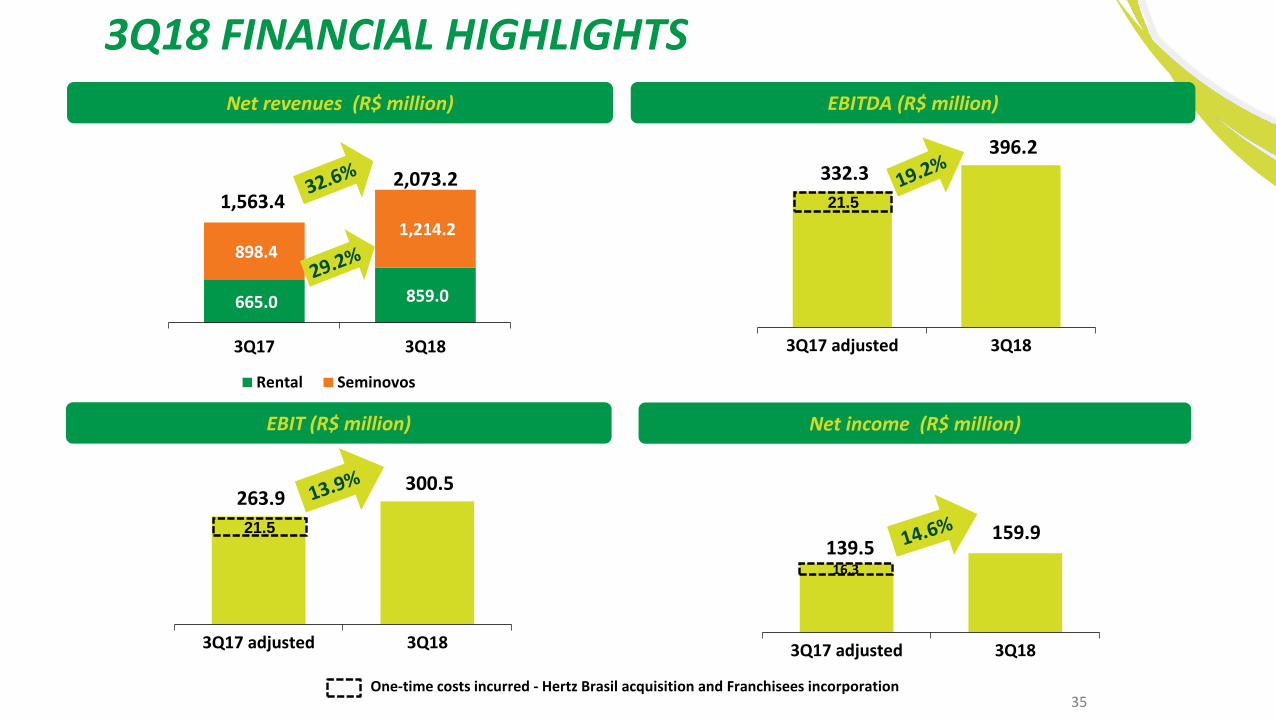
Net revenues (R$ million)
Net income (R$ million)EBIT (R$ million)
EBITDA (R$ million)
3Q18 FINANCIAL HIGHLIGHTS
332.3 396.2
3Q17 adjusted 3Q18
139.5 159.9
3Q17 adjusted 3Q18
263.9 300.5
3Q17 adjusted 3Q18
+38,0%4T/4T
+38,6%4T/4T665.0 859.0
898.4 1,214.2
1,563.4 2,073.2
3Q17 3Q18
Rental Seminovos
21.5
21.5
16.3
One-time costs incurred - Hertz Brasil acquisition and Franchisees incorporation
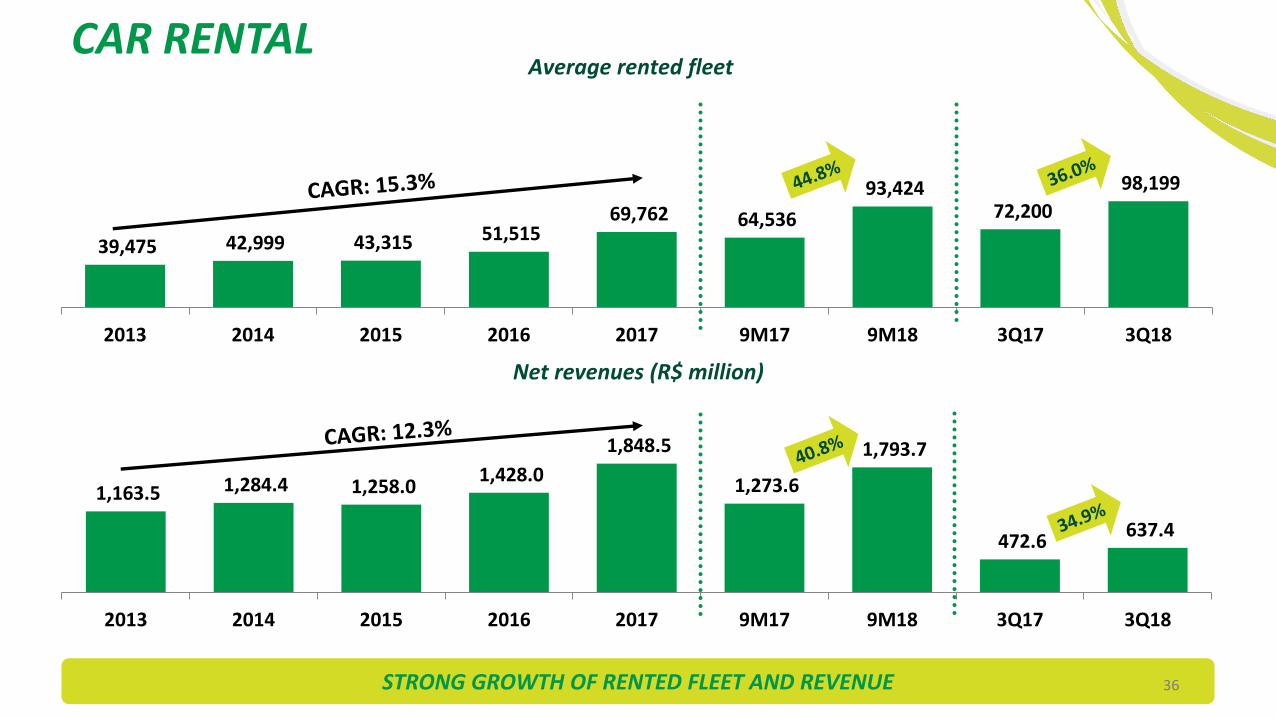
CAR RENTAL
1,163.5 1,284.4 1,258.0 1,428.0
1,848.5
1,273.6
1,793.7
472.6 637.4
2013 2014 2015 2016 2017 9M17 9M18 3Q17 3Q18
Average rented fleet
STRONG GROWTH OF RENTED FLEET AND REVENUE
39,475 42,999 43,315 51,515 69,762 64,536
93,424 72,200
98,199
2013 2014 2015 2016 2017 9M17 9M18 3Q17 3Q18
Net revenues (R$ million)
36
37
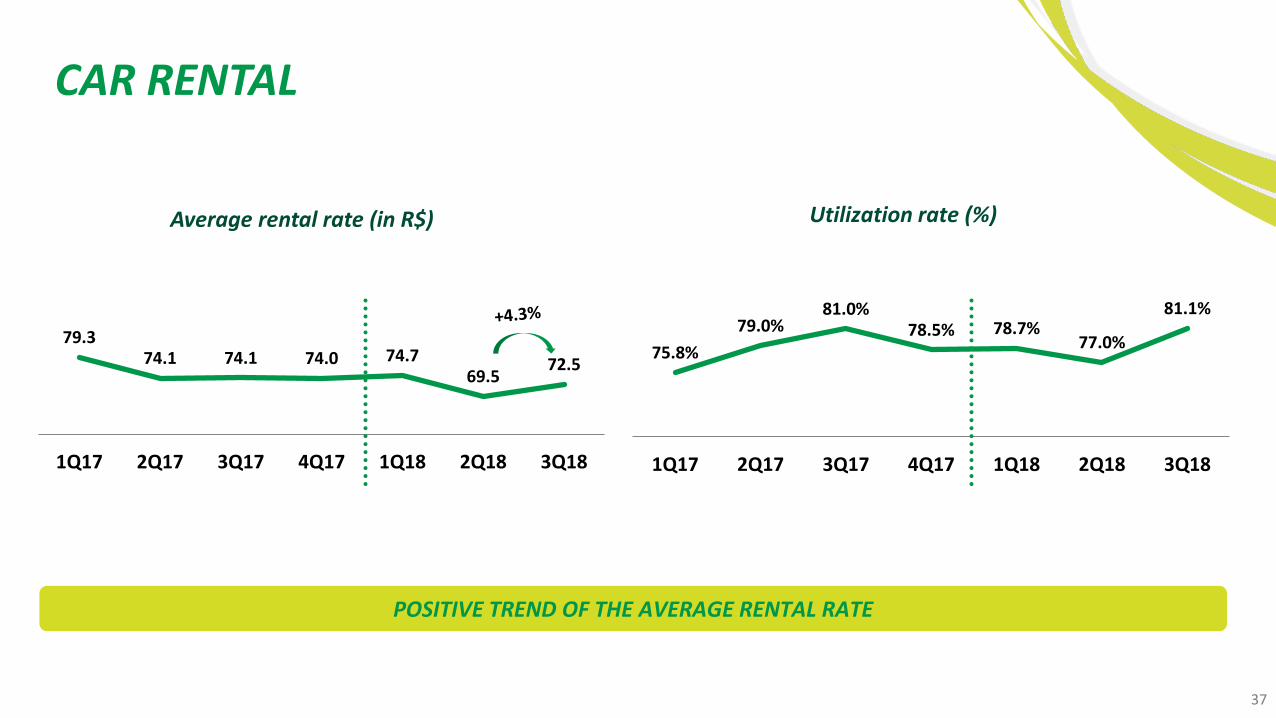
CAR RENTAL
Average rental rate (in R$) Utilization rate (%)
POSITIVE TREND OF THE AVERAGE RENTAL RATE
79.374.1 74.1 74.0 74.7
69.572.5
1Q17 2Q17 3Q17 4Q17 1Q18 2Q18 3Q18
75.8%
79.0%81.0%
78.5% 78.7%77.0%
81.1%
1Q17 2Q17 3Q17 4Q17 1Q18 2Q18 3Q18
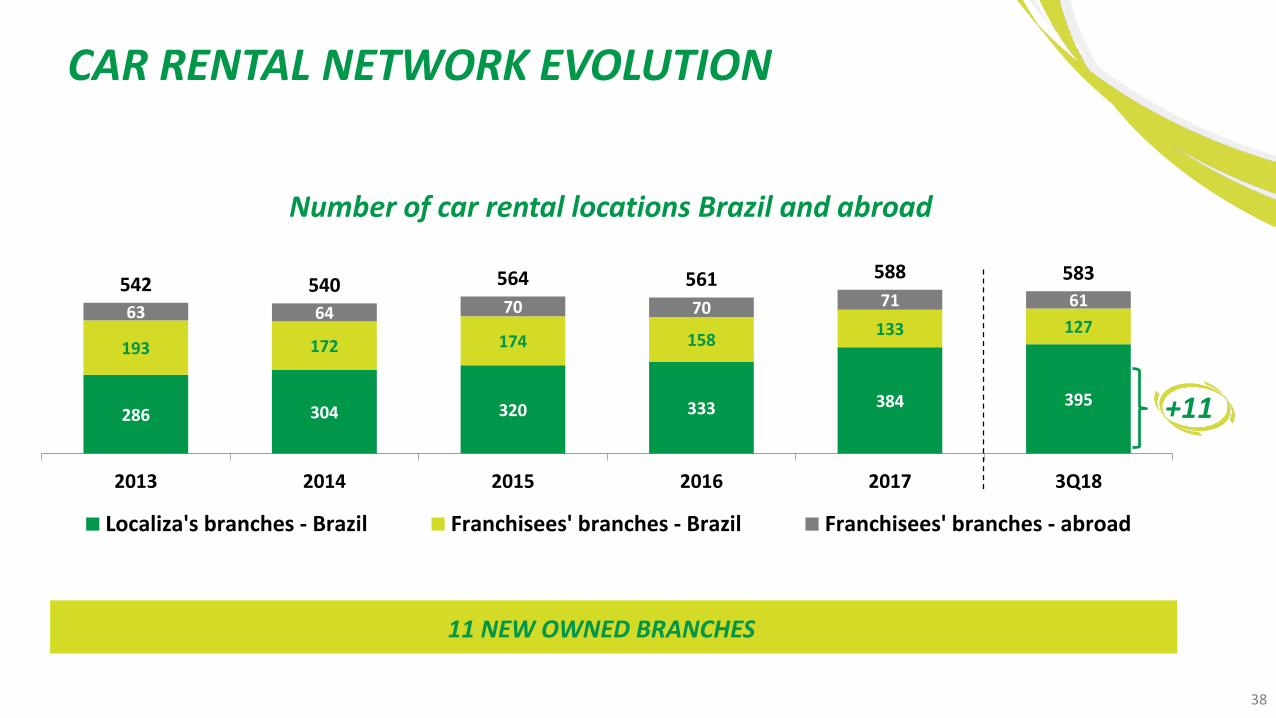
CAR RENTAL NETWORK EVOLUTION
Number of car rental locations Brazil and abroad
286 304 320 333 384 395
193 172 174 158133 127
63 64 70 70 71 61542 540 564 561 588 583
2013 2014 2015 2016 2017 3Q18
Localiza's branches - Brazil Franchisees' branches - Brazil Franchisees' branches - abroad
+11
11 NEW OWNED BRANCHES
38
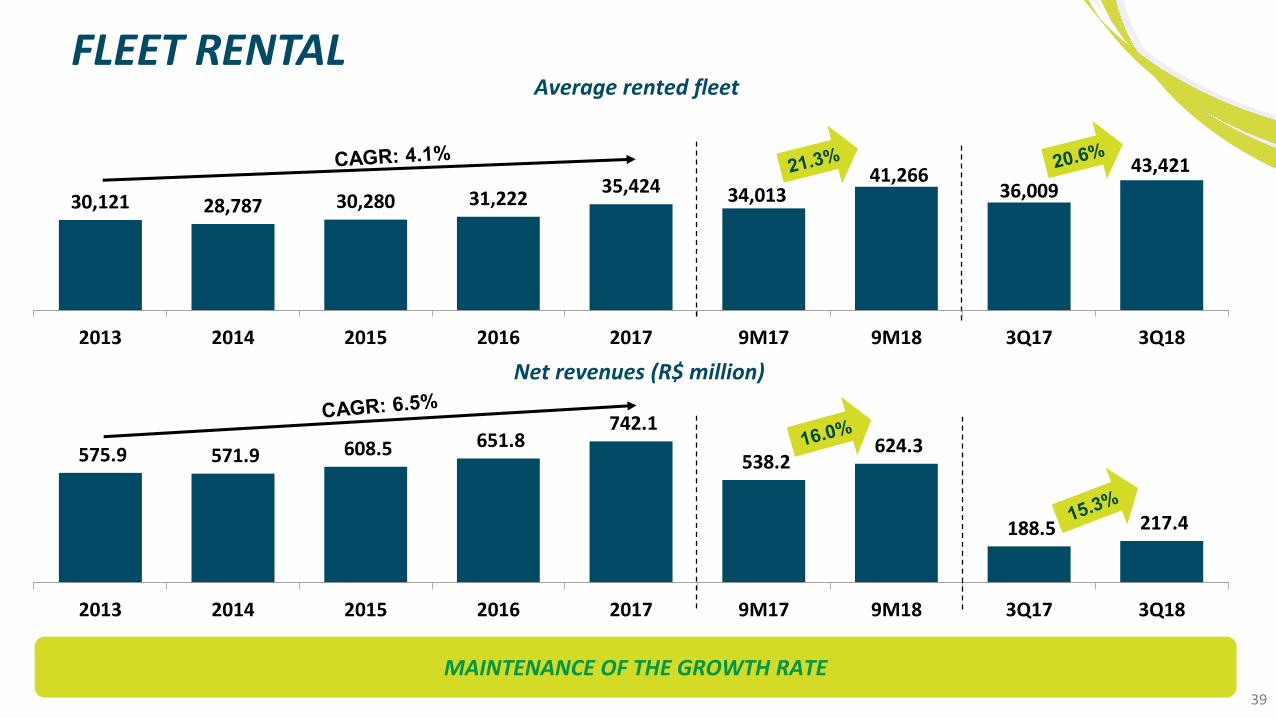
FLEET RENTAL Average rented fleet
MAINTENANCE OF THE GROWTH RATE
575.9 571.9 608.5 651.8 742.1
538.2 624.3
188.5 217.4
2013 2014 2015 2016 2017 9M17 9M18 3Q17 3Q18
Net revenues (R$ million)
30,121 28,787 30,280 31,22235,424 34,013
41,26636,009
43,421
-
5,00 0
10,0 00
15,0 00
20,0 00
25,0 00
30,0 00
35,0 00
40,0 00
45,0 00
50,0 00
2013 2014 2015 2016 2017 9M17 9M18 3Q17 3Q18
39
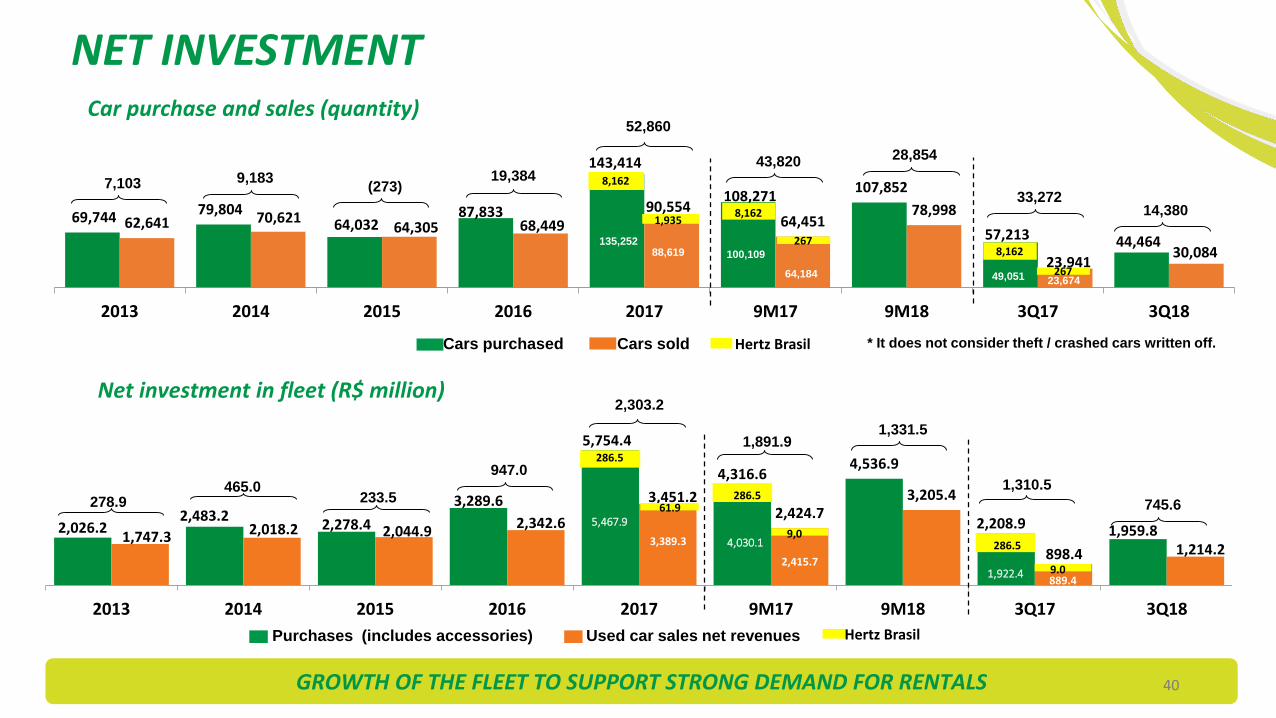
NET INVESTMENT Car purchase and sales (quantity)
GROWTH OF THE FLEET TO SUPPORT STRONG DEMAND FOR RENTALS 40
Net investment in fleet (R$ million)
Cars purchased Cars sold Hertz Brasil
Purchases (includes accessories) Used car sales net revenues Hertz Brasil
69,744 79,804 64,032
87,833
143,414
108,271 107,852
57,213 44,464 62,641 70,621
64,305 68,44990,554
64,45178,998
23,94130,084
2013 2014 2015 2016 2017 9M17 9M18 3Q17 3Q18
7,103 9,183(273)
19,384
88,619
1,935
135,252
8,162
43,820
52,860
33,272
2,026.22,483.2
2,278.4
3,289.6
5,754.4
4,316.64,536.9
2,208.9 1,959.81,747.3 2,018.2 2,044.92,342.6
3,451.22,424.7
3,205.4
898.4 1,214.2
2013 2014 2015 2016 2017 9M17 9M18 3Q17 3Q18
465.0278.9 233.5
947.0
61.95,467.9
286.5
3,389.3
1,891.9
2,303.2
1,310.5
* It does not consider theft / crashed cars written off.
28,854
14,380
1,331.5
745.6
267
8,162
267
8,162
64,18423,67449,051
100,109
9,0
286.5
4,030.1
2,415.79.0
286.5
1,922.4889.4
41
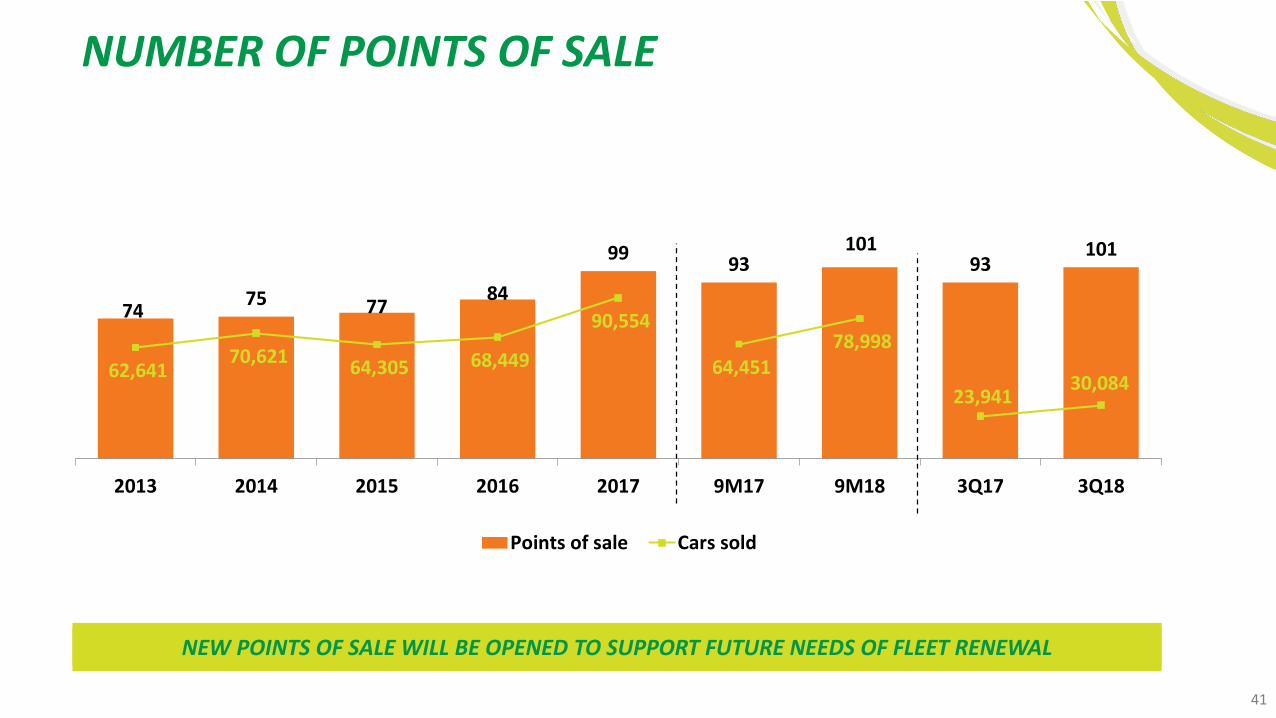
NUMBER OF POINTS OF SALE
7475 77
84
9993
10193
101
62,641 70,621
64,305 68,449
90,554
64,451 78,998
23,941 30,084
-
20,0 00
40,0 00
60,0 00
80,0 00
100 ,000
120 ,000
140 ,000
160 ,000
0
20
40
60
80
100
120
140
2013 2014 2015 2016 2017 9M17 9M18 3Q17 3Q18
Points of sale Cars sold
NEW POINTS OF SALE WILL BE OPENED TO SUPPORT FUTURE NEEDS OF FLEET RENEWAL
42
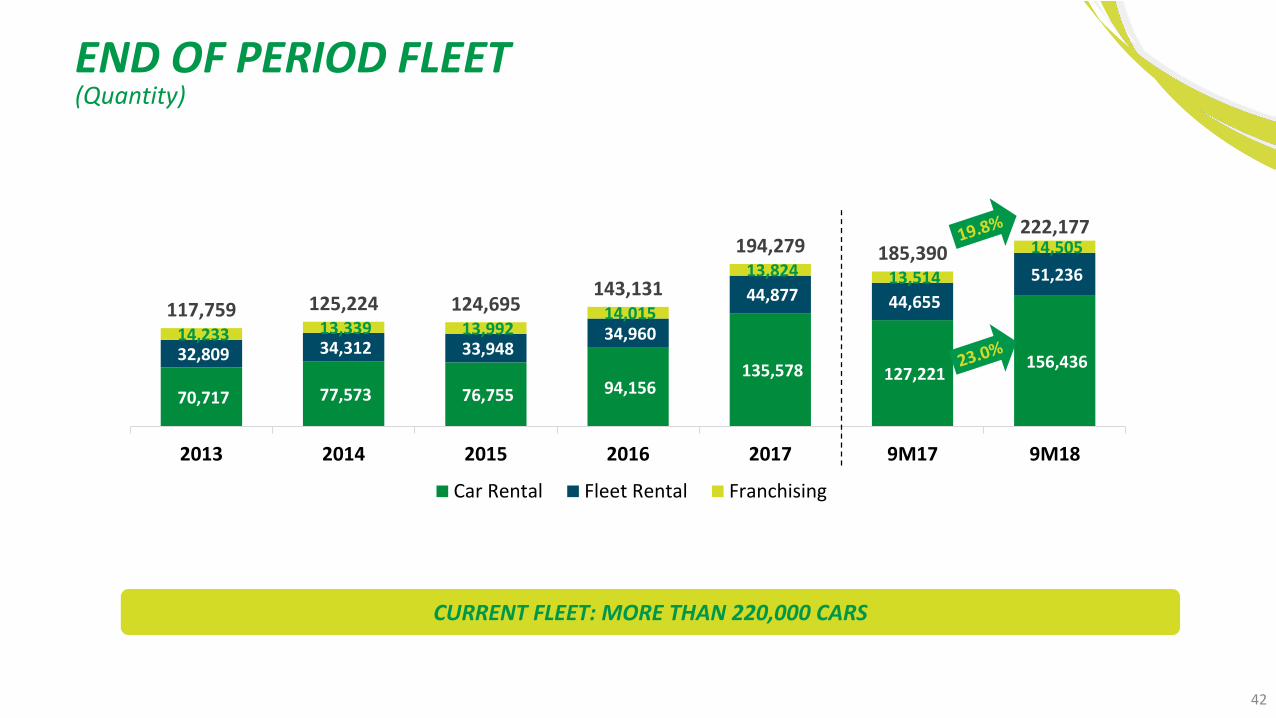
END OF PERIOD FLEET
CURRENT FLEET: MORE THAN 220,000 CARS
(Quantity)
70,717 77,573 76,755 94,156 135,578 127,221
156,436 32,809 34,312 33,948 34,960
44,877 44,655
51,236
14,233 13,339 13,992 14,015
13,824 13,514
14,505
117,759 125,224 124,695143,131
194,279 185,390222,177
2013 2014 2015 2016 2017 9M17 9M18
Car Rental Fleet Rental Franchising
43
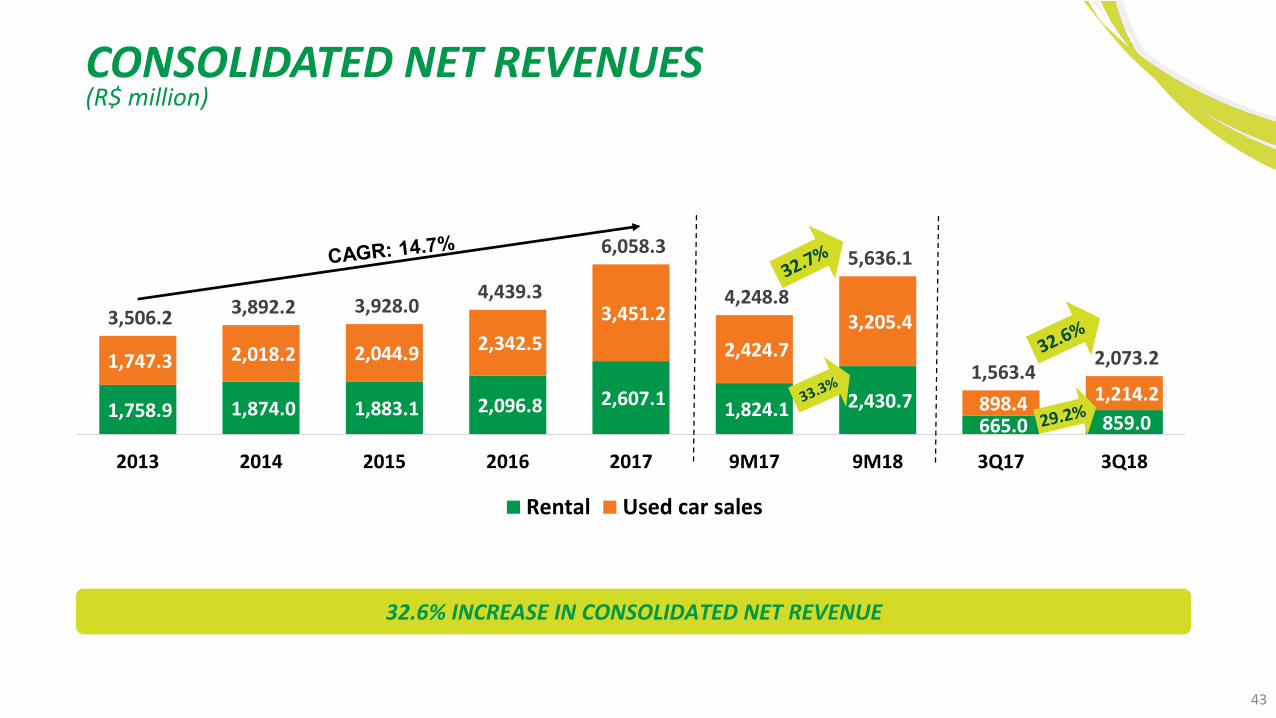
CONSOLIDATED NET REVENUES(R$ million)
32.6% INCREASE IN CONSOLIDATED NET REVENUE
1,758.9 1,874.0 1,883.1 2,096.8 2,607.1 1,824.1 2,430.7
665.0 859.0
1,747.3 2,018.2 2,044.9 2,342.5
3,451.2
2,424.7
3,205.4
898.4 1,214.2
3,506.2 3,892.2 3,928.0
4,439.3
6,058.3
4,248.8
5,636.1
1,563.4 2,073.2
2013 2014 2015 2016 2017 9M17 9M18 3Q17 3Q18
Rental Used car sales
44
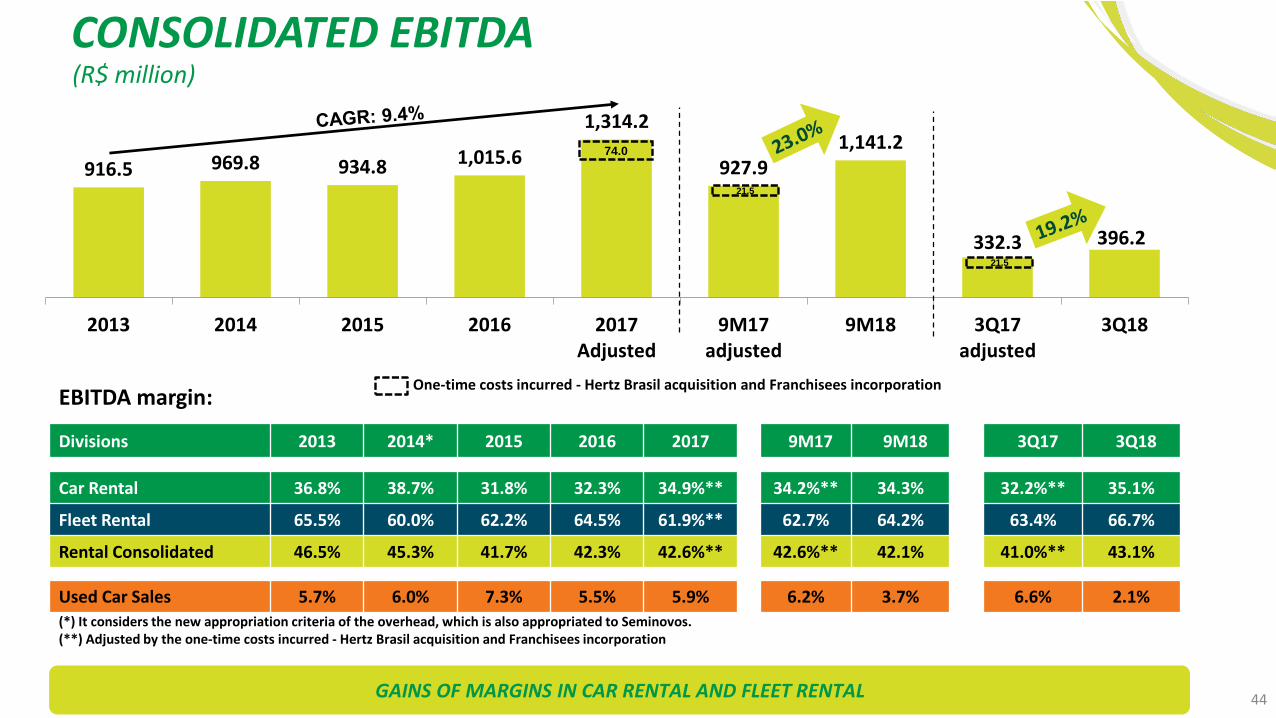
CONSOLIDATED EBITDA(R$ million)
(*) It considers the new appropriation criteria of the overhead, which is also appropriated to Seminovos.(**) Adjusted by the one-time costs incurred - Hertz Brasil acquisition and Franchisees incorporation
Divisions 2013 2014* 2015 2016 2017 9M17 9M18 3Q17 3Q18
Car Rental 36.8% 38.7% 31.8% 32.3% 34.9%** 34.2%** 34.3% 32.2%** 35.1%
Fleet Rental 65.5% 60.0% 62.2% 64.5% 61.9%** 62.7% 64.2% 63.4% 66.7%
Rental Consolidated 46.5% 45.3% 41.7% 42.3% 42.6%** 42.6%** 42.1% 41.0%** 43.1%
Used Car Sales 5.7% 6.0% 7.3% 5.5% 5.9% 6.2% 3.7% 6.6% 2.1%
EBITDA margin:
916.5 969.8 934.8 1,015.6
1,314.2
927.91,141.2
332.3 396.2
2013 2014 2015 2016 2017Adjusted
9M17adjusted
9M18 3Q17adjusted
3Q18
One-time costs incurred - Hertz Brasil acquisition and Franchisees incorporation
74.0
GAINS OF MARGINS IN CAR RENTAL AND FLEET RENTAL
21.5
21.5
45
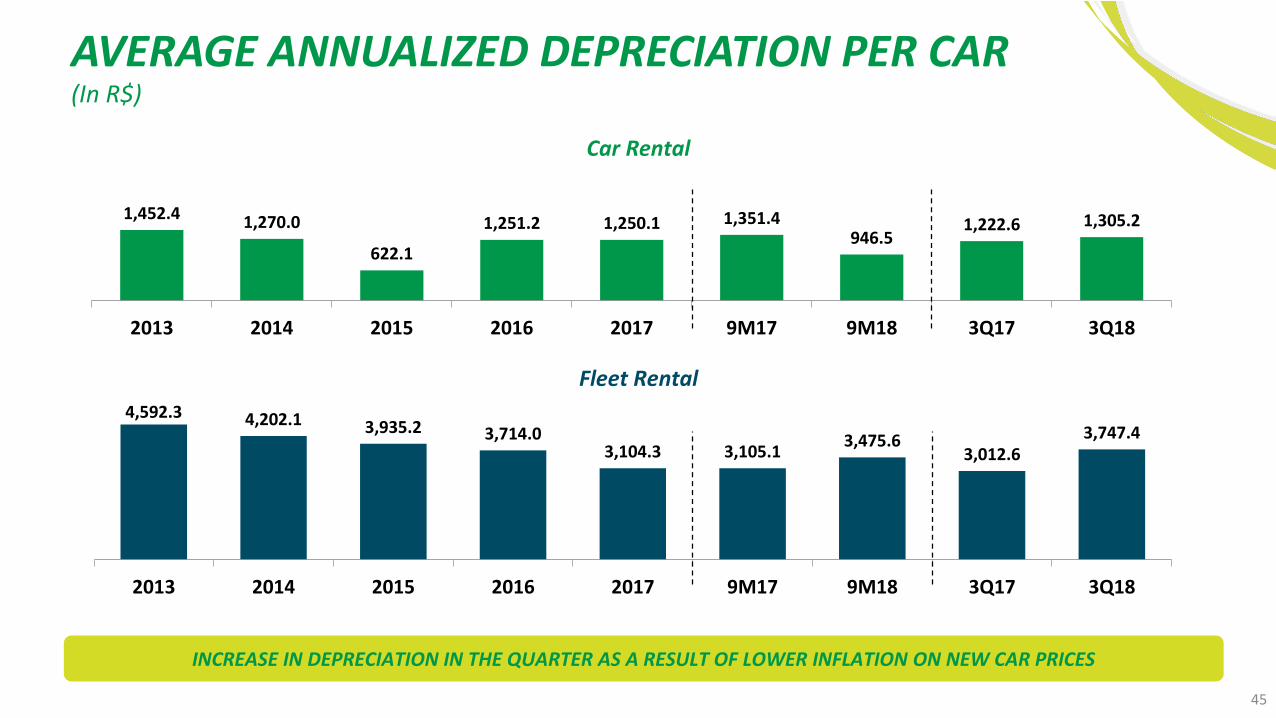
AVERAGE ANNUALIZED DEPRECIATION PER CAR(In R$)
Fleet Rental
Car Rental
INCREASE IN DEPRECIATION IN THE QUARTER AS A RESULT OF LOWER INFLATION ON NEW CAR PRICES
1,452.4 1,270.0
622.1
1,251.2 1,250.1 1,351.4946.5
1,222.6 1,305.2
2013 2014 2015 2016 2017 9M17 9M18 3Q17 3Q18
4,592.3 4,202.1 3,935.2 3,714.03,104.3 3,105.1
3,475.63,012.6
3,747.4
2013 2014 2015 2016 2017 9M17 9M18 3Q17 3Q18
46
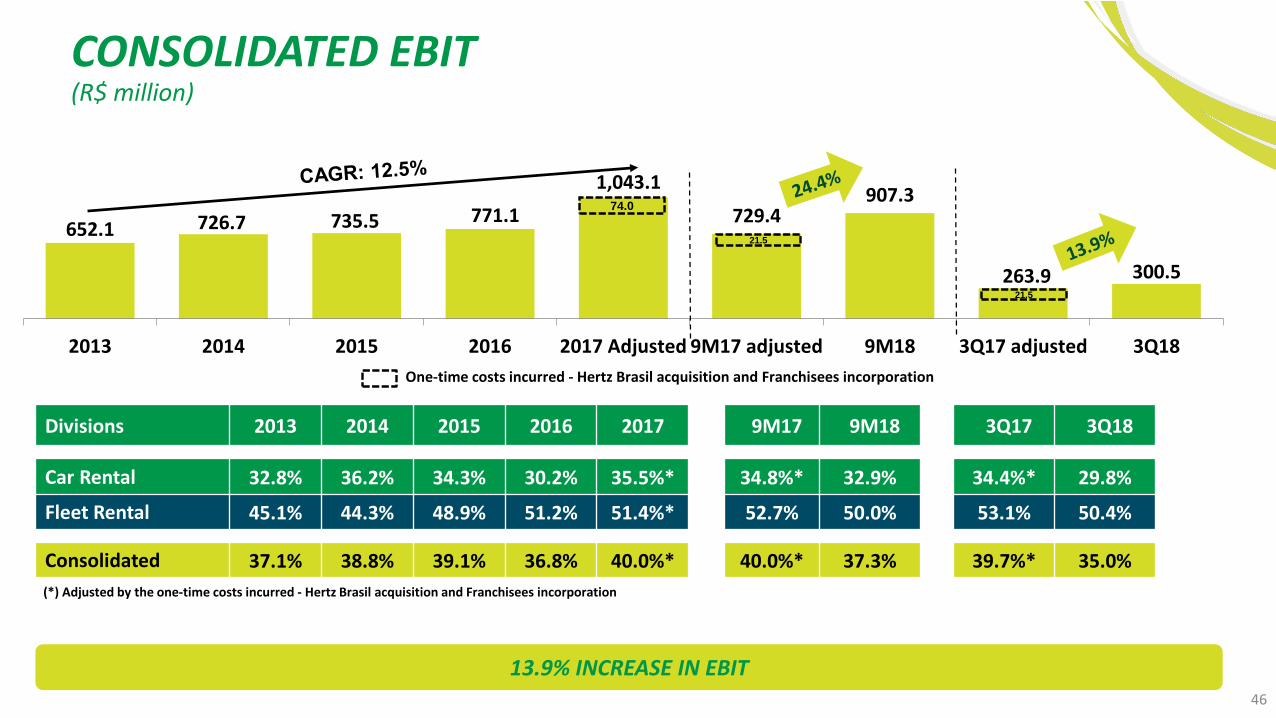
CONSOLIDATED EBIT(R$ million)
652.1 726.7 735.5 771.1
1,043.1
729.4907.3
263.9 300.5
2013 2014 2015 2016 2017 Adjusted 9M17 adjusted 9M18 3Q17 adjusted 3Q18
Divisions 2013 2014 2015 2016 2017 9M17 9M18 3Q17 3Q18
Car Rental 32.8% 36.2% 34.3% 30.2% 35.5%* 34.8%* 32.9% 34.4%* 29.8%
Fleet Rental 45.1% 44.3% 48.9% 51.2% 51.4%* 52.7% 50.0% 53.1% 50.4%
Consolidated 37.1% 38.8% 39.1% 36.8% 40.0%* 40.0%* 37.3% 39.7%* 35.0%
74.0
One-time costs incurred - Hertz Brasil acquisition and Franchisees incorporation
(*) Adjusted by the one-time costs incurred - Hertz Brasil acquisition and Franchisees incorporation
13.9% INCREASE IN EBIT
21.5
21.5
47
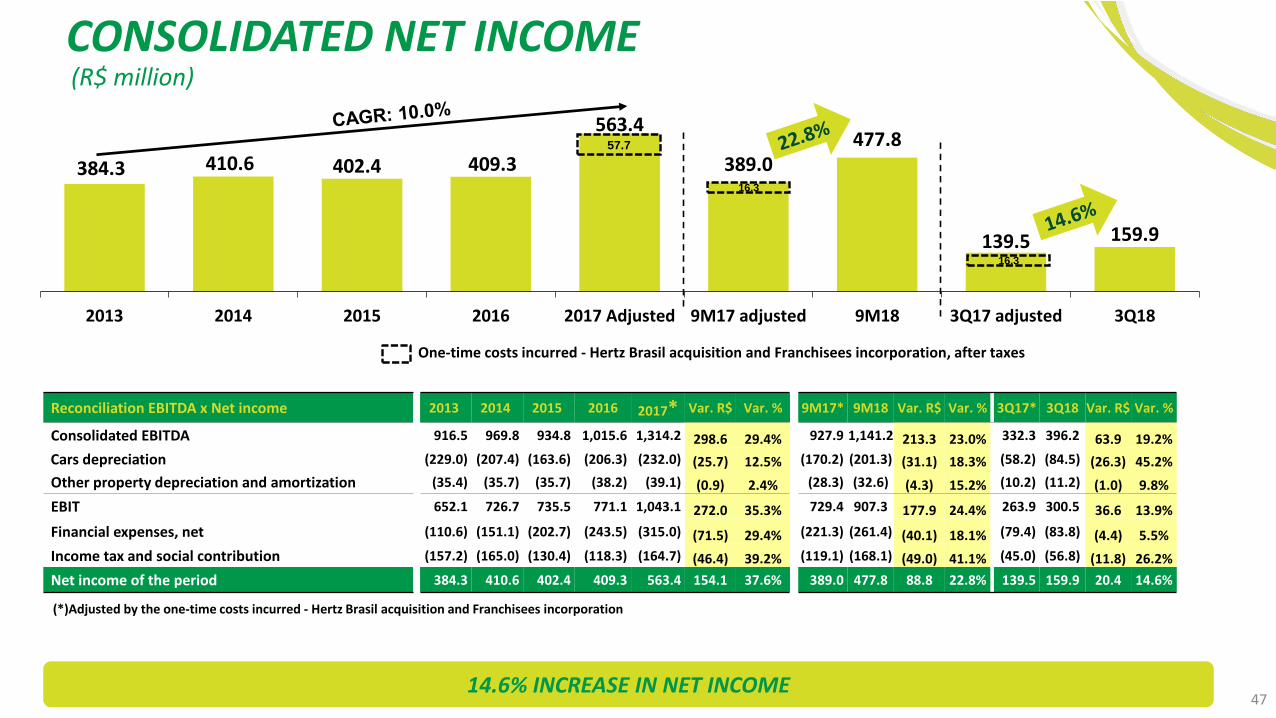
CONSOLIDATED NET INCOME(R$ million)
384.3 410.6 402.4 409.3
563.4
389.0477.8
139.5 159.9
2013 2014 2015 2016 2017 Adjusted 9M17 adjusted 9M18 3Q17 adjusted 3Q18
Reconciliation EBITDA x Net income 2013 2014 2015 2016 2017* Var. R$ Var. % 9M17* 9M18 Var. R$ Var. % 3Q17* 3Q18 Var. R$ Var. %
Consolidated EBITDA 916.5 969.8 934.8 1,015.6 1,314.2 298.6 29.4% 927.9 1,141.2 213.3 23.0% 332.3 396.2 63.9 19.2%
Cars depreciation (229.0) (207.4) (163.6) (206.3) (232.0) (25.7) 12.5% (170.2) (201.3) (31.1) 18.3% (58.2) (84.5) (26.3) 45.2%
Other property depreciation and amortization (35.4) (35.7) (35.7) (38.2) (39.1) (0.9) 2.4% (28.3) (32.6) (4.3) 15.2% (10.2) (11.2) (1.0) 9.8%
EBIT 652.1 726.7 735.5 771.1 1,043.1 272.0 35.3% 729.4 907.3 177.9 24.4% 263.9 300.5 36.6 13.9%
Financial expenses, net (110.6) (151.1) (202.7) (243.5) (315.0) (71.5) 29.4% (221.3) (261.4) (40.1) 18.1% (79.4) (83.8) (4.4) 5.5%
Income tax and social contribution (157.2) (165.0) (130.4) (118.3) (164.7) (46.4) 39.2% (119.1) (168.1) (49.0) 41.1% (45.0) (56.8) (11.8) 26.2%
Net income of the period 384.3 410.6 402.4 409.3 563.4 154.1 37.6% 389.0 477.8 88.8 22.8% 139.5 159.9 20.4 14.6%
57.7
One-time costs incurred - Hertz Brasil acquisition and Franchisees incorporation, after taxes
(*)Adjusted by the one-time costs incurred - Hertz Brasil acquisition and Franchisees incorporation
14.6% INCREASE IN NET INCOME
16.3
16.3
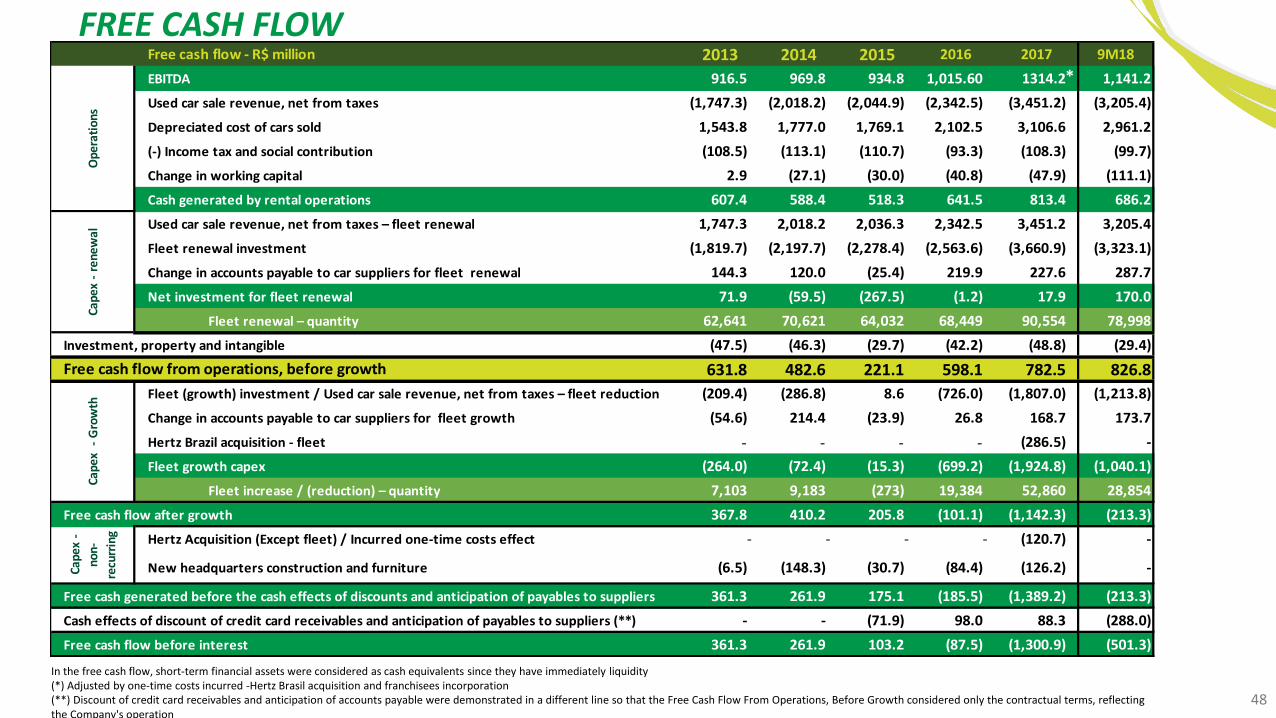
FREE CASH FLOW
48
In the free cash flow, short-term financial assets were considered as cash equivalents since they have immediately liquidity(*) Adjusted by one-time costs incurred -Hertz Brasil acquisition and franchisees incorporation(**) Discount of credit card receivables and anticipation of accounts payable were demonstrated in a different line so that the Free Cash Flow From Operations, Before Growth considered only the contractual terms, reflectingthe Company's operation
Free cash flow - R$ million 2013 2014 2015 2016 2017 9M18
EBITDA 916.5 969.8 934.8 1,015.60 1314.2 1,141.2
Used car sale revenue, net from taxes (1,747.3) (2,018.2) (2,044.9) (2,342.5) (3,451.2) (3,205.4)
Depreciated cost of cars sold 1,543.8 1,777.0 1,769.1 2,102.5 3,106.6 2,961.2
(-) Income tax and social contribution (108.5) (113.1) (110.7) (93.3) (108.3) (99.7)
Change in working capital 2.9 (27.1) (30.0) (40.8) (47.9) (111.1)
Cash generated by rental operations 607.4 588.4 518.3 641.5 813.4 686.2
Used car sale revenue, net from taxes – fleet renewal 1,747.3 2,018.2 2,036.3 2,342.5 3,451.2 3,205.4
Fleet renewal investment (1,819.7) (2,197.7) (2,278.4) (2,563.6) (3,660.9) (3,323.1)
Change in accounts payable to car suppliers for fleet renewal 144.3 120.0 (25.4) 219.9 227.6 287.7
Net investment for fleet renewal 71.9 (59.5) (267.5) (1.2) 17.9 170.0
Fleet renewal – quantity 62,641 70,621 64,032 68,449 90,554 78,998
(47.5) (46.3) (29.7) (42.2) (48.8) (29.4)
631.8 482.6 221.1 598.1 782.5 826.8
Fleet (growth) investment / Used car sale revenue, net from taxes – fleet reduction (209.4) (286.8) 8.6 (726.0) (1,807.0) (1,213.8)
Change in accounts payable to car suppliers for fleet growth (54.6) 214.4 (23.9) 26.8 168.7 173.7
Hertz Brazil acquisition - fleet - - - - (286.5) -
Fleet growth capex (264.0) (72.4) (15.3) (699.2) (1,924.8) (1,040.1)
Fleet increase / (reduction) – quantity 7,103 9,183 (273) 19,384 52,860 28,854
367.8 410.2 205.8 (101.1) (1,142.3) (213.3)
Hertz Acquisition (Except fleet) / Incurred one-time costs effect - - - - (120.7) -
New headquarters construction and furniture (6.5) (148.3) (30.7) (84.4) (126.2) -
361.3 261.9 175.1 (185.5) (1,389.2) (213.3)
- - (71.9) 98.0 88.3 (288.0)
361.3 261.9 103.2 (87.5) (1,300.9) (501.3)
Ope
rati
ons
Cape
x -
rene
wal
Investment, property and intangible
Free cash flow from operations, before growth
Cape
x -
Gro
wth
Cape
x -
non-
recu
rrin
g
Free cash generated before the cash effects of discounts and anticipation of payables to suppliers
Free cash flow after growth
Cash effects of discount of credit card receivables and anticipation of payables to suppliers (**)
Free cash flow before interest
*
49
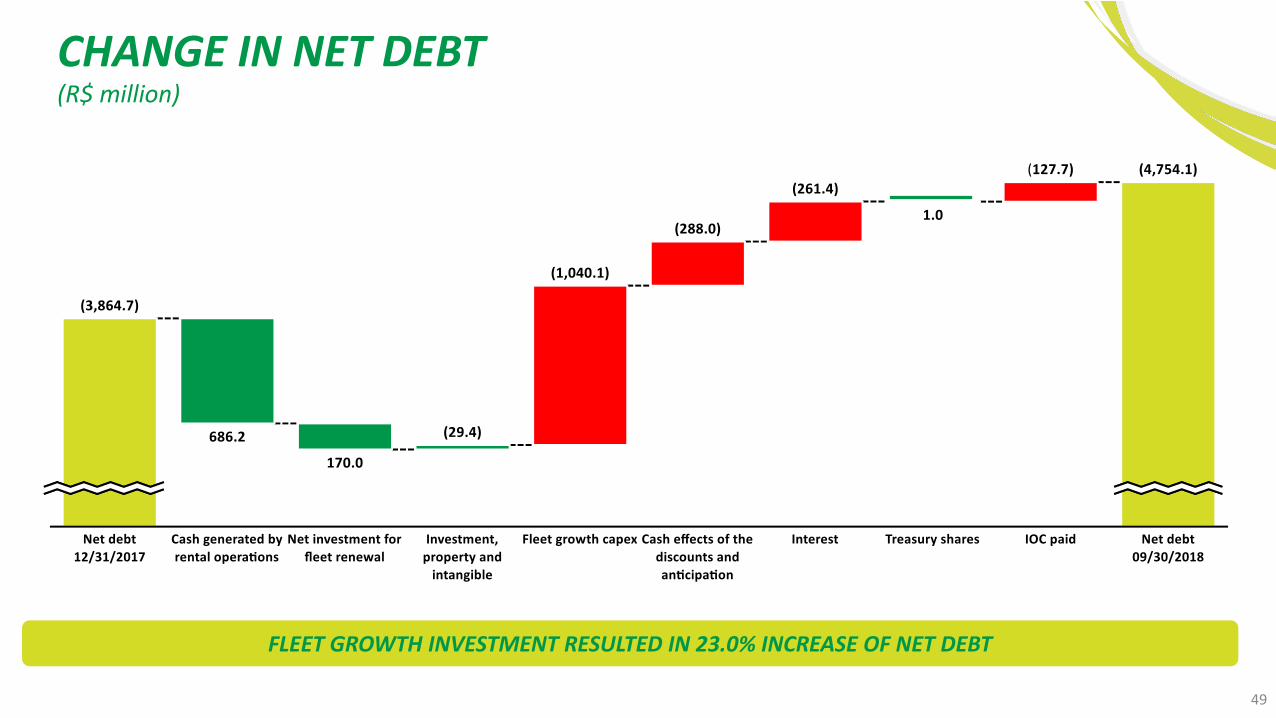
FLEET GROWTH INVESTMENT RESULTED IN 23.0% INCREASE OF NET DEBT
CHANGE IN NET DEBT(R$ million)
50
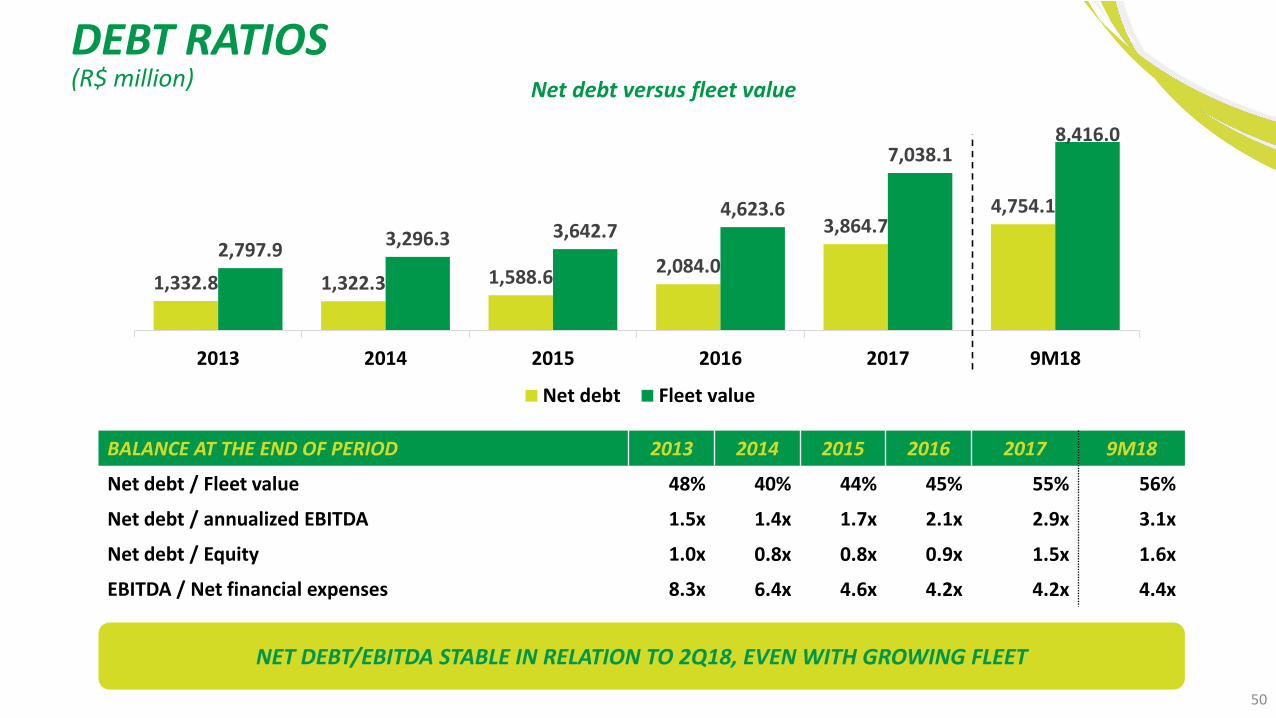
DEBT RATIOS
NET DEBT/EBITDA STABLE IN RELATION TO 2Q18, EVEN WITH GROWING FLEET
Net debt versus fleet value
BALANCE AT THE END OF PERIOD 2013 2014 2015 2016 2017 9M18
Net debt / Fleet value 48% 40% 44% 45% 55% 56%
Net debt / annualized EBITDA 1.5x 1.4x 1.7x 2.1x 2.9x 3.1x
Net debt / Equity 1.0x 0.8x 0.8x 0.9x 1.5x 1.6x
EBITDA / Net financial expenses 8.3x 6.4x 4.6x 4.2x 4.2x 4.4x
1,332.8 1,322.3 1,588.62,084.0
3,864.74,754.1
2,797.93,296.3 3,642.7
4,623.6
7,038.18,416.0
2013 2014 2015 2016 2017 9M18
Net debt Fleet value
(R$ million)
51
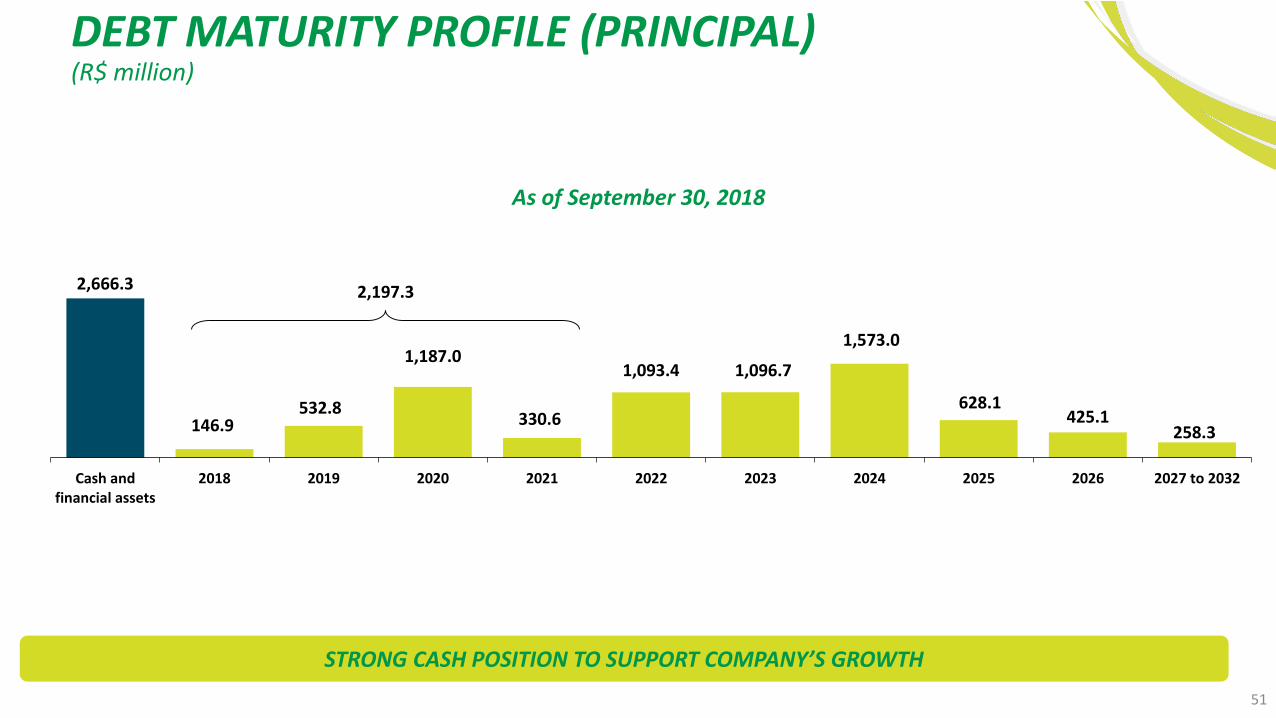
DEBT MATURITY PROFILE (PRINCIPAL)(R$ million)
As of September 30, 2018
STRONG CASH POSITION TO SUPPORT COMPANY’S GROWTH
2,666.3
146.9532.8
1,187.0
330.6
1,093.4 1,096.7
1,573.0
628.1425.1
258.3
Cash andfinancial assets
2018 2019 2020 2021 2022 2023 2024 2025 2026 2027 to 2032
2,197.3
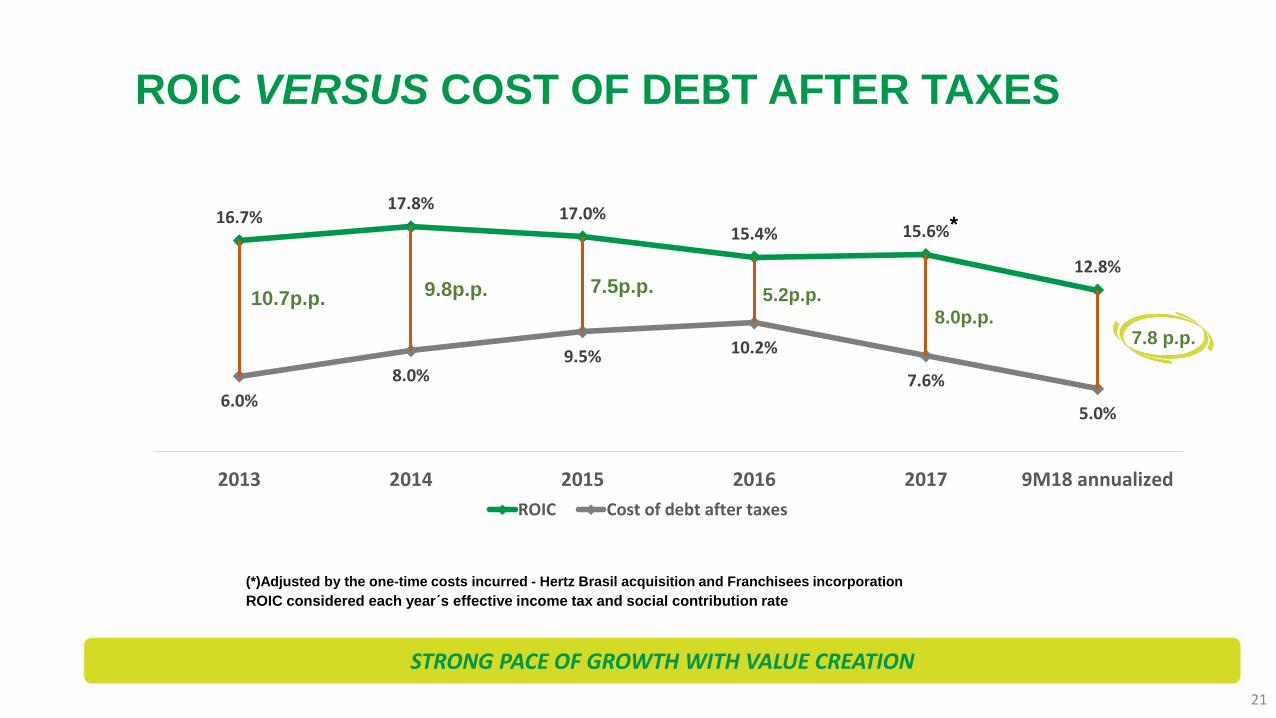
ROIC VERSUS COST OF DEBT AFTER TAXES
STRONG PACE OF GROWTH WITH VALUE CREATION
16.7%17.8%
17.0%15.4% 15.6%
12.8%
6.0%
8.0%9.5% 10.2%
7.6%
5.0%
2013 2014 2015 2016 2017 9M18 annualized
ROIC Cost of debt after taxes
9.8p.p.10.7p.p.7.5p.p. 5.2p.p.
8.0p.p.
ROIC considered each year´s effective income tax and social contribution rate
*
(*)Adjusted by the one-time costs incurred - Hertz Brasil acquisition and Franchisees incorporation
7.8 p.p.
21
53
Website: www.localiza.com/ir E-mail: [email protected] Phone: 55 31 3247-7024
The material presented is a presentation of general background information about LOCALIZA as of the date of the presentation. It is information in summary form and does not purport to becomplete. It is not intended to be relied upon as advice to potential investors. No representation or warranty, express or implied, is made concerning, and no reliance should be placed on, theaccuracy, fairness, or completeness of the information presented herein.
This presentation contains statements that are forward-looking within the meaning of Section 27A of the Securities Act of 1933 and Section 21E of the Securities Exchange Act of 1934. Such forward-looking statements are only projections and are not guarantees of future performance. Investors are cautioned that any such forward-looking statements are and will be, as the case may be, subjectto many risks, uncertainties and factors relating to the operations and business environments of LOCALIZA and its subsidiaries that may cause the actual results of the companies to be materiallydifferent from any future results expressed or implied in such forward-looking statements.
Although LOCALIZA believes that the expectations and assumptions reflected in the forward-looking statements are reasonable based on information currently available to LOCALIZA’s management,LOCALIZA cannot guarantee future results or events. LOCALIZA expressly disclaims a duty to update any of the forward-looking statement.
Securities may not be offered or sold in the United States unless they are registered or exempt from registration under the Securities Act of 1933.
This presentation does not constitute an offer, invitation or solicitation of an offer to subscribe to or purchase any securities. Neither this presentation nor anything contained herein shall form the basis ofany contract or commitment whatsoever.
DISCLAIMER