Embed Size (px)
Citation preview

1
Investor Relations Company Presentation
9M 2021 results – October 28, 2021
Marcelino Fernández Verdes, CEO
Peter Sassenfeld, CFO
Mike Pinkney, Head of Corporate Strategy
Tobias Loskamp, Head of Capital Markets Strategy
© S
ydney
Metr
o C
ity &
South
west
2
Table of contents
© HOCHTIEF
© CPB Contractors© TWA Hotel/David Mitchell
© HOCHTIEF
Highlights 3
Cash flow 5
Net cash 6
Recent project awards 7
Order book 8
Americas 9
Asia Pacific 10
Europe 11
Abertis 12
Outlook and dividend 13
Appendix
Group overview & one-offs 15
P&L 16 Balance sheet 17 Group financing structure 20 Americas 21 Asia Pacific 23 Europe 26 Abertis 30 f/x rates 32 HOCHTIEF Group overview 33
3
246
294 285
322
9M 2020… 9M 2021 9M 2020… 9M 2021
19% 13%
9M 2020
like-for-like
9M 2020
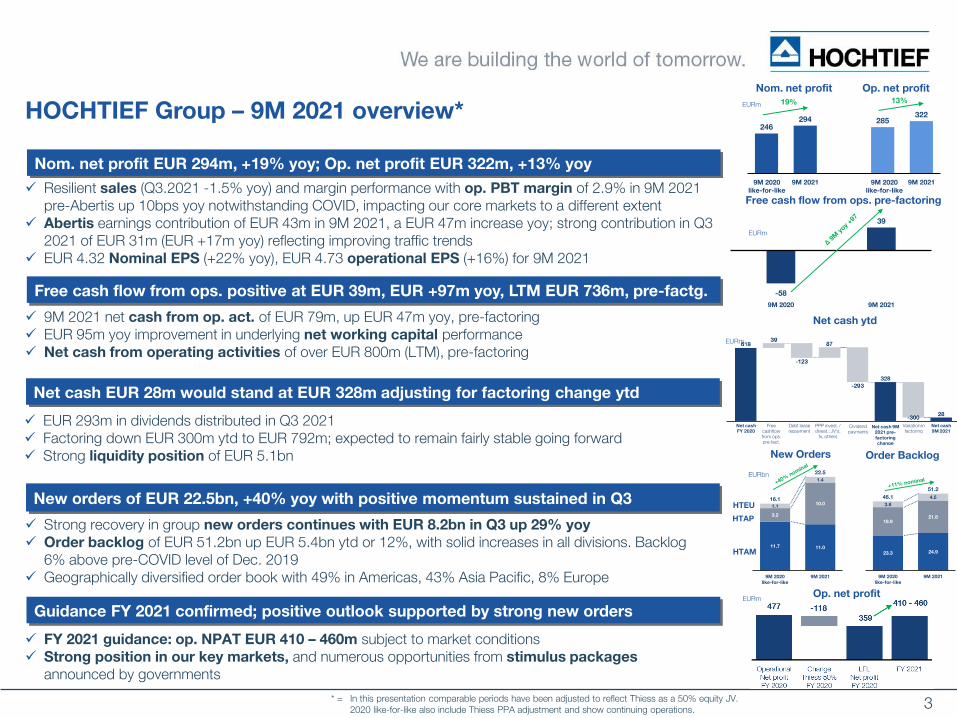
like-for-like Resilient sales (Q3.2021 -1.5% yoy) and margin performance with op. PBT margin of 2.9% in 9M 2021 pre-Abertis up 10bps yoy notwithstanding COVID, impacting our core markets to a different extent
Abertis earnings contribution of EUR 43m in 9M 2021, a EUR 47m increase yoy; strong contribution in Q3 2021 of EUR 31m (EUR +17m yoy) reflecting improving traffic trends
EUR 4.32 Nominal EPS (+22% yoy), EUR 4.73 operational EPS (+16%) for 9M 2021
HOCHTIEF Group – 9M 2021 overview*
Nom. net profit Op. net profit
* = In this presentation comparable periods have been adjusted to reflect Thiess as a 50% equity JV. 2020 like-for-like also include Thiess PPA adjustment and show continuing operations.
Nom. net profit EUR 294m, +19% yoy; Op. net profit EUR 322m, +13% yoy
EUR 293m in dividends distributed in Q3 2021 Factoring down EUR 300m ytd to EUR 792m; expected to remain fairly stable going forward Strong liquidity position of EUR 5.1bn
Net cash EUR 28m would stand at EUR 328m adjusting for factoring change ytd
FY 2021 guidance: op. NPAT EUR 410 – 460m subject to market conditions Strong position in our key markets, and numerous opportunities from stimulus packages
announced by governments
Guidance FY 2021 confirmed; positive outlook supported by strong new orders
EURm
9M 2021 net cash from op. act. of EUR 79m, up EUR 47m yoy, pre-factoring EUR 95m yoy improvement in underlying net working capital performance Net cash from operating activities of over EUR 800m (LTM), pre-factoring
Free cash flow from ops. positive at EUR 39m, EUR +97m yoy, LTM EUR 736m, pre-factg.
EURm
Op. net profitEURm
HTEU
HTAM
HTAP
New Orders Order Backlog
EURbn
11.7 11.0
3.2
10.01.1
1.4
16.1
22.5
9M 2020
like-for-like
9M 2021
23.3 24.9
18.9
21.8
3.8
4.546.1
51.2
9M 2020
like-for-like
9M 2021
Free cash flow from ops. pre-factoring
-58
39
9M 2020 9M 2021
New orders of EUR 22.5bn, +40% yoy with positive momentum sustained in Q3
Strong recovery in group new orders continues with EUR 8.2bn in Q3 up 29% yoy
Order backlog of EUR 51.2bn up EUR 5.4bn ytd or 12%, with solid increases in all divisions. Backlog 6% above pre-COVID level of Dec. 2019
Geographically diversified order book with 49% in Americas, 43% Asia Pacific, 8% Europe
Net cash
FY 2020
Free cashflow from ops. pre-fact.
Debt lease repayment
Net cash
9M 2021
PPP invest. / divest.; JV's,
fx, others
Variation in factoring
Dividend payments
Net cash 9M
2021 pre-
factoring
change
Net cash ytd
EURm
4
HOCHTIEF Group – 9M 2021 key figures*
* = In this presentation comparable periods have been adjusted to reflect Thiess as a 50% equity JV. 2020 like-for-like also include Thiess PPA adjustment and show continuing operations.
(EUR million)
9M
2021
9M
2020
like-for-like
Δ 9M
in %
Δ 9M
in EURm
Q3
2021
Q3
2020
like-for-like
Δ Q3
in %
Δ Q3
in EURm
LTM
9M 2021
like-for-like
FY
2020
like-for-like
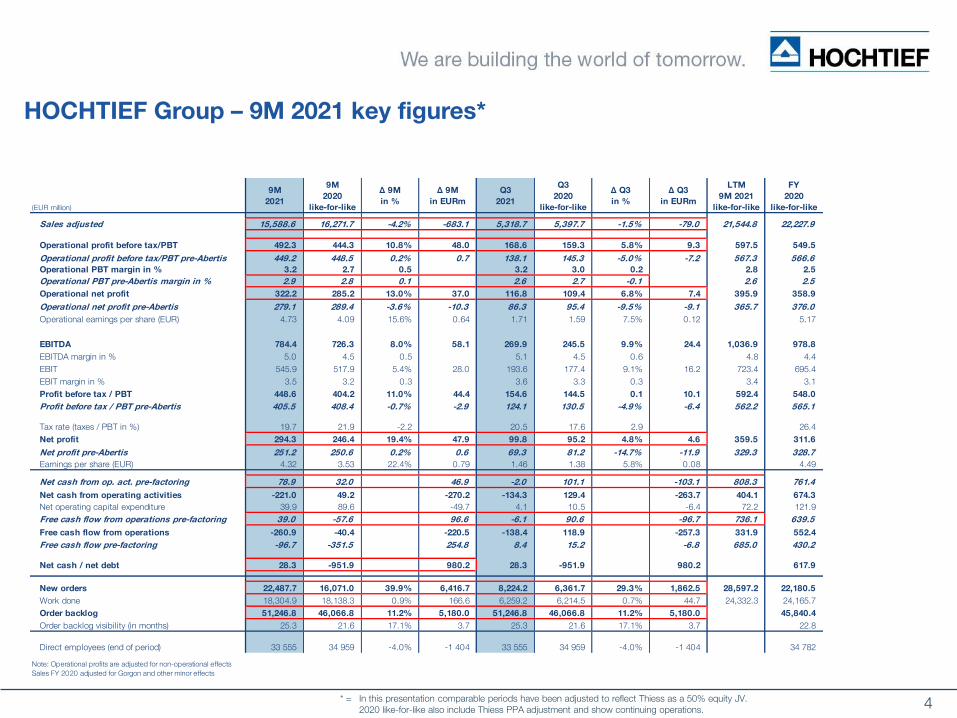
Sales adjusted 15,588.6 16,271.7 -4.2% -683.1 5,318.7 5,397.7 -1.5% -79.0 21,544.8 22,227.9
Operational profit before tax/PBT 492.3 444.3 10.8% 48.0 168.6 159.3 5.8% 9.3 597.5 549.5
Operational profit before tax/PBT pre-Abertis 449.2 448.5 0.2% 0.7 138.1 145.3 -5.0% -7.2 567.3 566.6
Operational PBT margin in % 3.2 2.7 0.5 3.2 3.0 0.2 2.8 2.5
Operational PBT pre-Abertis margin in % 2.9 2.8 0.1 2.6 2.7 -0.1 2.6 2.5
Operational net profit 322.2 285.2 13.0% 37.0 116.8 109.4 6.8% 7.4 395.9 358.9
Operational net profit pre-Abertis 279.1 289.4 -3.6% -10.3 86.3 95.4 -9.5% -9.1 365.7 376.0
Operational earnings per share (EUR) 4.73 4.09 15.6% 0.64 1.71 1.59 7.5% 0.12 5.17
EBITDA 784.4 726.3 8.0% 58.1 269.9 245.5 9.9% 24.4 1,036.9 978.8
EBITDA margin in % 5.0 4.5 0.5 5.1 4.5 0.6 4.8 4.4
EBIT 545.9 517.9 5.4% 28.0 193.6 177.4 9.1% 16.2 723.4 695.4
EBIT margin in % 3.5 3.2 0.3 3.6 3.3 0.3 3.4 3.1
Profit before tax / PBT 448.6 404.2 11.0% 44.4 154.6 144.5 0.1 10.1 592.4 548.0
Profit before tax / PBT pre-Abertis 405.5 408.4 -0.7% -2.9 124.1 130.5 -4.9% -6.4 562.2 565.1
Tax rate (taxes / PBT in %) 19.7 21.9 -2.2 20.5 17.6 2.9 26.4
Net profit 294.3 246.4 19.4% 47.9 99.8 95.2 4.8% 4.6 359.5 311.6
Net profit pre-Abertis 251.2 250.6 0.2% 0.6 69.3 81.2 -14.7% -11.9 329.3 328.7
Earnings per share (EUR) 4.32 3.53 22.4% 0.79 1.46 1.38 5.8% 0.08 4.49
Net cash from op. act. pre-factoring 78.9 32.0 46.9 -2.0 101.1 -103.1 808.3 761.4
Net cash from operating activities -221.0 49.2 -270.2 -134.3 129.4 -263.7 404.1 674.3
Net operating capital expenditure 39.9 89.6 -49.7 4.1 10.5 -6.4 72.2 121.9
Free cash flow from operations pre-factoring 39.0 -57.6 96.6 -6.1 90.6 -96.7 736.1 639.5
Free cash flow from operations -260.9 -40.4 -220.5 -138.4 118.9 -257.3 331.9 552.4
Free cash flow pre-factoring -96.7 -351.5 254.8 8.4 15.2 -6.8 685.0 430.2
Net cash / net debt 28.3 -951.9 980.2 28.3 -951.9 980.2 617.9
New orders 22,487.7 16,071.0 39.9% 6,416.7 8,224.2 6,361.7 29.3% 1,862.5 28,597.2 22,180.5
Work done 18,304.9 18,138.3 0.9% 166.6 6,259.2 6,214.5 0.7% 44.7 24,332.3 24,165.7
Order backlog 51,246.8 46,066.8 11.2% 5,180.0 51,246.8 46,066.8 11.2% 5,180.0 45,840.4
Order backlog visibility (in months) 25.3 21.6 17.1% 3.7 25.3 21.6 17.1% 3.7 22.8
Direct employees (end of period) 33 555 34 959 -4.0% -1 404 33 555 34 959 -4.0% -1 404 34 782
Note: Operational profits are adjusted for non-operational effects
Sales FY 2020 adjusted for Gorgon and other minor effects
5
HOCHTIEF Group – Cash Flow performance
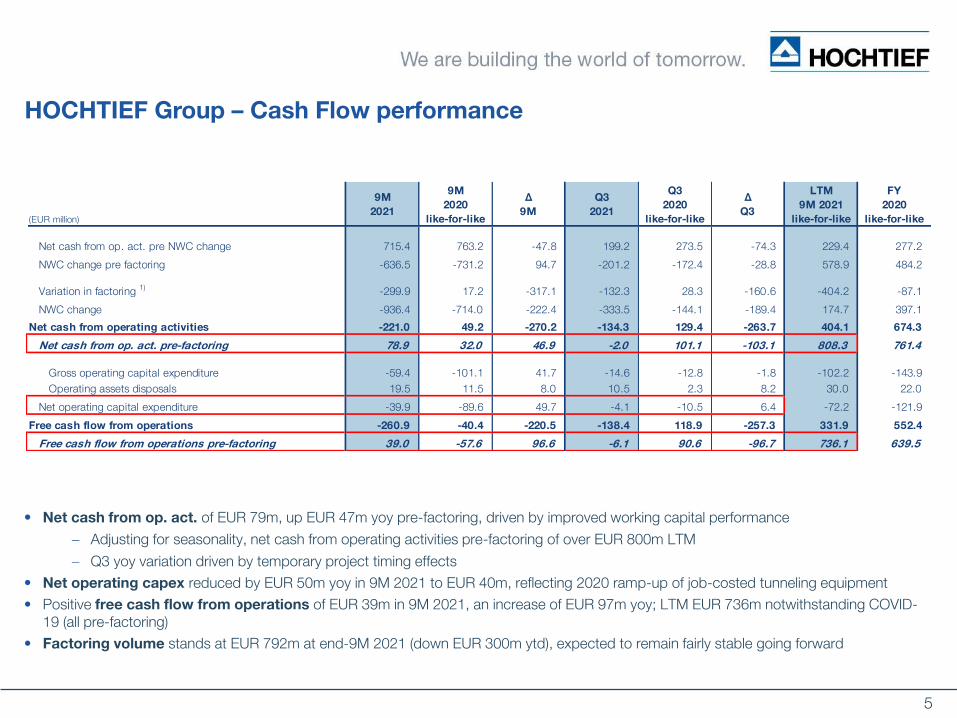
• Net cash from op. act. of EUR 79m, up EUR 47m yoy pre-factoring, driven by improved working capital performance
Adjusting for seasonality, net cash from operating activities pre-factoring of over EUR 800m LTM
Q3 yoy variation driven by temporary project timing effects
• Net operating capex reduced by EUR 50m yoy in 9M 2021 to EUR 40m, reflecting 2020 ramp-up of job-costed tunneling equipment
• Positive free cash flow from operations of EUR 39m in 9M 2021, an increase of EUR 97m yoy; LTM EUR 736m notwithstanding COVID-19 (all pre-factoring)
• Factoring volume stands at EUR 792m at end-9M 2021 (down EUR 300m ytd), expected to remain fairly stable going forward
(EUR million)
9M
2021
9M
2020
like-for-like
∆
9M
Q3
2021
Q3
2020
like-for-like
∆
Q3
LTM
9M 2021
like-for-like
FY
2020
like-for-like
Net cash from op. act. pre NWC change 715.4 763.2 -47.8 199.2 273.5 -74.3 229.4 277.2
NWC change pre factoring -636.5 -731.2 94.7 -201.2 -172.4 -28.8 578.9 484.2
Variation in factoring 1) -299.9 17.2 -317.1 -132.3 28.3 -160.6 -404.2 -87.1
NWC change -936.4 -714.0 -222.4 -333.5 -144.1 -189.4 174.7 397.1
Net cash from operating activities -221.0 49.2 -270.2 -134.3 129.4 -263.7 404.1 674.3
Net cash from op. act. pre-factoring 78.9 32.0 46.9 -2.0 101.1 -103.1 808.3 761.4
Gross operating capital expenditure -59.4 -101.1 41.7 -14.6 -12.8 -1.8 -102.2 -143.9
Operating assets disposals 19.5 11.5 8.0 10.5 2.3 8.2 30.0 22.0
Net operating capital expenditure -39.9 -89.6 49.7 -4.1 -10.5 6.4 -72.2 -121.9
Free cash flow from operations -260.9 -40.4 -220.5 -138.4 118.9 -257.3 331.9 552.4
Free cash flow from operations pre-factoring 39.0 -57.6 96.6 -6.1 90.6 -96.7 736.1 639.5
6
HOCHTIEF Group – Net cash development
Net cash 9M 2021 ytd
Net cash (+) / net debt (-)
1) incl. EUR 750m commercial paper program at HOCHTIEF HQ
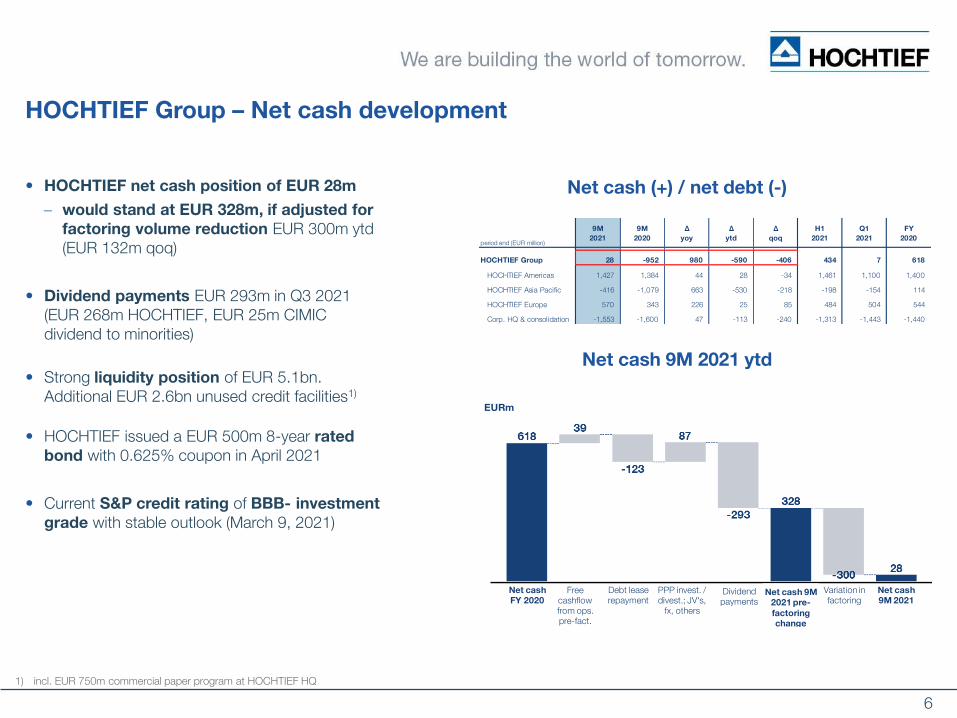
• HOCHTIEF net cash position of EUR 28m
would stand at EUR 328m, if adjusted for
factoring volume reduction EUR 300m ytd(EUR 132m qoq)
• Dividend payments EUR 293m in Q3 2021 (EUR 268m HOCHTIEF, EUR 25m CIMIC dividend to minorities)
• Strong liquidity position of EUR 5.1bn. Additional EUR 2.6bn unused credit facilities1)
• HOCHTIEF issued a EUR 500m 8-year rated
bond with 0.625% coupon in April 2021
• Current S&P credit rating of BBB- investment
grade with stable outlook (March 9, 2021)
period end (EUR million)
9M
2021
9M
2020
∆
yoy
∆
ytd
∆
qoq
H1
2021
Q1
2021
FY
2020
HOCHTIEF Group 28 -952 980 -590 -406 434 7 618
HOCHTIEF Americas 1,427 1,384 44 28 -34 1,461 1,100 1,400
HOCHTIEF Asia Pacific -416 -1,079 663 -530 -218 -198 -154 114
HOCHTIEF Europe 570 343 226 25 85 484 504 544
Corp. HQ & consolidation -1,553 -1,600 47 -113 -240 -1,313 -1,443 -1,440
Net cash
FY 2020
Free cashflow from ops. pre-fact.
Debt lease repayment
Net cash
9M 2021
EURm
PPP invest. / divest.; JV's,
fx, others
Variation in factoring
Dividend payments
Net cash 9M
2021 pre-
factoring
change
7
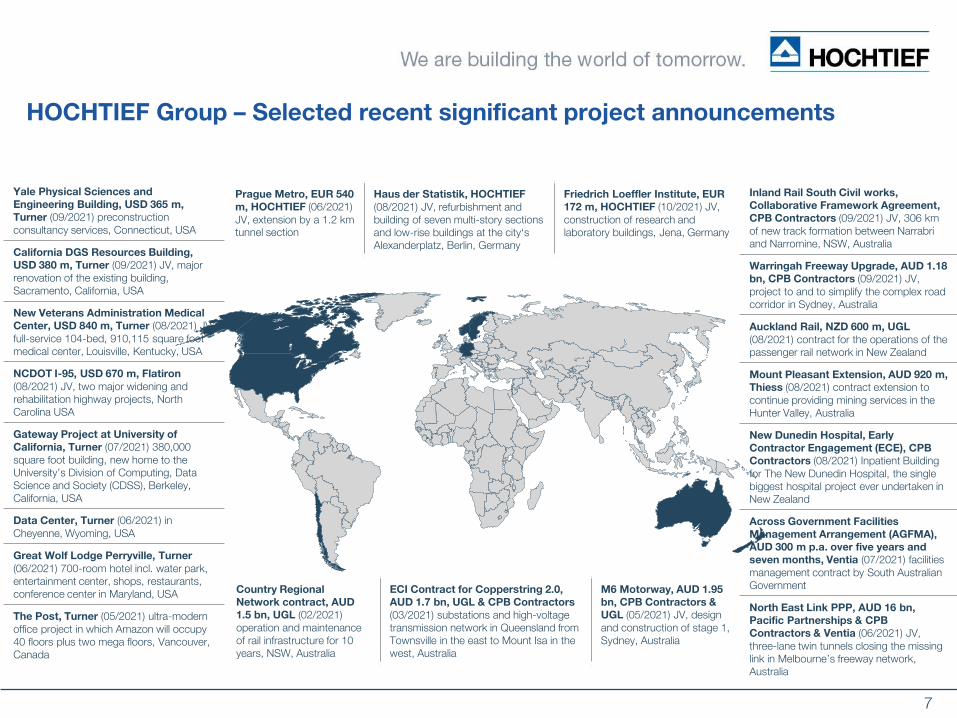
HOCHTIEF Group – Selected recent significant project announcements
Yale Physical Sciences and
Engineering Building, USD 365 m,
Turner (09/2021) preconstruction consultancy services, Connecticut, USA
California DGS Resources Building,
USD 380 m, Turner (09/2021) JV, major renovation of the existing building, Sacramento, California, USA
New Veterans Administration Medical
Center, USD 840 m, Turner (08/2021) JV, full-service 104-bed, 910,115 square foot medical center, Louisville, Kentucky, USA
NCDOT I-95, USD 670 m, Flatiron
(08/2021) JV, two major widening and rehabilitation highway projects, North Carolina USA
Gateway Project at University of
California, Turner (07/2021) 380,000 square foot building, new home to the University’s Division of Computing, Data Science and Society (CDSS), Berkeley, California, USA
Data Center, Turner (06/2021) in Cheyenne, Wyoming, USA
Great Wolf Lodge Perryville, Turner
(06/2021) 700-room hotel incl. water park, entertainment center, shops, restaurants, conference center in Maryland, USA
The Post, Turner (05/2021) ultra-modern office project in which Amazon will occupy 40 floors plus two mega floors, Vancouver, Canada
Prague Metro, EUR 540
m, HOCHTIEF (06/2021) JV, extension by a 1.2 km tunnel section
Haus der Statistik, HOCHTIEF
(08/2021) JV, refurbishment and building of seven multi-story sections and low-rise buildings at the city‘s Alexanderplatz, Berlin, Germany
Friedrich Loeffler Institute, EUR
172 m, HOCHTIEF (10/2021) JV, construction of research and laboratory buildings, Jena, Germany
Country Regional
Network contract, AUD
1.5 bn, UGL (02/2021) operation and maintenance of rail infrastructure for 10 years, NSW, Australia
ECI Contract for Copperstring 2.0,
AUD 1.7 bn, UGL & CPB Contractors
(03/2021) substations and high-voltage transmission network in Queensland from Townsville in the east to Mount Isa in the west, Australia
M6 Motorway, AUD 1.95
bn, CPB Contractors &
UGL (05/2021) JV, designand construction of stage 1, Sydney, Australia
Inland Rail South Civil works,
Collaborative Framework Agreement,
CPB Contractors (09/2021) JV, 306 km of new track formation between Narrabriand Narromine, NSW, Australia
Warringah Freeway Upgrade, AUD 1.18
bn, CPB Contractors (09/2021) JV, project to and to simplify the complex road corridor in Sydney, Australia
Auckland Rail, NZD 600 m, UGL
(08/2021) contract for the operations of the passenger rail network in New Zealand
Mount Pleasant Extension, AUD 920 m,
Thiess (08/2021) contract extension to continue providing mining services in the Hunter Valley, Australia
New Dunedin Hospital, Early
Contractor Engagement (ECE), CPB
Contractors (08/2021) Inpatient Building for The New Dunedin Hospital, the single biggest hospital project ever undertaken in New Zealand
Across Government Facilities
Management Arrangement (AGFMA),
AUD 300 m p.a. over five years and
seven months, Ventia (07/2021) facilities management contract by South Australian Government
North East Link PPP, AUD 16 bn,
Pacific Partnerships & CPB
Contractors & Ventia (06/2021) JV, three-lane twin tunnels closing the missing link in Melbourne’s freeway network, Australia
8
5.2 4.3
11.7 11.00.9 3.4
3.2
10.0
0.20.5
1.1
1.4
6.48.2
16.1
22.5
Q3
2020 LFL
Q3
2021
9M
2020 LFL
9M
2021
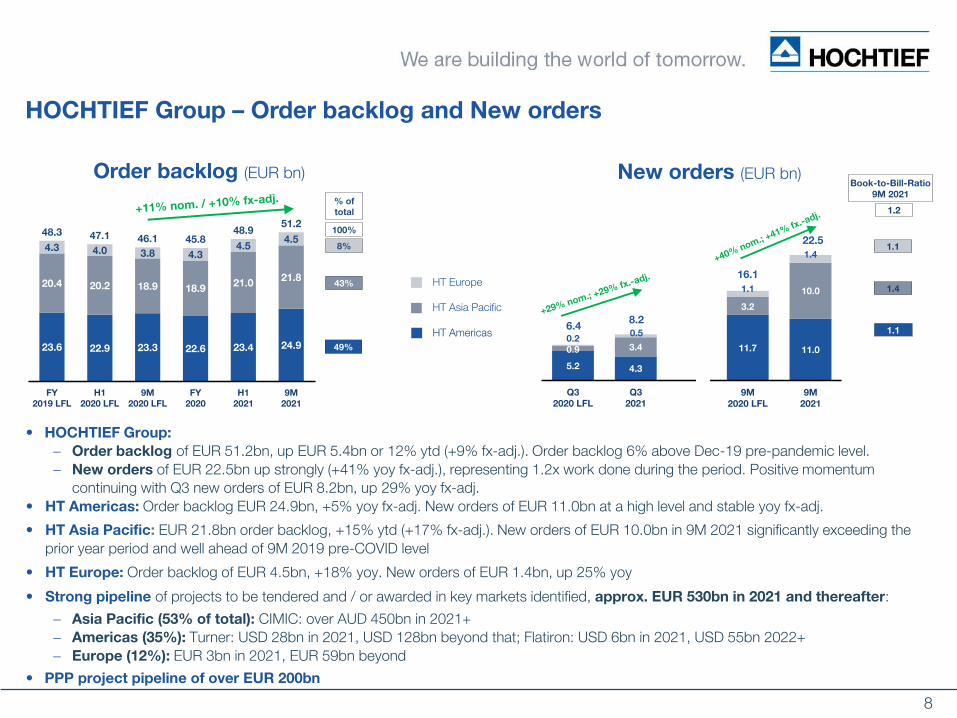
• HOCHTIEF Group:
Order backlog of EUR 51.2bn, up EUR 5.4bn or 12% ytd (+9% fx-adj.). Order backlog 6% above Dec-19 pre-pandemic level.
New orders of EUR 22.5bn up strongly (+41% yoy fx-adj.), representing 1.2x work done during the period. Positive momentum
continuing with Q3 new orders of EUR 8.2bn, up 29% yoy fx-adj.
• HT Americas: Order backlog EUR 24.9bn, +5% yoy fx-adj. New orders of EUR 11.0bn at a high level and stable yoy fx-adj.
• HT Asia Pacific: EUR 21.8bn order backlog, +15% ytd (+17% fx-adj.). New orders of EUR 10.0bn in 9M 2021 significantly exceeding the
prior year period and well ahead of 9M 2019 pre-COVID level
• HT Europe: Order backlog of EUR 4.5bn, +18% yoy. New orders of EUR 1.4bn, up 25% yoy
• Strong pipeline of projects to be tendered and / or awarded in key markets identified, approx. EUR 530bn in 2021 and thereafter:
Asia Pacific (53% of total): CIMIC: over AUD 450bn in 2021+
Americas (35%): Turner: USD 28bn in 2021, USD 128bn beyond that; Flatiron: USD 6bn in 2021, USD 55bn 2022+
Europe (12%): EUR 3bn in 2021, EUR 59bn beyond
• PPP project pipeline of over EUR 200bn
HOCHTIEF Group – Order backlog and New orders
New orders (EUR bn)
HT Europe
HT Asia Pacific
HT Americas
Order backlog (EUR bn)
1.2
Book-to-Bill-Ratio
9M 2021
1.1
1.4
1.1
5.2 4.3
11.7 11.00.9 3.4
3.2
10.0
0.20.5
1.1
1.4
6.48.2
16.1
22.5
Q3
2020 LFL
Q3
2021
9M
2020 LFL
9M
2021
23.6 22.9 23.3 22.6 23.4 24.9
20.4 20.2 18.9 18.921.0
21.8
4.3 4.0 3.8 4.3
4.54.5
48.347.1 46.1 45.8
48.951.2
FY
2019 LFL
H1
2020 LFL
9M
2020 LFL
FY
2020
H1
2021
9M
2021
100%
% of
total
8%
43%
49%
9
Essentials Financials
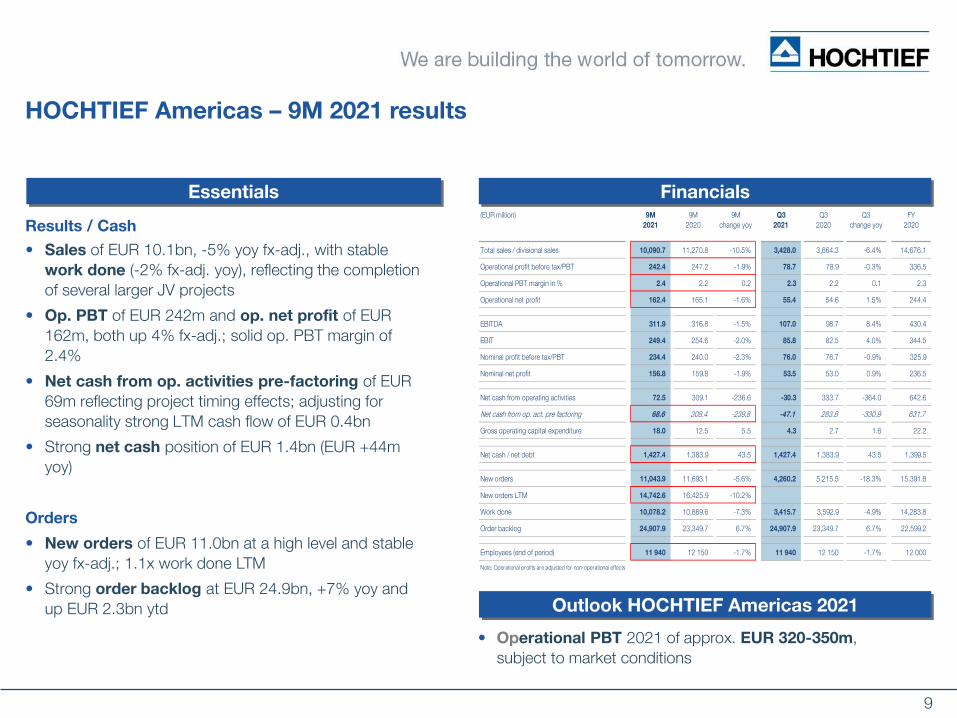
Results / Cash
• Sales of EUR 10.1bn, -5% yoy fx-adj., with stable
work done (-2% fx-adj. yoy), reflecting the completion
of several larger JV projects
• Op. PBT of EUR 242m and op. net profit of EUR
162m, both up 4% fx-adj.; solid op. PBT margin of
2.4%
• Net cash from op. activities pre-factoring of EUR
69m reflecting project timing effects; adjusting for
seasonality strong LTM cash flow of EUR 0.4bn
• Strong net cash position of EUR 1.4bn (EUR +44m
yoy)
Orders
• New orders of EUR 11.0bn at a high level and stable
yoy fx-adj.; 1.1x work done LTM
• Strong order backlog at EUR 24.9bn, +7% yoy and
up EUR 2.3bn ytd
HOCHTIEF Americas – 9M 2021 results
• Operational PBT 2021 of approx. EUR 320-350m,
subject to market conditions
Outlook HOCHTIEF Americas 2021
(EUR million) 9M
2021
9M
2020
9M
change yoy
Q3
2021
Q3
2020
Q3
change yoy
FY
2020
Total sales / divisional sales 10,090.7 11,270.8 -10.5% 3,428.0 3,664.3 -6.4% 14,676.1
Operational profit before tax/PBT 242.4 247.2 -1.9% 78.7 78.9 -0.3% 336.5
Operational PBT margin in % 2.4 2.2 0.2 2.3 2.2 0.1 2.3
Operational net profit 162.4 165.1 -1.6% 55.4 54.6 1.5% 244.4
EBITDA 311.9 316.8 -1.5% 107.0 98.7 8.4% 430.4
EBIT 249.4 254.6 -2.0% 85.8 82.5 4.0% 344.5
Nominal profit before tax/PBT 234.4 240.0 -2.3% 76.0 76.7 -0.9% 325.9
Nominal net profit 156.8 159.8 -1.9% 53.5 53.0 0.9% 236.5
Net cash from operating activities 72.5 309.1 -236.6 -30.3 333.7 -364.0 642.6
Net cash from op. act. pre factoring 68.6 308.4 -239.8 -47.1 283.8 -330.9 631.7
Gross operating capital expenditure 18.0 12.5 5.5 4.3 2.7 1.6 22.2
Net cash / net debt 1,427.4 1,383.9 43.5 1,427.4 1,383.9 43.5 1,399.5
New orders 11,043.9 11,693.1 -5.6% 4,260.2 5,215.5 -18.3% 15,391.8
New orders LTM 14,742.6 16,425.9 -10.2%
Work done 10,078.2 10,869.6 -7.3% 3,415.7 3,592.9 -4.9% 14,283.8
Order backlog 24,907.9 23,349.7 6.7% 24,907.9 23,349.7 6.7% 22,599.2
Employees (end of period) 11 940 12 150 -1.7% 11 940 12 150 -1.7% 12 000
Note: Operational profits are adjusted for non-operational effects
10
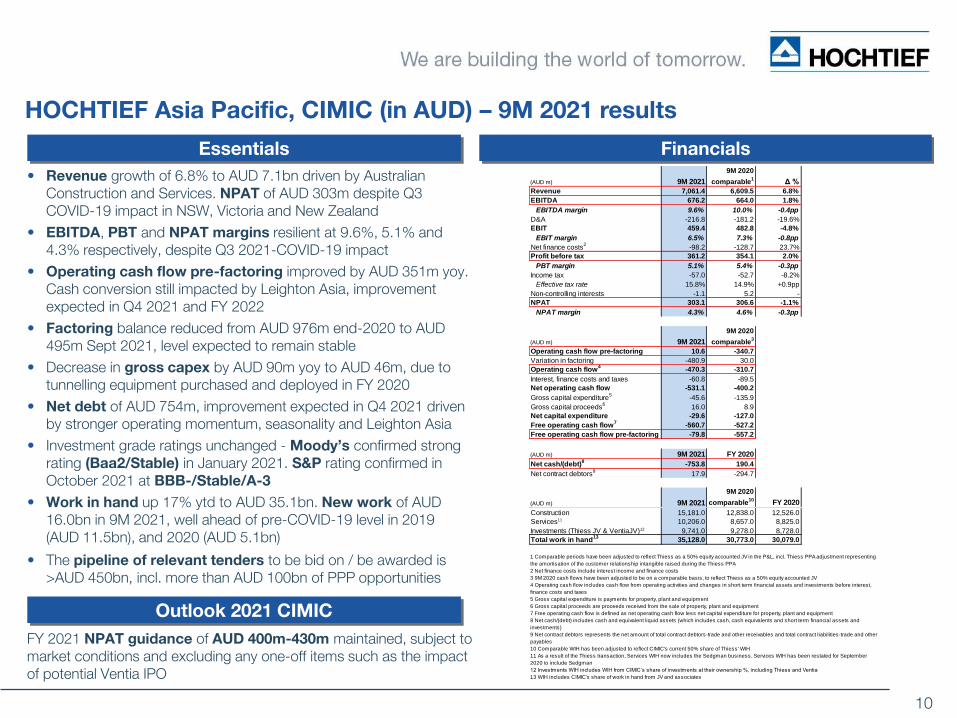
(AUD m) 9M 2021
9M 2020
comparable1
Δ %
Revenue 7,061.4 6,609.5 6.8%
EBITDA 676.2 664.0 1.8%
EBITDA margin 9.6% 10.0% -0.4pp
D&A -216.8 -181.2 -19.6%
EBIT 459.4 482.8 -4.8%
EBIT margin 6.5% 7.3% -0.8pp
Net finance costs2
-98.2 -128.7 23.7%
Profit before tax 361.2 354.1 2.0%
PBT margin 5.1% 5.4% -0.3pp
Income tax -57.0 -52.7 -8.2%
Effective tax rate 15.8% 14.9% +0.9pp
Non-controlling interests -1.1 5.2 -
NPAT 303.1 306.6 -1.1%
NPAT margin 4.3% 4.6% -0.3pp
(AUD m) 9M 2021
9M 2020
comparable3
Operating cash flow pre-factoring 10.6 -340.7
Variation in factoring -480.9 30.0
Operating cash flow4
-470.3 -310.7
Interest, finance costs and taxes -60.8 -89.5
Net operating cash flow -531.1 -400.2
Gross capital expenditure5
-45.6 -135.9
Gross capital proceeds6
16.0 8.9
Net capital expenditure -29.6 -127.0
Free operating cash flow7
-560.7 -527.2
Free operating cash flow pre-factoring -79.8 -557.2
(AUD m) 9M 2021 FY 2020
Net cash/(debt)8
-753.8 190.4
Net contract debtors9
17.9 -294.7
(AUD m) 9M 2021
9M 2020
comparable10
FY 2020
Construction 15,181.0 12,838.0 12,526.0
Services11 10,206.0 8,657.0 8,825.0
Investments (Thiess JV & VentiaJV)12 9,741.0 9,278.0 8,728.0
Total work in hand13
35,128.0 30,773.0 30,079.0
1 Comparable periods have been adjusted to reflect Thiess as a 50% equity accounted JV in the P&L, incl. Thiess PPA adjustment representing
the amortisation of the customer relationship intangible raised during the Thiess PPA
2 Net finance costs include interest income and finance costs
3 9M 2020 cash flows have been adjusted to be on a comparable basis, to reflect Thiess as a 50% equity accounted JV
4 Operating cash flow includes cash flow from operating activities and changes in short term financial assets and investments before interest,
finance costs and taxes
5 Gross capital expenditure is payments for property, plant and equipment
6 Gross capital proceeds are proceeds received from the sale of property, plant and equipment
7 Free operating cash flow is defined as net operating cash flow less net capital expenditure for property, plant and equipment
8 Net cash/(debt) includes cash and equivalent liquid assets (which includes cash, cash equivalents and short term financial assets and
investments)
9 Net contract debtors represents the net amount of total contract debtors-trade and other receivables and total contract liabilities-trade and other
payables
10 Comparable WIH has been adjusted to reflect CIMIC's current 50% share of Thiess' WIH
11 As a result of the Thiess transaction, Services WIH now includes the Sedgman business. Services WIH has been restated for September
2020 to include Sedgman
12 Investments WIH includes WIH from CIMIC’s share of investments at their ownership %, including Thiess and Ventia
13 WIH includes CIMIC's share of work in hand from JV and associates
HOCHTIEF Asia Pacific, CIMIC (in AUD) – 9M 2021 results
Essentials
• Revenue growth of 6.8% to AUD 7.1bn driven by Australian Construction and Services. NPAT of AUD 303m despite Q3 COVID-19 impact in NSW, Victoria and New Zealand
• EBITDA, PBT and NPAT margins resilient at 9.6%, 5.1% and 4.3% respectively, despite Q3 2021-COVID-19 impact
• Operating cash flow pre-factoring improved by AUD 351m yoy. Cash conversion still impacted by Leighton Asia, improvement expected in Q4 2021 and FY 2022
• Factoring balance reduced from AUD 976m end-2020 to AUD 495m Sept 2021, level expected to remain stable
• Decrease in gross capex by AUD 90m yoy to AUD 46m, due to tunnelling equipment purchased and deployed in FY 2020
• Net debt of AUD 754m, improvement expected in Q4 2021 driven by stronger operating momentum, seasonality and Leighton Asia
• Investment grade ratings unchanged - Moody’s confirmed strong rating (Baa2/Stable) in January 2021. S&P rating confirmed in October 2021 at BBB-/Stable/A-3
• Work in hand up 17% ytd to AUD 35.1bn. New work of AUD 16.0bn in 9M 2021, well ahead of pre-COVID-19 level in 2019 (AUD 11.5bn), and 2020 (AUD 5.1bn)
• The pipeline of relevant tenders to be bid on / be awarded is >AUD 450bn, incl. more than AUD 100bn of PPP opportunities
Financials
Outlook 2021 CIMIC
FY 2021 NPAT guidance of AUD 400m-430m maintained, subject to market conditions and excluding any one-off items such as the impact of potential Ventia IPO
11
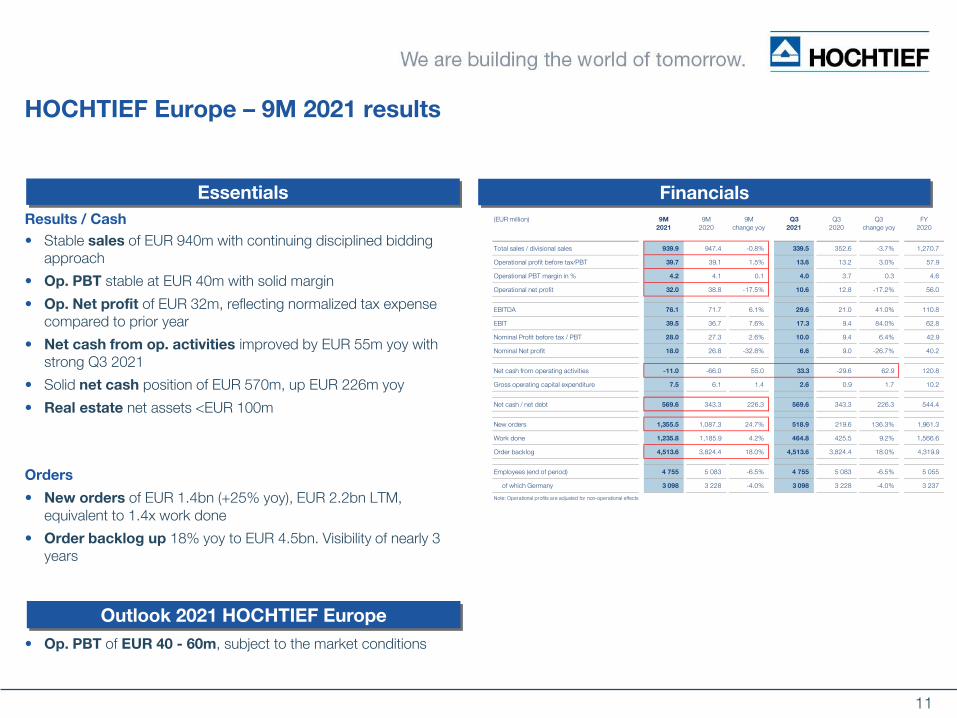
HOCHTIEF Europe – 9M 2021 results
Essentials Financials
Outlook 2021 HOCHTIEF Europe
• Op. PBT of EUR 40 - 60m, subject to the market conditions
Results / Cash
• Stable sales of EUR 940m with continuing disciplined bidding approach
• Op. PBT stable at EUR 40m with solid margin
• Op. Net profit of EUR 32m, reflecting normalized tax expense compared to prior year
• Net cash from op. activities improved by EUR 55m yoy with strong Q3 2021
• Solid net cash position of EUR 570m, up EUR 226m yoy
• Real estate net assets <EUR 100m
Orders
• New orders of EUR 1.4bn (+25% yoy), EUR 2.2bn LTM, equivalent to 1.4x work done
• Order backlog up 18% yoy to EUR 4.5bn. Visibility of nearly 3 years
(EUR million) 9M
2021
9M
2020
9M
change yoy
Q3
2021
Q3
2020
Q3
change yoy
FY
2020
Total sales / divisional sales 939.9 947.4 -0.8% 339.5 352.6 -3.7% 1,270.7
Operational profit before tax/PBT 39.7 39.1 1.5% 13.6 13.2 3.0% 57.9
Operational PBT margin in % 4.2 4.1 0.1 4.0 3.7 0.3 4.6
Operational net profit 32.0 38.8 -17.5% 10.6 12.8 -17.2% 56.0
EBITDA 76.1 71.7 6.1% 29.6 21.0 41.0% 110.8
EBIT 39.5 36.7 7.6% 17.3 9.4 84.0% 62.8
Nominal Profit before tax / PBT 28.0 27.3 2.6% 10.0 9.4 6.4% 42.9
Nominal Net profit 18.0 26.8 -32.8% 6.6 9.0 -26.7% 40.2
Net cash from operating activities -11.0 -66.0 55.0 33.3 -29.6 62.9 120.8
Gross operating capital expenditure 7.5 6.1 1.4 2.6 0.9 1.7 10.2
Net cash / net debt 569.6 343.3 226.3 569.6 343.3 226.3 544.4
New orders 1,355.5 1,087.3 24.7% 518.9 219.6 136.3% 1,961.3
Work done 1,235.8 1,185.9 4.2% 464.8 425.5 9.2% 1,566.6
Order backlog 4,513.6 3,824.4 18.0% 4,513.6 3,824.4 18.0% 4,319.9
Employees (end of period) 4 755 5 083 -6.5% 4 755 5 083 -6.5% 5 055
of which Germany 3 098 3 228 -4.0% 3 098 3 228 -4.0% 3 237
Note: Operational profits are adjusted for non-operational effects
12
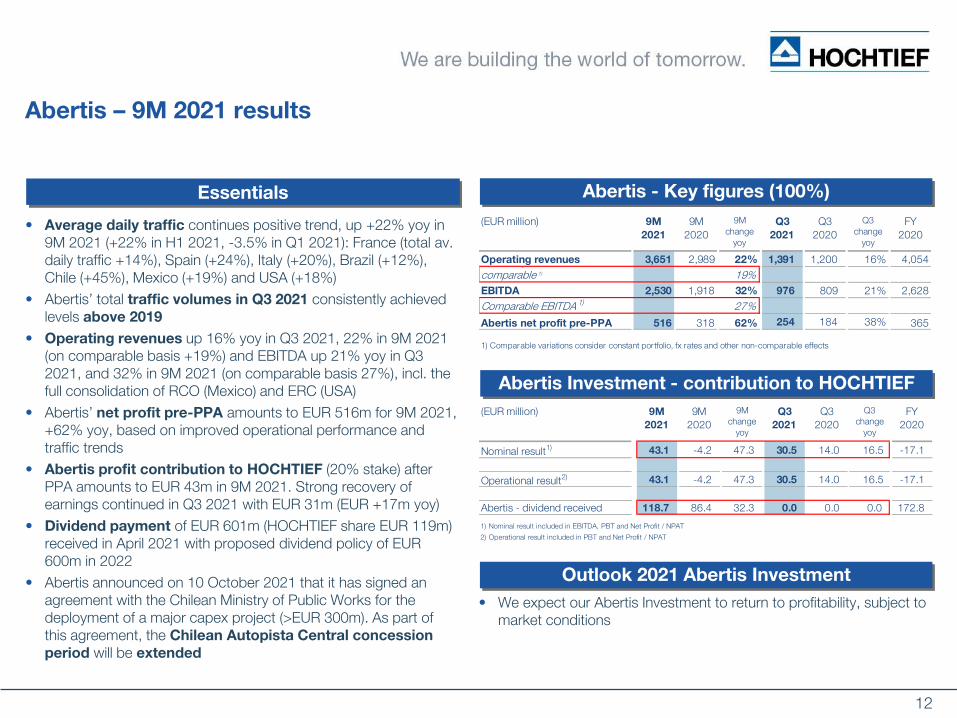
Abertis – 9M 2021 results
• Average daily traffic continues positive trend, up +22% yoy in 9M 2021 (+22% in H1 2021, -3.5% in Q1 2021): France (total av. daily traffic +14%), Spain (+24%), Italy (+20%), Brazil (+12%), Chile (+45%), Mexico (+19%) and USA (+18%)
• Abertis’ total traffic volumes in Q3 2021 consistently achieved levels above 2019
• Operating revenues up 16% yoy in Q3 2021, 22% in 9M 2021 (on comparable basis +19%) and EBITDA up 21% yoy in Q3 2021, and 32% in 9M 2021 (on comparable basis 27%), incl. the full consolidation of RCO (Mexico) and ERC (USA)
• Abertis’ net profit pre-PPA amounts to EUR 516m for 9M 2021, +62% yoy, based on improved operational performance and traffic trends
• Abertis profit contribution to HOCHTIEF (20% stake) after PPA amounts to EUR 43m in 9M 2021. Strong recovery of earnings continued in Q3 2021 with EUR 31m (EUR +17m yoy)
• Dividend payment of EUR 601m (HOCHTIEF share EUR 119m) received in April 2021 with proposed dividend policy of EUR 600m in 2022
• Abertis announced on 10 October 2021 that it has signed an agreement with the Chilean Ministry of Public Works for the deployment of a major capex project (>EUR 300m). As part of this agreement, the Chilean Autopista Central concession
period will be extended
• We expect our Abertis Investment to return to profitability, subject to market conditions
(EUR million) 9M
2021
9M
2020
9M
change
yoy
Q3
2021
Q3
2020
Q3
change
yoy
FY
2020
Nominal result1)43.1 -4.2 47.3 30.5 14.0 16.5 -17.1
Operational result2)43.1 -4.2 47.3 30.5 14.0 16.5 -17.1
Abertis - dividend received 118.7 86.4 32.3 0.0 0.0 0.0 172.8
1) Nominal result included in EBITDA, PBT and Net Profit / NPAT
2) Operational result included in PBT and Net Profit / NPAT
(EUR million) 9M
2021
9M
2020
9M
change
yoy
Q3
2021
Q3
2020
Q3
change
yoy
FY
2020
Operating revenues 3,651 2,989 22% 1,391 1,200 16% 4,054 Operating revenues comparable 1) 19%
EBITDA 2,530 1,918 32% 976 809 21% 2,628
Comparable EBITDA 1) 27%
Abertis net profit pre-PPA 516 318 62% 254 184 38% 365
1) Comparable variations consider constant portfolio, fx rates and other non-comparable effects
Essentials Abertis - Key figures (100%)
Abertis Investment - contribution to HOCHTIEF
Outlook 2021 Abertis Investment
13
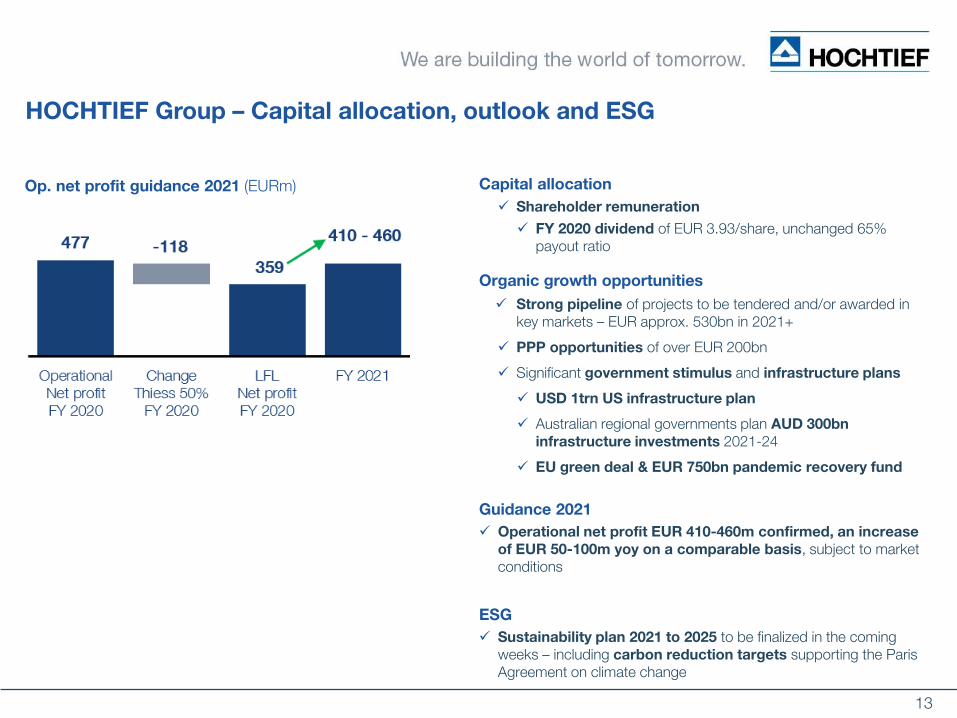
Capital allocation
Shareholder remuneration
FY 2020 dividend of EUR 3.93/share, unchanged 65% payout ratio
Organic growth opportunities
Strong pipeline of projects to be tendered and/or awarded in key markets – EUR approx. 530bn in 2021+
PPP opportunities of over EUR 200bn
Significant government stimulus and infrastructure plans
USD 1trn US infrastructure plan
Australian regional governments plan AUD 300bn
infrastructure investments 2021-24
EU green deal & EUR 750bn pandemic recovery fund
Guidance 2021
Operational net profit EUR 410-460m confirmed, an increase
of EUR 50-100m yoy on a comparable basis, subject to market conditions
ESG
Sustainability plan 2021 to 2025 to be finalized in the coming weeks – including carbon reduction targets supporting the Paris Agreement on climate change
HOCHTIEF Group – Capital allocation, outlook and ESG
Op. net profit guidance 2021 (EURm)
14
Appendix: 9M 2021
Heinrich Campus, Düsseldorf, Germany
©Marcel Steinbach © C
PB
Contr
acto
rs©
Vla
dim
ir D
ind
a
15
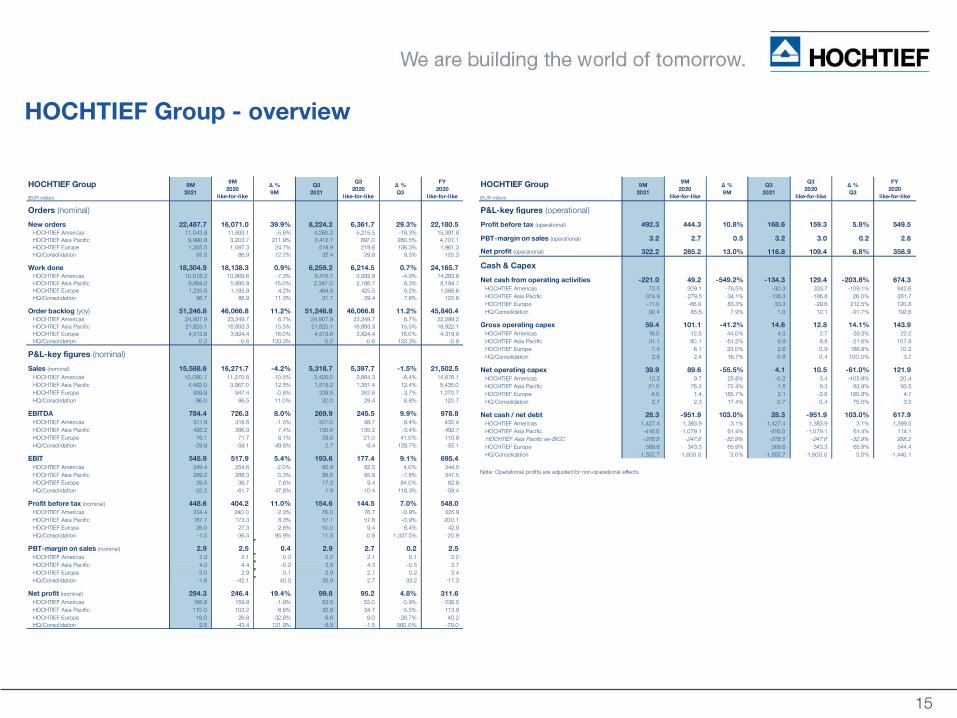
HOCHTIEF Group - overview
HOCHTIEF Group
(EUR million)
P&L-key figures (operational)
Profit before tax (operational) 492.3 444.3 10.8% 168.6 159.3 5.8% 549.5
PBT-margin on sales (operational) 3.2 2.7 0.5 3.2 3.0 0.2 2.6
Net profit (operational) 322.2 285.2 13.0% 116.8 109.4 6.8% 358.9
Cash & Capex
Net cash from operating activities -221.0 49.2 -549.2% -134.3 129.4 -203.8% 674.3
HOCHTIEF Americas 72.5 309.1 -76.5% -30.3 333.7 -109.1% 642.6
HOCHTIEF Asia Pacific -374.9 -279.5 -34.1% -138.3 -186.8 26.0% -281.7
HOCHTIEF Europe -11.0 -66.0 83.3% 33.3 -29.6 212.5% 120.8
HQ/Consolidation 92.4 85.6 7.9% 1.0 12.1 -91.7% 192.6
Gross operating capex 59.4 101.1 -41.2% 14.6 12.8 14.1% 143.9
HOCHTIEF Americas 18.0 12.5 44.0% 4.3 2.7 59.3% 22.2
HOCHTIEF Asia Pacific 31.1 80.1 -61.2% 6.9 8.8 -21.6% 107.8
HOCHTIEF Europe 7.5 6.1 23.0% 2.6 0.9 188.9% 10.2
HQ/Consolidation 2.8 2.4 16.7% 0.8 0.4 100.0% 3.7
Net operating capex 39.9 89.6 -55.5% 4.1 10.5 -61.0% 121.9
HOCHTIEF Americas 12.2 9.7 25.8% -0.2 3.4 -105.9% 20.4
HOCHTIEF Asia Pacific 21.0 76.2 -72.4% 1.5 9.3 -83.9% 93.5
HOCHTIEF Europe 4.0 1.4 185.7% 2.1 -2.6 180.8% 4.7
HQ/Consolidation 2.7 2.3 17.4% 0.7 0.4 75.0% 3.3
Net cash / net debt 28.3 -951.9 103.0% 28.3 -951.9 103.0% 617.9
HOCHTIEF Americas 1,427.4 1,383.9 3.1% 1,427.4 1,383.9 3.1% 1,399.5
HOCHTIEF Asia Pacific -416.0 -1,079.1 61.4% -416.0 -1,079.1 61.4% 114.1
HOCHTIEF Asia Pacific ex-BICC -378.5 -247.6 -52.9% -378.5 -247.6 -52.9% 958.2
HOCHTIEF Europe 569.6 343.3 65.9% 569.6 343.3 65.9% 544.4
HQ/Consolidation -1,552.7 -1,600.0 3.0% -1,552.7 -1,600.0 3.0% -1,440.1
Note: Operational profits are adjusted for non-operational effects
9M
2021
9M
2020
like-for-like
Δ %
9M
Q3
2021
Q3
2020
like-for-like
Δ %
Q3
FY
2020
like-for-like
HOCHTIEF Group
(EUR million)
Orders (nominal)
New orders 22,487.7 16,071.0 39.9% 8,224.2 6,361.7 29.3% 22,180.5
HOCHTIEF Americas 11,043.9 11,693.1 -5.6% 4,260.2 5,215.5 -18.3% 15,391.8
HOCHTIEF Asia Pacific 9,990.8 3,203.7 211.9% 3,412.7 897.0 280.5% 4,707.1
HOCHTIEF Europe 1,355.5 1,087.3 24.7% 518.9 219.6 136.3% 1,961.3
HQ/Consolidation 97.5 86.9 12.2% 32.4 29.6 9.5% 120.3
Work done 18,304.9 18,138.3 0.9% 6,259.2 6,214.5 0.7% 24,165.7
HOCHTIEF Americas 10,078.2 10,869.6 -7.3% 3,415.7 3,592.9 -4.9% 14,283.8
HOCHTIEF Asia Pacific 6,894.2 5,995.9 15.0% 2,347.0 2,166.7 8.3% 8,194.7
HOCHTIEF Europe 1,235.8 1,185.9 4.2% 464.8 425.5 9.2% 1,566.6
HQ/Consolidation 96.7 86.9 11.3% 31.7 29.4 7.8% 120.6
Order backlog (yoy) 51,246.8 46,066.8 11.2% 51,246.8 46,066.8 11.2% 45,840.4
HOCHTIEF Americas 24,907.9 23,349.7 6.7% 24,907.9 23,349.7 6.7% 22,599.2
HOCHTIEF Asia Pacific 21,825.1 18,893.3 15.5% 21,825.1 18,893.3 15.5% 18,922.1
HOCHTIEF Europe 4,513.6 3,824.4 18.0% 4,513.6 3,824.4 18.0% 4,319.9
HQ/Consolidation 0.2 -0.6 133.3% 0.2 -0.6 133.3% -0.8
P&L-key figures (nominal)
Sales (nominal) 15,588.6 16,271.7 -4.2% 5,318.7 5,397.7 -1.5% 21,502.5
HOCHTIEF Americas 10,090.7 11,270.8 -10.5% 3,428.0 3,664.3 -6.4% 14,676.1
HOCHTIEF Asia Pacific 4,462.0 3,967.0 12.5% 1,519.2 1,351.4 12.4% 5,435.0
HOCHTIEF Europe 939.9 947.4 -0.8% 339.5 352.6 -3.7% 1,270.7
HQ/Consolidation 96.0 86.5 11.0% 32.0 29.4 8.8% 120.7
EBITDA 784.4 726.3 8.0% 269.9 245.5 9.9% 978.8
HOCHTIEF Americas 311.9 316.8 -1.5% 107.0 98.7 8.4% 430.4
HOCHTIEF Asia Pacific 426.2 396.9 7.4% 130.6 135.2 -3.4% 492.7
HOCHTIEF Europe 76.1 71.7 6.1% 29.6 21.0 41.0% 110.8
HQ/Consolidation -29.8 -59.1 49.6% 2.7 -9.4 128.7% -55.1
EBIT 545.9 517.9 5.4% 193.6 177.4 9.1% 695.4
HOCHTIEF Americas 249.4 254.6 -2.0% 85.8 82.5 4.0% 344.5
HOCHTIEF Asia Pacific 289.2 288.3 0.3% 88.6 95.9 -7.6% 347.5
HOCHTIEF Europe 39.5 36.7 7.6% 17.3 9.4 84.0% 62.8
HQ/Consolidation -32.2 -61.7 47.8% 1.9 -10.4 118.3% -59.4
Profit before tax (nominal) 448.6 404.2 11.0% 154.6 144.5 7.0% 548.0
HOCHTIEF Americas 234.4 240.0 -2.3% 76.0 76.7 -0.9% 325.9
HOCHTIEF Asia Pacific 187.7 173.3 8.3% 57.1 57.6 -0.9% 200.1
HOCHTIEF Europe 28.0 27.3 2.6% 10.0 9.4 6.4% 42.9
HQ/Consolidation -1.5 -36.4 95.9% 11.5 0.8 1,337.5% -20.9
PBT-margin on sales (nominal) 2.9 2.5 0.4 2.9 2.7 0.2 2.5
HOCHTIEF Americas 2.3 2.1 0.2 2.2 2.1 0.1 2.2
HOCHTIEF Asia Pacific 4.2 4.4 -0.2 3.8 4.3 -0.5 3.7
HOCHTIEF Europe 3.0 2.9 0.1 2.9 2.7 0.2 3.4
HQ/Consolidation -1.6 -42.1 40.5 35.9 2.7 33.2 -17.3
Net profit (nominal) 294.3 246.4 19.4% 99.8 95.2 4.8% 311.6
HOCHTIEF Americas 156.8 159.8 -1.9% 53.5 53.0 0.9% 236.5
HOCHTIEF Asia Pacific 110.0 103.2 6.6% 32.8 34.7 -5.5% 113.9
HOCHTIEF Europe 18.0 26.8 -32.8% 6.6 9.0 -26.7% 40.2
HQ/Consolidation 9.5 -43.4 121.9% 6.9 -1.5 560.0% -79.0
FY
2020
like-for-like
9M
2021
9M
2020
like-for-like
Δ %
9M
Q3
2021
Q3
2020
like-for-like
Δ %
Q3
16
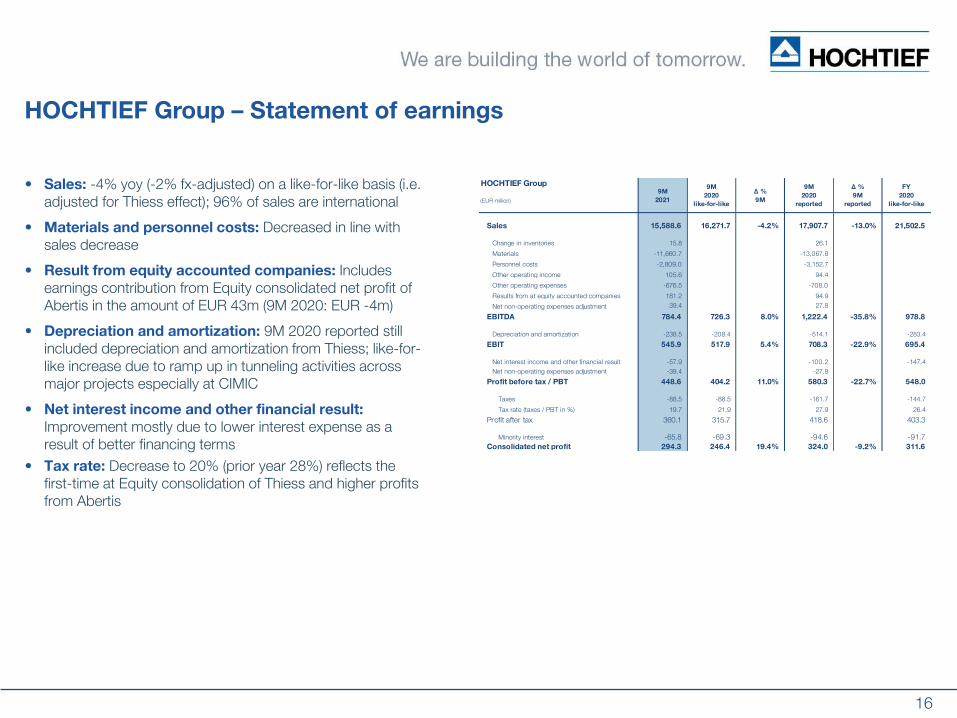
HOCHTIEF Group – Statement of earnings
• Sales: -4% yoy (-2% fx-adjusted) on a like-for-like basis (i.e. adjusted for Thiess effect); 96% of sales are international
• Materials and personnel costs: Decreased in line with sales decrease
• Result from equity accounted companies: Includes earnings contribution from Equity consolidated net profit of Abertis in the amount of EUR 43m (9M 2020: EUR -4m)
• Depreciation and amortization: 9M 2020 reported still included depreciation and amortization from Thiess; like-for-like increase due to ramp up in tunneling activities across major projects especially at CIMIC
• Net interest income and other financial result:
Improvement mostly due to lower interest expense as a result of better financing terms
• Tax rate: Decrease to 20% (prior year 28%) reflects thefirst-time at Equity consolidation of Thiess and higher profitsfrom Abertis
HOCHTIEF Group
(EUR million)
Sales 15,588.6 16,271.7 -4.2% 17,907.7 -13.0% 21,502.5
Change in inventories 15.8 n. a. 26.1 39.5%
Materials -11,660.7 n. a. -13,067.8 -10.8%
Personnel costs -2,809.0 n. a. -3,152.7 -10.9%
Other operating income 105.6 n. a. 94.4 11.9%
Other operating expenses -676.5 n. a. -708.0 -4.4%
Results from at equity accounted companies 181.2 n. a. 94.9 -90.9%
Net non-operating expenses adjustment 39.4 n. a. 27.8 -41.7%
EBITDA 784.4 726.3 8.0% 1,222.4 -35.8% 978.8
Depreciation and amortization -238.5 -208.4 14.4% -514.1 -53.6% -283.4
EBIT 545.9 517.9 5.4% 708.3 -22.9% 695.4
Net interest income and other financial result -57.9 -113.7 -49.1% -100.2 -42.2% -147.4
Net non-operating expenses adjustment -39.4 0.0 n. a. -27.8 -41.7%
Profit before tax / PBT 448.6 404.2 11.0% 580.3 -22.7% 548.0
Taxes -88.5 -88.5 0.0% -161.7 -45.3% -144.7
Tax rate (taxes / PBT in %) 19.7 21.9 -2.2 27.9 -8.2 26.4
Profit after tax 360.1 315.7 14.1% 418.6 -14.0% 403.3
Minority interest -65.8 -69.3 -5.1% -94.6 -30.4% -91.7
Consolidated net profit 294.3 246.4 19.4% 324.0 -9.2% 311.6
9M
2020
reported
∆ %
9M
reported
9M
2021
9M
2020
like-for-like
∆ %
9M
FY
2020
like-for-like
17
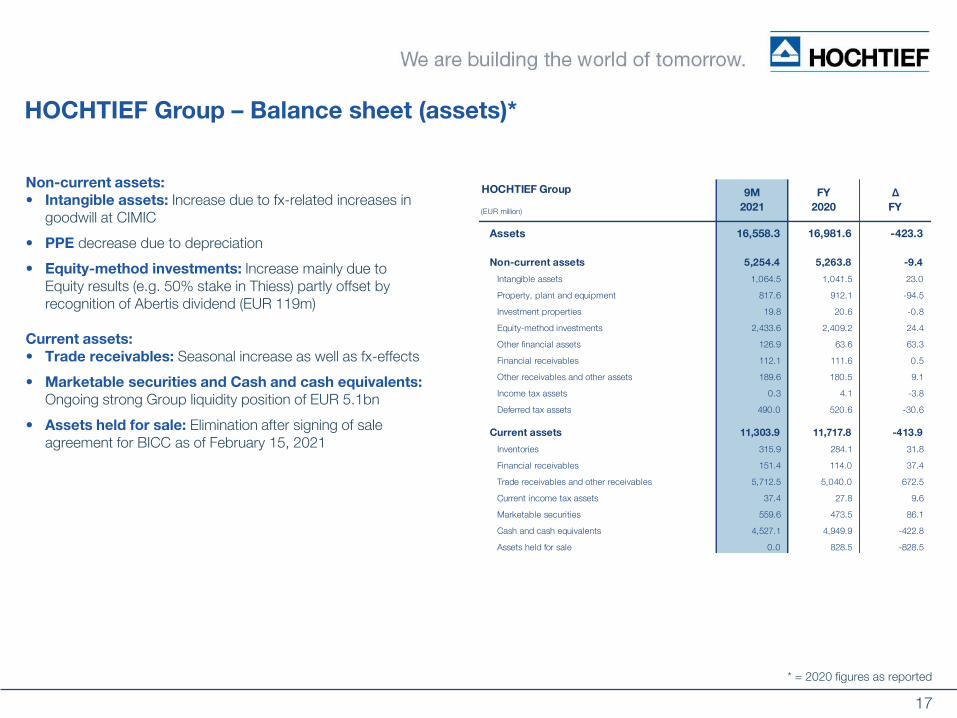
HOCHTIEF Group – Balance sheet (assets)*
Non-current assets:
• Intangible assets: Increase due to fx-related increases in goodwill at CIMIC
• PPE decrease due to depreciation
• Equity-method investments: Increase mainly due to Equity results (e.g. 50% stake in Thiess) partly offset by recognition of Abertis dividend (EUR 119m)
Current assets:
• Trade receivables: Seasonal increase as well as fx-effects
• Marketable securities and Cash and cash equivalents:
Ongoing strong Group liquidity position of EUR 5.1bn
• Assets held for sale: Elimination after signing of sale agreement for BICC as of February 15, 2021
* = 2020 figures as reported
HOCHTIEF Group
(EUR million)
Assets 16,558.3 16,981.6 -423.3
Non-current assets 5,254.4 5,263.8 -9.4
Intangible assets 1,064.5 1,041.5 23.0
Property, plant and equipment 817.6 912.1 -94.5
Investment properties 19.8 20.6 -0.8
Equity-method investments 2,433.6 2,409.2 24.4
Other financial assets 126.9 63.6 63.3
Financial receivables 112.1 111.6 0.5
Other receivables and other assets 189.6 180.5 9.1
Income tax assets 0.3 4.1 -3.8
Deferred tax assets 490.0 520.6 -30.6
Current assets 11,303.9 11,717.8 -413.9
Inventories 315.9 284.1 31.8
Financial receivables 151.4 114.0 37.4
Trade receivables and other receivables 5,712.5 5,040.0 672.5
Current income tax assets 37.4 27.8 9.6
Marketable securities 559.6 473.5 86.1
Cash and cash equivalents 4,527.1 4,949.9 -422.8
Assets held for sale 0.0 828.5 -828.5
Δ
FY
FY
2020
9M
2021
18
HOCHTIEF Group
(EUR million)
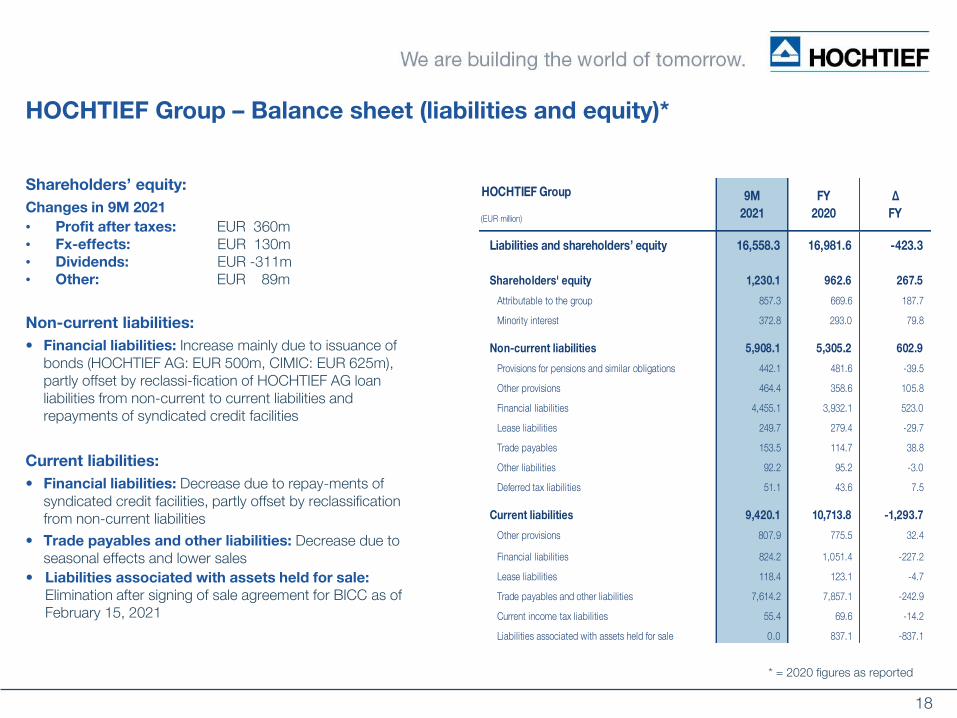
Liabilities and shareholders’ equity 16,558.3 16,981.6 -423.3
Shareholders' equity 1,230.1 962.6 267.5
Attributable to the group 857.3 669.6 187.7
Minority interest 372.8 293.0 79.8
Non-current liabilities 5,908.1 5,305.2 602.9
Provisions for pensions and similar obligations 442.1 481.6 -39.5
Other provisions 464.4 358.6 105.8
Financial liabilities 4,455.1 3,932.1 523.0
Lease liabilities 249.7 279.4 -29.7
Trade payables 153.5 114.7 38.8
Other liabilities 92.2 95.2 -3.0
Deferred tax liabilities 51.1 43.6 7.5
Current liabilities 9,420.1 10,713.8 -1,293.7
Other provisions 807.9 775.5 32.4
Financial liabilities 824.2 1,051.4 -227.2
Lease liabilities 118.4 123.1 -4.7
Trade payables and other liabilities 7,614.2 7,857.1 -242.9
Current income tax liabilities 55.4 69.6 -14.2
Liabilities associated with assets held for sale 0.0 837.1 -837.1
FY
2020
9M
2021
Δ
FY
HOCHTIEF Group – Balance sheet (liabilities and equity)*
Shareholders’ equity:
Changes in 9M 2021
• Profit after taxes: EUR 360m• Fx-effects: EUR 130m• Dividends: EUR -311m• Other: EUR 89m
Non-current liabilities:
• Financial liabilities: Increase mainly due to issuance of bonds (HOCHTIEF AG: EUR 500m, CIMIC: EUR 625m), partly offset by reclassi-fication of HOCHTIEF AG loan liabilities from non-current to current liabilities and repayments of syndicated credit facilities
Current liabilities:
• Financial liabilities: Decrease due to repay-ments of syndicated credit facilities, partly offset by reclassification from non-current liabilities
• Trade payables and other liabilities: Decrease due to seasonal effects and lower sales
• Liabilities associated with assets held for sale:
Elimination after signing of sale agreement for BICC as of February 15, 2021
* = 2020 figures as reported
19
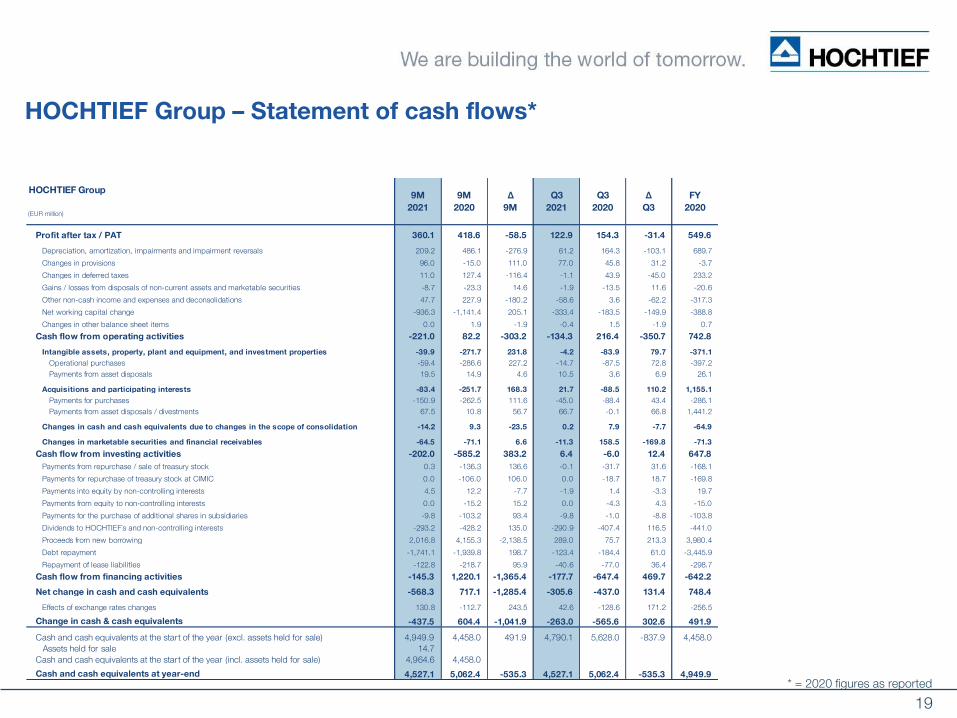
HOCHTIEF Group – Statement of cash flows*
* = 2020 figures as reported
HOCHTIEF Group
(EUR million)
Profit after tax / PAT 360.1 418.6 -58.5 122.9 154.3 -31.4 549.6
Depreciation, amortization, impairments and impairment reversals 209.2 486.1 -276.9 61.2 164.3 -103.1 689.7
Changes in provisions 96.0 -15.0 111.0 77.0 45.8 31.2 -3.7
Changes in deferred taxes 11.0 127.4 -116.4 -1.1 43.9 -45.0 233.2
Gains / losses from disposals of non-current assets and marketable securities -8.7 -23.3 14.6 -1.9 -13.5 11.6 -20.6
Other non-cash income and expenses and deconsolidations 47.7 227.9 -180.2 -58.6 3.6 -62.2 -317.3
Net working capital change -936.3 -1,141.4 205.1 -333.4 -183.5 -149.9 -388.8
Changes in other balance sheet items 0.0 1.9 -1.9 -0.4 1.5 -1.9 0.7
Cash flow from operating activities -221.0 82.2 -303.2 -134.3 216.4 -350.7 742.8
Intangible assets, property, plant and equipment, and investment properties -39.9 -271.7 231.8 -4.2 -83.9 79.7 -371.1
Operational purchases -59.4 -286.6 227.2 -14.7 -87.5 72.8 -397.2
Payments from asset disposals 19.5 14.9 4.6 10.5 3.6 6.9 26.1
Acquisitions and participating interests -83.4 -251.7 168.3 21.7 -88.5 110.2 1,155.1
Payments for purchases -150.9 -262.5 111.6 -45.0 -88.4 43.4 -286.1
Payments from asset disposals / divestments 67.5 10.8 56.7 66.7 -0.1 66.8 1,441.2
Changes in cash and cash equivalents due to changes in the scope of consolidation -14.2 9.3 -23.5 0.2 7.9 -7.7 -64.9
Changes in marketable securities and financial receivables -64.5 -71.1 6.6 -11.3 158.5 -169.8 -71.3
Cash flow from investing activities -202.0 -585.2 383.2 6.4 -6.0 12.4 647.8
Payments from repurchase / sale of treasury stock 0.3 -136.3 136.6 -0.1 -31.7 31.6 -168.1
Payments for repurchase of treasury stock at CIMIC 0.0 -106.0 106.0 0.0 -18.7 18.7 -169.8
Payments into equity by non-controlling interests 4.5 12.2 -7.7 -1.9 1.4 -3.3 19.7
Payments from equity to non-controlling interests 0.0 -15.2 15.2 0.0 -4.3 4.3 -15.0
Payments for the purchase of additional shares in subsidiaries -9.8 -103.2 93.4 -9.8 -1.0 -8.8 -103.8
Dividends to HOCHTIEF`s and non-controlling interests -293.2 -428.2 135.0 -290.9 -407.4 116.5 -441.0
Proceeds from new borrowing 2,016.8 4,155.3 -2,138.5 289.0 75.7 213.3 3,980.4
Debt repayment -1,741.1 -1,939.8 198.7 -123.4 -184.4 61.0 -3,445.9
Repayment of lease liabilities -122.8 -218.7 95.9 -40.6 -77.0 36.4 -298.7
Cash flow from financing activities -145.3 1,220.1 -1,365.4 -177.7 -647.4 469.7 -642.2
Net change in cash and cash equivalents -568.3 717.1 -1,285.4 -305.6 -437.0 131.4 748.4
Effects of exchange rates changes 130.8 -112.7 243.5 42.6 -128.6 171.2 -256.5
Change in cash & cash equivalents -437.5 604.4 -1,041.9 -263.0 -565.6 302.6 491.9
Cash and cash equivalents at the start of the year (excl. assets held for sale) 4,949.9 4,458.0 491.9 4,790.1 5,628.0 -837.9 4,458.0
Assets held for sale 14.7
Cash and cash equivalents at the start of the year (incl. assets held for sale) 4,964.6 4,458.0
Cash and cash equivalents at year-end 4,527.1 5,062.4 -535.3 4,527.1 5,062.4 -535.3 4,949.9
FY
2020
9M
2021
9M
2020
∆
9M
Q3
2021
Q3
2020
∆
Q3
20
350177
284
544
86
536
1,225
249
505
476 592
666
11
0
12
150
200
400
600
800
1,000
1,200
1,400
ufn 2021 2022 2023 2024 2025 2026 2027 2029 2031 2034 2037 2045
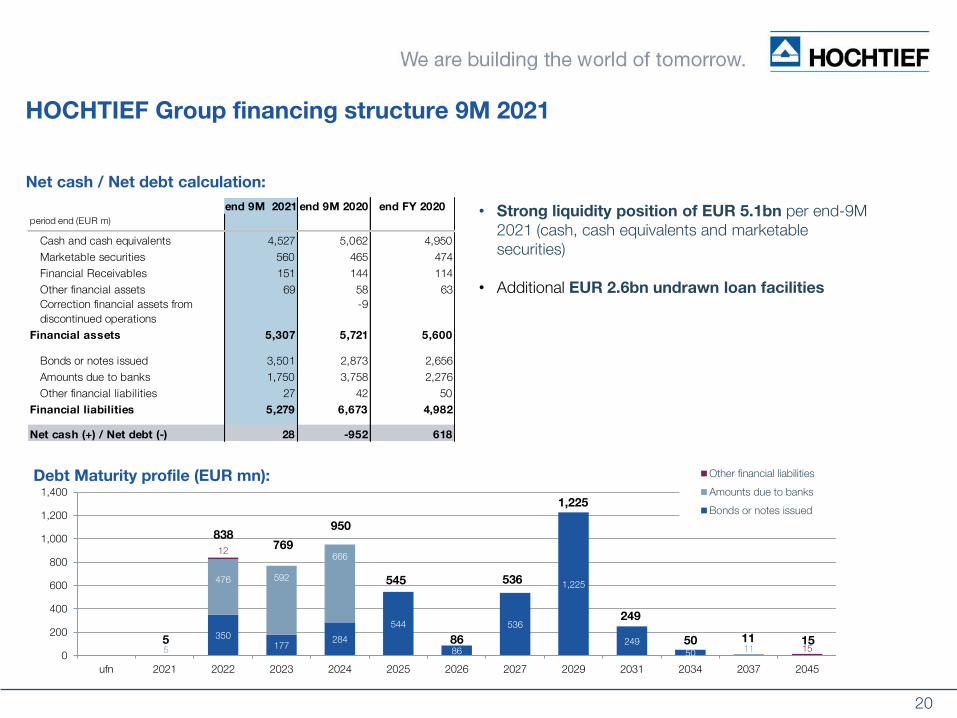
Debt Maturity profile (EUR mn): Other financial liabilities
Amounts due to banks
Bonds or notes issued
950
769
15
1,225
5 86
536
1150
545
249
838
HOCHTIEF Group financing structure 9M 2021
Net cash / Net debt calculation:
• Strong liquidity position of EUR 5.1bn per end-9M 2021 (cash, cash equivalents and marketable securities)
• Additional EUR 2.6bn undrawn loan facilities
end 9M 2021 end 9M 2020 end FY 2020
period end (EUR m)
Cash and cash equivalents 4,527 5,062 4,950
Marketable securities 560 465 474
Financial Receivables 151 144 114
Other financial assets 69 58 63
Correction financial assets from
discontinued operations
-9
Financial assets 5,307 5,721 5,600
Bonds or notes issued 3,501 2,873 2,656
Amounts due to banks 1,750 3,758 2,276
Other financial liabilities 27 42 50
Financial liabilities 5,279 6,673 4,982
Net cash (+) / Net debt (-) 28 -952 618
21
HOCHTIEF Americas
Rodanthe Bridge, Rodanthe, NC, USA
© C
JF-D
esi
gn
© J
eff A
llen
© U
GL
© F
latir
on
22
42%
10%
18%
20%
10%Highway
Bridges
Transit
Airports
Water
14%
42%11%
16%
3%
2%
4%8% Transportation/Misc
Commercial/Data/Retail
Education/R&D
Healthcare
Hotel/Residential
Industrial
Public/Justice
Sports/Entertainment
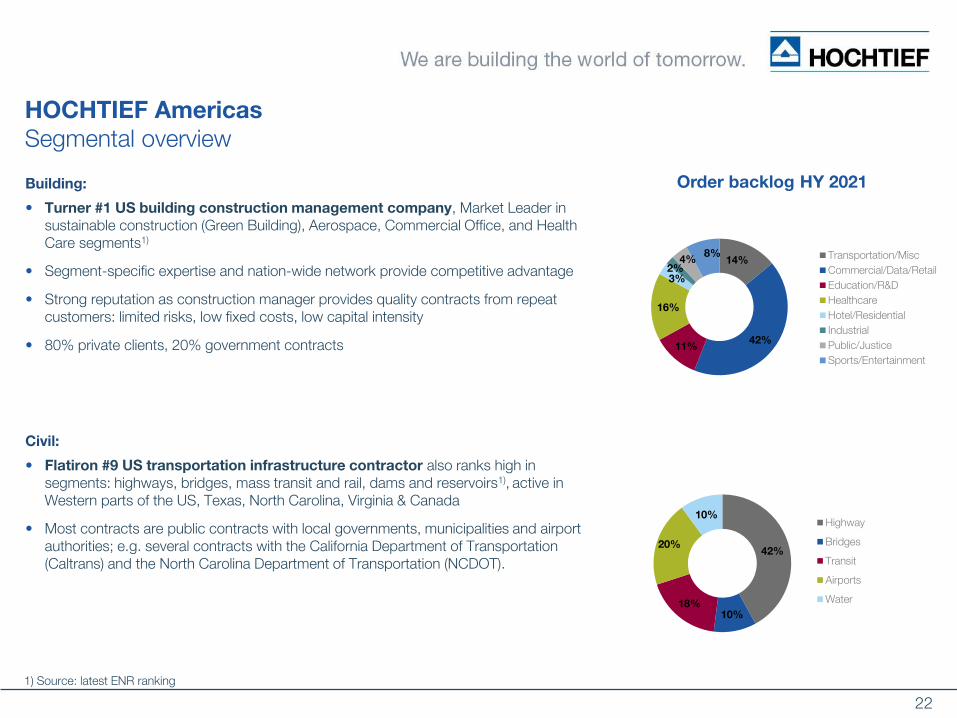
Civil:
• Flatiron #9 US transportation infrastructure contractor also ranks high in segments: highways, bridges, mass transit and rail, dams and reservoirs1), active in Western parts of the US, Texas, North Carolina, Virginia & Canada
• Most contracts are public contracts with local governments, municipalities and airport authorities; e.g. several contracts with the California Department of Transportation (Caltrans) and the North Carolina Department of Transportation (NCDOT).
HOCHTIEF Americas
Segmental overview
Building:
• Turner #1 US building construction management company, Market Leader in sustainable construction (Green Building), Aerospace, Commercial Office, and Health Care segments1)
• Segment-specific expertise and nation-wide network provide competitive advantage
• Strong reputation as construction manager provides quality contracts from repeat customers: limited risks, low fixed costs, low capital intensity
• 80% private clients, 20% government contracts
1) Source: latest ENR ranking
Order backlog HY 2021

23
HOCHTIEF Asia Pacific
The Annex, Brisbane, QLD, Australia
©Thiess
© U
GL
© A
nd
rew
Porfyri
24
HOCHTIEF Asia Pacific
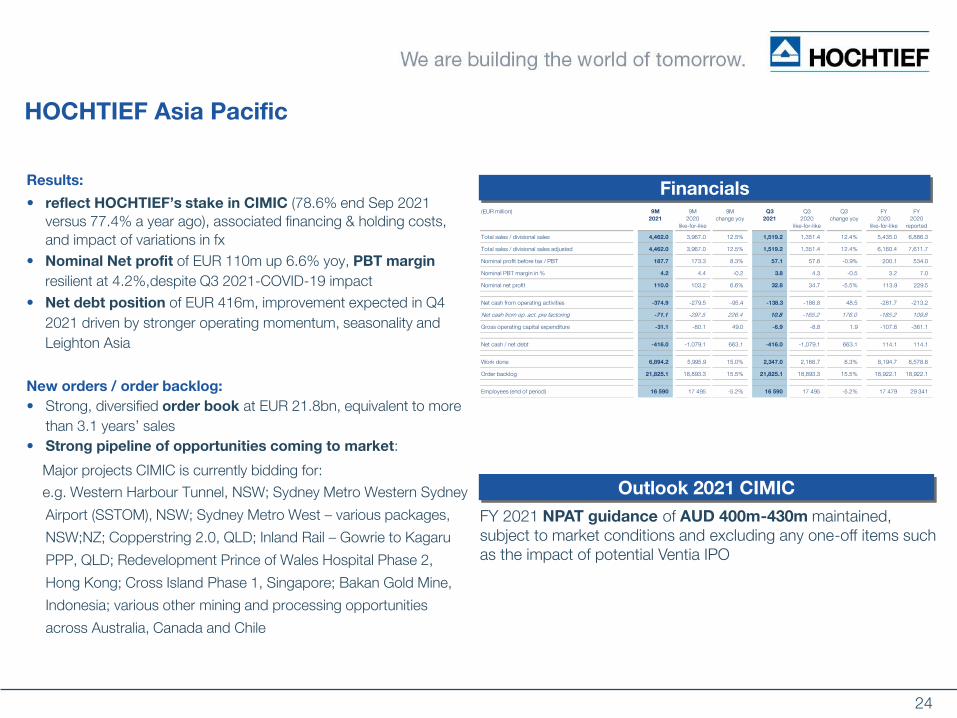
Results:
• reflect HOCHTIEF’s stake in CIMIC (78.6% end Sep 2021
versus 77.4% a year ago), associated financing & holding costs,
and impact of variations in fx
• Nominal Net profit of EUR 110m up 6.6% yoy, PBT margin
resilient at 4.2%,despite Q3 2021-COVID-19 impact
• Net debt position of EUR 416m, improvement expected in Q4
2021 driven by stronger operating momentum, seasonality and
Leighton Asia
New orders / order backlog:
• Strong, diversified order book at EUR 21.8bn, equivalent to more
than 3.1 years’ sales
• Strong pipeline of opportunities coming to market:
Major projects CIMIC is currently bidding for:
e.g. Western Harbour Tunnel, NSW; Sydney Metro Western Sydney
Airport (SSTOM), NSW; Sydney Metro West – various packages,
NSW;NZ; Copperstring 2.0, QLD; Inland Rail – Gowrie to Kagaru
PPP, QLD; Redevelopment Prince of Wales Hospital Phase 2,
Hong Kong; Cross Island Phase 1, Singapore; Bakan Gold Mine,
Indonesia; various other mining and processing opportunities
across Australia, Canada and Chile
Financials
Outlook 2021 CIMIC
FY 2021 NPAT guidance of AUD 400m-430m maintained, subject to market conditions and excluding any one-off items such as the impact of potential Ventia IPO
(EUR million) 9M
2021
9M
2020
like-for-like
9M
change yoy
Q3
2021
Q3
2020
like-for-like
Q3
change yoy
FY
2020
like-for-like
FY
2020
reported
Total sales / divisional sales 4,462.0 3,967.0 12.5% 1,519.2 1,351.4 12.4% 5,435.0 6,886.3
Total sales / divisional sales adjusted 4,462.0 3,967.0 12.5% 1,519.2 1,351.4 12.4% 6,160.4 7,611.7
Nominal profit before tax / PBT 187.7 173.3 8.3% 57.1 57.6 -0.9% 200.1 534.0
Nominal PBT margin in % 4.2 4.4 -0.2 3.8 4.3 -0.5 3.2 7.0
Nominal net profit 110.0 103.2 6.6% 32.8 34.7 -5.5% 113.9 229.5
Net cash from operating activities -374.9 -279.5 -95.4 -138.3 -186.8 48.5 -281.7 -213.2
Net cash from op. act. pre factoring -71.1 -297.5 226.4 10.8 -165.2 176.0 -185.2 109.8
Gross operating capital expenditure -31.1 -80.1 49.0 -6.9 -8.8 1.9 -107.8 -361.1
Net cash / net debt -416.0 -1,079.1 663.1 -416.0 -1,079.1 663.1 114.1 114.1
Work done 6,894.2 5,995.9 15.0% 2,347.0 2,166.7 8.3% 8,194.7 8,578.6
Order backlog 21,825.1 18,893.3 15.5% 21,825.1 18,893.3 15.5% 18,922.1 18,922.1
Employees (end of period) 16 590 17 495 -5.2% 16 590 17 495 -5.2% 17 479 29 341
25
47%
18%
35%
55%
18%
27%
45%
28%
27%
Construction
Services
Investments
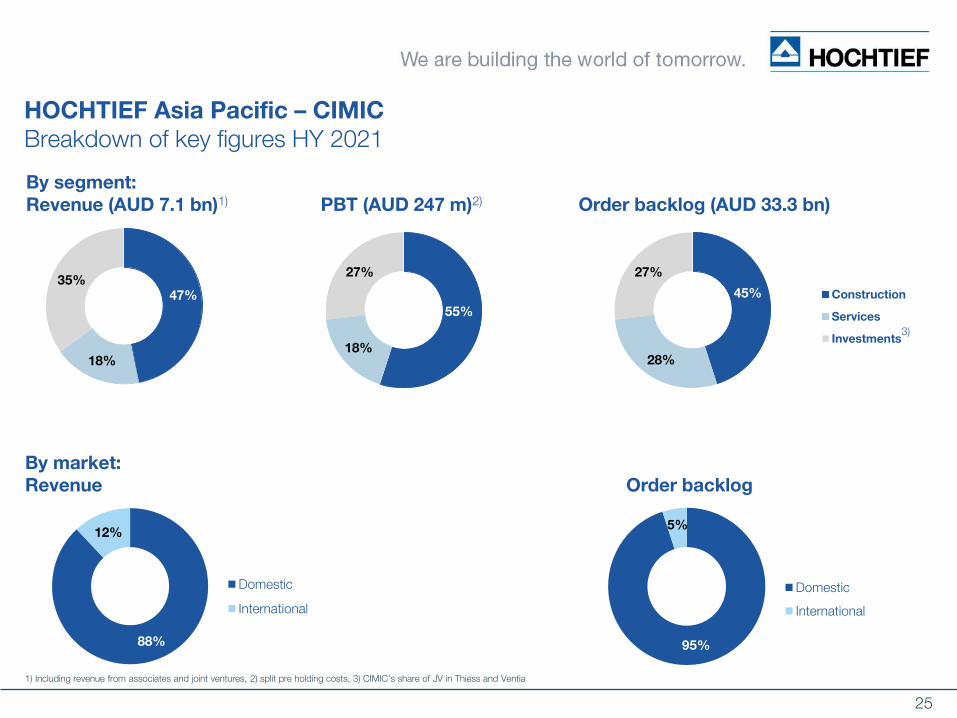
HOCHTIEF Asia Pacific – CIMIC
Breakdown of key figures HY 2021
88%
12%
Domestic
International
By market:
Revenue Order backlog
95%
5%
Domestic
International
By segment:
Revenue (AUD 7.1 bn)1) PBT (AUD 247 m)2) Order backlog (AUD 33.3 bn)
1) Including revenue from associates and joint ventures, 2) split pre holding costs, 3) CIMIC’s share of JV in Thiess and Ventia
3)
26
HOCHTIEF Europe
Green Point, Prague, Czech Republic
© H
OC
HTIE
F©
HO
CH
TIE
F
27
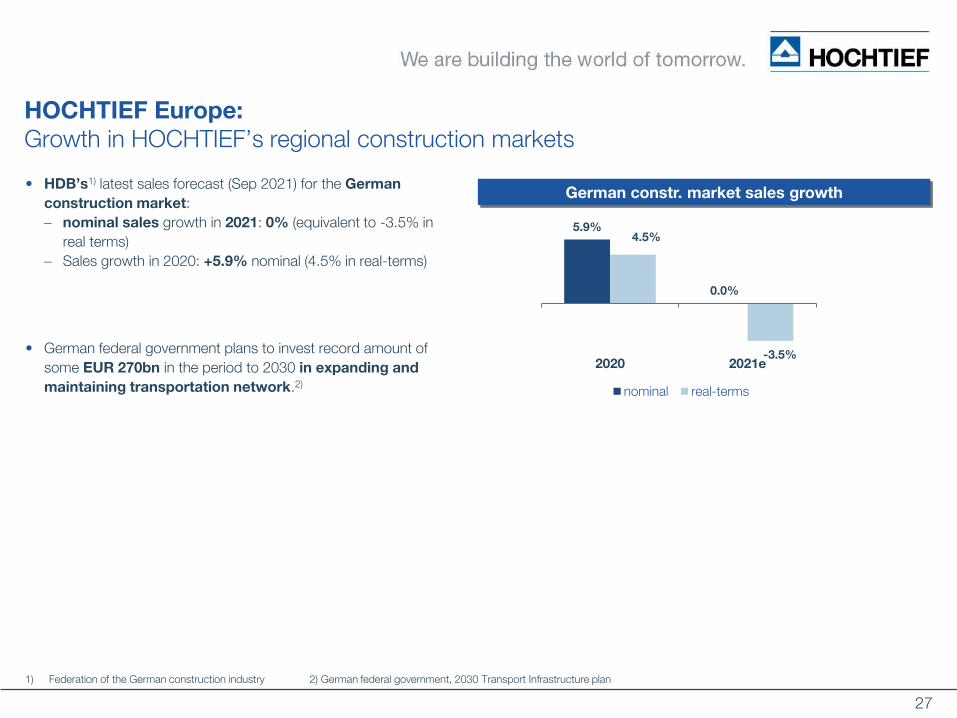
HOCHTIEF Europe:
Growth in HOCHTIEF’s regional construction markets
• HDB’s1) latest sales forecast (Sep 2021) for the German
construction market:
nominal sales growth in 2021: 0% (equivalent to -3.5% in
real terms)
Sales growth in 2020: +5.9% nominal (4.5% in real-terms)
• German federal government plans to invest record amount of
some EUR 270bn in the period to 2030 in expanding and
maintaining transportation network.2)
1) Federation of the German construction industry 2) German federal government, 2030 Transport Infrastructure plan
5.9%
0.0%
4.5%
-3.5%
2020 2021e
nominal real-terms
German constr. market sales growth
28
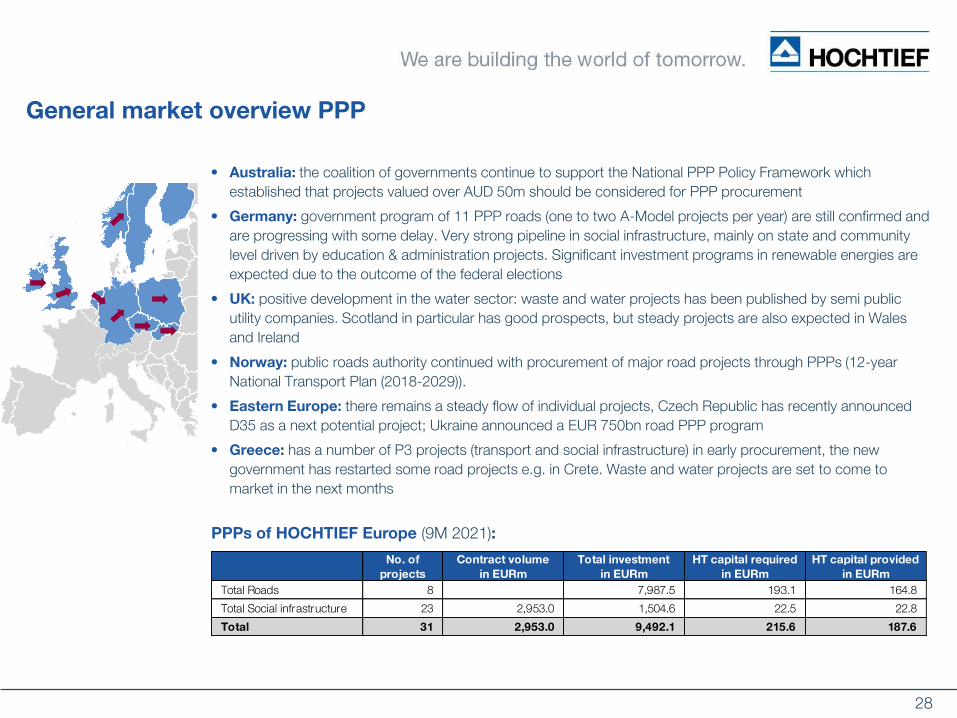
General market overview PPP
• Australia: the coalition of governments continue to support the National PPP Policy Framework which
established that projects valued over AUD 50m should be considered for PPP procurement
• Germany: government program of 11 PPP roads (one to two A-Model projects per year) are still confirmed and
are progressing with some delay. Very strong pipeline in social infrastructure, mainly on state and community
level driven by education & administration projects. Significant investment programs in renewable energies are
expected due to the outcome of the federal elections
• UK: positive development in the water sector: waste and water projects has been published by semi public
utility companies. Scotland in particular has good prospects, but steady projects are also expected in Wales
and Ireland
• Norway: public roads authority continued with procurement of major road projects through PPPs (12-year
National Transport Plan (2018-2029)).
• Eastern Europe: there remains a steady flow of individual projects, Czech Republic has recently announced
D35 as a next potential project; Ukraine announced a EUR 750bn road PPP program
• Greece: has a number of P3 projects (transport and social infrastructure) in early procurement, the new
government has restarted some road projects e.g. in Crete. Waste and water projects are set to come to
market in the next months
PPPs of HOCHTIEF Europe (9M 2021):
Contract volume Total investment HT capital required HT capital provided
in EURm in EURm in EURm in EURm
Total Roads 8 7,987.5 193.1 164.8
Total Social infrastructure 23 2,953.0 1,504.6 22.5 22.8
Total 31 2,953.0 9,492.1 215.6 187.6
No. of
projects
29
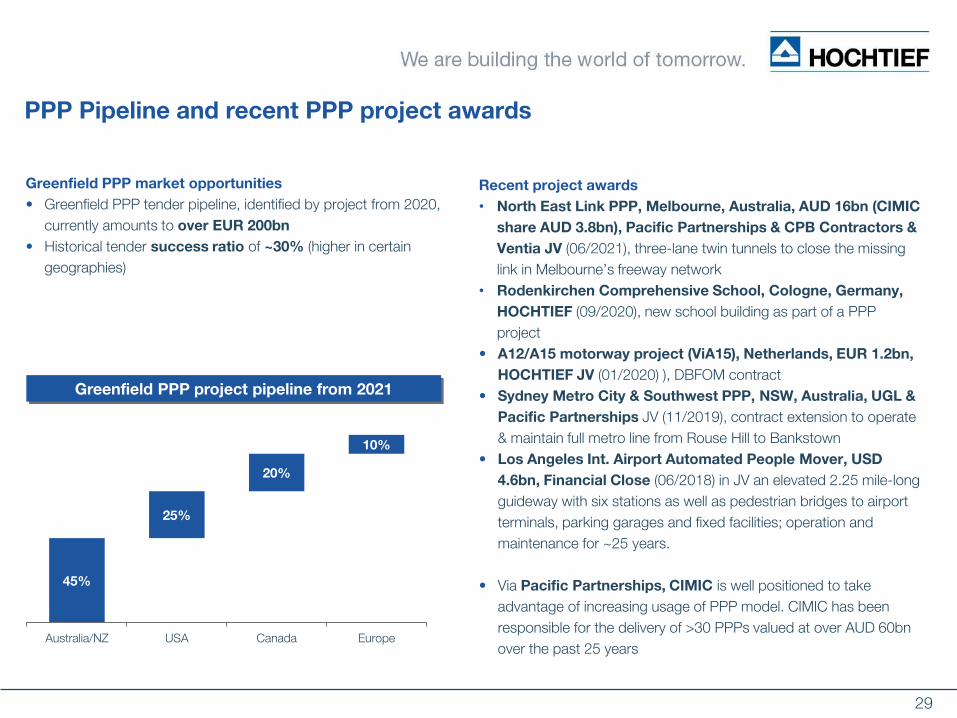
PPP Pipeline and recent PPP project awards
Recent project awards
• North East Link PPP, Melbourne, Australia, AUD 16bn (CIMIC
share AUD 3.8bn), Pacific Partnerships & CPB Contractors &
Ventia JV (06/2021), three-lane twin tunnels to close the missing
link in Melbourne’s freeway network
• Rodenkirchen Comprehensive School, Cologne, Germany,
HOCHTIEF (09/2020), new school building as part of a PPP
project
• A12/A15 motorway project (ViA15), Netherlands, EUR 1.2bn,
HOCHTIEF JV (01/2020) ), DBFOM contract
• Sydney Metro City & Southwest PPP, NSW, Australia, UGL &
Pacific Partnerships JV (11/2019), contract extension to operate
& maintain full metro line from Rouse Hill to Bankstown
• Los Angeles Int. Airport Automated People Mover, USD
4.6bn, Financial Close (06/2018) in JV an elevated 2.25 mile-long
guideway with six stations as well as pedestrian bridges to airport
terminals, parking garages and fixed facilities; operation and
maintenance for ~25 years.
• Via Pacific Partnerships, CIMIC is well positioned to take
advantage of increasing usage of PPP model. CIMIC has been
responsible for the delivery of >30 PPPs valued at over AUD 60bn
over the past 25 years
Greenfield PPP project pipeline from 2021
Greenfield PPP market opportunities
• Greenfield PPP tender pipeline, identified by project from 2020,
currently amounts to over EUR 200bn
• Historical tender success ratio of ~30% (higher in certain
geographies)
45%
25%
20%
10%
Australia/NZ USA Canada Europe
30
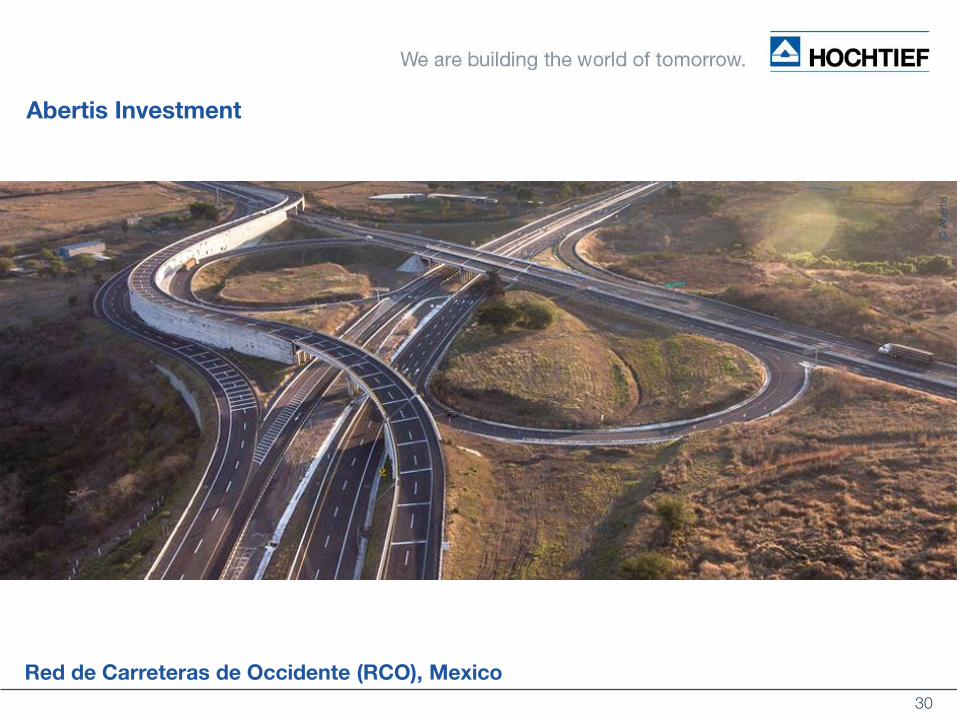
Abertis Investment
Red de Carreteras de Occidente (RCO), Mexico
© Miquel Gonzalez/Abertis
© A
bert
is
31
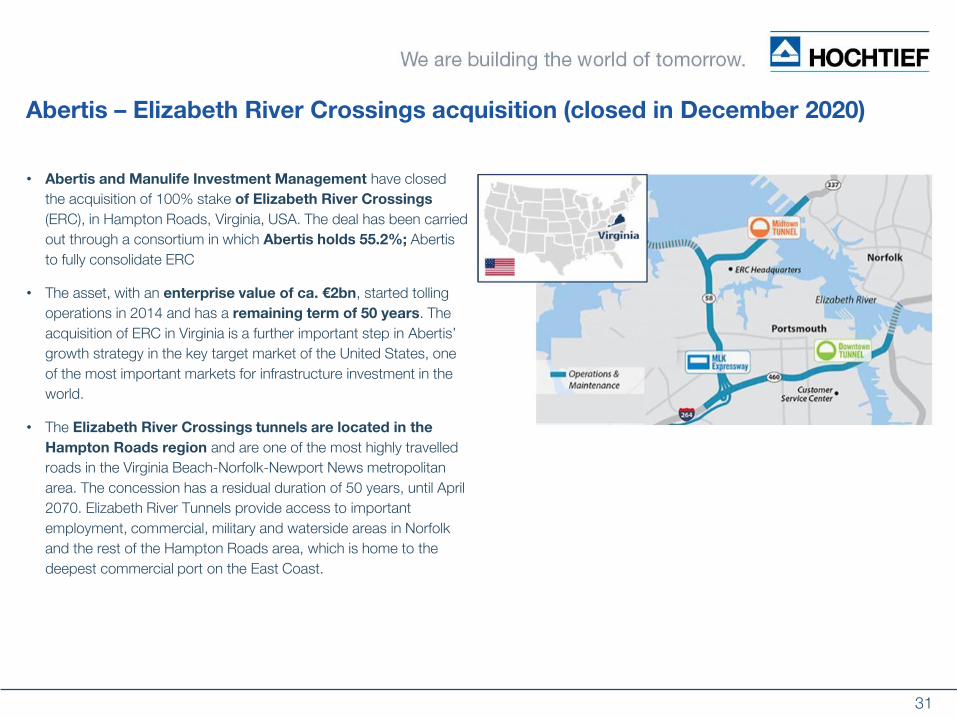
• Abertis and Manulife Investment Management have closed
the acquisition of 100% stake of Elizabeth River Crossings
(ERC), in Hampton Roads, Virginia, USA. The deal has been carried
out through a consortium in which Abertis holds 55.2%; Abertis
to fully consolidate ERC
• The asset, with an enterprise value of ca. €2bn, started tolling
operations in 2014 and has a remaining term of 50 years. The
acquisition of ERC in Virginia is a further important step in Abertis’
growth strategy in the key target market of the United States, one
of the most important markets for infrastructure investment in the
world.
• The Elizabeth River Crossings tunnels are located in the
Hampton Roads region and are one of the most highly travelled
roads in the Virginia Beach-Norfolk-Newport News metropolitan
area. The concession has a residual duration of 50 years, until April
2070. Elizabeth River Tunnels provide access to important
employment, commercial, military and waterside areas in Norfolk
and the rest of the Hampton Roads area, which is home to the
deepest commercial port on the East Coast.
Abertis – Elizabeth River Crossings acquisition (closed in December 2020)
32
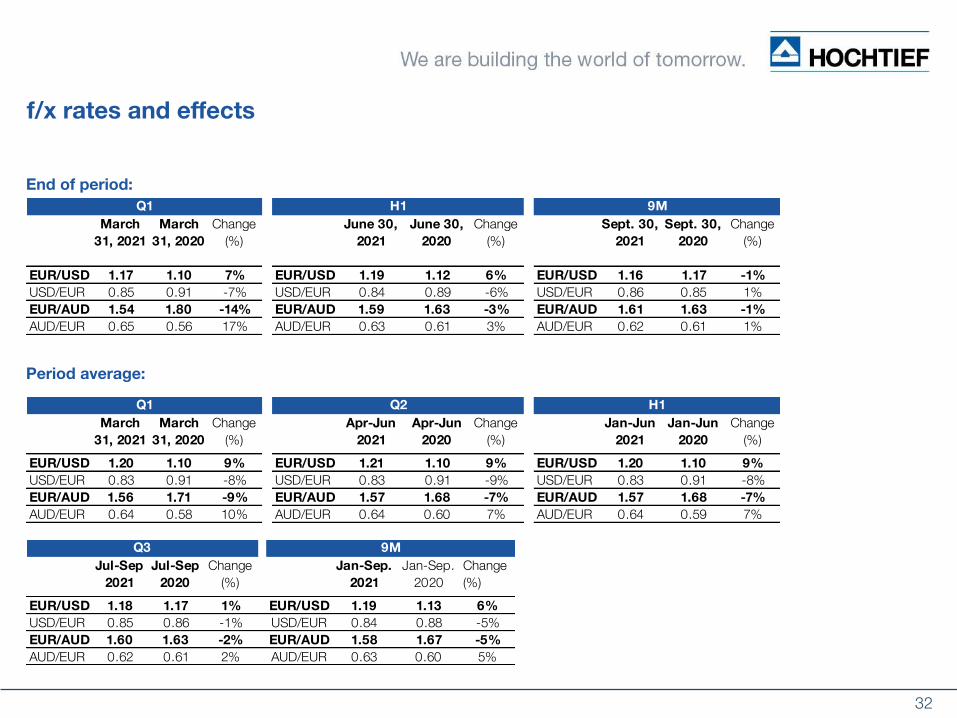
f/x rates and effects
End of period:
Period average:
March
31, 2021
March
31, 2020
Change
(%)
June 30,
2021
June 30,
2020
Change
(%)
Sept. 30,
2021
Sept. 30,
2020
Change
(%)
EUR/USD 1.17 1.10 7% EUR/USD 1.19 1.12 6% EUR/USD 1.16 1.17 -1%
USD/EUR 0.85 0.91 -7% USD/EUR 0.84 0.89 -6% USD/EUR 0.86 0.85 1%
EUR/AUD 1.54 1.80 -14% EUR/AUD 1.59 1.63 -3% EUR/AUD 1.61 1.63 -1%
AUD/EUR 0.65 0.56 17% AUD/EUR 0.63 0.61 3% AUD/EUR 0.62 0.61 1%
9MQ1 H1
March
31, 2021
March
31, 2020
Change
(%)
Apr-Jun
2021
Apr-Jun
2020
Change
(%)
Jan-Jun
2021
Jan-Jun
2020
Change
(%)
EUR/USD 1.20 1.10 9% EUR/USD 1.21 1.10 9% EUR/USD 1.20 1.10 9%
USD/EUR 0.83 0.91 -8% USD/EUR 0.83 0.91 -9% USD/EUR 0.83 0.91 -8%
EUR/AUD 1.56 1.71 -9% EUR/AUD 1.57 1.68 -7% EUR/AUD 1.57 1.68 -7%
AUD/EUR 0.64 0.58 10% AUD/EUR 0.64 0.60 7% AUD/EUR 0.64 0.59 7%
Q2Q1 H1
Jul-Sep
2021
Jul-Sep
2020
Change
(%)
Jan-Sep.
2021
Jan-Sep.
2020
Change
(%)
EUR/USD 1.18 1.17 1% EUR/USD 1.19 1.13 6%
USD/EUR 0.85 0.86 -1% USD/EUR 0.84 0.88 -5%
EUR/AUD 1.60 1.63 -2% EUR/AUD 1.58 1.67 -5%
AUD/EUR 0.62 0.61 2% AUD/EUR 0.63 0.60 5%
Q3 9M
33
Appendix: HOCHTIEF Group overview
Kopenhagen Metro, Denmark
© C
JF-D
esi
gn
© S
cott
Pease
© H
OC
HTIE
F C
Z©
HO
CH
TIE
F
© R
asm
us
Hjo
rtsh
øj
34
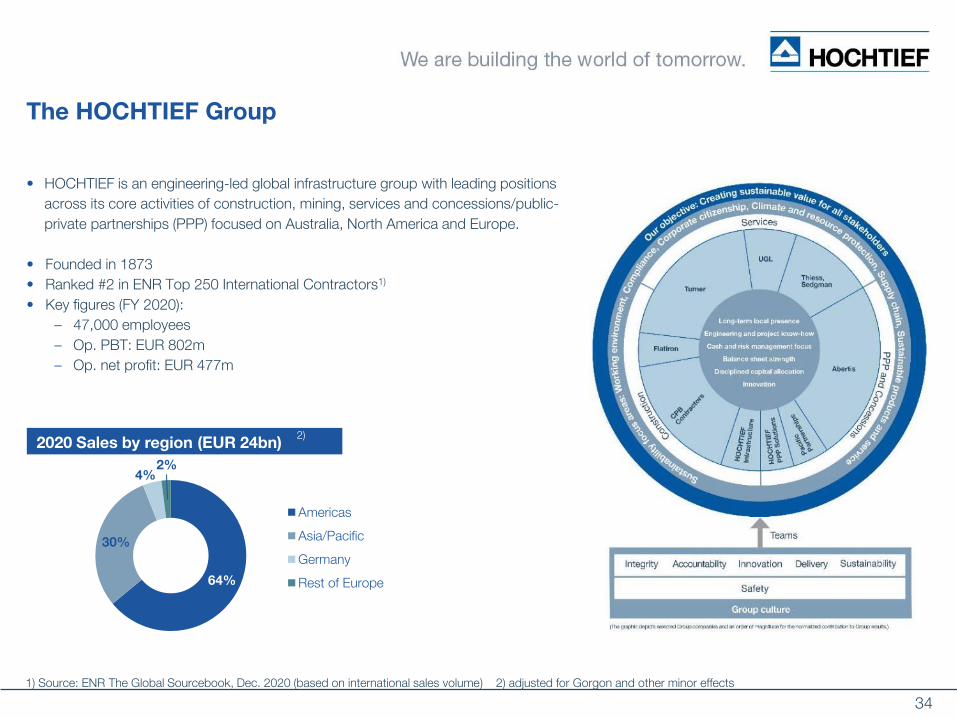
The HOCHTIEF Group
• HOCHTIEF is an engineering-led global infrastructure group with leading positions
across its core activities of construction, mining, services and concessions/public-
private partnerships (PPP) focused on Australia, North America and Europe.
• Founded in 1873
• Ranked #2 in ENR Top 250 International Contractors1)
• Key figures (FY 2020):
– 47,000 employees
– Op. PBT: EUR 802m
– Op. net profit: EUR 477m
64%
30%
4%
2%
Americas
Asia/Pacific
Germany
Rest of Europe
2020 Sales by region (EUR 24bn)2)
1) Source: ENR The Global Sourcebook, Dec. 2020 (based on international sales volume) 2) adjusted for Gorgon and other minor effects
35
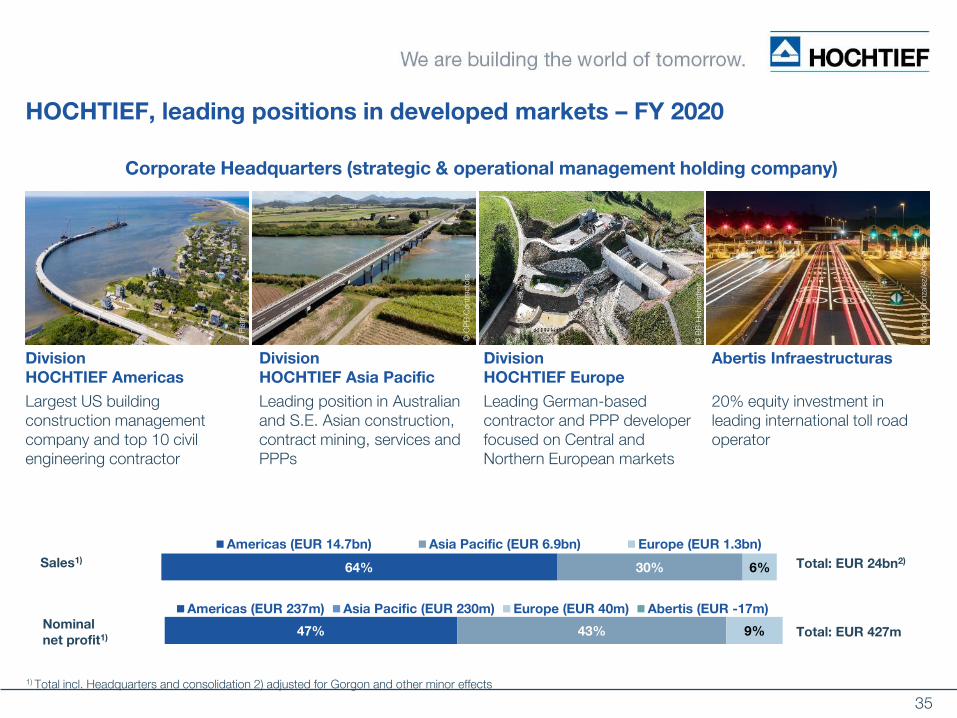
HOCHTIEF, leading positions in developed markets – FY 2020
Corporate Headquarters (strategic & operational management holding company)
Division
HOCHTIEF Americas
Division
HOCHTIEF Asia Pacific
Division
HOCHTIEF Europe
Abertis Infraestructuras
Largest US building construction management company and top 10 civil engineering contractor
Leading position in Australian and S.E. Asian construction, contract mining, services and PPPs
Leading German-based contractor and PPP developerfocused on Central and Northern European markets
20% equity investment in leading international toll road operator
© CPB Contractors © M
iquel G
onza
lez/
Ab
ert
is0
64% 30% 6%
Americas (EUR 14.7bn) Asia Pacific (EUR 6.9bn) Europe (EUR 1.3bn)
Sales1)
Total: EUR 24bn2)
Total: EUR 427m Nominal
net profit1)
1) Total incl. Headquarters and consolidation 2) adjusted for Gorgon and other minor effects
© C
PB
Contr
acto
rs
© F
latir
on
© B
B-H
eb
enst
reit
47% 43% 9%
Americas (EUR 237m) Asia Pacific (EUR 230m) Europe (EUR 40m) Abertis (EUR -17m)
36
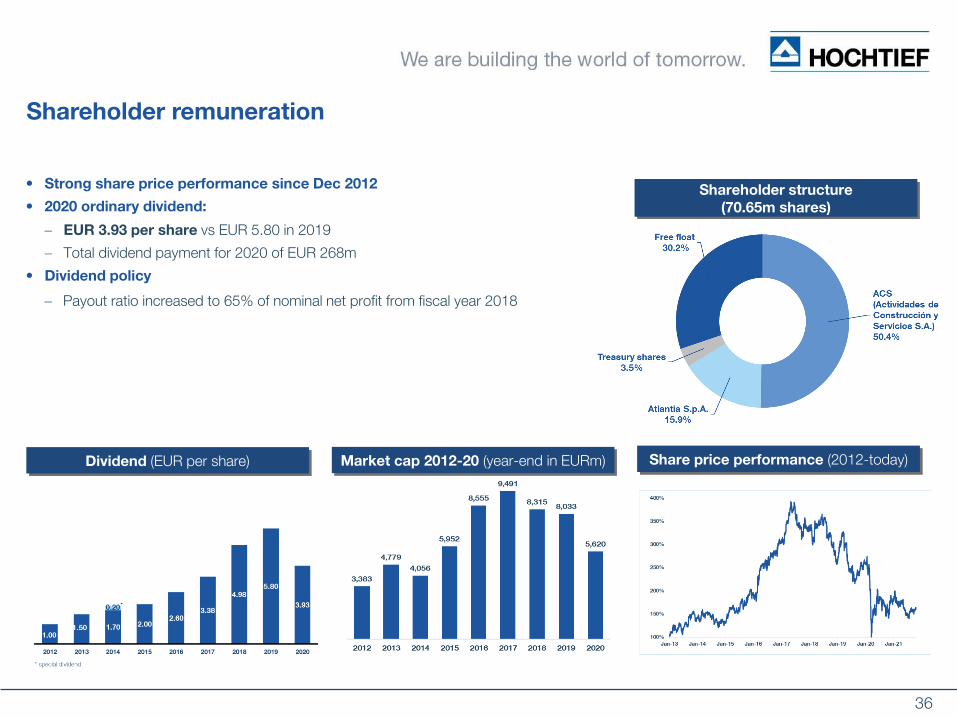
Shareholder remuneration
Dividend (EUR per share)
• Strong share price performance since Dec 2012
• 2020 ordinary dividend:
EUR 3.93 per share vs EUR 5.80 in 2019
Total dividend payment for 2020 of EUR 268m
• Dividend policy
Payout ratio increased to 65% of nominal net profit from fiscal year 2018
Share price performance (2012-today)Market cap 2012-20 (year-end in EURm)
Shareholder structure
(70.65m shares)
37
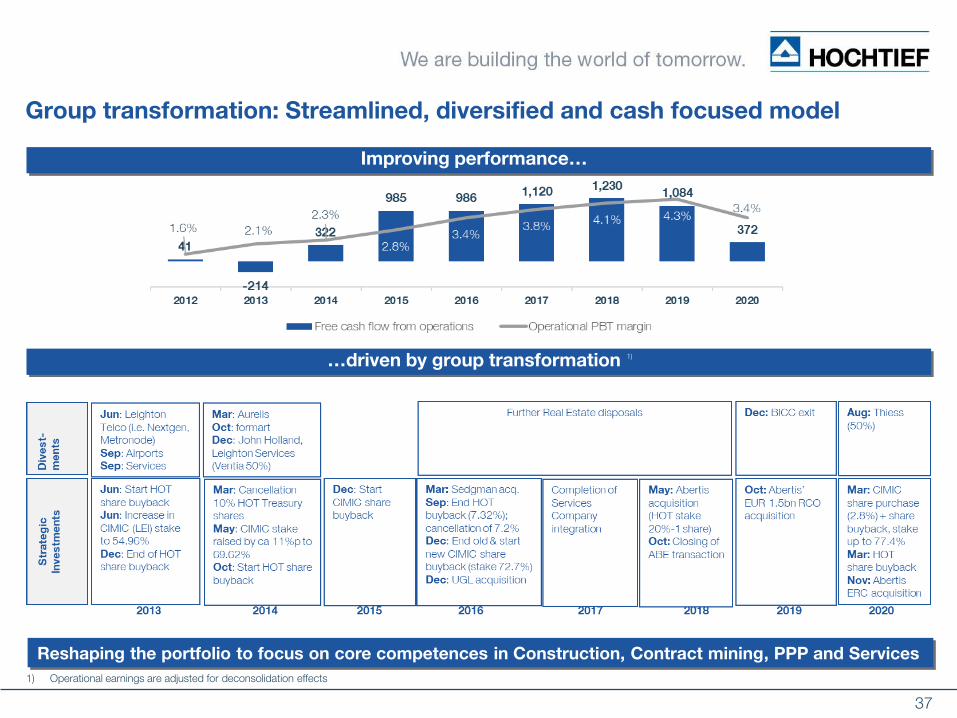
Group transformation: Streamlined, diversified and cash focused model
…driven by group transformation
1) Operational earnings are adjusted for deconsolidation effects
1)
Reshaping the portfolio to focus on core competences in Construction, Contract mining, PPP and Services
Improving performance…
38
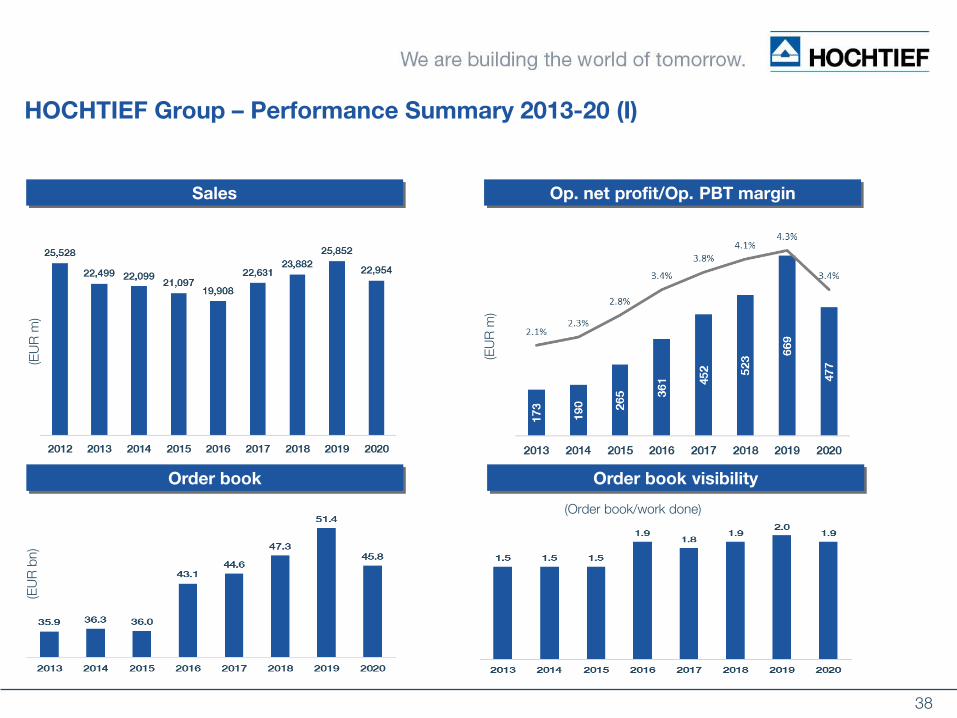
HOCHTIEF Group – Performance Summary 2013-20 (I)
Op. net profit/Op. PBT marginSales
Order book visibilityOrder book
(Order book/work done)
(EU
R m
)
1)
(EU
R m
)(E
UR
bn)
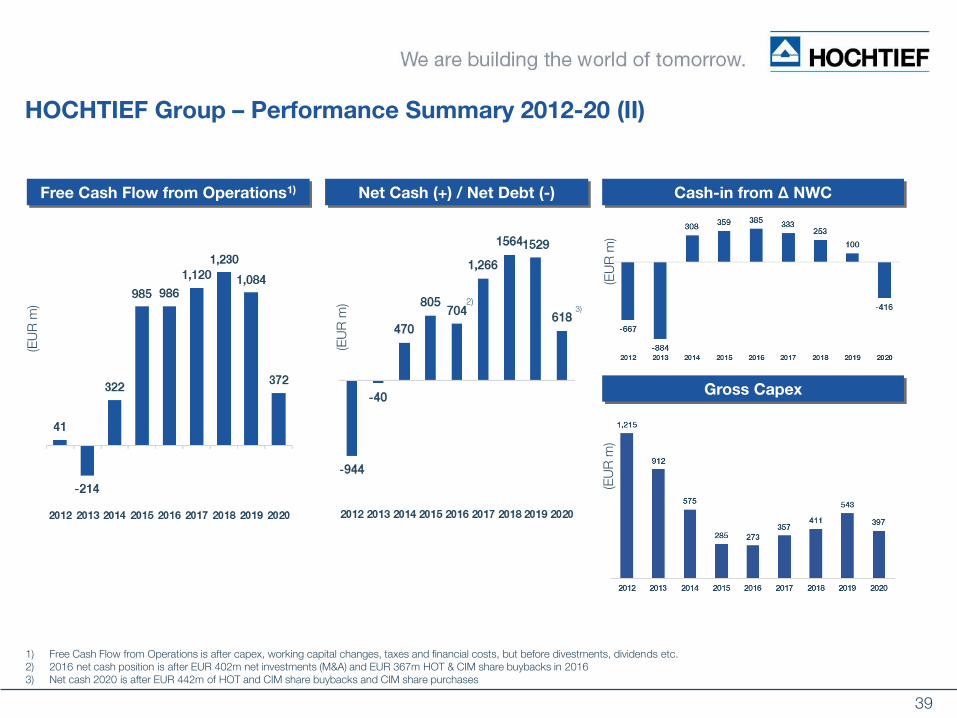
39
(EU
R m
)
1) Free Cash Flow from Operations is after capex, working capital changes, taxes and financial costs, but before divestments, dividends etc.2) 2016 net cash position is after EUR 402m net investments (M&A) and EUR 367m HOT & CIM share buybacks in 20163) Net cash 2020 is after EUR 442m of HOT and CIM share buybacks and CIM share purchases
Cash-in from ∆ NWC
Gross Capex
Free Cash Flow from Operations1)
Net Cash (+) / Net Debt (-)
2)
(EU
R m
)
(EU
R m
)
(EU
R m
)
HOCHTIEF Group – Performance Summary 2012-20 (II)
3)
40
Further accelerating ESG drive
HOCHTIEF is one of the world’s leading infrastructure groups in terms of Environmental,
Social and Governance topics
• Sustainability is one of our guiding principles and a cornerstone of our strategy
• Long-standing support of UN Global Compact principles, United Nations Sustainable Development
Goals and United Nations Guiding Principles on Business and Human Rights
Executive Board is leading the twin transition of the group: green and digital
2021 to 2025 sustainability plan
Recent development:
Environmental:
AGM announcement to reach Paris Climate Agreement targets well ahead of schedule
Preparing carbon reduction targets (scope 1, 2 and 3) and EU Taxonomy compliance
Working with suppliers and subcontractors to significantly improve the environmental footprint Delivered sales from green building projects worth EUR 8.3bn in 2020; Turner #1 US green builder
• For example, last week Turner announced its flagship USD 1.5bn New York, Javits Convention Centre project, had been awarded a LEED Gold certification by the U.S. Green Building Council and serves as a model of environmental efficiency and sustainability.
Social:
Updated Human rights policy
Turner named Company of the Year 2020 for its leadership role in responding to racist attitudes and actions on construction sites
Governance:
Shareholders at the AGM 2020 approved an updated compensation system for the Executive Board
establishing an ESG component for the variable compensation for the first time Compliance trainings completed by all employees
Subcontractors, suppliers and service providers required to comply with our high standards laid down in our Code of Conduct
41
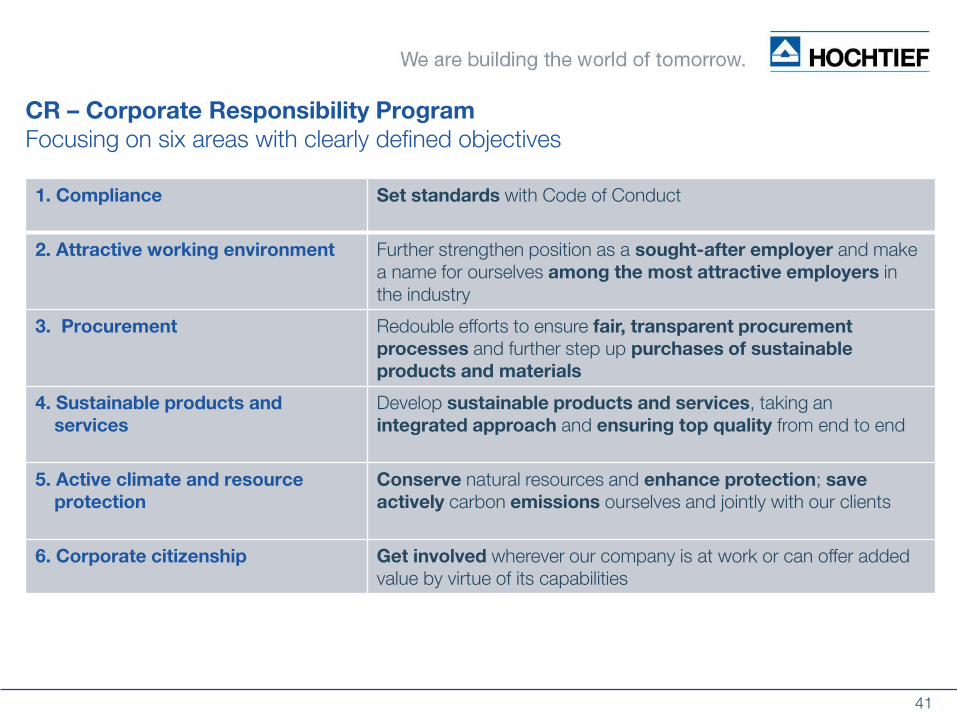
CR – Corporate Responsibility Program
Focusing on six areas with clearly defined objectives
1. Compliance Set standards with Code of Conduct
2. Attractive working environment Further strengthen position as a sought-after employer and make a name for ourselves among the most attractive employers in the industry
3. Procurement Redouble efforts to ensure fair, transparent procurement
processes and further step up purchases of sustainable
products and materials
4. Sustainable products and
services
Develop sustainable products and services, taking an integrated approach and ensuring top quality from end to end
5. Active climate and resource
protection
Conserve natural resources and enhance protection; save
actively carbon emissions ourselves and jointly with our clients
6. Corporate citizenship Get involved wherever our company is at work or can offer added value by virtue of its capabilities
42
Disclaimer
This presentation and the report contain forward-looking statements. These statements reflect the current views, expectations and
assumptions of the Executive Board of HOCHTIEF Aktiengesellschaft and are based on information currently available to the Executive
Board. Such statements involve risks and uncertainties and do not guarantee future results, performance or events. Actual results,
performance or events relating to HOCHTIEF Aktiengesellschaft and the HOCHTIEF Group, including but not limited to possible future
divestments, profit before tax, consolidated net profit and dividends, may differ materially from the expectations and assumptions described
in such statements due to, among other things, changes in the general economic, sectoral and competitive environment, risks associated
with capital markets, currency exchange rate fluctuations, changes in international and national laws and regulations, in particular with
respect to tax laws and regulations, the conduct of other shareholders, and other factors. Statements on dividends are additionally subject to
the recognition of a corresponding unappropriated net profit in the published separate financial statements of HOCHTIEF Aktiengesellschaft
for the fiscal year concerned and the adoption by the competent decision-making bodies of appropriate resolutions taking into account the
prevailing situation of the Company. HOCHTIEF Aktiengesellschaft does not assume any obligations to update any forward-looking
statements.

43
Investor Relations contacts
For further information
please contact:
Investor Relations
HOCHTIEF Aktiengesellschaft
Alfredstrasse 236
45133 Essen, Germany
Phone: +49 201 824 1870
Fax: +49 201 824 9 1870
[email protected] HorstMike Pinkney Nadine WärmerTobias Loskamp
![[FINAL] CNPF 9M18 Investor Presentation · Branded, 75% OEM Exports, 25% 9M 2017 Revenues Branded Growth OEM Growth 9M 2018 Revenues 9M Revenues Branded OEM Exports 9M 2018 Revenues](https://img.pdfslide.us/doc/110x75/5fbd371fb2712f4df801798d/final-cnpf-9m18-investor-presentation-branded-75-oem-exports-25-9m-2017-revenues.jpg)