Embed Size (px)
Citation preview

INVESTOR PROTECTION, OWNERSHIP, AND INVESTMENT
by
Charles P. Himmelberg, R. Glenn Hubbard, and Inessa Love
Columbia University
Preliminary Draft
June 13, 2000
This paper was prepared for presentation at the Sveriges Riksbank/Stockholm School ofEconomics Conference on Asset Markets and Monetary Policy, Stockholm, June 16-17, 2000.

ABSTRACT
In this paper, we bring together recent research on determinants of corporate ownershipstructure with research on costly external financing for investment to highlight the role played bycontracting costs in the absence of strong investor protection on both firm financial structure andthe cost of external funds for investment. Our principal findings, using firm-level data for a broadsample of countries, are two: First, the weaker is legal protection, the more likely is concentratedinside equity ownership of firms and the higher is the marginal cost of equity financing. Second,to the extent that the size of the firm's equity base reduces the cost of debt financing, the marginalcost of debt financing is more sensitive to changes in firm net worth (proxied by leverage) incountries in which weak investor protection has made the cost of external financing high. Implications of these basic results for analysis of cross-country variation in effects of monetarypolicy action and analysis of cross-country variation in industrial development are importanttopics for future research.
Charles P. HimmelbergGraduate School of BusinessColumbia University 606 Uris Hall3022 BroadwayNew York, NY [email protected]
R. Glenn HubbardGraduate School of BusinessColumbia University609 Uris Hall3022 BroadwayNew York, NY [email protected]
Inessa LoveGraduate School of BusinessColumbia UniversityUris Hall3022 BroadwayNew York, NY [email protected]

1 In particular, the Q model of investment (Hayashi, 1982) offers (under certainassumptions) particularly simple links between firm asset values and firm investment. Concernover the empirical usefulness of asset market information through Q as a predictor of investmentled many researcher to augment asset market information with information about firm liquidity ornet worth (see, e.g., Fazzari, Hubbard, and Petersen, 1988, and related studies) or to developforward-looking proxies not relying on asset prices alone (as in Abel and Blanchard, 1986; andGilchrist and Himmelberg, 1998).
1
I. INTRODUCTION
In both theoretical and empirical research on investment, asset market signals form the
basis of many forward-looking models of investment decisions by value-maximizing firms.1 In
practice, however, the usefulness of asset markets both as sources of external financing and as
sources of signals about investment opportunities and the cost of external financing depends
importantly on the legal system for financial contracting in those asset markets. In many analyses
of investment decisions, costs of using asset markets – measured by investor protection or the
efficiency of the legal system – are ignored.
In this paper, we bring together these branches of research on asset markets and
investment with the idea that legal systems for investor protection influence significantly whether
costs of external financing for investment can be reasonably inferred from asset market
information. We emphasize relationships among legal systems for investor protection,
concentration of inside ownership of firms, and the sensitivity of firm investment to proxies for
internal net worth.
The first premise of our paper is that firms operating in countries with strong investor
protection for minority shareholders, ceteris paribus, should find it easier to sell equity shares to
anonymous shareholders, and should therefore have lower levels of inside ownership. That is,
strong investor protection should lower the marginal cost of equity because it reduces firms’

2
reliance on the scarce supply of what Gorton and Kahl (1999) call “agency-cost-free” capital,
namely, capital concentrated in the hands of rich investors. Our second premise is that equity is
complementary to debt in the firm’s capital structure, so that in equilibrium, a lower marginal cost
of equity implies a lower marginal cost of debt. This implies that the marginal cost of debt
financing – which is overwhelmingly the marginal source of external funds for most firms – should
be lower in countries with strong legal protection for minority shareholders.
We exploit the conjectured relationships among investor protections, shareholder
concentration and the marginal cost of debt financing to estimate Euler equations for investment
in which the marginal cost of capital is assumed to vary with the firm’s leverage ratio. Consistent
with the predictions of our theoretical arguments, firms in countries with weak legal protection
for minority shareholders have more highly concentrated shareholdings, and the cost of capital
implied by their investment behavior displays more sensitivity to changes in the leverage ratio.
From this evidence we conclude that countries with weak legal protection of minority equity
investors are likely to have corporate financial structures more exposed to shocks to interest rates
or firm net worth. These cross-country differences are also related to earlier analyses of
connections between financial development and economic growth and of cross-country variation
in output sensitivity to monetary policy (see, e.g, Cecchetti, 1999).
Much of the recent resurgence of interest in links between financial structure and
economic growth reflects a growing understanding of the links between finance and corporate
governance. The finding of a positive cross-country relationship between financial development
and economic growth by King and Levine (1993) stimulated attempts to assess causality (see,
e.g., Levine and Zervos, 1998; Demurguc-Kunt and Maksimovic, 1998; and Beck, Levine, and
3
Loyaza, 2000). Studies using firm-level data often focus on consequences of capital-market
imperfections for the cost of external financing and investment (see, e.g., the review of studies in
Hubbard, 1998).
The growing appreciation for the importance of imperfections in contracting mechanisms
and enforcement in microeconomic models has led further to the search for exogenous variation in
the scope of these imperfections (see especially the discussion of legal systems in the work of La
Porta, Lopez-di-Silanes, Shleifer, and Vishny (1997, 1998, 1999a, 1999b, 2000), which we
describe below). Some researchers have considered whether cross-country variation in financial
development is associated with differences in the efficiency of capital allocation, which may be
associated with growth. For example, Demurguc-Kunt and Maksimovic (1999) estimate for a
sample of countries the fraction of firms where growth is faster than the growth possible using
only internally generated funds. They conclude that this fraction is positively related to indicators
of financial development and legal protection of investors. In another example, Rajan and
Zingales (1998) use industry data to argue that industries requiring more external financing grow
faster in countries with greater financial development. Finally, Wurgler (2000) shows that
countries with greater financial development display greater industry-level sensitivity of
investment growth to value-added growth (as a proxy for investment opportunities).
While suggestive, these studies allow substantial room for additional research. First, these
studies do not control for firm-level investment opportunities. The evidence reported in Rajan
and Zingales (1998) and Wurgler (2000), for example, is ambiguous for the well known reason
that proxies for financial market access tend to be highly correlated with investment opportunities.
In Rajan and Zingales (1998), industry growth in the United States is used as a proxy for the

4
investment opportunities of the same industry outside the United States, but this does not control
convincingly for investment opportunities. For example, the fact that semiconductor
manufacturing, for example, is growing in the United States, but not in Mexico, may reflect the
absence of production externalities rather than lack of access to external financing. In Wurgler
(2000), a high elasticity of investment with respect to sales is interpreted as evidence that firms
are responding to fundamentals, and therefore not constrained by poorly developed financial
markets. The opposite interpretation is equally plausible, however; because cash flow (internal
financing) is highly correlated with sales, a high elasticity of investment to sales could just as
easily reflect more binding financing constraints. In short, the issue calls for firm-level evidence
that distinguishes investment opportunities from variations in the cost of capital due to the legal
environment.
Second, the recent cross-country studies have not fully exploited the predictions of the
theory derived from the endogenous response of ownership structure. In countries with weak
investor protection, one would expect to see external financing flowing less freely to firms with
the highest-valued projects. One would also expect to see owners attempting to respond
optimally to less favorable contracting environments by seeking external equity financing from
smaller numbers of wealthier investors who would be better equipped to deal with the
expropriation dangers faced by small investors. This prediction confronts theory with more
dimensions of the data; measures of investor protection should negatively predict inside
shareholder concentration, and to the extent that the legal environment forces firms in a country
to resort to "second best" ownership structures, one should expect investment to be more
responsive to internal and external financing shocks.

5
To make progress on these points, we proceed in two steps. First, following La Porta,
Lopez-di-Silanes, Shleifer, and Vishny (1998), we emphasize differences in legal protection for
investors as the source of cross-country differences in both corporate ownership structures and
the relationship between asset markets and investment. Using firm-level Worldscope data for 39
countries, we extend the cross-country evidence in La Porta, Lopez-di-Silanes, Shleifer, and
Vishny (1998), and document empirically the strong relationship between measures of investor
protection and ownership concentration. Second, using firm-level data from Worldscope for a
subset of industrial countries, we document empirically the strong relationship between predicted
ownership concentration and the marginal cost of external financing for firm investment. In
particular, the substantial cross-country variation in effects of changes in firm net worth on
investment suggest that, even within European countries, a common monetary policy is unlikely
to eliminate the substantial cross-country asymmetries in output responses to policy evidenced in
the pre-EMU period (see, e.g., the reviews by Dornbusch, Favero, and Giavazzi, 1998; Guisso,
Kashyap, Panetta, and Terlizze, 1999; Ehrmann, 1998; and Hubbard, 2000).
II. INVESTOR PROTECTION AND FINANCIAL STRUCTURE
How should investor protection affect financial structure? The logic of optimal
contracting in the presence of moral hazard suggests weak investor protection would require
substantial commitment of funds by firm insiders (concentrated inside ownership) and high
(perhaps prohibitively high) costs of external financing. In Gertler and Hubbard (1988), for
example, a moral hazard problem arises from the assumption that investable funds may go for
"hard capital" (say, machines, which are observable) or complementary "soft capital" (say,

2 La Porta, Lopez-di-Silanes, Shleifer, and Vishny (1999) also illustrate partial equilibriumrelationships among investor protection, inside ownership, and the value of the firm.
3 We provide further details in section II.
6
management or R&D activities entailing unobservable effort). In this case, insiders may be
tempted to divert funds intended for soft capital to personal use in the absence of investor
protection. In that setting, weak investor protection increases the potential for expropriation or
diversion, raising the fraction of investment which must be funded by the insider and increasing
the shadow cost of external funds.2
To explore this prediction empirically, we follow the approach of Demsetz and Lehn
(1985) and Himmelberg, Hubbard, and Palia (1999) by modeling the determinants of inside equity
ownership concentration. We allow cross-sectional variation in ownership concentration to
depend on firm variables proxying for agency problems; we augment these by country-specific
measures of legal protection for suppliers of funds. For country-level measures of investor
protection, we use three of the proxies assembled by La Porta, Lopez-di-Silanes, Shleifer, and
Vishny (1998): "shareholder rights," "creditor rights," and "efficiency of the judicial system." The
"shareholder rights" index measures how strongly the legal system favors minority shareholders
against managers or dominant shareholders in the corporate decisionmaking process. The
"creditor rights" index measures the rights of secured creditors against borrowers in
reorganizations and liquidations. The "efficiency of the judicial system" is a survey measure
compiled by a private credit rating agency, and provides an assessment of the efficiency and
integrity of the legal environment for business.3
The structure of the legal system is implicit in most models of financial structure. In the
4 The emphasis on specific legal protection emphasized in the La Porta, Lopez-di-Silanes,Shleifer, and Vishny research program differs from the "private contracting" emphasis in the lawand economics literature in which entrepreneurs, knowing that investors understand explorationpossibilities, have a strong incentive to offer contracts to limit the scope of expropriation (as inJensen and Meckling, 1976). This Coase (1961) theorem line of argument assumes effectiveenforcement of contracts (as in Stigler, 1964; and Easterbrook and Fischel, 1991).
5 Coffee (2000) explains the superior protection of outside investors in a common lawsystem as stemming from judicial decisionmaking based on legal precedent guided by a principle of fiduciary responsibility. Civil law courts are argued to be less challenging of managerialdiversion as long as some plausible business case can be made. La Porta, Lopez-di-Silanes,Shleifer, and Vishny (1999a) argue that this intuition masks a deeper historical factor that thestate has traditionally regulated business activity to a greater degree in civil law than in commonlaw countries.
6 La Porta, Lopez-di-Silanes, Shleifer, and Vishny (2000) observe that, as a rule,differences among legal parents relate to the protection of outside investors generally as opposedto differences in the strength of protection of shareholders and creditors.
7
classic description by Modigliani and Miller (1958) of the firm as a set of investment projects and
cash flows, it is assumed managers can frictionlessly assign cash flows to investors. In the Alchian
and Demsetz (1972) and Jensen and Meckling (1976) model of the firm, expropriation of outside
investors is limited by residual equity ownership by insiders (entrepreneurs). In the residual
control rights frameworks of Grossman and Hart (1988) and Hart and Moore (1990) corporation,
securities, and bankruptcy laws are assumed to outline at least some of the rights accorded to
insiders and outside investors.
The legal system approach of LaPorta, Lopez-di-Silanes, Shleifer, and Vishny is based in
part on the idea that commercial legal codes derive from a few legal parents including English
(common) law, and French and German (civil) law derived from Roman civil law (see, e.g., David
and Brierley, 1985).4 Central to this distinction is its usefulness in describing protections given to
outside investors,5,6 with strongest protection in common law countries, weakest protection in

8
French civil law countries, and generally in-between levels of protection in German civil law and
Scandinavian countries. These traditions spread through colonization and voluntary adoption.
England and its farmer colonies have corporate relations based on common law, while French civil
law extends to former French, Belgian, Spanish, and Dutch colonies. Germany and its former
colonies have commercial legal codes based on German civil law tradition; Scandinavian countries
form their own tradition. We do not exploit the data on legal origin, but instead use data on
actual legal environment which have evidently evolved from these origins.
III. OWNERSHIP AND THE MARGINAL COST OF DEBT FINANCING
To establish a link between financial structure and investment requires a structural model
of the firm's investment decisions. Our model of investment is standard except for modifications
meant to capture the assumption that external debt and equity financing are costly. We do not
model directly the external cost of equity financing; instead, we assume the cost of external equity
financing is sufficiently expensive that it is not frequently used as the active margin for external
financing. We model debt financing by assuming that the marginal cost of debt is increasing in the
firm's leverage ratio, measured as the ratio of debt relative to debt plus the market value of equity.
This assumption implicitly focuses on debt financing as the active margin for external financing,
where it is generally assumed that the additional premium would emerge from a wide class of
models where borrowers face incentive or commitment constraints. Following Gilchrist and
Himmelberg (1998), we conjecture that financial frictions in this class of models can be
represented empirically by modeling the gross return on debt required by debtholders as:
9
1 1+ +r B Kt t t tb g b gc hη ξ, , ,
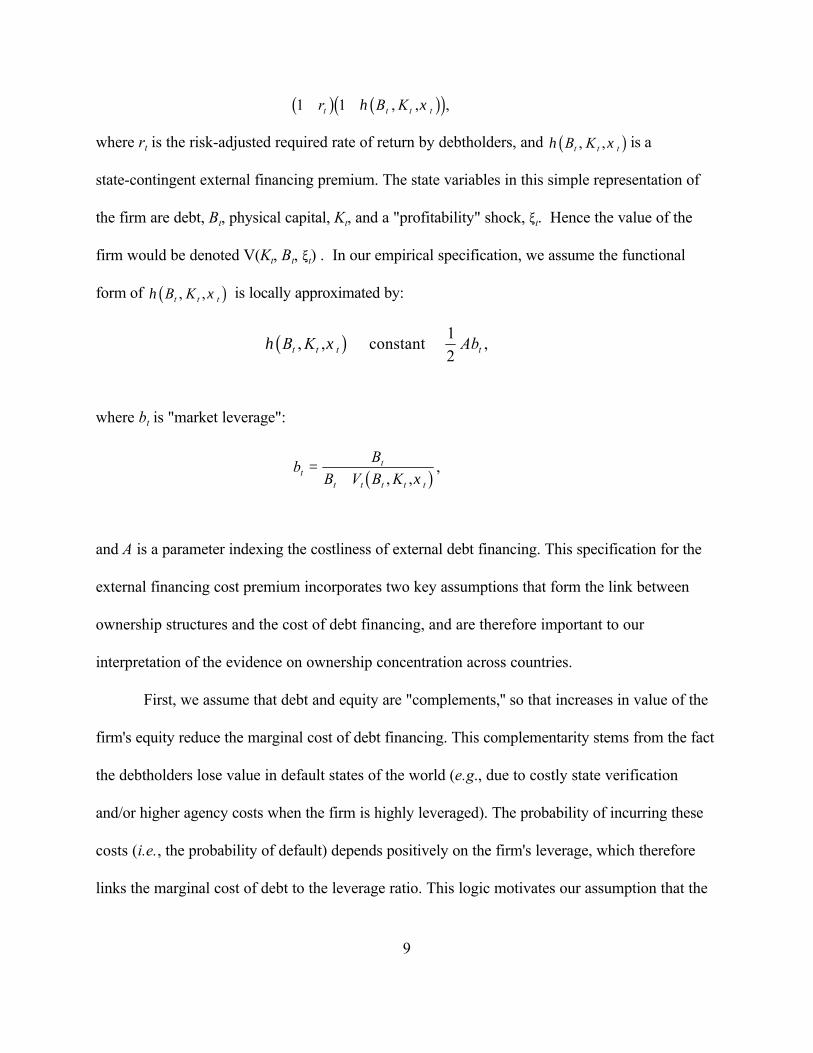
where rt is the risk-adjusted required rate of return by debtholders, and is a η ξB Kt t t, ,b gstate-contingent external financing premium. The state variables in this simple representation of
the firm are debt, Bt, physical capital, Kt, and a "profitability" shock, >t. Hence the value of the
firm would be denoted V(Kt, Bt, >t) . In our empirical specification, we assume the functional
form of is locally approximated by:η ξB Kt t t, ,b g
η ξB K Abt t t t, , ,b g ≅ + constant 12
where bt is "market leverage":
bB
B V B Ktt
t t t t t
=+ , ,
,ξb g
and A is a parameter indexing the costliness of external debt financing. This specification for the
external financing cost premium incorporates two key assumptions that form the link between
ownership structures and the cost of debt financing, and are therefore important to our
interpretation of the evidence on ownership concentration across countries.
First, we assume that debt and equity are "complements,'' so that increases in value of the
firm's equity reduce the marginal cost of debt financing. This complementarity stems from the fact
the debtholders lose value in default states of the world (e.g., due to costly state verification
and/or higher agency costs when the firm is highly leveraged). The probability of incurring these
costs (i.e., the probability of default) depends positively on the firm's leverage, which therefore
links the marginal cost of debt to the leverage ratio. This logic motivates our assumption that the

10
external finance premium on the cost of debt financing is increasing in the leverage ratio.
Second, we assume that the marginal cost of equity financing is higher in countries with
weak investor protection. The idea is that inside equity holders would, if they could do so
cheaply, sell additional equity to "minority" shareholders, which, by reducing the leverage ratio,
lower the marginal cost of debt financing. In countries with weak legal protection, however, the
contracting environment is such that the insiders cannot easily commit to not expropriating wealth
from outside shareholders. Thus countries with weak legal protections for minority shareholders
will face high marginal costs of equity financing, and therefore, high marginal costs of debt
financing.
This argument generates an empirical implication that we exploit in the next section. In
countries with weak legal protections for minority shareholders, we expect share ownership to be
more highly concentrated, because concentrated shareholders can more easily coordinate to
reduce expropriation. Hence concentrated share ownership endogenously reveals firms
(countries) where the marginal cost of equity financing is high, and therefore identifies firms
(countries) where the marginal cost of debt financing is high. Models predicting shareholder
concentration as a function of the contracting environment should therefore be useful for
predicting which firms and countries should display more sensitivity to financial frictions in their
investment behavior. We estimate this sensitivity using an Euler equation for investment.
To derive the required Euler equation, we insert our model of debt financing into a
standard adjustment cost model of investment. As is well known, financial frictions introduce an
additional term to the Euler equation – a "shadow discount rate'' – which is high when the firm is
constrained and therefore allocating investment as if it faced a high discount rate. The shadow

11
discount rate is a function of the Lagrange multipliers on the equity-financing constraint, which
are not observed in data. Fortunately, the first-order condition for debt relates the shadow
discount rate to the debt-to-equity ratio, so the Euler equation for investment can be specified in
terms of observed data.
We specify the balance of the formal model as follows. Let denote theΠ K t t,ξb gmaximized value of current profits, taking as given the beginning-of-period capital stock, Kt, and a
profitability shock, >t. Assume the required time to build and install one unit of capital is one
period, where * is the rate of capital depreciation and It is the investment expenditure, so that the
capital stock evolves according to the equation Kt+1 = (1 - * )Kt + It. Let C(It, Kt) denote the
adjustment cost of installing It units of capital; let the purchase price of capital be normalized to
one; and let (1 + rt+1)-1 the ex ante, one-period discount factor used to value period t + 1 dividends
at time t. Then the manager's problem is given by:
(1) V K B D Er
Dt t tB
t ts k
s
t kt s
t s s
, , ,,
ξb g l q= +
+FHG
IKJ+ + =
∞=
∞
= ++∑∏max
I t +s 1 0 1 1
11
subject to:
(2)D K C I K I B r B K Bt t t t t t t t t t t t= ∏ − − + − + ++, , , , ,ξ η ξb g b g b g b gc h1 1 1
(3) K K It t t+ = − +1 1 δb g ,
(4)Dt ≥ 0,
where Et is the expectations operator conditional on the time t information set St.
We can describe the effect of financial frictions by studying the firm's stochastic Euler
equations for investment and borrowing. Let 8t be the Lagrange multiplier for the non-negativity

7In our empirical specification, we assume the magnitude of is second order.∂ ∂C Kit it
8 See, e.g., Hubbard and Kashyap (1992); Whited (1992); Bond and Meghir (1994);Hubbard, Kashyap, and Whited (1995); and Gilchrist and Himmelberg (1998).
12
constraint on dividends. The multiplier 8t indicates the shadow value of paying a "negative''
dividend, and can thus be interpreted economically as the shadow cost of internally generated
funds. That is, one dollar of internal funds is worth (1 + 8t ) because the marginal value of
investment projects for a constrained firm exceeds their replacement cost. The role of this shadow
cost in the firm's investment decision can be seen most clearly by deriving the Euler equation for
investment:
(5)11
111
1 11
11 1+ =
+FHG
IKJ
++
FHG
IKJ + − +
LNM
OQP+
++ +c E
rct t
t
t
tt tb g b gb gc hλ
λπ δ ,
where ct is the marginal cost of adjustment, , and Bt is the marginal profitability of∂ ∂C It t
capital, .7 ∂ − ∂Π t t tC Kb gIn the absence of financing frictions, equation (5) says that the marginal cost of an
additional dollar of investment, 1+ct, equals the (discounted) future benefit,
With financing constraints, these marginal costs and benefits are valued atπ δt tc+ ++ − +1 11 1b gb g.their respective "shadow values," 1+ λ λtb g b gand 1+ t +1 .
The above Euler equation is familiar from several papers that have investigated the optimal
behavior of investment under financing frictions.8 If there were no external financing cost
premium associated with equity or debt financing, the dividend constraint would not bind (8t =
0), and the firm would be indifferent toward issuing debt or issuing equity. That is, the shadow

9 Our approach to measuring the marginal product of capital, B, is as follows. If firmsface a downward-sloping demand curve with a constant price elasticity of demand equal of T andproduction is Cobb-Douglas, then it is easy to verify that the marginal profitability of capital isgiven by
π ω= + −1 1c h b ga S KK /
13
cost of internal funds, would equal unity, and the Euler equation would be1 11+ ++λ λt tb g b g/ ,
identical to the equation derived under perfect capital markets.
In the presence of financial market imperfections, however, 0t > 0, and the firm will
generally find itself in states of the world where it would like to issue equity at the fair price, but
cannot; hence (8t > 0). Note that 8(Kt, Bt, >t) is, in general, state-dependent, and therefore time-
varying. To simplify, we assume that the external financing premium, 0t, is non-stochastic (does
not depend on >t+1). This implies that 0t+1 is in the firm's information set at time t. The first-order
condition for debt requires that:
(6)E K BK B
BBt
t
tt t
t t
tt
11
1 111 1
1 1
11
++
RSTUVW + +
∂∂
FHG
IKJ =+
+ ++ +
++
λλ
ηη
,,
.b g b g
The marginal cost of debt determines the shadow cost of funds today versus tomorrow (i.e., 8t
versus 8t+1), and hence provides a time varying discount factor that depends on the level of net
financial liabilities, Bt (among other state variables).
Our functional form assumption for 0t implies Under theηη
tt
tt t
ddB
B Ab+ ⋅ = .
assumption that the covariance among the various terms in the Euler equation is approximately
constant, and using our functional form assumption for 0t, we can substitute the first-order
condition for debt into the Euler equation for investment to obtain (approximately – up to a
constant):9
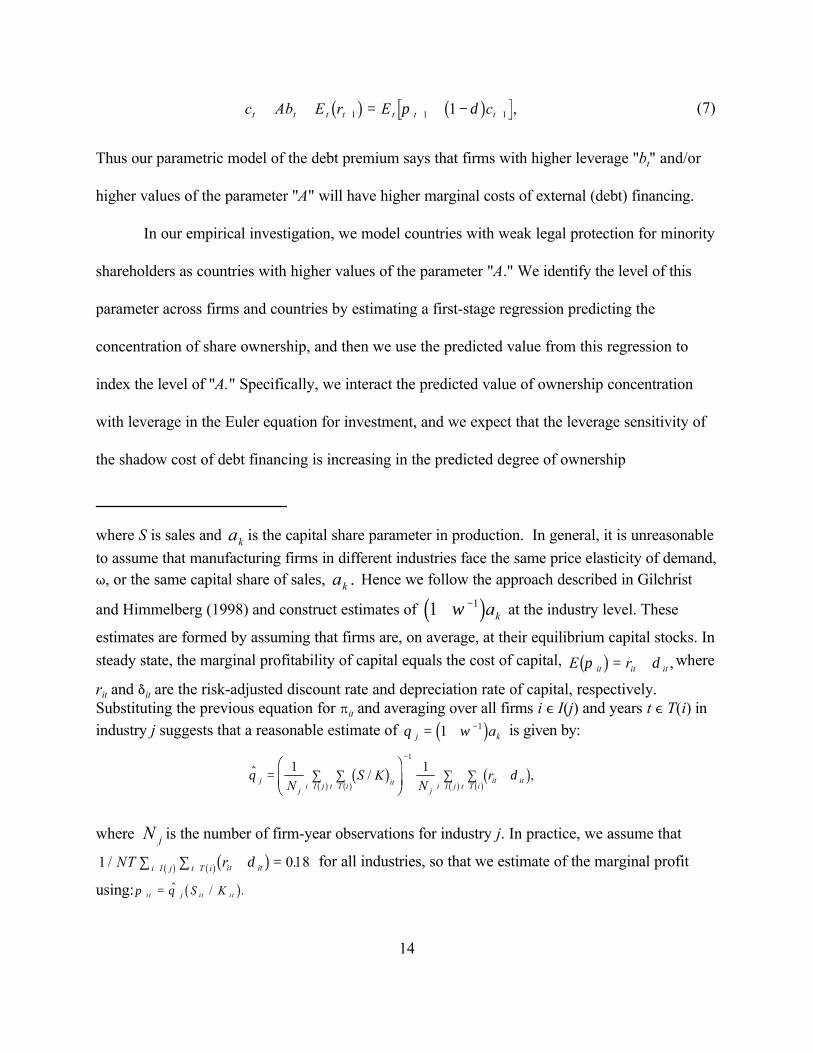
where S is sales and is the capital share parameter in production. In general, it is unreasonableak
to assume that manufacturing firms in different industries face the same price elasticity of demand,T, or the same capital share of sales, Hence we follow the approach described in Gilchristak .
and Himmelberg (1998) and construct estimates of at the industry level. These1 1+ −ωc hak
estimates are formed by assuming that firms are, on average, at their equilibrium capital stocks. Insteady state, the marginal profitability of capital equals the cost of capital, whereE rit it itπ δb g = + ,
rit and *it are the risk-adjusted discount rate and depreciation rate of capital, respectively. Substituting the previous equation for Bit and averaging over all firms i , I(j) and years t , T(i) inindustry j suggests that a reasonable estimate of is given by:θ ωj ka= + −1 1c h
$ / ,θ δjj i I j t T i it
j i I j t T iit itN
S KN
r= ∑ ∑FHG
IKJ ∑ ∑ +
∈ ∈
−
∈ ∈
1 11
b g b g b g b gb g b g
where is the number of firm-year observations for industry j. In practice, we assume thatN j
for all industries, so that we estimate of the marginal profit1 018/ .NT ri I j t T i it it∑ ∑ + =∈ ∈b g b gb gδ
using:π θit j it itS K= $ / .b g
14
(7)c Ab E r E ct t t t t t t+ + = + −+ + +1 1 11b g b gπ δ ,
Thus our parametric model of the debt premium says that firms with higher leverage "bt" and/or
higher values of the parameter "A" will have higher marginal costs of external (debt) financing.
In our empirical investigation, we model countries with weak legal protection for minority
shareholders as countries with higher values of the parameter "A." We identify the level of this
parameter across firms and countries by estimating a first-stage regression predicting the
concentration of share ownership, and then we use the predicted value from this regression to
index the level of "A." Specifically, we interact the predicted value of ownership concentration
with leverage in the Euler equation for investment, and we expect that the leverage sensitivity of
the shadow cost of debt financing is increasing in the predicted degree of ownership

15
concentration.
To summarize, the empirical implementation of our model assumes that the marginal cost
of external financing, Abt, in the investment Euler equation can be approximated as (dropping the
constant):
E a b a m bt t t t tη + ≅ +1 1 2b g $ ,
where a1 and a2 are parameters, and is the predicted level of ownership concentration from a$mt
first-stage regression of ownership on variables characterizing the contracting environment.
We also assume a flexible form for the adjustment cost function:
c I K I Kt t t= −
−α γ/ / .b g b g 1
Combining these parametric assumptions, the parameter estimates we below are based on the
Euler equation (dropping the constant):
(8)E E I K I K I K a b a m bt t t t t t t t tπ α δ α γ δ αγ+ + −≅ − − + + − − + +1 1 1 1 21 1 1b g b g b g b gc hb g b g/ / / $ .
Note that has been absorbed into the constant term; this reflects the fact that all estimatesE rt t +1b greported in the next section are estimated with separate year dummies for each industry. We
estimate this equation using instrumental variables, as described in the next section.

10 For example, if one company reports sales with included excise taxes and anothercompany excludes taxes, Worldscope corrects this difference and presents both with tax excluded.This is important for our purposes because sales is the key ingredient in the measure of themarginal product of capital, so it is therefore desirable that it have as much cross-countrycomparability as possible.
16
IV. EMPIRICAL RESULTS
A. Data
We take our firm-level data from the Worldscope database, which contains information on
large, publicly traded firms, in which there is an investor interest. As noted by La Porta, Lopez-di-
Silanes, Shleifer, and Vishny (1997), the coverage within countries varies widely from as little as
one percent of all listed domestic firms included (for India) to as many as 82 percent (for
Sweden). The benefit of using this sample lies in a cross-country comparability of firms included
in the sample, which, again, focuses on publicly traded firms. This sample allows one to compare
"apples to apples" across countries and separate the effects of different financial and legal
environments, which is the center of attention here. Large firms are more important for aggregate
economic growth than are small firms. An additional benefit of using these data is the attempt by
Worldscope to standardize accounting information to improve cross-country comparability.10
From the Worldscope database we selected a sample of 40 countries with over 7000 firms
for the years 1988-1998. We present details on the sample selection are given below. Table 1
gives the list of countries in the sample with the number of firms and observations per country.
The main firm-level variables are ownership concentration, the investment to capital ratio, sales-
to-capital ratio, book leverage, and market leverage (see Table 2 for definitions). One variable
that requires additional explanation is the beginning-of-period capital stock which appears in the
adjustment cost function and in the construction of our proxy for the marginal product of capital.
17
The most obvious empirical analogue would be the lagged capital stock (i.e., period t-1 used as
the beginning of the period t capital stock), but this measure is potentially contaminated by
potentially serious measurement error due to mergers, acquisitions, divestitures, or other capital-
changing events. Moreover, there is no systematic way of identifying these transactions in the
data, and it such events are identified by omitting observations with "unexplainable" changes in
the capital stock, too much of the sample is lost. The alternative is to calculate capital according
to the capital accumulation formula (Table 2), which is robust to these capital-changing events.
We augment these firm-level data using three country-level indicators of the legal system
and investor protection, developed by La Porta, Lopez-di-Silanes, Shleifer, and Vishny (1998).
Specifically, we use "shareholder rights," "creditor rights," and a measure of law enforcement,
"efficiency of the judicial system." The "shareholder rights" index measures how strongly the
legal system favors minority shareholders against managers or dominant shareholders in the
corporate decisionmaking process. This index is a sum of seven characteristics, each of which is
assigned a value of one if the right increases shareholder protection, and zero otherwise. The
"creditor rights" index measures the rights of senior secured creditors against borrowers in
reorganizations and liquidations. This index is a sum of four characteristics, each of which is
assigned the value of one if the right increases creditor protection, and zero otherwise. The
components of these indexes are described in the Appendix.
The “efficiency of the judicial system” is an assessment of the efficiency and integrity of
the legal environment as it affects business, particularly foreign firms. The index is produced by
the country-risk rating agency Business International Corporation. The value we use is the
average between 1980-1993, scaled from 0 to 10, with lower scores for lower efficiency levels.
18
Table 3 reports summary statistics for the universe of firms available in Worldscope that
we use for our empirical work. This table reveals that the number of firms varies widely across
countries. This variation reflects several factors. First, and most obviously, some countries are
simply larger, and therefore have larger firm populations. Second, these data cover only publicly
traded firms, so the sample reflects the endogenously decision of firms to go public or remain
private. For example, there are more firms in countries like the United Kingdom (1129 firms)
which have strong legal protection for minority shareholders than there are in countries like
Germany (468 firms), which has a larger economy but weaker shareholder protection. Third, in
countries like India (269), data collection is simply more difficult, and investor interest, perhaps, is
not as strong, so Worldscope has not collected complete data on the available universe of publicly
traded firms.
B. Ownership Concentration
Our first empirical exercise is to estimate the effect of country-level measures of investor
protection (described above) on inside ownership, holding constant firm characteristics
influencing ownership. This regression resembles the regression reported by La Porta, Lopez-di-
Silanes, Shleifer, and Vishny (1998). Their analysis was based on a cross-country regression of
the mean ownership concentration of the ten largest firms in the country on a set of country-level
explanatory variables which included measures of legal efficiency and protection, as well as
country-level control variables like log of GNP and log of GNP per capita. Our specification, by
contrast, uses firm-level data to control for the country-specific composition of firm
characteristics that are known to affect ownership concentration. We included the most important

11 Himmelberg, Hubbard, and Palia (1999) also report that variables like advertisingintensity help to predict ownership intensity. We omitted this variable from the presentspecification because of data limitations.
19
firm-level explanatory variables for ownership concentration reported by Himmelberg, Hubbard,
and Palia (1999) in our specification for ownership concentration.11 Specifically, we use log sales
(as measures of firm size), the Sales/Capital ratio, the R&D/Sales ratios (as a measure of soft
capital), two-digit (SIC) industry dummies, and year dummies. The variable RDDUM is a dummy
variable which equals unity if no R&D information is reported, and zero otherwise. This variable
provides an additional discrete indicator of R&D intensity because R&D is usually reported
missing when it is zero. As our measure of inside ownership, we use the variable “closely held
shares” as reported by Worldscope. To insure robustness of our results to the possibility of
selection bias introduced by the idiosyncracies of the Worldscope data, we report estimates using
a number of subsets of the data.
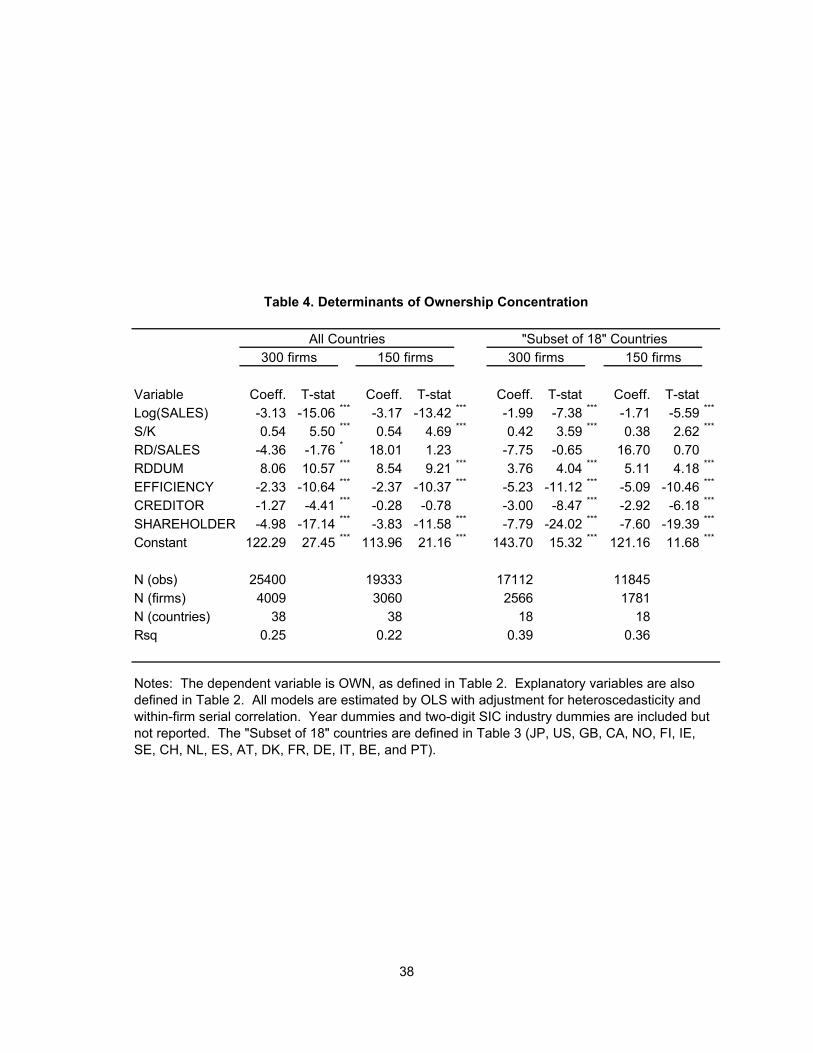
We report four sets of estimated coefficients for models of ownership concentration in
Table 4. The first two columns use data for 39 countries in our Worldscope sample; the second
set of two columns uses a subset of the data containing most of the European countries plus
Japan, Canada, and the United States. In the table headings, we refer to these countries as the
"Subset of 18." Within each set of firms, results are presented for samples of the largest 300 and
150 firms, respectively, to ensure comparability of firms in similar positions in the size
distribution.
The results reported in Table 4 broadly support the idea that ownership concentration is
endogenously determined by the scope for moral hazard (specifically, by the scope for
expropriation of minority shareholders by insiders). Just as in Himmelberg, Hubbard, and Palia
12 Though not reported here, holdings of cash relative to total assets (a potential indicatorof the high cost of external financing – see Opler, Pinkowitz, Stulz, and Williamson, 1998; andHubbard, Kuttner, and Palia, 1999) are also negatively related to the measures of investor
20
(1999), we find that the firm-level determinants – log sales, capital intensity, and R&D intensity –
are all statistically significant predictors of ownership concentration with the predicted signs.
Moreover, we find strong confirmation for the results reported by La Porta, Lopez-di-Silanes,
Shleifer, and Vishny (1998), that estimated effects on ownership concentration of country-level
measures of legal efficiency and the degree of protection afforded to creditors and minority
shareholders have the predicted signs, and for the most part, are highly statistically significant.
Our preferred specification appears in the third column of Table 4, and reports results
using data for the largest 300 firms in each of the “Subset of 18” countries (Europe plus the
United States, Japan, and Canada). The estimated coefficients on legal efficiency, creditor
protection, and shareholder protection are all negative. These results are robust for the broader
sample of 39 countries as well as to the cutoff choice for looking at either the top 150 or top 300
firms in each country. The negative signs on legal efficiency and shareholder protection support
the argument made by La Porta, Lopez-di-Silanes, and Vishny (1998) that ownership
concentration is a substitute for legal institutions as a mechanism for constraining the
expropriation of outside equity investors. The economic intuition for the negative coefficient on
creditor protection is less obvious, but also supports this view; to the extent that debt financing is
costlier due to weak creditor protection, firms will rely more on equity financing. Because the
marginal source of equity financing is presumably not coming from inside shareholders, this
reliance will tend to reduce ownership concentration and increase the marginal cost of external
financing.12, 13
protection, holding constant firm characteristics.
13 In a related analysis, Claessens, Djankov, and Lang (2000) study ownership of 3000firms in nine East Asian economies. With the exception of Japan, which offers reasonably goodprotection of outside investors, they find concentrated ownership by families.
21
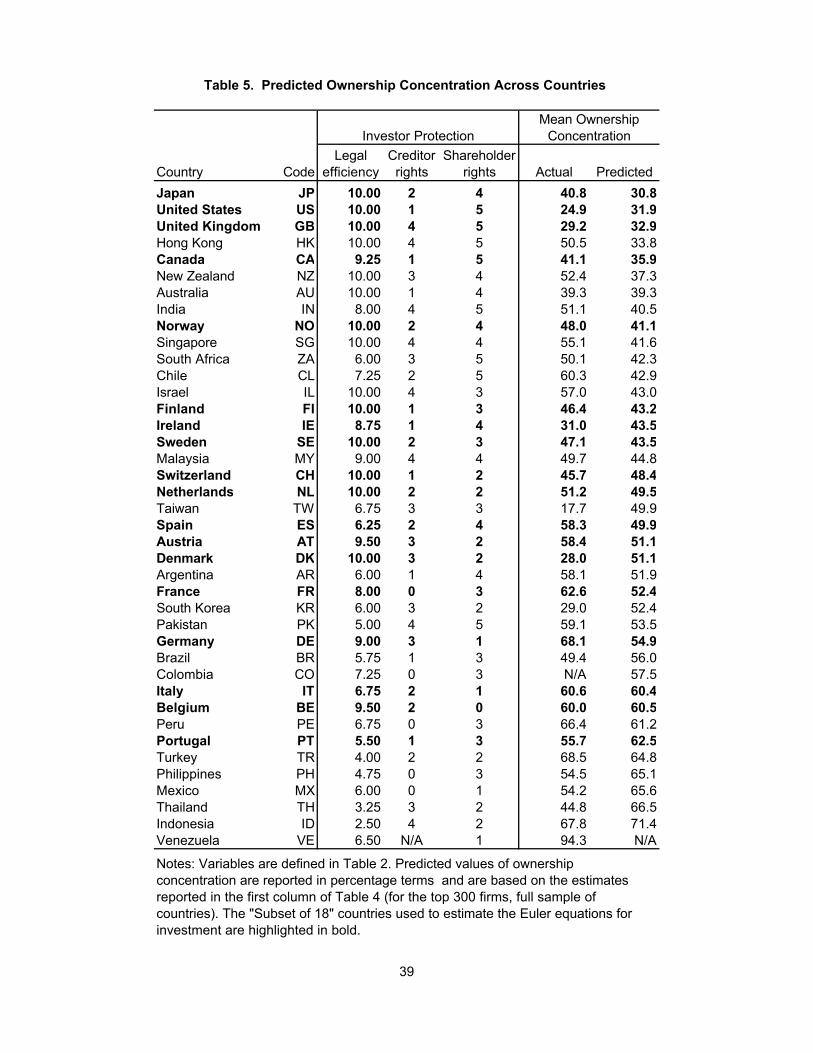
Using the results from the first column of Table 4, we report the ranking of countries by
predicted ownership in Table 5. Two observations about the rankings in Table 4 are particularly
noteworthy. First, predicted and actual inside ownership are generally quite close. Second, there
is substantial variation in ownership even among countries in the "Subset of 18" sample. In the
next section, these predicted ownership levels are used as interaction variables in the specification
of Euler equation relating leverage ratios to the marginal cost of debt finance
C. Euler Equation Estimates
We now turn to the question of how predicted ownership concentration based on country
and firm characteristics affects the sensitivity of the cost of debt financing. For these results, we
restrict the sample to the “Subset of 18” because we are primarily interested in identifying cross-
country differences in the sensitivity of the cost of capital for members of the European Monetary
Union. To increase sample size, however, and for sake of comparison, the “Subset of 18” also
includes several large industrial and European countries that are not part of the EMU.
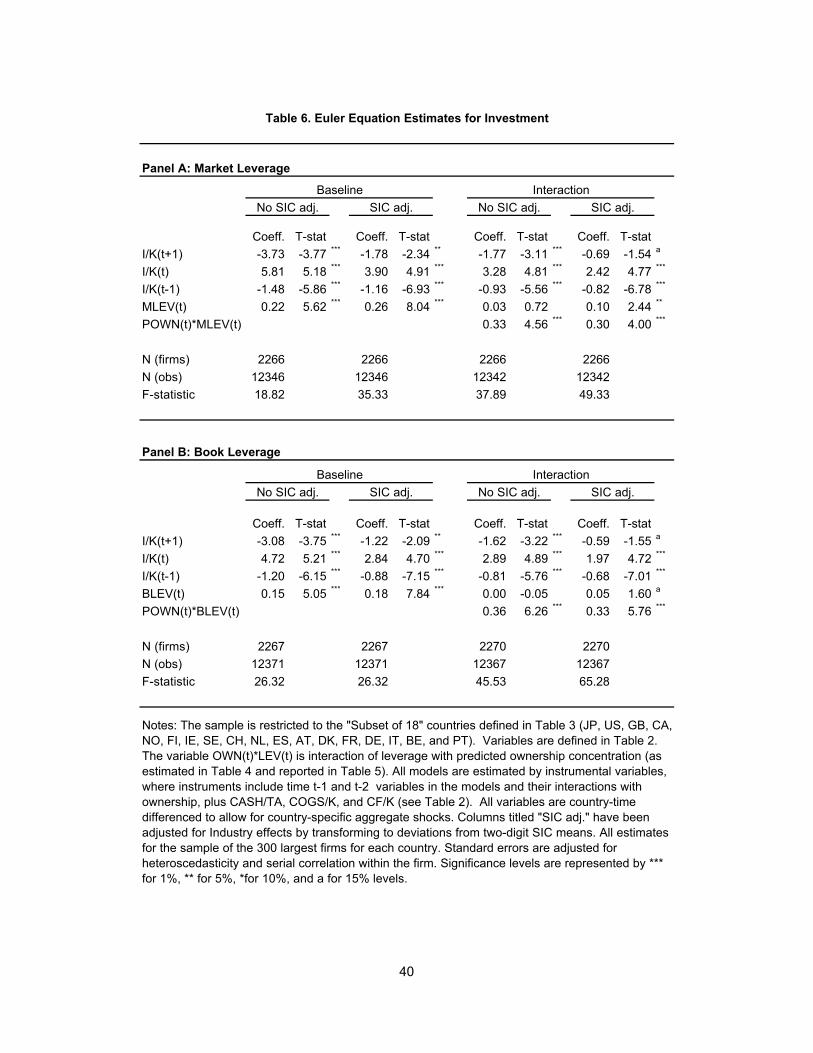
All of the model specifications reported in Table 6 are estimated by instrumental variables
where instruments include all of the variables in the model that are dated time t - 1 and t-2. For
added efficiency, we also include time t-1 and t-2 values of CASH/TA (stock of cash/total assets),
COGS/K (cost of goods sold/capital stock), and CF/K (cash flow/capital stock), although the
results are not sensitive to the inclusion of these additional instruments. All variables are country-

22
time differenced to allow for country-specific aggregate shocks. Columns titled "SIC-adj." have
been adjusted for industry effects by transforming to deviations from two-digit SIC means. All
estimates are for the sample of the 300 largest firms for each country. We adjust standard errors
are adjusted for heteroscedasticity and serial correlation within the firm.
The Euler equation estimates for the eight specifications reported in Table 6 imply
reasonable values for the structural parameters of the model, namely, the adjustment cost
parameters and the parameter measuring the implied sensitivity of the marginal cost of funds to
changes in the leverage ratio. The values of the structural parameters are particularly reasonable
in those specifications that allow the leverage sensitivity to vary across countries according to the
predicted level of ownership concentration. Our preferred specification appears in the last column
of Panel A, which reports the specification estimated with two-digit industry dummies and
leverage interactions with predicted ownership.
First, from the Euler equation in equation (8), the theoretical coefficients on (I/K)t+1,
(I/K)t, and (I/K)t-1 are, respectively:
b b b1 2 31 1 1= − − = + − = −α δ α γ δ αγb g b gc h, , , and
The estimated values of these coefficients in our preferred specification (reported in the last
column of Table 6, Panel A) are b1 = – 0.69, b2 = 2.42, and b3 = – 0.82, respectively. Hence the
estimated coefficients all have the predicted sign and are estimated with reasonable precision.
Moreover, the signs and magnitudes of implied values for ", and ( are reasonable. To obtain
estimates of these structural parameters from the reduced form parameters, we use a minimum
distance estimator. Setting *=0.10, the estimated value of " is 3.46 with a t-statistic of 10.60, and
the estimated value of ( is 0.30 with a t-statistic of 19.42. To gauge the reasonableness of these

23
adjustment cost parameters, if the mean investment rate were 0.20, then the average marginal
adjustment cost would be 3.46(1 - 0.30)0.2 = 0.48, which says that on the margin, the magnitude
of adjustment costs represent 48 percent of the purchase cost.
Having established the plausibility of our Euler equation specification and parameter
estimates, we turn to the interpretation of our estimates of the marginal cost of external financing.
Recall that our empirical specification was motivated in part by the observation that debt is the
active margin of external financing for most firms. Hence we assumed that the external finance
premium depends on leverage, and we further assumed that the magnitude of this sensitivity
depends on the marginal cost of equity financing, which we measured using the predicted level of
ownership concentration for the firm. This logic gave rise to the following specification for the
marginal cost of external financing:
ηη
tt
tt t t
ddB
B a a m b+ ⋅ = + + ⋅ ⋅ constant 1 2 $ .b g
Table 6 reports the estimates of a1 and a2. In the baseline specification, reported in the
first two columns of Panel A, we estimate a restricted version of the model in which we impose
the assumption that the sensitivity of the external finance premium to leverage is the same across
all firms and countries (i.e., a2 = 0). In the first column, the estimated value of a1 is 0.22 with a
t-statistic of 5.62. In the second column, when we control for two-digit SIC industry dummies,
the estimated coefficient rises to 0.26, and the t-statistic rises to 8.04. Hence the Euler equation
estimates reveal that there is an additional shadow cost term for investment that is correlated with
changes in the firm’s leverage ratio. Specifically, the estimated value of a1 = 0.26 implies, for
example, that a leverage change of one standard deviation (which equals 0.09 for the sample)

24
implies a change in the marginal cost of external financing of 2.34 percentage points. That is, if
one were to observe a firm increasing its leverage from, say, 0.40 to 0.49, then we could infer
from these estimates that its cost of capital had risen by 2.34 percentage points. In Panel B, the
use of book rather than market leverage produces similar effects, though of a somewhat smaller
magnitude (0.15 and 0.28, respectively, with t-statistics of 5.05 and 7.84).
The second half of Table 6 reports unrestricted Euler equation specifications in which the
sensitivity of the external finance premium is allowed to vary across countries according to the
estimated cost of external equity financing (as proxied by the predicted level of ownership
concentration). The last column of the table reports the results controlling for industry effects,
which is our preferred specification. (We obtain qualitatively similar results when industry effects
are not included.) The estimated values of a1 and a2 are 0.10 and 0.30, with t-statistics of 2.44
and 4.00, respectively. To interpret these estimates, recall that the “sensitivity” of the finance
premium to leverage changes is Hence this sensitivity ranges from 0.20 for thea a mt1 2+ $ .
United Kingdom (which had a predicted ownership concentration of ) to 0.28 for$ .mt = 0 33
Portugal (which had predicted ownership concentration of ). To put these estimates$ .mt = 0 63
in cost-of-capital terms, if one were to observe a firm increasing its leverage from 0.40 to 0.49,
then one could infer from these estimates that its cost of capital had risen by 1.80 percentage
points if it were located in the United Kingdom, and by 2.52 percentage points if it were located
in Portugal.

25
D. Cross-Country Variation in Sensitivity of Firm Investment to Net Worth Shocks
We can use the estimates presented in Table 6 to estimate cross-country differences in the
sensitivity of the cost of external financing (and hence investment) to a change in leverage. To
demonstrate the sense in which the estimated sensitivities in Table 6 are correlated with cross-
country aggregate measures of output sensitivity to monetary policy, Figure 1 plots our measures
of predicted ownership against the monetary policy impact variable synthesized by Cecchetti
(1999). The two measures are positively related with a correlation of 0.56 when we exclude
Japan.
Because Japan is an “outlier,” it makes an interesting case study for comparing our
measure with Cecchetti’s. His index assigns Japan a monetary impact index of 2.67, which places
it at the top end with other “high impact” countries like Italy and Austria. Our index, by contrast,
places Japan at the extreme opposite end; our estimates assign a sensitivity-to-leverage parameter
of 0.19, which is the lowest among the “Subset of 18” firms included in our Euler equation
estimates, similar to the United States and Great Britain. The difference stems from the fact that
Cecchetti’s index is based strictly on the features of the banking system (consistent with a narrow
“credit view” of the monetary transmission mechanism) whereas our measure estimates variations
in the cost-of-capital sensitivity to leverage according to the predicted ownership concentration.
Our measure is designed to capture the broader “net worth” channels of monetary policy in which
disruptions to net worth (as measured by the market value of leverage) are transmitted to real
investment decisions through their effect on the effective marginal cost of external financing. For
the case of Japan, therefore, we would conclude that despite having a banking system that
resembles Italy and Austria, Japan has legal structures and financial institutions that protect

14 La Porta, Lopez-di-Silanes, Shleifer, and Vishny (2000) argue that a key element infacilitating international convergence in the protection of outside investors is mandatory, thoroughdisclosure of financial information by securities issuers, with accuracy enforced by regulatedfinancial intermediaries.
26
minority shareholders (allowing diffusely held share ownership), which in turn indicate a lower the
marginal cost of external equity and lower marginal cost of debt.
V. CONCLUSIONS AND IMPLICATIONS
In this paper, we bring together recent research on determinants of corporate ownership
structure with research on costly external financing for investment to highlight the role played by
contracting costs in the absence of strong investor protection on both firm financial structure and
the cost of external funds for investment. Our principal findings, using firm-level data for a broad
sample of countries, are two: First, the weaker is legal protection, the more likely is concentrated
inside equity ownership and the higher is the marginal cost of equity financing. Second, to the
extent that the size of the firm's equity base reduces the cost of debt financing, the marginal cost
of debt financing is more sensitive to changes in firm net worth (proxied by leverage) in countries
in which weak investor protection has made the cost of external financing high.
Three implications of these basic results warrant further exploration. First, we have
shown that the impact of net worth shocks varies systematically across legal regimes for investor
protection. To the extent that monetary policy actions affect internal net worth (see, e.g., Gertler
and Hubbard, 1988; Gertler and Gilchrist, 1994; and Bernanke, Gertler, and Gilchrist, 1996,
1999), a common European monetary policy is still likely to generate asymmetric responses of
investment and output across countries (beyond the asymmetry arising simply from differences in
the interest sensitivity of investment across countries).14 Second, even if policy actions affect net

27
worth, models of the monetary transmission mechanism should be careful to consider differences
across countries in the vulnerability of firms' net worth to monetary shocks. Our results imply
that legal regimes lacking in strong investor protection leave firms' net worth more vulnerable to
monetary shocks. For example, to the extent that the legal system leads to a relatively greater
reliance on short-term debt, firms' liquidity is more exposed to short-term interest rate
fluctuations. Third, our results suggest that the complexion of industrial development across
countries is probably affected by the degree of investor protection (see also Carlin and Mayer,
1998). We are currently pursuing extensions in all three areas.

28
DATA APPENDIX
Data
As indicated in the text, our "shareholder rights" index is a sum of seven characteristics,
each of which is assigned a value of one if the right increases shareholder protection, and zero
otherwise. The components of this index are:
• One share-one vote rule: Investors are better protected when dividend rights are
linked tightly to voting rights, thereby preventing insiders from exercising
disproportionate control.
• Proxy by mail allowed: Voting by mail makes it easier for shareholders to exercise
their votes.
• Shares not blocked before meeting: In some countries, the law requires depositing
shares with the company several days prior the shareholder meeting; this practice
prevents shareholders from selling their shares around the meeting time, and it also
prevents shareholders who did not deposit from voting.
• Cumulative voting / proportional representation: This right give power to
minority shareholders to put their representatives on boards of directors.
• Oppressed minority rights: These give rights to shareholder to challenge director’s
decisions in court or force the company to repurchase the shares from minority
shareholders who object to management’s decisions.
• Preemptive right to new issues: This right protects shareholders from dilution.
• Percentage of share capital required to call an extraordinary shareholder
meeting: The higher the percentage – the harder it is for minority shareholders to

29
challenge the management; this variable is assigned value of one if the percentage
is below the world median of 10 percent).
The "creditor rights" index is a sum of four characteristics, each of which is assigned the
value of one if the right increases creditor protection, and zero otherwise. The components of
this index are:
• No automatic stay on assets: This variable is assigned a value of one if country
does not allow automatic stay on assets, which would protect the management and
unsecured creditors against secured creditors, and prevent the latter from seizing
collateral.
• Secured creditors paid first: This right gives priority to secured creditors to be
first in line in reorganization; in some countries secured creditors are in line behind
both the government and workers.
• Restrictions on going into reorganization: This variable gives a value of one to the
countries that require creditors' consent to file for reorganization; for example, the
United States' Chapter 11 does not require creditors' consent, which gives
management more power in reorganizations – therefore the United States gets
zero on this measure.
• Management does not stay in reorganization: This variable gives a value of one if
management is replaced at the start of reorganization procedure, and zero
otherwise.
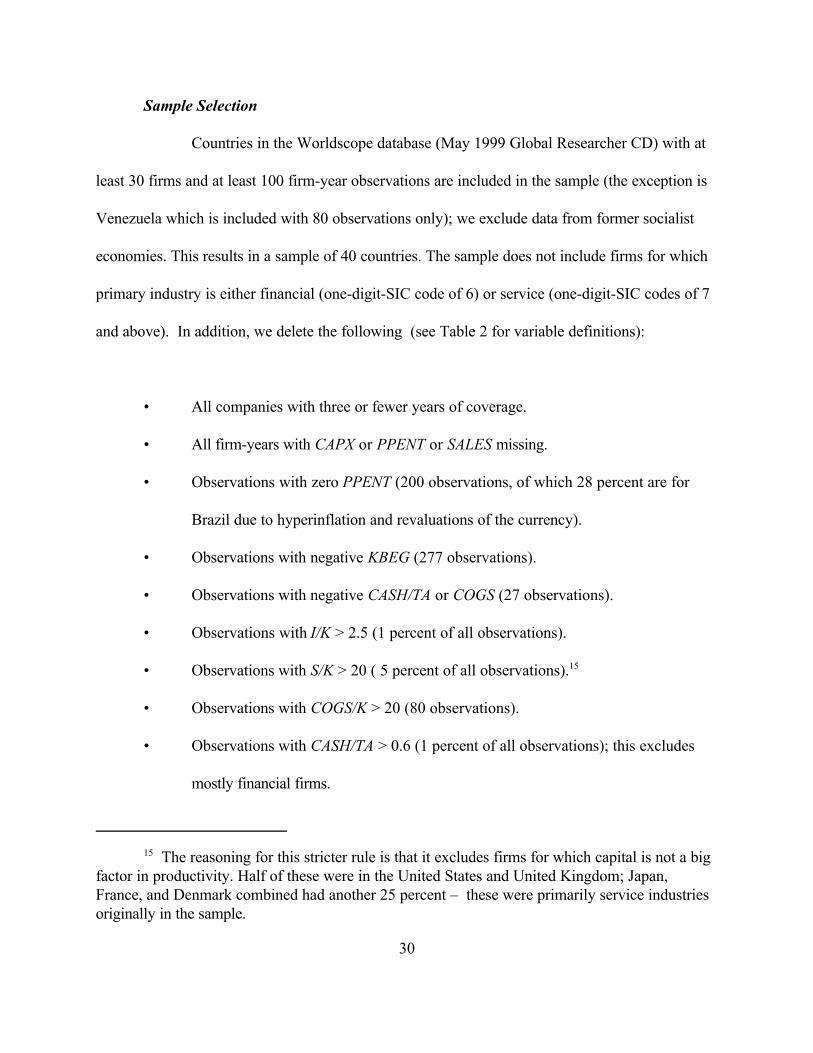
15 The reasoning for this stricter rule is that it excludes firms for which capital is not a bigfactor in productivity. Half of these were in the United States and United Kingdom; Japan,France, and Denmark combined had another 25 percent – these were primarily service industries originally in the sample.
30
Sample Selection
Countries in the Worldscope database (May 1999 Global Researcher CD) with at
least 30 firms and at least 100 firm-year observations are included in the sample (the exception is
Venezuela which is included with 80 observations only); we exclude data from former socialist
economies. This results in a sample of 40 countries. The sample does not include firms for which
primary industry is either financial (one-digit-SIC code of 6) or service (one-digit-SIC codes of 7
and above). In addition, we delete the following (see Table 2 for variable definitions):
• All companies with three or fewer years of coverage.
• All firm-years with CAPX or PPENT or SALES missing.
• Observations with zero PPENT (200 observations, of which 28 percent are for
Brazil due to hyperinflation and revaluations of the currency).
• Observations with negative KBEG (277 observations).
• Observations with negative CASH/TA or COGS (27 observations).
• Observations with I/K > 2.5 (1 percent of all observations).
• Observations with S/K > 20 ( 5 percent of all observations).15
• Observations with COGS/K > 20 (80 observations).
• Observations with CASH/TA > 0.6 (1 percent of all observations); this excludes
mostly financial firms.
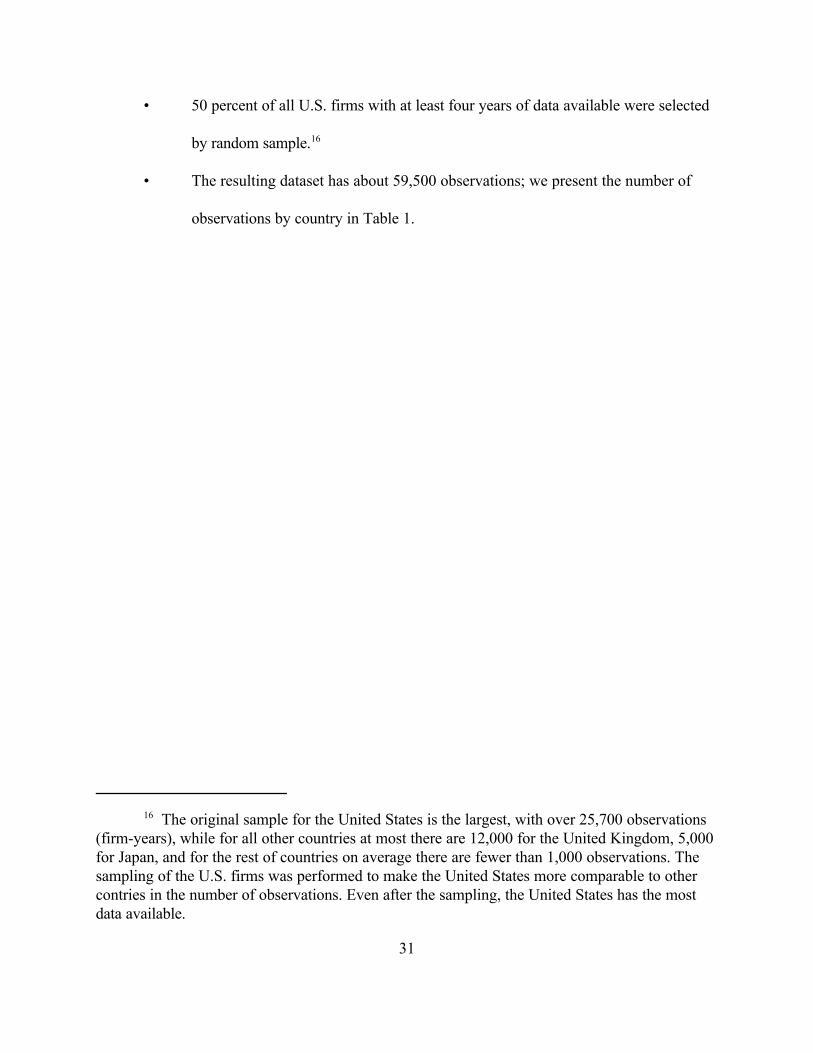
16 The original sample for the United States is the largest, with over 25,700 observations(firm-years), while for all other countries at most there are 12,000 for the United Kingdom, 5,000for Japan, and for the rest of countries on average there are fewer than 1,000 observations. Thesampling of the U.S. firms was performed to make the United States more comparable to othercontries in the number of observations. Even after the sampling, the United States has the mostdata available.
31
• 50 percent of all U.S. firms with at least four years of data available were selected
by random sample.16
• The resulting dataset has about 59,500 observations; we present the number of
observations by country in Table 1.

32
REFERENCES
Abel, Andrew B., and Olivier J. Blanchard. "The Present Value of Profits and CyclicalMovements in Investment." Econometrica (March 1986): 249-273.
Alchian, Armen, and Harold Demsetz. "Production, Information Costs, and EconomicOrganization." American Economic Review 62 (1972): 777-805.
Beck, T., Ross Levine, and N. Loyaza. "Finance and the Sources of Growth." Working Paper,University of Virginia, 1999.
Bernanke, Ben, Mark Gertler, and Simon Gilchrist. "The Financial Accelerator and the Flight toQuality." Review of Economics and Statistics (February 1996): 1-15.
Bernanke, Ben, Mark Gertler, and Simon Gilchrist. "The Financial Accelerator in a QuantitativeBusiness Cycle Framework." In Handbook of Macroeconomics, volume 1c. New York:Elsevier Science Ltd., 1999.
Bond, Stephen, and Costas Meghir. "Dynamic Investment Models and the Firm's FinancialPolicy." Review of Economic Studies (April 1994): 197-222.
Carlin, Wendy, and Colin Mayer. "Finance, Investment, and Growth." Mimeograph, Universityof Oxford, September 1998.
Cecchetti, Stephen G., “Legal Structure, Financial Structure, and the Monetary PolicyTransmission,” Working Paper No. 7151., National Bureau of Economic Research, 1999.
Claessens, S., S. Djankov, and L. Lang. "The Separation of Ownership and Control in East AsianCorporations." Journal of Financial Economics 58 (2000).
Coase, Ronald. "The Problem of Social Cost." Journal of Law and Economics 3 (1961): 1-44.
Coffee, John. "Privatization and Corporate Governance: The Lessons from the Securities MarketFailure." Working Paper No. 158, Columbia Law School, 2000.
David, R., and J. Brierley. Major Legal Systems in the World Today. London: Stevens and Sons,1985.
Easterbrook, Frank, and Daniel Fischel. The Economic Structure of Corporate Law. Cambridge:Harvard University Press, 1991.
Demsetz, Harold, and Kenneth Lehn. "The Structure of Corporate Ownership: Causes andConsequences." Journal of Political Economy 93 (1985): 1155-1177.
Demurgic-Kunt, A., and V. Maksimovic. "Law, Finance, and Firm Growth." Journal of Finance53 (1998).
Dornbusch, Rudiger, C. Favero, and Francesco Giavazzi. "Immediate Challenges for theEuropean Central Bank." Economic Policy (April 1998): 17-64.
33
Easterbrook, Frank, and Daniel Fischel. The Economic Structure of Corporate Law. Cambridge:Harvard University Press, 1991.
Ehrmann, Michael. "Will EMU Generate Asymmetry?: Comparing Monetary Policy TransmissionAcross Countries." European University Institute Working Paper No. 98/28, 1998.
Fazzari, Steven M., R. Glenn Hubbard, and Bruce C. Petersen. "Financing Constraints andCorporate Investment." Brookings Papers on Economic Activity (1988:1): 141-195.
Gertler, Mark, and R. Glenn Hubbard. "Financial Factors in Business Fluctuations." In FinancialMarket Volatility. Kansas City: Federal Reserve Banks of Kansas City, 1988.
Gertler, Mark, and Simon Gilchrist. "Monetary Policy, Business Cycles, and the Behavior ofSmall Manufacturing Firms." Quarterly Journal of Economics (May 1994): 309-340.
Gilchrist, Simon, and Charles P. Himmelberg. "Investment, Fundamentals, and Finance." In BenBernanke and Julio J. Rotemberg, eds., NBER Macroeconomics Annual. Cambridge:MIT Press, 1998.
Gorton, Gary and Matthias Kahl, “Blockholder Identity, Equity Ownership Structures and HostileTakeovers,” Working Paper No. 7123, National Bureau of Economic Research, 1999.
Grossman, Sanford, and Oliver Hart. "One-Share-One-Vote and the Market for CorporateControl." Journal of Financial Economics 20 (1988): 3175-202.
Guiso, Luigi, Anil K. Kashyap, Fabio Panetta, and Daniele Terlizze. "Will Common EuropeanMonetary Policy Have Asymmetric Effects?" Federal Reserve Bank of Chicago EconomicPerspectives (1999)." 56-75.
Hart, Oliver, and John Moore. "Property Rights and the Nature of the Firm." Journal ofPolitical Economy 98 (1990): 1119-1158.
Hayashi, Fumio. "Tobin's Marginal q and Average q: A Neoclassical Interpretation." Econometrica (January 1982): 213-224.
Himmelberg, Charles P., R. Glenn Hubbard, and Darius Palia. "Understanding the Determinantsof Managerial Ownership and the Link Between Ownership and Performance." Journal ofFinancial Economics 53 (1999): 353-384.
Hubbard, R. Glenn. "Capital-Market Imperfections and Investment." Journal of EconomicLiterature (March 1998): 193-225.
Hubbard, R. Glenn. "Capital-Market Imperfections, Investment, and the Monetary TransmissionMechanism." Mimeograph, Columbia University, 2000.
Hubbard, R. Glenn, and Anil K. Kashyap. "Internal Net Worth and the Investment Process: AnApplication to U.S. Agriculture." Journal of Political Economy (June 1992): 506-534.
Hubbard, R. Glenn, Anil K. Kashyap, and Toni Whited. "Internal Finance and Firm Investment." Journal of Money, Credit, and Banking (August 1995): 683-701.

34
Hubbard, R. Glenn, Kenneth N. Kuttner, and Darius Palia. "Are There 'Bank Effects' InBorrowers' Costs of Funds?: Evidence from a Matched Sample of Borrowers and Banks." Mimeograph, Columbia University, 1999.
Jensen, Michael, and William Meckling. "Theory of the Firm: Managerial Behavior, AgencyCosts, and Ownership Structure." Journal of Financial Economics 3, (1976): 305-360.
King, Robert G., and Ross Levine. "Finance and Growth: Schumpeter Might Be Right." Quarterly Journal of Economics (August 1993): 717-737.
La Porta, Rafael, Florencio Lopez-di-Silanes, Andrei Shleifer, and Robert W. Vishny. "InvestorProtection and Corporate Governance." Journal of Financial Economics 58 (2000).
La Porta, Rafael, Florencio Lopez-di-Silanes, Andrei Shleifer, and Robert W. Vishny. "TheQuality of Government." Journal of Law, Economics, and Organization 15 (1999a): 222-279.
La Porta, Rafael, Florencio Lopez-di-Silanes, Andrei Shleifer, and Robert W. Vishny. "InvestorProtection and Corporate Valuation." Working Paper No. 7403, National Bureau ofEconomic Research, October 1999.
La Porta, Rafael, Florencio Lopez-di-Silanes, Andrei Shleifer, and Robert W. Vishny. "Law andFinance." Journal of Political Economy (December 1998): 1133-1155.
La Porta, Rafael, Florencio Lopez-di-Silanes, Andrei Shleifer, and Robert W. Vishny. "LegalDeterminants of External Finance." Journal of Finance (June 1997): 1131-1150.
Love, Inessa. "Financial Development and Financing Constraints: International Evidence from theStructural Investment Model," Mimeograph, Columbia University, 1999.
Modigliani, Franco, and Merton Miller, "The Cost of Capital Corporation Finance, and the Theory of Investment." American Economic Review 48 (1958): 261-297.
Mojon, Benoît. "Credit Channel(s) in the Euro Area: What is the Evidence of DistributionalEffects?" Mimeograph, European Central Bank, July 1999.
Opler, Tim, Lee Pinkowitz, René Stulz, and Rohan Williamson. "The Determinants andImplications of Corporate Cash Holdings." Journal of Financial Economics, 1998.
Rajan, Raghuram, and Luigi Zingales. "Financial Dependence and Growth." American EconomicReview 88 (June 1998).
Stigler, George. "Public Regulation of the Securities Market." Journal of Business 37 (1964):117-142.
Whited, Toni M. "Debt, Liquidity Constraints, and Corporate Investment: Evidence from PanelData." Journal of Finance (September 1992): 1425-1460.
Wurgler, Jeffrey. "Financial Markets and Allocation of Capital." Journal of FinancialEconomics 58 (2000).
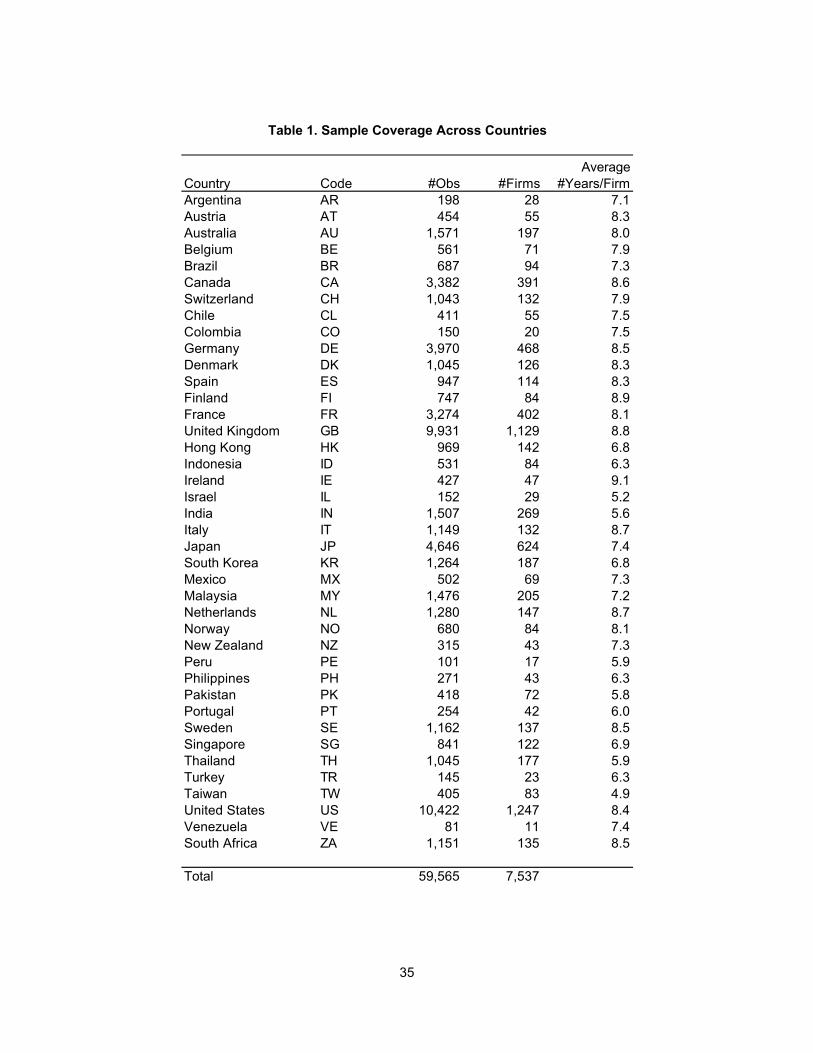
Country Code #Obs #FirmsAverage
#Years/FirmArgentina AR 198 28 7.1Austria AT 454 55 8.3Australia AU 1,571 197 8.0Belgium BE 561 71 7.9Brazil BR 687 94 7.3Canada CA 3,382 391 8.6Switzerland CH 1,043 132 7.9Chile CL 411 55 7.5Colombia CO 150 20 7.5Germany DE 3,970 468 8.5Denmark DK 1,045 126 8.3Spain ES 947 114 8.3Finland FI 747 84 8.9France FR 3,274 402 8.1United Kingdom GB 9,931 1,129 8.8Hong Kong HK 969 142 6.8Indonesia ID 531 84 6.3Ireland IE 427 47 9.1Israel IL 152 29 5.2India IN 1,507 269 5.6Italy IT 1,149 132 8.7Japan JP 4,646 624 7.4South Korea KR 1,264 187 6.8Mexico MX 502 69 7.3Malaysia MY 1,476 205 7.2Netherlands NL 1,280 147 8.7Norway NO 680 84 8.1New Zealand NZ 315 43 7.3Peru PE 101 17 5.9Philippines PH 271 43 6.3Pakistan PK 418 72 5.8Portugal PT 254 42 6.0Sweden SE 1,162 137 8.5Singapore SG 841 122 6.9Thailand TH 1,045 177 5.9Turkey TR 145 23 6.3Taiwan TW 405 83 4.9United States US 10,422 1,247 8.4Venezuela VE 81 11 7.4South Africa ZA 1,151 135 8.5
Total 59,565 7,537
Table 1. Sample Coverage Across Countries
35
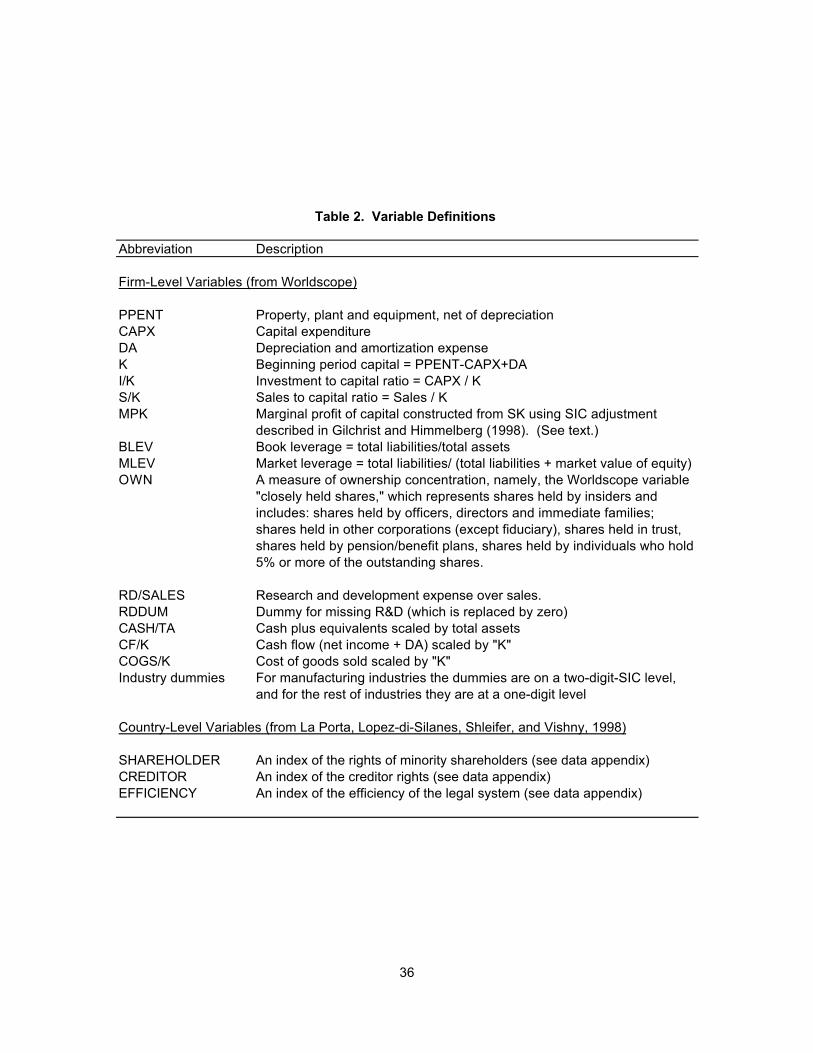
Abbreviation Description
PPENT Property, plant and equipment, net of depreciationCAPX Capital expenditureDA Depreciation and amortization expenseK Beginning period capital = PPENT-CAPX+DA I/K Investment to capital ratio = CAPX / K S/K Sales to capital ratio = Sales / KMPK Marginal profit of capital constructed from SK using SIC adjustment
described in Gilchrist and Himmelberg (1998). (See text.)BLEV Book leverage = total liabilities/total assetsMLEV Market leverage = total liabilities/ (total liabilities + market value of equity)OWN A measure of ownership concentration, namely, the Worldscope variable
"closely held shares," which represents shares held by insiders and includes: shares held by officers, directors and immediate families; shares held in other corporations (except fiduciary), shares held in trust, shares held by pension/benefit plans, shares held by individuals who hold 5% or more of the outstanding shares.
RD/SALES Research and development expense over sales.RDDUM Dummy for missing R&D (which is replaced by zero)CASH/TA Cash plus equivalents scaled by total assets CF/K Cash flow (net income + DA) scaled by "K"COGS/K Cost of goods sold scaled by "K"Industry dummies For manufacturing industries the dummies are on a two-digit-SIC level,
and for the rest of industries they are at a one-digit level
SHAREHOLDER An index of the rights of minority shareholders (see data appendix)CREDITOR An index of the creditor rights (see data appendix)EFFICIENCY An index of the efficiency of the legal system (see data appendix)
Table 2. Variable Definitions
Country-Level Variables (from La Porta, Lopez-di-Silanes, Shleifer, and Vishny, 1998)
Firm-Level Variables (from Worldscope)
36

Variable Sample N obs Mean Min 1% 5% 50% 95% 99% Max
S/K All countries 57557 4.37 0.00 0.14 0.39 3.33 12.59 17.62 19.99Subset of 18 43689 4.72 0.00 0.18 0.44 3.73 13.00 17.79 19.99Other 13868 3.25 0.00 0.10 0.27 2.06 10.74 16.75 19.95
MPK All countries 57557 0.20 0.00 0.01 0.04 0.16 0.48 0.80 4.18Subset of 18 43689 0.21 0.00 0.02 0.05 0.17 0.48 0.78 3.90Other 13868 0.18 0.00 0.01 0.03 0.13 0.49 0.91 4.18
I/K All countries 57557 0.26 0.00 0.00 0.03 0.19 0.72 1.38 2.50Subset of 18 43689 0.25 0.00 0.00 0.04 0.19 0.69 1.33 2.50Other 13868 0.26 0.00 0.00 0.02 0.17 0.83 1.52 2.47
BLEV All countries 59883 0.55 0.00 0.08 0.20 0.56 0.86 0.99 2.27Subset of 18 45502 0.57 0.00 0.09 0.23 0.58 0.87 1.01 2.27Other 14381 0.49 0.00 0.05 0.14 0.49 0.83 0.96 1.70
MLEV All countries 53325 0.46 0.00 0.04 0.10 0.44 0.85 0.97 1.00Subset of 18 40624 0.46 0.00 0.04 0.12 0.46 0.83 0.95 1.00Other 12701 0.43 0.00 0.03 0.08 0.39 0.89 1.00 1.00
OWN All countries 42168 41.16 0.00 0.02 0.32 40.04 87.45 100.00 100.00Subset of 18 33493 39.20 0.00 0.02 0.27 36.74 88.78 100.00 100.00Other 8660 48.39 0.00 0.02 1.08 51.05 83.84 96.47 100.00
Percentile
Table 3. Descriptive Statistics for Key Variables
Note: Variables are defined in Table 2. The "Subset of 18" sample includes 13 European countries (Great Britain, Norway, Finland, Ireland, Sweden, Switzerland, Netherlands, Spain, Austria, Denmark, France, Germany, Italy, Belgium, and Portugal), plus four non-European countries (Japan, the United States, and Canada). The "Other" sample includes all countries not included in the "Subset of 18" countries.
37
Variable Coeff. T-stat Coeff. T-stat Coeff. T-stat Coeff. T-statLog(SALES) -3.13 -15.06 *** -3.17 -13.42 *** -1.99 -7.38 *** -1.71 -5.59 ***
S/K 0.54 5.50 *** 0.54 4.69 *** 0.42 3.59 *** 0.38 2.62 ***
RD/SALES -4.36 -1.76 * 18.01 1.23 -7.75 -0.65 16.70 0.70RDDUM 8.06 10.57 *** 8.54 9.21 *** 3.76 4.04 *** 5.11 4.18 ***
EFFICIENCY -2.33 -10.64 *** -2.37 -10.37 *** -5.23 -11.12 *** -5.09 -10.46 ***
CREDITOR -1.27 -4.41 *** -0.28 -0.78 -3.00 -8.47 *** -2.92 -6.18 ***
SHAREHOLDER -4.98 -17.14 *** -3.83 -11.58 *** -7.79 -24.02 *** -7.60 -19.39 ***
Constant 122.29 27.45 *** 113.96 21.16 *** 143.70 15.32 *** 121.16 11.68 ***
N (obs) 25400 19333 17112 11845N (firms) 4009 3060 2566 1781N (countries) 38 38 18 18Rsq 0.25 0.22 0.39 0.36
All Countries "Subset of 18" Countries
Notes: The dependent variable is OWN, as defined in Table 2. Explanatory variables are also defined in Table 2. All models are estimated by OLS with adjustment for heteroscedasticity and within-firm serial correlation. Year dummies and two-digit SIC industry dummies are included but not reported. The "Subset of 18" countries are defined in Table 3 (JP, US, GB, CA, NO, FI, IE, SE, CH, NL, ES, AT, DK, FR, DE, IT, BE, and PT).
Table 4. Determinants of Ownership Concentration
300 firms 150 firms 300 firms 150 firms
38
Country CodeLegal
efficiency Creditor
rightsShareholder
rights Actual Predicted
Japan JP 10.00 2 4 40.8 30.8United States US 10.00 1 5 24.9 31.9United Kingdom GB 10.00 4 5 29.2 32.9Hong Kong HK 10.00 4 5 50.5 33.8Canada CA 9.25 1 5 41.1 35.9New Zealand NZ 10.00 3 4 52.4 37.3Australia AU 10.00 1 4 39.3 39.3India IN 8.00 4 5 51.1 40.5Norway NO 10.00 2 4 48.0 41.1Singapore SG 10.00 4 4 55.1 41.6South Africa ZA 6.00 3 5 50.1 42.3Chile CL 7.25 2 5 60.3 42.9Israel IL 10.00 4 3 57.0 43.0Finland FI 10.00 1 3 46.4 43.2Ireland IE 8.75 1 4 31.0 43.5Sweden SE 10.00 2 3 47.1 43.5Malaysia MY 9.00 4 4 49.7 44.8Switzerland CH 10.00 1 2 45.7 48.4Netherlands NL 10.00 2 2 51.2 49.5Taiwan TW 6.75 3 3 17.7 49.9Spain ES 6.25 2 4 58.3 49.9Austria AT 9.50 3 2 58.4 51.1Denmark DK 10.00 3 2 28.0 51.1Argentina AR 6.00 1 4 58.1 51.9France FR 8.00 0 3 62.6 52.4South Korea KR 6.00 3 2 29.0 52.4Pakistan PK 5.00 4 5 59.1 53.5Germany DE 9.00 3 1 68.1 54.9Brazil BR 5.75 1 3 49.4 56.0Colombia CO 7.25 0 3 N/A 57.5Italy IT 6.75 2 1 60.6 60.4Belgium BE 9.50 2 0 60.0 60.5Peru PE 6.75 0 3 66.4 61.2Portugal PT 5.50 1 3 55.7 62.5Turkey TR 4.00 2 2 68.5 64.8Philippines PH 4.75 0 3 54.5 65.1Mexico MX 6.00 0 1 54.2 65.6Thailand TH 3.25 3 2 44.8 66.5Indonesia ID 2.50 4 2 67.8 71.4Venezuela VE 6.50 N/A 1 94.3 N/A
Notes: Variables are defined in Table 2. Predicted values of ownership concentration are reported in percentage terms and are based on the estimates reported in the first column of Table 4 (for the top 300 firms, full sample of countries). The "Subset of 18" countries used to estimate the Euler equations for investment are highlighted in bold.
Table 5. Predicted Ownership Concentration Across Countries
Investor ProtectionMean Ownership
Concentration
39
Panel A: Market Leverage
Coeff. T-stat Coeff. T-stat Coeff. T-stat Coeff. T-statI/K(t+1) -3.73 -3.77 *** -1.78 -2.34 ** -1.77 -3.11 *** -0.69 -1.54 a
I/K(t) 5.81 5.18 *** 3.90 4.91 *** 3.28 4.81 *** 2.42 4.77 ***
I/K(t-1) -1.48 -5.86 *** -1.16 -6.93 *** -0.93 -5.56 *** -0.82 -6.78 ***
MLEV(t) 0.22 5.62 *** 0.26 8.04 *** 0.03 0.72 0.10 2.44 **
POWN(t)*MLEV(t) 0.33 4.56 *** 0.30 4.00 ***
N (firms) 2266 2266 2266 2266N (obs) 12346 12346 12342 12342F-statistic 18.82 35.33 37.89 49.33
Panel B: Book Leverage
Coeff. T-stat Coeff. T-stat Coeff. T-stat Coeff. T-statI/K(t+1) -3.08 -3.75 *** -1.22 -2.09 ** -1.62 -3.22 *** -0.59 -1.55 a
I/K(t) 4.72 5.21 *** 2.84 4.70 *** 2.89 4.89 *** 1.97 4.72 ***
I/K(t-1) -1.20 -6.15 *** -0.88 -7.15 *** -0.81 -5.76 *** -0.68 -7.01 ***
BLEV(t) 0.15 5.05 *** 0.18 7.84 *** 0.00 -0.05 0.05 1.60 a
POWN(t)*BLEV(t) 0.36 6.26 *** 0.33 5.76 ***
N (firms) 2267 2267 2270 2270N (obs) 12371 12371 12367 12367F-statistic 26.32 26.32 45.53 65.28
Table 6. Euler Equation Estimates for Investment
Baseline Interaction
Baseline Interaction
SIC adj. No SIC adj. SIC adj.No SIC adj.
Notes: The sample is restricted to the "Subset of 18" countries defined in Table 3 (JP, US, GB, CA, NO, FI, IE, SE, CH, NL, ES, AT, DK, FR, DE, IT, BE, and PT). Variables are defined in Table 2. The variable OWN(t)*LEV(t) is interaction of leverage with predicted ownership concentration (as estimated in Table 4 and reported in Table 5). All models are estimated by instrumental variables, where instruments include time t-1 and t-2 variables in the models and their interactions with ownership, plus CASH/TA, COGS/K, and CF/K (see Table 2). All variables are country-time differenced to allow for country-specific aggregate shocks. Columns titled "SIC adj." have been adjusted for Industry effects by transforming to deviations from two-digit SIC means. All estimates for the sample of the 300 largest firms for each country. Standard errors are adjusted for heteroscedasticity and serial correlation within the firm. Significance levels are represented by *** for 1%, ** for 5%, *for 10%, and a for 15% levels.
No SIC adj. SIC adj.No SIC adj. SIC adj.
40
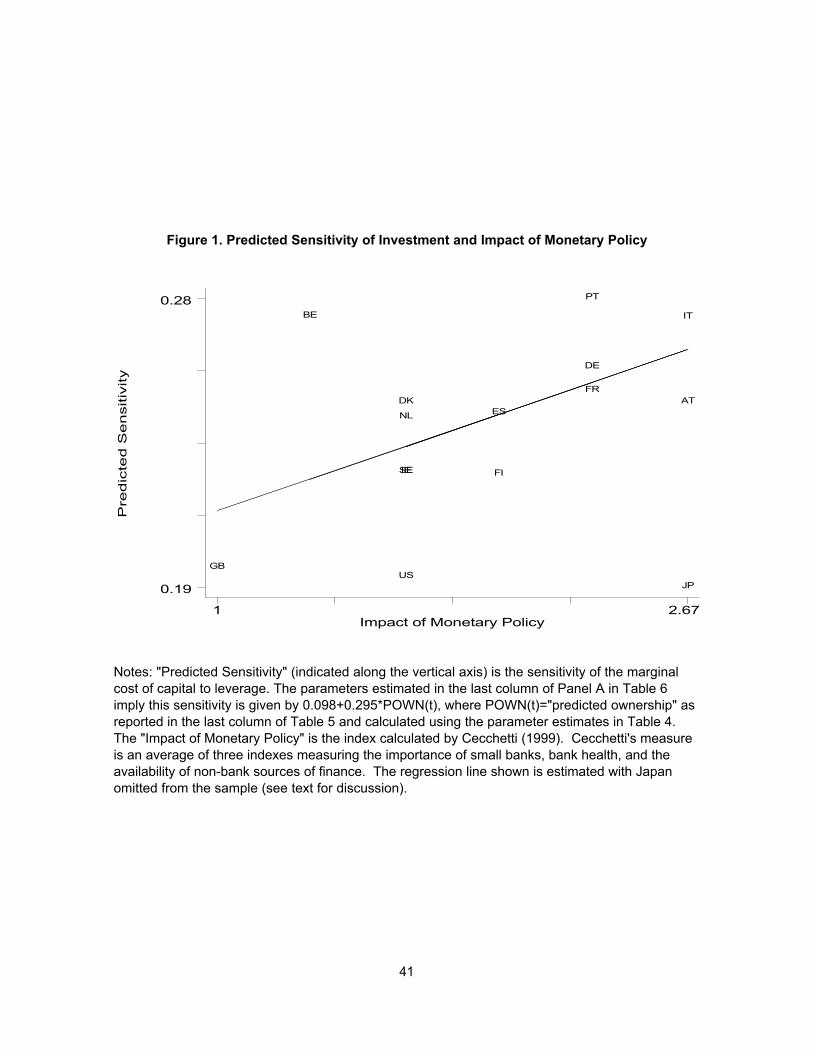
Figure 1. Predicted Sensitivity of Investment and Impact of Monetary Policy
Notes: "Predicted Sensitivity" (indicated along the vertical axis) is the sensitivity of the marginal cost of capital to leverage. The parameters estimated in the last column of Panel A in Table 6 imply this sensitivity is given by 0.098+0.295*POWN(t), where POWN(t)="predicted ownership" as reported in the last column of Table 5 and calculated using the parameter estimates in Table 4. The "Impact of Monetary Policy" is the index calculated by Cecchetti (1999). Cecchetti's measure is an average of three indexes measuring the importance of small banks, bank health, and the availability of non-bank sources of finance. The regression line shown is estimated with Japan omitted from the sample (see text for discussion).
Pre
dic
ted
Se
nsitiv
ity
Impact of Monetary Policy1 2.67
0.19
0.28
JPUS
GB
FIIESE
NL ESATDK
FR
DE
ITBE
PT
41