Embed Size (px)
Citation preview

February 2018
INVESTOR PRESENTATION

Cautionary Information
2
This presentation contains forward-looking information within the meaning of applicable Canadian and United States securities legislation. All
information contained in this presentation, other than statements of current and historical fact, is forward-looking information. Often, but not always,
forward-looking information can be identified by the use of words such as “plans”, “expects”, “budget”, “guidance”, “scheduled”, “estimates”,
“forecasts”, “strategy”, “target”, “intends”, “objective”, “goal”, “understands”, “anticipates” and “believes” (and variations of these or similar words) and
statements that certain actions, events or results “may”, “could”, “would”, “should”, “might” “occur” or “be achieved” or “will be taken” (and variations
of these or similar expressions). All of the forward-looking information in this presentation is qualified by this cautionary note.
Forward-looking information includes, but is not limited to, production, cost and capital and exploration expenditure guidance, anticipated production
at Hudbay’s mines and processing facilities, the anticipated timing, cost and benefits of developing the Rosemont project, Pampacancha deposit and
Lalor growth projects, the anticipated impact of any delays to the start of mining the Pampacancha deposit, the anticipated results of litigation
challenging the Rosemont permitting process, Hudbay’s expectations regarding the persistence of the positive grade reconciliation at Constancia and
a restatement of the mineral reserves, anticipated exploration plans, anticipated mine plans, anticipated metals prices and the anticipated sensitivity
of the company’s financial performance to metals prices, events that may affect its operations and development projects, the permitting, development
and financing of the Rosemont project, the potential to optimize the scale of production at Lalor and to efficiently process the excess base metals ore
and initial gold zone ore production at the Flin Flon mill, anticipated cash flows from operations and related liquidity requirements, the anticipated
effect of external factors on revenue, such as commodity prices, estimation of mineral reserves and resources, mine life projections, reclamation
costs, economic outlook, government regulation of mining operations, and business and acquisition strategies. Forward-looking information is not,
and cannot be, a guarantee of future results or events. Forward-looking information is based on, among other things, opinions, assumptions,
estimates and analyses that, while considered reasonable by the company at the date the forward-looking information is provided, inherently are
subject to significant risks, uncertainties, contingencies and other factors that may cause actual results and events to be materially different from
those expressed or implied by the forward-looking information.
The material factors or assumptions that Hudbay identified and were applied by the company in drawing conclusions or making forecasts or
projections set out in the forward-looking information include, but are not limited to: the success of mining, processing, exploration and development
activities; the scheduled maintenance and availability of the processing facilities; the accuracy of geological, mining and metallurgical estimates;
anticipated metals prices and the costs of production; the supply and demand for metals the company produces; the supply and availability of all
forms of energy and fuels at reasonable prices; no significant unanticipated operational or technical difficulties; the execution of Hudbay’s business
and growth strategies, including the success of its strategic investments and initiatives; the availability of additional financing, if needed; the ability to
complete project targets on time and on budget and other events that may affect the company’s ability to develop its projects; the timing and receipt
of various regulatory, governmental and joint venture partner approvals; the availability of personnel for the exploration, development and operational
projects and ongoing employee relations; the ability to secure required land rights to develop the Pampacancha deposit; maintaining good relations
with the communities in which the company operates, including the communities surrounding the Constancia mine and Rosemont project and First
Nations communities surrounding the Lalor and Reed mines; no significant unanticipated challenges with stakeholders at the company’s various
projects; no significant unanticipated events or changes relating to regulatory, environmental, health and safety matters; no contests over title to the
company’s properties, including as a result of rights or claimed rights of aboriginal peoples; the timing and possible outcome of pending litigation and
no significant unanticipated litigation; certain tax matters, including, but not limited to current tax laws and regulations and the refund of certain value
added taxes from the Canadian and Peruvian governments; and no significant and continuing adverse changes in general economic conditions or
conditions in the financial markets (including commodity prices and foreign exchange rates).
Cautionary Information
3
The risks, uncertainties, contingencies and other factors that may cause actual results to differ materially from those expressed or implied by the
forward-looking information may include, but are not limited to, risks generally associated with the mining industry, such as economic factors
(including future commodity prices, currency fluctuations, energy prices and general cost escalation), uncertainties related to the development and
operation of Hudbay’s projects (including risks associated with the permitting, development and economics of the Rosemont project and related legal
challenges), risks related to the maturing nature of the 777 mine and the pending closure of the Reed mine and their impact on the related Flin Flon
metallurgical complex, dependence on key personnel and employee and union relations, risks related to the schedule for mining the Pampacancha
deposit (including the timing and cost of acquiring the required surface rights and the impact of any schedule delays), risks related to the cost,
schedule and economics of the capital projects intended to increase processing capacity for Lalor ore, risks related to political or social unrest or
change, risks in respect of aboriginal and community relations, rights and title claims, operational risks and hazards, including unanticipated
environmental, industrial and geological events and developments and the inability to insure against all risks, failure of plant, equipment, processes,
transportation and other infrastructure to operate as anticipated, compliance with government and environmental regulations, including permitting
requirements and anti-bribery legislation, depletion of Hudbay’s reserves, volatile financial markets that may affect Hudbay’s ability to obtain
additional financing on acceptable terms, the failure to obtain required approvals or clearances from government authorities on a timely basis,
uncertainties related to the geology, continuity, grade and estimates of mineral reserves and resources, and the potential for variations in grade and
recovery rates, uncertain costs of reclamation activities, the company’s ability to comply with its pension and other post-retirement obligations,
Hudbay’s ability to abide by the covenants in its debt instruments and other material contracts, tax refunds, hedging transactions, as well as the risks
discussed under the heading “Risk Factors” in the company’s most recent Annual Information Form.
Should one or more risk, uncertainty, contingency or other factor materialize or should any factor or assumption prove incorrect, actual results could
vary materially from those expressed or implied in the forward-looking information. Accordingly, you should not place undue reliance on forward-
looking information. Hudbay does not assume any obligation to update or revise any forward-looking information after the date of this presentation or
to explain any material difference between subsequent actual events and any forward-looking information, except as required by applicable law.
This presentation has been prepared in accordance with the requirements of the securities laws in effect in Canada, which may differ materially from
the requirements of United States securities laws applicable to U.S. issuers.
This presentation contains certain financial measures which are not recognized under IFRS, such as net debt, cash cost and sustaining cash cost,
net of by-product credits, per pound of copper produced. For further details on how Hudbay calculates these measures in respect of its operating
assets, please refer to page 39 of Hudbay’s management’s discussion and analysis for the year ended December 31, 2017 available on SEDAR at
www.sedar.com and EDGAR at www.sec.gov.
All amounts are in U.S. dollars unless otherwise noted.

Hudbay Investment Highlights
4 1.Based on Hudbay’s TSX closing share price on February 20, 2018.
2.Liquidity including cash balances as of December 31, 2017.
3.Total long-term debt outstanding as at December 31, 2017.
TSX, NYSE, BVL Symbol HBM
Market Capitalization1 C$2.7 billion
Shares Outstanding 261 million
Available Liquidity2 $0.8 billion
Debt Outstanding3 $1.0 billion
STRONG LEVERAGE TO COPPER AND ZINC PRICES
• Un-hedged copper and zinc production
• Augment copper production in Peru with planned 2018 start of high-grade satellite deposit
• High-quality development project positioned to move into construction soon after permitting is complete
PROVEN TRACK RECORD
• Successful new mine development delivering growing cash profile
• In-depth mining expertise in both open pit and underground mining
CLEAR AND DISCIPLINED GROWTH STRATEGY
• Investment-grade countries in the Americas
• VMS and porphyry geological focus
• Accretive to NAV per share
• “Drill and build” value creation strategy
• Low-cost, long-life assets in low-risk jurisdictions
1
5 Chile
Exploration
1 British Columbia
Exploration
2 Manitoba
777, Lalor, Reed
3 Arizona
Rosemont
4 Peru
Constancia
2
3
4
5
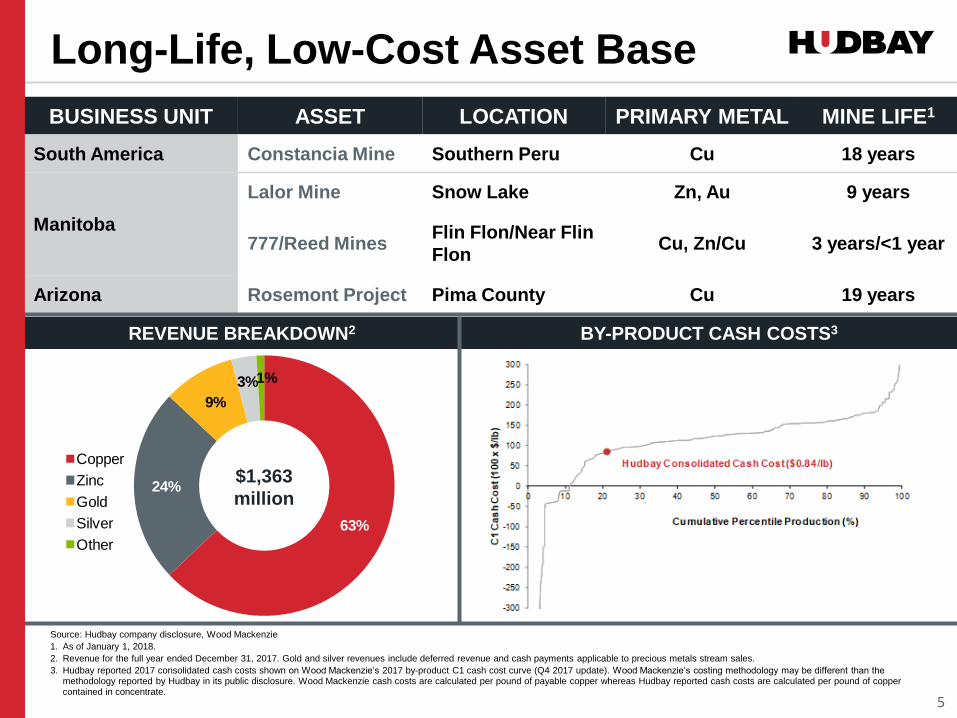
Long-Life, Low-Cost Asset Base
5
BUSINESS UNIT ASSET LOCATION PRIMARY METAL MINE LIFE1
South America Constancia Mine Southern Peru Cu 18 years
Manitoba
Lalor Mine Snow Lake Zn, Au 9 years
777/Reed Mines Flin Flon/Near Flin
Flon Cu, Zn/Cu 3 years/<1 year
Arizona Rosemont Project Pima County Cu 19 years
Source: Hudbay company disclosure, Wood Mackenzie
1. As of January 1, 2018.
2. Revenue for the full year ended December 31, 2017. Gold and silver revenues include deferred revenue and cash payments applicable to precious metals stream sales.
3. Hudbay reported 2017 consolidated cash costs shown on Wood Mackenzie’s 2017 by-product C1 cash cost curve (Q4 2017 update). Wood Mackenzie’s costing methodology may be different than the methodology reported by Hudbay in its public disclosure. Wood Mackenzie cash costs are calculated per pound of payable copper whereas Hudbay reported cash costs are calculated per pound of copper contained in concentrate.
REVENUE BREAKDOWN2 BY-PRODUCT CASH COSTS3
$1,363
million
63%
24%
9%
3%1%
Copper
Zinc
Gold
Silver
Other

CONSOLIDATED FINANCIAL & OPERATING RESULTS
Q4 2017 Full Year
2017
Copper contained in conc. (kt) 43.2 159.2
Zinc contained in conc. (kt) 33.1 135.2
Precious metals contained in
conc. (koz)2 46.9 158.4
Cash cost ($/lb)3 $0.77 $0.84
All-in sustaining cash cost
($/lb)3 $1.49 $1.52
Operating cash flow ($m) $172 $531
Cash and cash equivalents
($m) $356
Net debt ($m) $623
Liquidity ($m) $778
2017 Consolidated Results
6
1. Operating cash flow is operating cash flow before change in non-cash working capital. Free cash flow calculated as operating cash flow less sustaining capital expenditures and less interest paid. LTM = Last Twelve Months.
2. Precious metals production includes gold and silver production on a gold-equivalent basis. Silver is converted to gold at a 70:1 ratio.
3. Consolidated cash cost per pound of copper produced, net of by-product credits. Consolidated all-in sustaining cash cost includes the addition of sustaining capital expenditures, capitalized exploration, royalties and corporate G&A.
OPERATING AND FREE CASH FLOW1
• Achieved or exceeded production guidance on
a consolidated basis
• Continued to generate positive free cash flow
in 2017
• Copper cash cost of $0.84/lb and all-in
sustaining cash cost of $1.52/lb
-$150
-$100
-$50
$0
$50
$100
$150
$200
$250
$300
$350
$400
$450
$500
$550
Q1 2016 LTM
Q2 2016 LTM
Q3 2016 LTM
2016 Q1 2017 LTM
Q2 2017 LTM
Q3 2017 LTM
2017
US
$ m
illio
ns
Operating Cash Flow Free Cash Flow

2018 Guidance
7
CONTAINED METAL IN CONCENTRATE1 2018 GUIDANCE 2017 ACTUAL 2017 GUIDANCE
MANITOBA2
Copper tonnes 27,500 – 32,500 37,411 32,500 – 42,500
Zinc tonnes 105,000 – 130,000 135,156 125,000 – 150,000
Precious Metals3 ounces 120,000 – 145,000 106,918 90,000 – 110,000
Combined Unit Operating Costs4 C$/tonne ore
processed C$110 - 123 C$118 C$88 - 108
PERU
Copper tonnes 95,000 – 115,000 121,781 100,000 – 115,000
Precious Metals3 ounces 65,000 – 85,000 51,493 55,000 – 65,000
Combined Unit Operating Costs4 $/tonne ore
processed $7.5 – 9.2 $8.83 $7.20 – 8.80
TOTAL CONSOLIDATED
Copper tonnes 122,500 – 147,500 159,192 132,500 – 157,500
Zinc tonnes 105,000 – 130,000 135,156 125,000 – 150,000
Precious Metals3 ounces 185,000 – 230,000 158,411 145,000 – 175,000
1. Metal reported in concentrate is prior to refining losses or deductions associated with smelter terms.
2. Includes 100% of Reed mine production; Hudbay owns a 70% interest in the Reed mine.
3. Precious metals production includes gold and silver production on a gold-equivalent basis. Silver converted to gold at a ratio of 70:1.
4. Reflects combined mine, mill and G&A costs per tonne of milled ore. Peru costs are presented in USD and reflect the deduction of expected capitalized stripping costs. Manitoba costs are presented in CAD and
include the cost of ore purchased from the joint venture partner at the Reed mine.
PRODUCTION AND UNIT COST
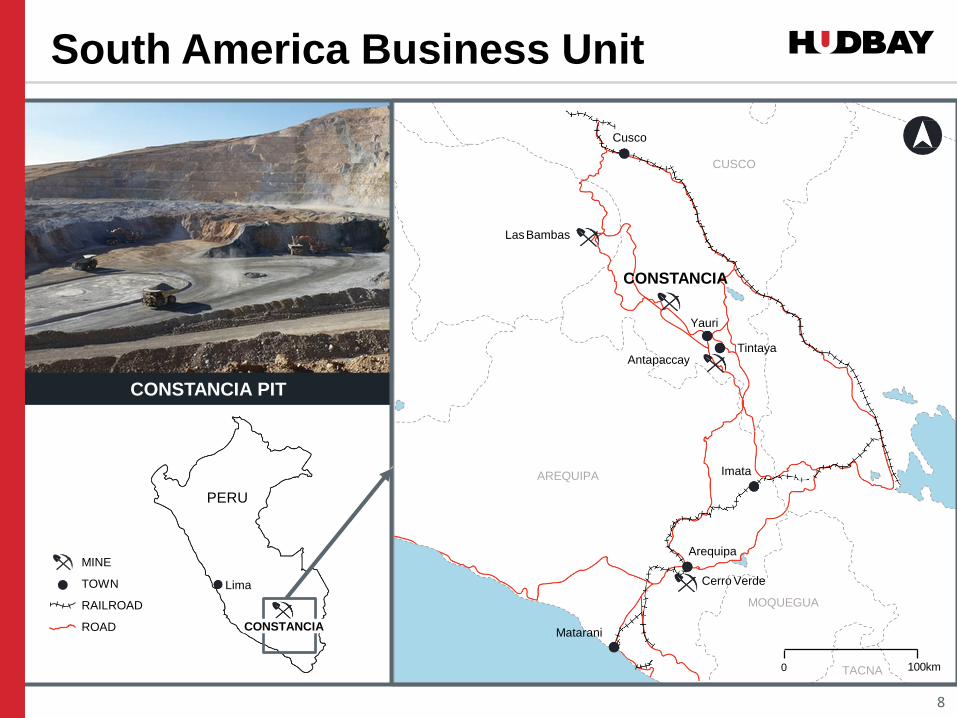
AREQUIPA
Cusco
CUSCO
Matarani
Imata
Arequipa
Cerro Verde
MOQUEGUA
TACNA 100km 0
Las Bambas
Yauri
Tintaya Antapaccay
CONSTANCIA
South America Business Unit
8
CONSTANCIA PIT
MINE
TOWN
RAILROAD
ROAD
Lima
PERU
CONSTANCIA

FLOTATION CELLS
Constancia Mine
9
Source: Hudbay company disclosure
1. Full year ended December 31, 2017.
2. LOM = Life of Mine. As per NI 43-101 Technical Report on the Constancia Mine dated November 21, 2016.
LOM average calculated from 2018-2035.
3. Production is contained metal in concentrate.
4. Combined mine, mill and G&A unit operating costs per tonne of ore processed (after impact of capitalized
stripping).
5. Net of by-products. Includes impact of silver and gold streams. Metal prices per the precious metals stream
agreement are as follows: $400/oz Au, $5.90/oz Ag. Other metal price assumptions in LOM estimate are
based on reserve prices ($3.00/lb Cu, $11.00/lb Mo, $1,260/oz Au).
6. Sustaining capital includes capitalized stripping costs, but excludes Pampacancha project capital.
7. Sustaining cash cost per pound copper produced, includes sustaining capital costs and royalties.
8. Mine life as of January 1, 2018.
9. Excludes the costs associated with acquiring surface rights at Pampacancha.
20171 AVG. LOM2
Ownership 100%
Daily ore milled 79k tpd 85k tpd
Annual Cu production3 122kt 81kt
Unit operating cost4 $8.83/t $7.36/t
Cash cost per lb Cu5 $1.28/lb $1.28/lb
Annual sustaining capital6 $124m $54m
Sustaining cash cost7 $1.77/lb $1.60/lb
Mine life8 18 years
OPERATING AT FULL PRODUCTION
• Low-cost, long-life copper mine began
production at end of 2014
• Annual Cu production of 103k tonnes at cash
costs of $1.00/lb and sustaining cash costs of
$1.28/lb over 5 years (2018-2022)
• Mining of high-grade Pampacancha satellite
deposit expected to begin in 2018 with total
project capital of $54 million9
• New 2018-2020 collective agreement in
place
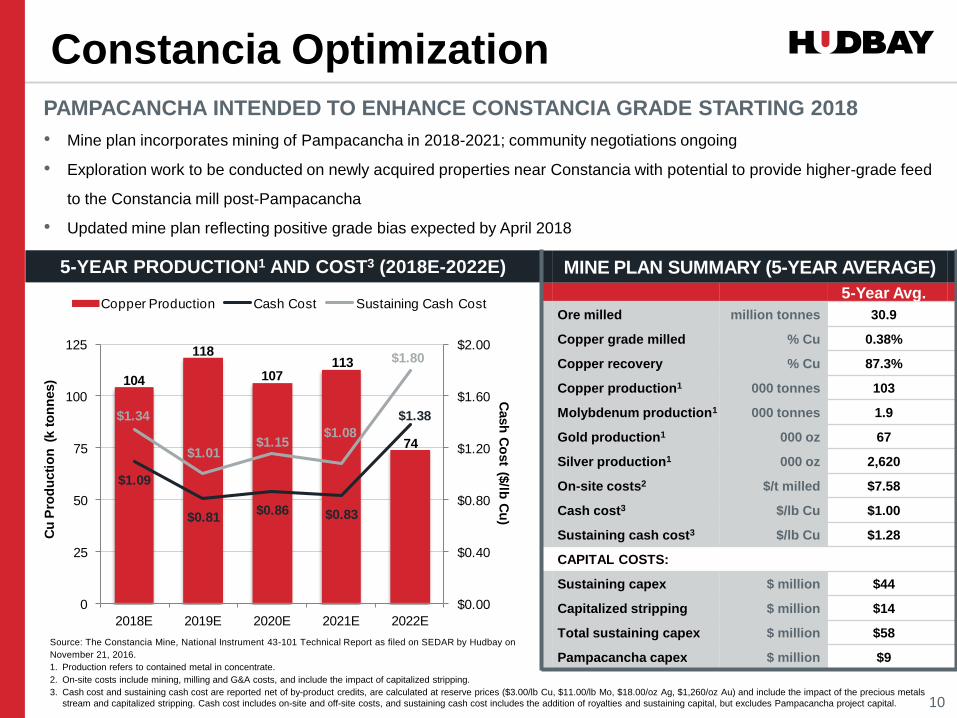
Constancia Optimization
10
MINE PLAN SUMMARY (5-YEAR AVERAGE)
5-Year Avg.
Ore milled million tonnes 30.9
Copper grade milled % Cu 0.38%
Copper recovery % Cu 87.3%
Copper production1 000 tonnes 103
Molybdenum production1 000 tonnes 1.9
Gold production1 000 oz 67
Silver production1 000 oz 2,620
On-site costs2 $/t milled $7.58
Cash cost3 $/lb Cu $1.00
Sustaining cash cost3 $/lb Cu $1.28
CAPITAL COSTS:
Sustaining capex $ million $44
Capitalized stripping $ million $14
Total sustaining capex $ million $58
Pampacancha capex $ million $9
PAMPACANCHA INTENDED TO ENHANCE CONSTANCIA GRADE STARTING 2018
• Mine plan incorporates mining of Pampacancha in 2018-2021; community negotiations ongoing
• Exploration work to be conducted on newly acquired properties near Constancia with potential to provide higher-grade feed
to the Constancia mill post-Pampacancha
• Updated mine plan reflecting positive grade bias expected by April 2018
5-YEAR PRODUCTION1 AND COST3 (2018E-2022E)
104
118
107113
74
$1.09
$0.81$0.86 $0.83
$1.38$1.34
$1.01$1.15
$1.08
$1.80
$0.00
$0.40
$0.80
$1.20
$1.60
$2.00
0
25
50
75
100
125
2018E 2019E 2020E 2021E 2022E
Cash
Co
st ($
/lb C
u)
Cu
Pro
du
cti
on
(k t
on
nes)
Copper Production Cash Cost Sustaining Cash Cost
Source: The Constancia Mine, National Instrument 43-101 Technical Report as filed on SEDAR by Hudbay on
November 21, 2016.
1. Production refers to contained metal in concentrate.
2. On-site costs include mining, milling and G&A costs, and include the impact of capitalized stripping.
3. Cash cost and sustaining cash cost are reported net of by-product credits, are calculated at reserve prices ($3.00/lb Cu, $11.00/lb Mo, $18.00/oz Ag, $1,260/oz Au) and include the impact of the precious metals
stream and capitalized stripping. Cash cost includes on-site and off-site costs, and sustaining cash cost includes the addition of royalties and sustaining capital, but excludes Pampacancha project capital.
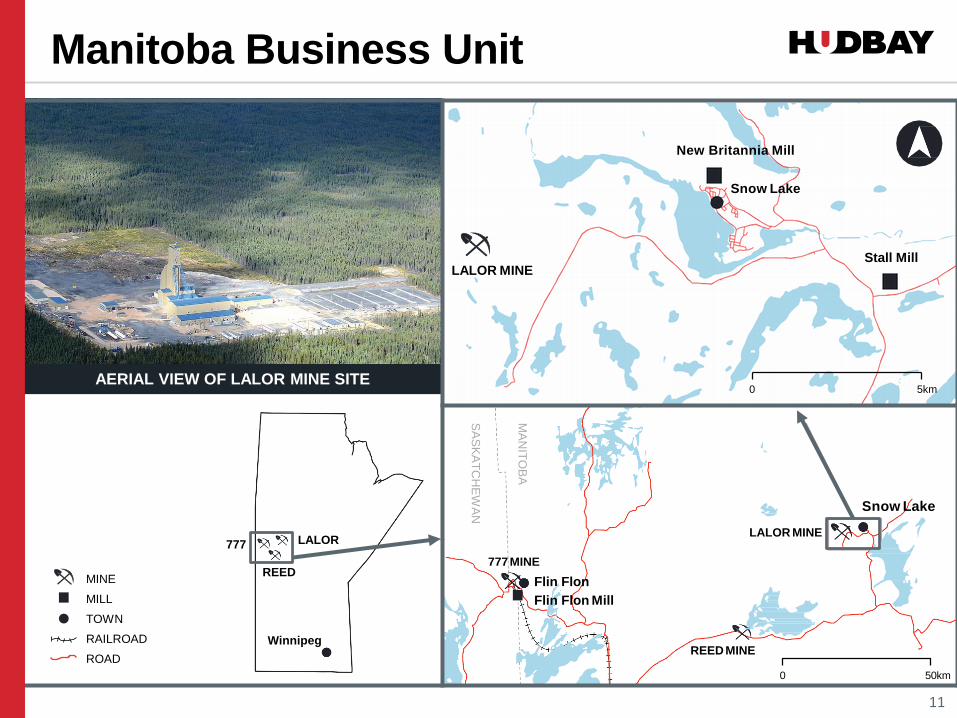
Winnipeg
777 LALOR
REED
REED MINE
777 MINE
Flin Flon
Flin Flon Mill
LALOR MINE
MA
NIT
OB
A
SA
SK
AT
CH
EW
AN
0 50km
Snow Lake
AERIAL VIEW OF LALOR MINE SITE
Manitoba Business Unit
11
MINE
MILL
TOWN
RAILROAD
ROAD
LALOR MINE
Stall Mill
New Britannia Mill
Snow Lake
0 5km
LALOR MINE Stall Mill

20171 AVG.
LOM2
Ownership 100%
Daily ore milled 3,000 tpd 3,900 tpd
Annual Zn production3 79kt 63kt
Annual Au-Eq. production3 45koz 81koz
Annual Cu production3 6kt 9kt
Unit operating cost4 C$138/t C$110/t
Mine life5 9 years
LALOR MINE SITE
Lalor Mine
PRODUCING LOW COST MINE WITH
ZINC & GOLD UPSIDE POTENTIAL
• Production shaft with capacity of 6,000tpd
• Strong ramp-up of ore production, on track for expanded 4,500tpd mine plan by third quarter 2018
• Utilizing Stall mill and available Flin Flon mill capacity for processing
• Gold zone mining to begin in 2018 to enhance production and support evaluation of gold processing opportunities
12
Source: Hudbay company disclosure
1. Full year ended December 31, 2017.
2. LOM = Life of Mine. As per NI 43-101 Technical Report on the Lalor mine dated March 30,
2017. LOM average based on full years 2018 to 2026.
3. Production is contained metal in concentrate; silver converted to gold at a rate of 70:1.
4. Combined mine, mill and G&A unit operating costs per tonne of ore processed. Average LOM unit costs assume
~$10/t of G&A is allocated to Lalor (Technical Report unit costs exclude allocation of Manitoba G&A share
services costs).
5. Mine life as of January 1, 2018.
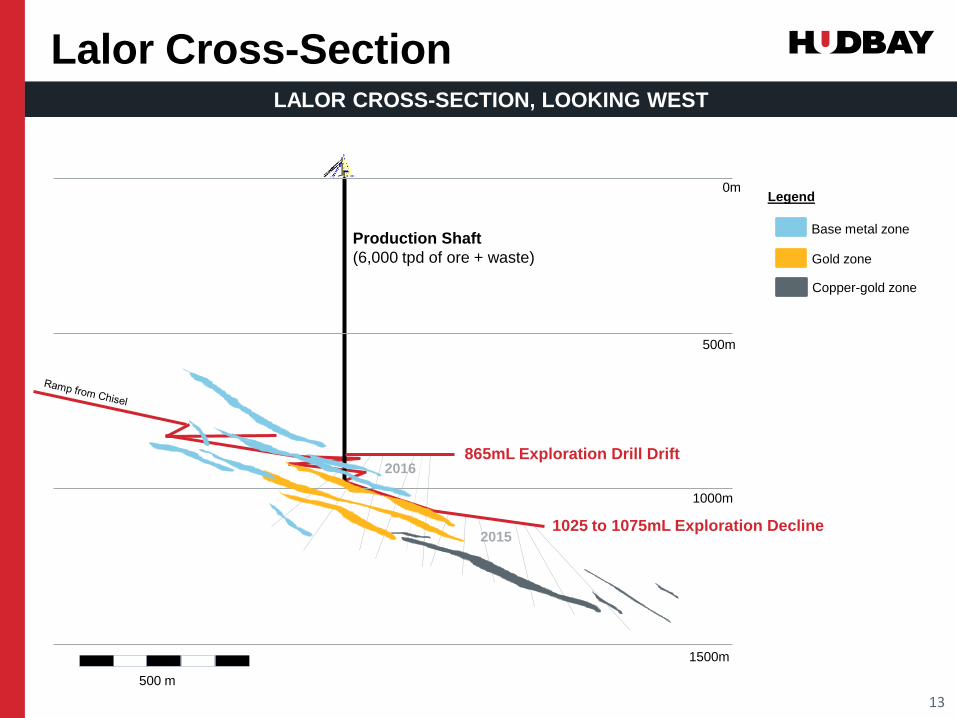
LALOR CROSS-SECTION, LOOKING WEST
Lalor Cross-Section
13
0m
500m
1000m
1500m
500 m
865mL Exploration Drill Drift
Production Shaft
(6,000 tpd of ore + waste)
Base metal zone
Gold zone
Copper-gold zone
Legend
1025 to 1075mL Exploration Decline
2016
2015

777 HEADFRAME REED MINE SITE
777 & REED COMBINED 20171 AVG. LOM2
Ownership 100% / 70%3
Daily ore milled 4,390 tpd 3,600 tpd
Annual Cu production4 31kt 19kt
Annual Zn production4 56kt 46kt
Annual Au-Eq. production4 62koz 63koz
Unit operating cost5 C$104/t C$88/t
Mine life6 3 years / <1 year
777 and Reed Mines
STEADY, LOW-COST PRODUCTION
• Optimizing operations to end of mine life
• Plan to keep processing assets on care and
maintenance after mine closures to maintain
regional optionality
14
Source: Hudbay and VMS Venture Inc. company disclosure
1. Full year ended December 31, 2017.
2. 777 LOM as per NI 43-101 Technical Report on 777 Mine dated October 15, 2012 incorporating full years 2018 and 2019; Reed LOM as per NI 43-101 Pre-Feasibility Study Technical Report on the Reed
Copper Deposit dated April 2, 2012 as filed by VMS Ventures Inc., shown on 100% basis, 1,300 tpd operation. LOM average based on full years 2018 and 2019.
3. Reed is 70% owned by Hudbay.
4. Production is contained metal in concentrate; silver converted to gold at a rate of 70:1.
5. Combined mine, mill and G&A unit operating costs per tonne of ore processed.
6. Mine life as of January 1, 2018.
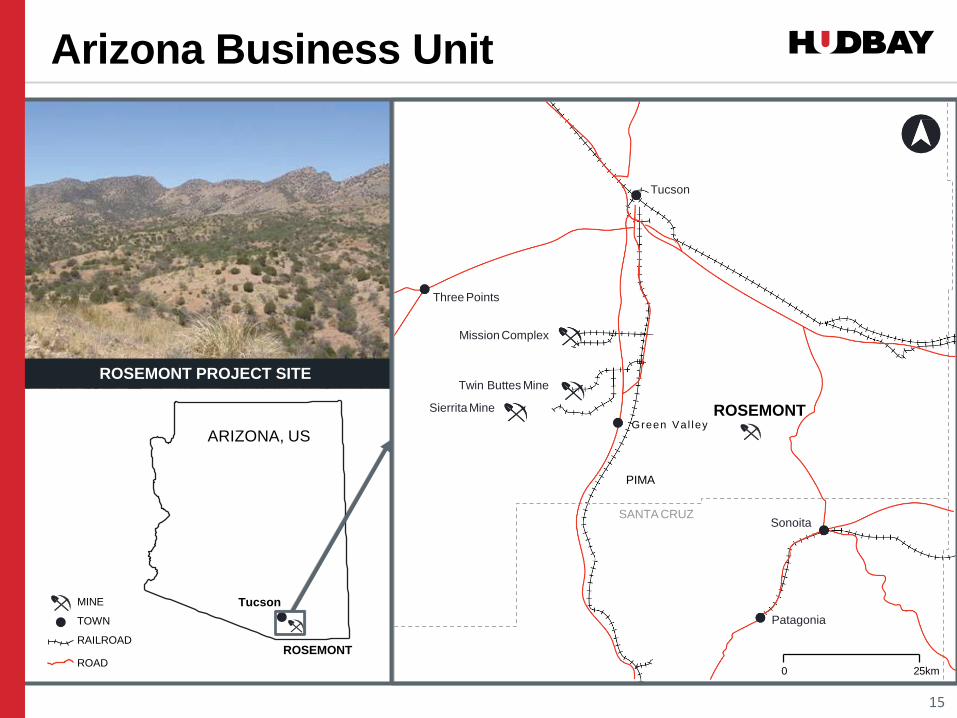
ROSEMONT PROJECT SITE
Arizona Business Unit
15
Tucson
ROSEMONT
MINE
TOWN
RAILROAD
ARIZONA, US
PIMA
ROAD
Twin Buttes Mine
Sierrita Mine
Tucson
Sonoita
Three Points
Mission Complex
Patagonia
SANTA CRUZ
0 25km
Green Val ley
ROSEMONT

ECONOMICS8
PROJECT HUDBAY
NPV 8% $769m $719m
NPV 10% $496m $499m
IRR (after-tax) 15.5% 17.7%
Payback period 5.2 years 4.9 years
Y 1-10 AVG.2 AVG. LOM2
Ownership 80%1
Daily ore milled 85k tpd
Strip ratio 2.5 2.0
Annual Cu production3 140kt 112kt
Unit operating cost4 $8.01/t $7.92/t
Cash cost per lb Cu5 $1.14/lb $1.29/lb
Initial development capital $1,920m
Annual sustaining capital6 $100m $61m
Sustaining cash cost7 $1.59/lb $1.65/lb
Mine life 19 years
Rosemont Project
80%-OWNED1 COPPER PROJECT
• High-quality development project with well-
established infrastructure
• March 2017 43-101 demonstrates robust
project economics
• 19 year mine life generating 15.5% after-tax
project IRR and 17.7% IRR to Hudbay at
$3.00/lb Cu
• Years 1-10 avg. annual production of 140,000
tons (127,000 metric tonnes) Cu at cash cost
of $1.14/lb
• Permitting and community engagement
progressing
• Positioned to move into construction soon
after permitting is complete
16
Note: “Tons” or “t” on this page refer to short tons, not metric tonnes, unless otherwise noted.
1. Hudbay’s ownership in the Rosemont project is subject to an earn-in agreement with United Copper & Moly LLC (“UCM”), a Korean consortium, pursuant to which UCM has earned a 7.95% interest in the
project and may earn up to a 20% interest.
2. LOM = Life of Mine. As per NI 43-101 Technical Report on the Rosemont Project dated March 30, 2017.
3. Production is contained metal in concentrate.
4. Combined mine, mill and G&A unit operating costs per tonne of ore processed (after impact of capitalized stripping).
5. Net of by-products. Includes impact of precious metal stream. Metal prices per the precious metals stream agreement are as follows: $3.90/oz Ag, $450/oz Au. Other metal price assumptions are as
follows: $3.00/lb Cu, $11.00/lb Mo, $18/oz Ag.
6. Sustaining capital includes capitalized stripping costs.
7. Sustaining cash cost per pound copper produced, includes sustaining capital costs and royalties.
8. Economic analysis assumes $3.00/lb Cu, $11.00/lb Mo, and precious metal streaming price of $3.90/oz Ag, subject to 1% annual inflation adjustment after three years. Hudbay basis adjusts for joint
venture partner expected payments to earn into their minority interest and outstanding joint venture loan owed to Hudbay.

Rosemont Initial Capex & Funding
~$800 MILLION OF FUNDING EXPECTED
• Initial sources of funding from existing stream
agreement with Wheaton Precious Metals,
existing joint venture agreement and expected
equipment financing
• Hudbay’s remaining share of capex is
approximately $1.1 billion
17
ROSEMONT FUNDING SUMMARY TO COMMERCIAL
PRODUCTION
$ million
Stream upfront payment $230
Proposed equipment financing $200
Joint venture earn-in payment $106
Joint venture share of remaining capital $277
Total funding sources $813
INITIAL CAPITAL COST ESTIMATE OF
$1.9 BILLION
• 3-year construction period: $144 million in
year 1, $861 million in year 2, $768 million in
year 3, remaining capital in ramp-up period
• 15% contingency added per item, plus ~4-5%
growth
ROSEMONT INITIAL CAPITAL COST BREAKDOWN
$ million
Site wide $42
Mining $474
Process plant $671
Site services & utilities $22
Internal infrastructure $127
External infrastructure $114
Common construction facilities $51
EPCM services $107
Owner’s cost $313
Total initial capital $1,921
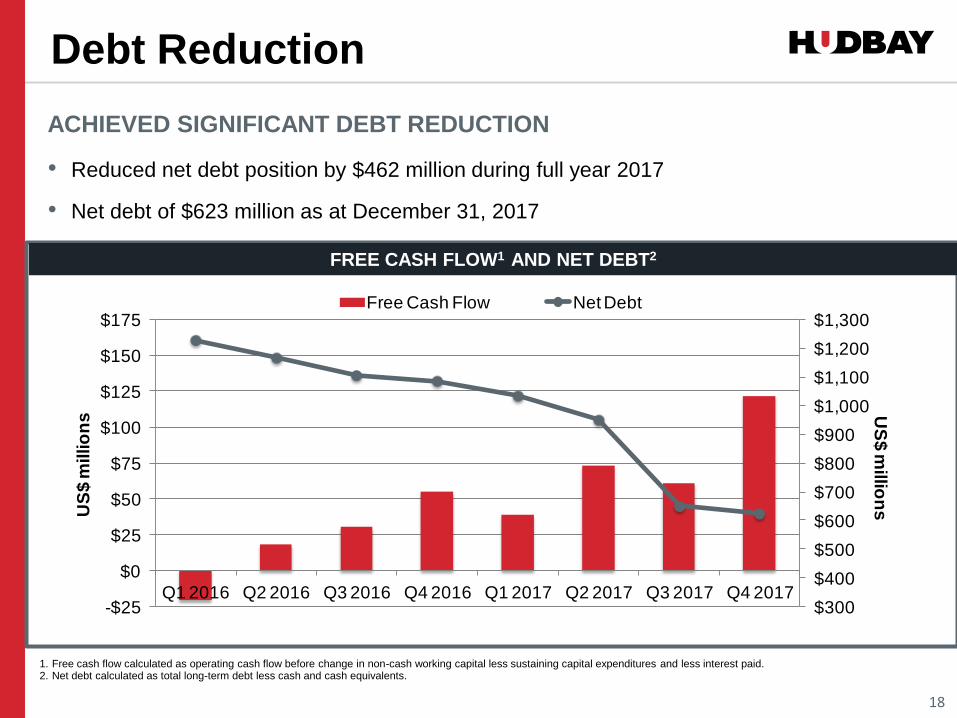
Debt Reduction
18
ACHIEVED SIGNIFICANT DEBT REDUCTION
• Reduced net debt position by $462 million during full year 2017
• Net debt of $623 million as at December 31, 2017
FREE CASH FLOW1 AND NET DEBT2
1. Free cash flow calculated as operating cash flow before change in non-cash working capital less sustaining capital expenditures and less interest paid. 2. Net debt calculated as total long-term debt less cash and cash equivalents.
$300
$400
$500
$600
$700
$800
$900
$1,000
$1,100
$1,200
$1,300
-$25
$0
$25
$50
$75
$100
$125
$150
$175
Q1 2016 Q2 2016 Q3 2016 Q4 2016 Q1 2017 Q2 2017 Q3 2017 Q4 2017
Free Cash Flow Net Debt
US
$ m
illion
sUS
$ m
illio
ns
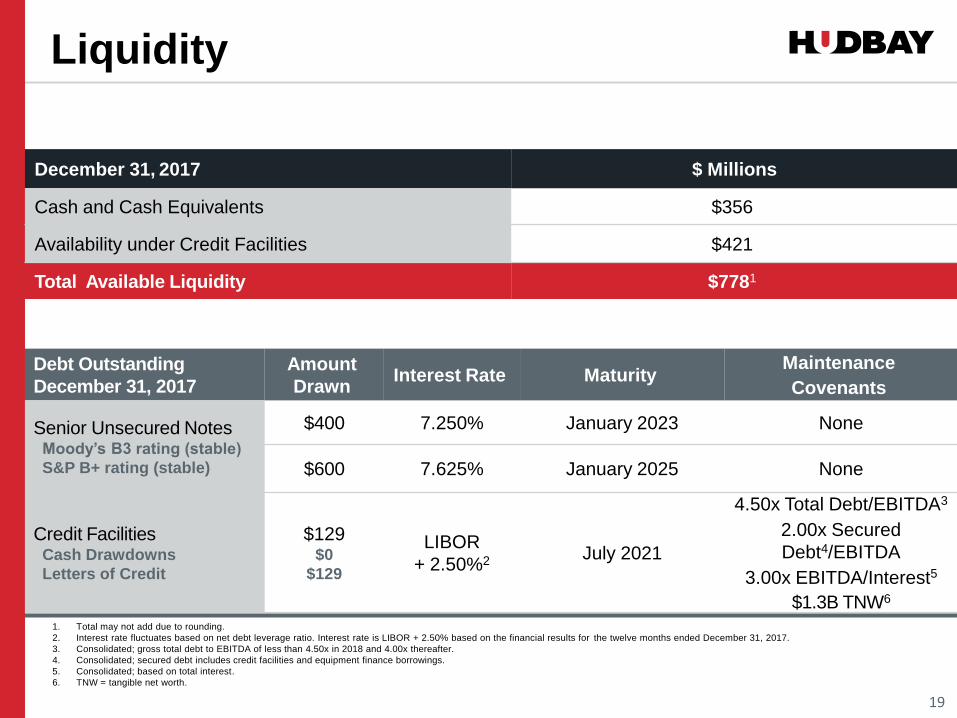
Liquidity
19
Debt Outstanding
December 31, 2017
Amount
Drawn Interest Rate Maturity
Maintenance
Covenants
Senior Unsecured Notes Moody’s B3 rating (stable)
S&P B+ rating (stable)
$400 7.250% January 2023 None
$600 7.625% January 2025 None
Credit Facilities Cash Drawdowns
Letters of Credit
$129
$0
$129
LIBOR
+ 2.50%2 July 2021
4.50x Total Debt/EBITDA3
2.00x Secured
Debt4/EBITDA
3.00x EBITDA/Interest5
$1.3B TNW6
1. Total may not add due to rounding.
2. Interest rate fluctuates based on net debt leverage ratio. Interest rate is LIBOR + 2.50% based on the financial results for the twelve months ended December 31, 2017.
3. Consolidated; gross total debt to EBITDA of less than 4.50x in 2018 and 4.00x thereafter.
4. Consolidated; secured debt includes credit facilities and equipment finance borrowings.
5. Consolidated; based on total interest.
6. TNW = tangible net worth.
December 31, 2017 $ Millions
Cash and Cash Equivalents $356
Availability under Credit Facilities $421
Total Available Liquidity $7781

2018 Objectives
Continue to focus on generating free cash flow and increasing net asset value
Advance in-house brownfield growth opportunities
• Complete Lalor paste plant and ramp up base metal ore throughput from Lalor to
4,500 tonnes per day
• Pampacancha
• Lalor gold
Advance permitting and technical work at Rosemont
Test promising exploration targets near Constancia and Lalor, and at greenfield
sites in Peru, Chile and Canada
Continue to evaluate exploration and acquisition opportunities that meet our
strategic criteria
20
APPENDIX
21

Appendix Contents
22
• Experienced Management Team
• Copper By-Product Cost Curve
• Global Refined Metal Market Balance
• Why Copper?
• Q4 2017 Results by Business Unit
• Consolidated Production Profile
• Constancia Site Map
• Mining Properties Near Constancia
• Constancia Mine Plan Summary
• Manitoba Operations Flow Chart
• Lalor Mine Plan Summary
• Exploration Focus by Region
• Current Exploration Focus
• 2018 Guidance
• Leverage to Commodities
• Precious Metals Stream Overview
• Reserves and Resources Information
Experienced Management Team
23
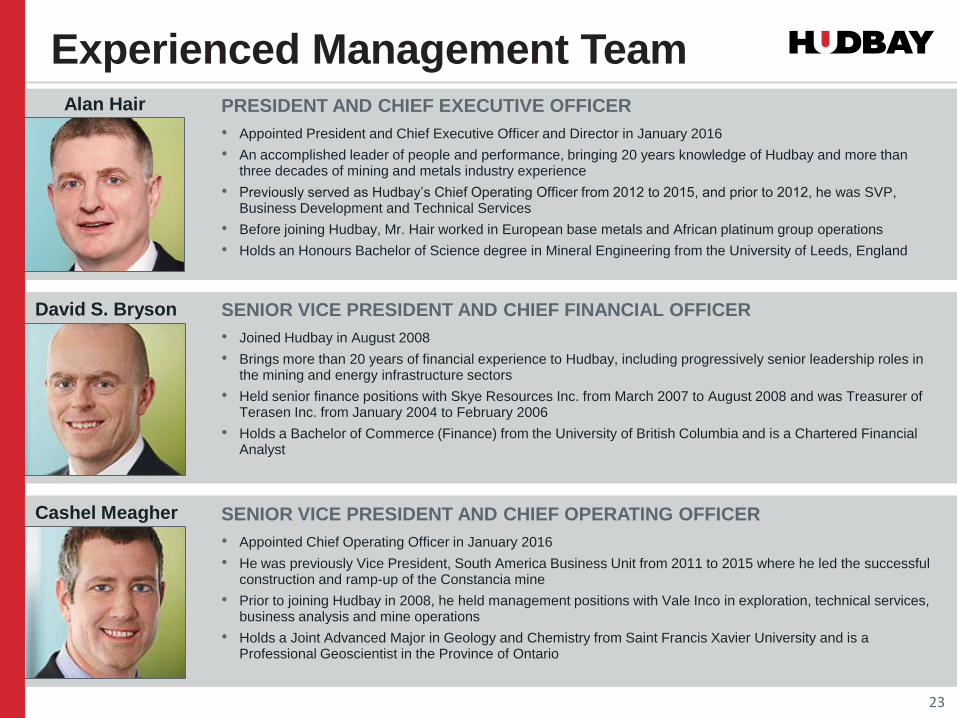
PRESIDENT AND CHIEF EXECUTIVE OFFICER
• Appointed President and Chief Executive Officer and Director in January 2016
• An accomplished leader of people and performance, bringing 20 years knowledge of Hudbay and more than three decades of mining and metals industry experience
• Previously served as Hudbay’s Chief Operating Officer from 2012 to 2015, and prior to 2012, he was SVP, Business Development and Technical Services
• Before joining Hudbay, Mr. Hair worked in European base metals and African platinum group operations
• Holds an Honours Bachelor of Science degree in Mineral Engineering from the University of Leeds, England
Alan Hair
SENIOR VICE PRESIDENT AND CHIEF FINANCIAL OFFICER
• Joined Hudbay in August 2008
• Brings more than 20 years of financial experience to Hudbay, including progressively senior leadership roles in the mining and energy infrastructure sectors
• Held senior finance positions with Skye Resources Inc. from March 2007 to August 2008 and was Treasurer of Terasen Inc. from January 2004 to February 2006
• Holds a Bachelor of Commerce (Finance) from the University of British Columbia and is a Chartered Financial Analyst
David S. Bryson
SENIOR VICE PRESIDENT AND CHIEF OPERATING OFFICER
• Appointed Chief Operating Officer in January 2016
• He was previously Vice President, South America Business Unit from 2011 to 2015 where he led the successful construction and ramp-up of the Constancia mine
• Prior to joining Hudbay in 2008, he held management positions with Vale Inco in exploration, technical services, business analysis and mine operations
• Holds a Joint Advanced Major in Geology and Chemistry from Saint Francis Xavier University and is a Professional Geoscientist in the Province of Ontario
Cashel Meagher

2017 COST CURVE1
Copper By-Product Cost Curve
24
Source: Wood Mackenzie
1. Wood Mackenzie Cu normal mine site C1 cost curve for 2017 (Q4 2017 update). Constancia, 777, Lalor and Reed costs are sourced from Wood Mackenzie. Wood Mackenzie’s costing methodology may be
different than the methodology reported by Hudbay in its public disclosure.

Global Refined Metal Market Balance
• Copper market moves into a significant
deficit anticipated near the end of the
decade after last of new supply absorbed
25
• Fundamentals will support higher prices in the
near-term, but supply-side response from high
prices expected to push market into surplus
COPPER ZINC
Source: Wood Mackenzie, Global Copper Long-Term Outlook Q4 2017 dated December 2017, Global Zinc Long-Term Outlook Q4 2017 dated December 2017.
0
50
100
150
200
250
300
350
400
450
-400
-300
-200
-100
0
100
200
300
400
500
600
700
2010
2011
2012
2013
2014
2015
2016
2017
2018
2019
2020
2021
2022
2023
LM
E C
u P
rice R
eal c
/lb
kt
Cu
Refined Surplus (Deficit) Copper Price
0
20
40
60
80
100
120
140
160
180
200
-1000
-750
-500
-250
0
250
500
750
1000
1250
2010
2011
2012
2013
2014
2015
2016
2017
2018
2019
2020
2021
2022
2023
LM
E Z
n P
rice R
eal c
/lb
kt
Zn
Refined Surplus (Deficit) Zinc Price

Why Copper?
26
GLOBAL MARKET DEMAND FOR MINE OUTPUT
Source: Wood Mackenzie, Global Copper Long-Term Outlook Q4 2017 dated December 2017.
STRONG LONG-TERM FUNDAMENTALS
• Long lead times to bring new copper capacity
into production
• Reserve depletion and falling head grades
will see base case production fall after 2020
• Lack of advanced development projects will
lead to tight metal market early in next
decade
• Significant supply from un-committed projects
required after 2020
• Minimal substitution risk; electrical is largest
end-use of copper and substitution has
largely taken place already
• Further potential demand upside from electric
vehicles and renewable energy

South America Q4 2017 Results
27
1. Precious metals production includes gold and silver production on a gold-equivalent basis. Silver is converted
to gold at a 70:1 ratio.
2. Reflects combined mine, mill and G&A costs per tonne of ore milled. Unit costs reflect the deduction of
expected capitalized stripping costs.
3. Cash cost and sustaining cash cost per pound of copper produced, net of by-product credits.
PERU SUMMARY OPERATING STATISTICS
Q4 2017 Q3 2017
Ore mined (million tonnes) 7.2 8.2
Ore milled (million tonnes) 7.7 7.8
Copper grade milled 0.54% 0.49%
Gold grade milled (g/t) 0.04 0.04
Silver grade milled (g/t) 3.86 3.70
Copper recovery 82.1% 81.2%
Gold recovery 48.0% 51.8%
Silver recovery 70.5% 66.3%
Copper contained in conc. (kt) 33.8 30.9
Precious metals contained in
conc. (koz)1 14.7 13.5
Combined unit operating
costs ($/tonne)2 $9.75 $7.49
Cash cost ($/lb)3 $1.38 $1.19
Sustaining cash cost ($/lb)3 $1.81 $1.80
• Copper production increased quarter-over-
quarter because of improved copper head
grade and copper recoveries
• Updated mine plan and reserves by April
2018
• Combined unit operating costs increased
compared to Q3 2017 mainly because of
decreased capitalized stripping, higher utility
prices and higher operating costs due to
increased moly production
• Cash costs of $1.38/lb and sustaining cash
cost of $1.81/lb
• Negotiations to secure Pampacancha surface
rights are progressing; community has
provided land access for early works
activities

MANITOBA SUMMARY OPERATING STATISTICS
Q4 2017 Q3 2017
Ore mined (kt) 639 695
Ore milled (kt) 670 671
Copper grade milled 1.52% 1.55%
Zinc grade milled 5.61% 6.01%
Gold grade milled (g/t) 2.04 1.86
Silver grade milled (g/t) 25.52 25.23
Copper recovery 91.7% 91.5%
Zinc recovery 88.0% 90.8%
Gold recovery 62.4% 59.6%
Silver recovery 60.6% 58.3%
Copper contained in conc.
(kt)1 9.3 9.5
Zinc contained in conc. (kt)1 33.1 36.6
Precious metals contained in
conc. (koz)1,2 32.2 28.5
Combined unit operating
costs ($/tonne)3 $124.67 $119.87
Cash cost ($/lb)4 $(1.42) $(0.20)
Sustaining cash cost ($/lb)4 $(0.35) $0.68
Manitoba Q4 2017 Results
28
1. Includes 100% of Reed mine production.
2. Precious metals production includes gold and silver production on a gold-equivalent basis. Silver is
converted to gold at a 70:1 ratio.
3. Reflects combined mine, mill and G&A costs per tonne of ore milled. Includes the cost of ore purchased
from our joint venture partner at Reed mine.
4. Cash cost and sustaining cash cost per pound of copper produced, net of by-product credits.
• Production of precious metals was higher
than Q3 2017 as a result of increased
production at Lalor
• Production of all metals in Manitoba for full
year 2017 within the guidance ranges
• Ore processed during Q4 2017 in line with
previous quarter
• Combined unit operating costs increased
compared to Q3 2017, mainly due to lower
production at 777, the cessation of the
capitalization of Reed’s development costs
and higher Lalor unit costs to increase
production to 4,500 tonnes per day
• Initial mining of Lalor gold zone in 2018

• Production profile is based on a hypothetical scenario assuming first year of Rosemont
construction occurs in 2019; Rosemont project development is conditional upon receipt of
final permits and Board approval
29
GROWING COPPER PRODUCTION
Consolidated Production Profile
HUDBAY CONSOLIDATED ANNUAL COPPER PRODUCTION1,2
1. Source: Copper contained in concentrate production sourced from actuals for 2015 through 2017, mid-point of 2018 annual guidance, and filed technical reports for 2019 onwards. NI 43-101
Technical Report on the Constancia Mine dated November 21, 2016; NI 43-101 Technical Report on the Lalor Mine dated March 30, 2017; NI 43-101 Technical Report on the 777 Mine dated October
15, 2012; NI 43-101 Technical Report on the Reed Copper Deposit dated April 2, 2012 as filed by VMS Ventures Inc.; NI 43-101 Technical Report on the Rosemont Project dated March 30, 2017.
2. The information shown here assumes a hypothetical scenario where the first year of construction for Rosemont occurs in 2019 (ie. “year -3” in the Rosemont technical report) . Production numbers
are shown on an attributable basis (ie. 80% of Rosemont copper production). Development of Rosemont is conditional upon receipt of final permits and the approval of Hudbay’s Board of Directors.
0
50,000
100,000
150,000
200,000
250,000
20
15
20
16
20
17
20
18
E
20
19
E
20
20
E
20
21
E
20
22
E
20
23
E
20
24
E
Cu
Co
nta
ine
d i
n C
on
ce
ntr
ate
(to
nn
es
)
Manitoba Peru Arizona

Constancia Site Map
30
Constancia
Camp Crushing Area
Sediment Pond
PROCESS
PLANT
Fortunia
Camp
Chilloroya
Town
TAILING MANAGEMENT
FACILITY
WASTE ROCK
FACILITY
CONSTANCIA PIT
Cunahuri
Reservoir
PAMPACANCHA
PIT
Main Sediment
Pond
Topsoil Stockpile
NAG Stockpile
WRF Containment
Pond
ORE STOCKPILES
HAUL ROAD
PUBLIC ACCESS ROAD
ROM Pad
PAMPACANCHA SATELLITE DEPOSIT LOCATED ~7km (BY TRUCK) FROM PRIMARY
CRUSHER

31
Mining Properties Near Constancia
MINERAL PROPERTIES WITHIN TRUCKING DISTANCE OF CONSTANCIA PROCESSING
FACILITY

MINE PLAN SUMMARY – NOVEMBER 21, 2016 TECHNICAL REPORT
2018E 2019E 2020E 2021E 2022E LOM Avg.1
Ore mined million tonnes 34.1 27.7 32.2 31.8 31.3 30.3
Waste mined million tonnes 39.1 33.8 36.9 37.0 34.5 33.7
Strip ratio waste:ore 1.1 1.2 1.1 1.2 1.1 1.1
Ore milled million tonnes 31.0 30.9 31.0 30.9 30.9 30.9
Copper grade milled % Cu 0.39% 0.44% 0.40% 0.42% 0.27% 0.29%
Copper recovery % Cu 86.0% 86.6% 87.0% 87.1% 89.8% 88.9%
Copper production2 000 tonnes 104 118 107 113 74 81
Molybdenum production2 000 tonnes 1.7 1.9 2.1 1.8 1.9 1.6
Gold production2 000 oz 40 94 81 102 18 36
Silver production2 000 oz 2,523 2,577 2,667 3,232 2,118 2,095
On-site costs3 $/t milled $7.53 $7.74 $7.55 $7.80 $7.26 $7.36
Cash cost4 $/lb Cu $1.09 $0.81 $0.86 $0.83 $1.38 $1.28
Sustaining cash cost4 $/lb Cu $1.34 $1.01 $1.15 $1.08 $1.80 $1.60
CAPITAL COSTS:
Sustaining capex $ million $34 $42 $51 $48 $47 $38
Capitalized stripping $ million $17 $5 $15 $13 $19 $16
Total sustaining capex $ million $51 $47 $66 $61 $66 $54
Pampacancha capex $ million $29 $13 $1 $1 - -
Source: The Constancia Mine, National Instrument 43-101 Technical Report as filed on SEDAR by Hudbay on November 21, 2016.
1. Life-of-mine (“LOM”) average calculated from 2018-2035.
2. Production refers to contained metal in concentrate.
3. On-site costs include mining, milling and G&A costs, and include the impact of capitalized stripping.
4. Cash cost and sustaining cash cost are reported net of by-product credits, are calculated at reserve prices ($3.00/lb Cu, $11.00/lb Mo, $18.00/oz Ag, $1,260/oz Au) and include the impact of the precious metals
stream and capitalized stripping. Cash cost includes on-site and off-site costs, and sustaining cash cost includes the addition of royalties and sustaining capital, but excludes Pampacancha project capital.
Constancia Mine Plan Summary
32

Manitoba Operations Flow Chart
33
777 Mine
Reed Mine
Lalor Mine
Flin Flon Mill
Stall Mill
New Britannia
Mill1
Copper
Concentrate
Zinc
Concentrate
Gold Dore
Zinc Plant
Mine Processing
Facility Product
Legend:
1. Studies underway on potential refurbishment of New Britannia mill, including potential processing of Lalor ore.
Market
Market
Market
Refined
Zinc

MINE PLAN SUMMARY – MARCH 30, 2017 TECHNICAL REPORT
2018E 2019E 2020E 2021E 2022E LOM Total1
Ore milled tonnes 1,616,285 1,620,000 1,603,652 1,620,000 1,473,657 12,953,354
Milled daily throughput tonnes per day 4,500 4,500 4,500 4,500 4,100 -
Zinc grade milled % Zn 5.71% 5.62% 4.61% 4.83% 5.72% 4.63%
Copper grade milled % Cu 0.52% 0.48% 0.79% 0.92% 0.95% 0.70%
Gold grade milled g/t Au 2.13 1.86 2.79 2.86 3.16 2.67
Silver grade milled g/t Ag 24.37 21.43 28.43 26.39 26.72 26.97
Zinc production2 000 tonnes 84,723 83,495 66,596 70,810 77,440 579,446
Copper production2 000 tonnes 6,993 6,481 11,168 13,235 12,370 78,689
Gold production2 000 oz 59,202 54,079 83,265 91,994 93,174 653,662
Silver production2 000 oz 591,589 537,611 842,391 909,201 846,328 6,060,893
Mining unit cost3 C$/t mined C$72 C$77 C$77 C$77 C$77 C$78
Milling unit cost3 C$/t milled C$20 C$20 C$20 C$20 C$21 C$22
CAPITAL COSTS:
Development capital C$ million C$42 - - - -
C$42
Sustaining capital C$ million C$49 C$31 C$29 C$24 C$21 C$184
Source: The Lalor Mine, National Instrument 43-101 Technical Report as filed on SEDAR by Hudbay on March 30, 2017.
1. Life-of-mine (“LOM”) total calculated from 2018-2027.
2. Production refers to contained metal in concentrate.
3. G&A costs related to shared services incurred in Flin Flon and allocated between 777, Reed and Lalor mines are not included in unit costs.
Lalor Mine Plan Summary
34
Exploration Focus by Region
35
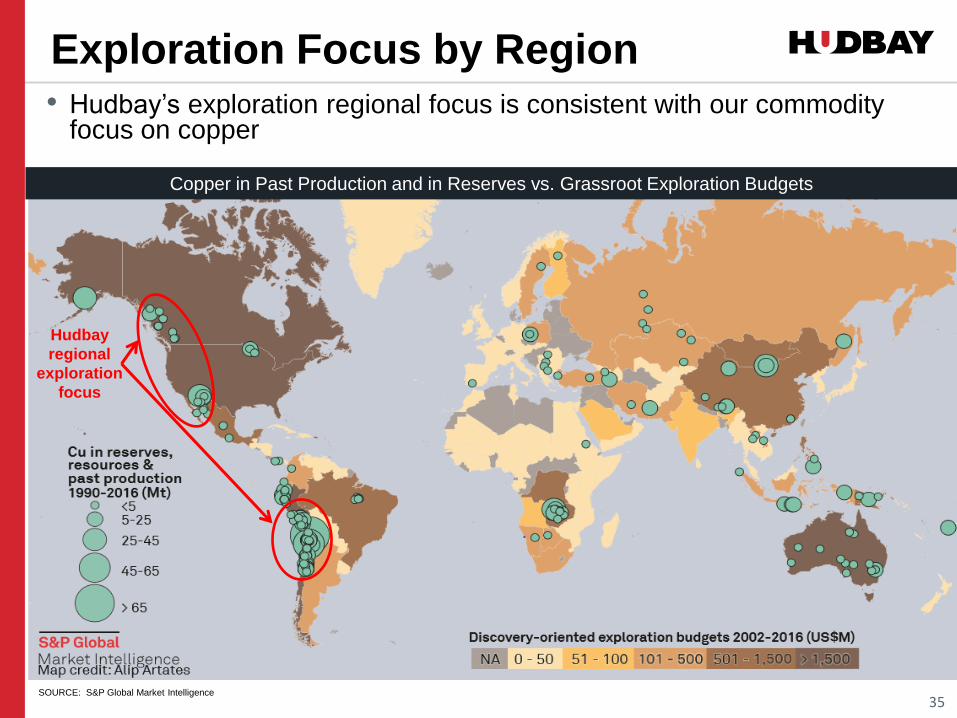
• Hudbay’s exploration regional focus is consistent with our commodity focus on copper
Hudbay
regional
exploration
focus
Copper in Past Production and in Reserves vs. Grassroot Exploration Budgets
SOURCE: S&P Global Market Intelligence

Current Exploration Focus
36
EXTENSIVE TARGET GENERATION IDENTIFIED SEVERAL PRIORITY TARGETS
PROPERTY TYPE DESCRIPTION TIMEFRAME
CA
NA
DA
Lalor Mine 100% owned Drilling down-plunge and new near-mine targets with a
combination of surface and underground drilling
2018
Other Manitoba 100% owned Drill ready gold and base metals targets to be tested in Snow
Lake and in the Flin Flon Greenstone Belt
Large airborne survey underway in prospective block south of
Flin Flon infrastructure
2018
BC: Ike, Joy/Pine Optioned Continue exploratory drilling on properties with potential for
large porphyry discoveries in British Columbia
H2 2018
Other Ongoing property evaluation and possible option/joint venture
agreements
2018 and
onwards
PE
RU
Lucmo, Kaval,
Tingo, Pinco Pinco
100% owned Advancing three of these properties (porphyry Cu-Mo-Au) into
the drilling phase and work planning ongoing
2018
Caballito, Maria
Reyna, Kusiorcco
Optioned Community relation and field exploration work planning in
recent acquired properties adjacent to Constancia
infrastructure
2018
Llaguen Optioned Community relation and field exploration work planning 2018
CH
ILE
Trilco 100% owned Drill ready targets to be tested 2018
Illapel Optioned 2017 exploration program results under review H1 2018
Other Access to historical exploration data, possible option/joint
venture agreements on other prospective properties in Chile
2018 and
onwards

37
1. Excludes capitalized interest
2. Includes capitalized stripping costs.
3. Capitalized spending.
4. Includes original Manitoba growth capital guidance announced January 17, 2017 of $40 million plus an additional $16 million (assuming CAD/USD exchange rate of 1.35) of Lalor growth capital as shown in the
Lalor updated Technical Report dated March 30, 2017.
$ MILLIONS 2018 GUIDANCE 2017 GUIDANCE
SUSTAINING CAPITAL
Manitoba 85 65
Peru2 50 120
Total Sustaining Capital 135 185
GROWTH CAPITAL
Manitoba 20 40
Peru 45 25
Arizona3 35 20
Total Growth Capital 100 85
Capitalized Exploration 10 2
Total Capital Expenditure 245 272
CAPITAL EXPENDITURE1
2018 Guidance
• Total sustaining capital expenditures expected to decline by 27% compared to 2017
guidance, as a major raise of the Constancia tailings management facility was
successfully completed in 2017
38
$ MILLIONS
Peru 20
Manitoba 15
Generative and Other 15
Total Exploration Expenditures 50
Capitalized Spending (10)
Total Exploration Expense 40
2018 Guidance
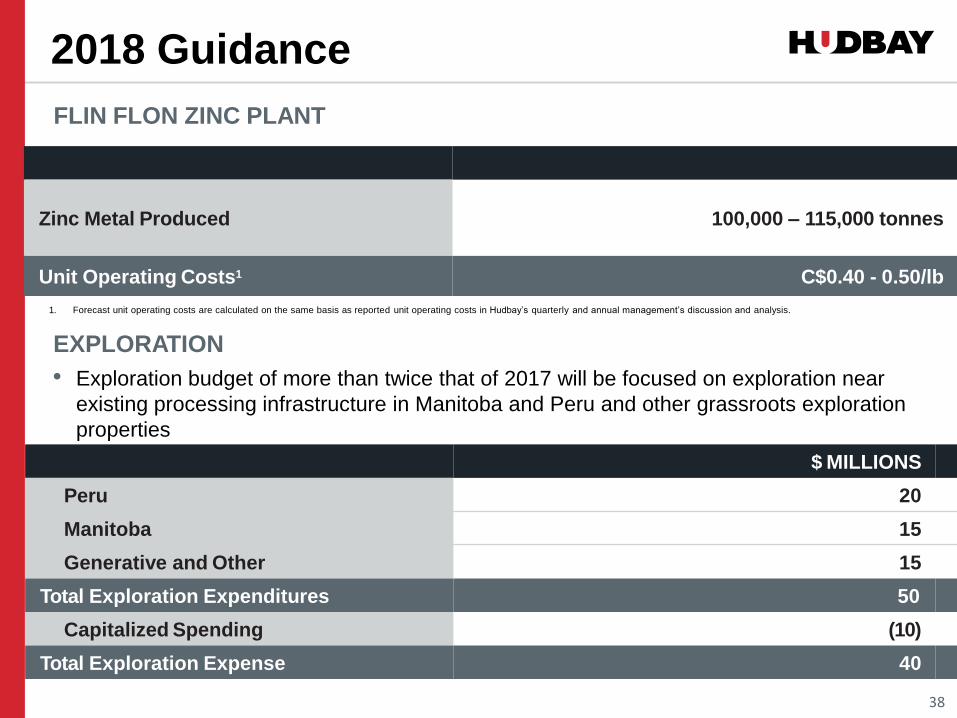
FLIN FLON ZINC PLANT
EXPLORATION
Zinc Metal Produced 100,000 – 115,000 tonnes
Unit Operating Costs1 C$0.40 - 0.50/lb
1. Forecast unit operating costs are calculated on the same basis as reported unit operating costs in Hudbay’s quarterly and annual management’s discussion and analysis.
• Exploration budget of more than twice that of 2017 will be focused on exploration near
existing processing infrastructure in Manitoba and Peru and other grassroots exploration
properties
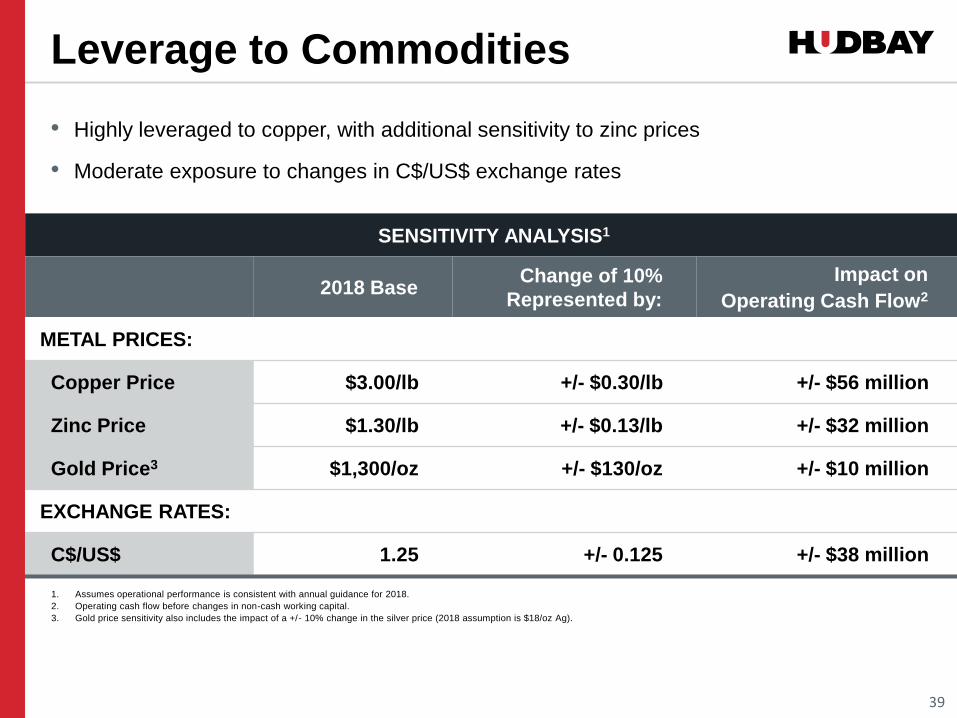
Leverage to Commodities
• Highly leveraged to copper, with additional sensitivity to zinc prices
• Moderate exposure to changes in C$/US$ exchange rates
39
SENSITIVITY ANALYSIS1
2018 Base Change of 10%
Represented by:
Impact on
Operating Cash Flow2
METAL PRICES:
Copper Price $3.00/lb +/- $0.30/lb +/- $56 million
Zinc Price $1.30/lb +/- $0.13/lb +/- $32 million
Gold Price3 $1,300/oz +/- $130/oz +/- $10 million
EXCHANGE RATES:
C$/US$ 1.25 +/- 0.125 +/- $38 million
1. Assumes operational performance is consistent with annual guidance for 2018.
2. Operating cash flow before changes in non-cash working capital.
3. Gold price sensitivity also includes the impact of a +/- 10% change in the silver price (2018 assumption is $18/oz Ag).

Precious Metals Stream Overview
40
1. The stream upfront deposit of $230 million for Rosemont has not yet been received and will be payable upon the satisfaction o f certain conditions precedent, including the receipt of permits and
the commencement of construction.
2. Payments for production of silver and gold from 777 are subject to 1% annual escalation starting 2015; payments for production of gold and silver from Constancia are subject to 1% annual
escalation starting in 2019; payments for production of gold and silver from Rosemont are subject to 1% annual escalation after three years.
3. Percentage of gold streamed at 777 dropped to 50% as of January 1, 2017, from 100%.
DELIVERY FROM HUDBAY TO WHEATON PRECIOUS METALS
PAYMENTS FROM WHEATON PRECIOUS METALS TO HUDBAY
Upfront payments Production payments2
Remaining Life of Mine
Silver 100%
Gold 50%3
777
Remaining Life of Mine
Constancia
Remaining Life of Mine
Silver 100%
Gold 50%
Life of Mine
Silver 100%
Gold 100%
Rosemont
777 and Constancia
$5.90/oz Silver
$400/oz Gold
Rosemont
$3.90/oz Silver
$450/oz Gold
777 and Constancia
$885 million
Rosemont
(pending)
$230 million1

Peru Mineral Reserves
41
Note: Totals may not add up correctly due to rounding.
CATEGORY TONNES Cu (%) Mo (g/t) Ag (g/t) Au (g/t)
CONSTANCIA
Proven 431,300,000 0.30 95 2.88 0.037
Probable 109,900,000 0.23 62 2.55 0.034
Total Proven and Probable 541,200,000 0.28 88 2.81 0.037
PAMPACANCHA
Proven 22,800,000 0.53 149 4.44 0.299
Probable 20,200,000 0.44 164 3.85 0.250
Total Proven and Probable 43,000,000 0.49 156 4.17 0.276
Total Mineral Reserves 584,200,000 0.30 93 2.91 0.054
AS AT JANUARY 1, 2017

Peru Mineral Resources
42
Note: Totals may not add up correctly due to rounding.
AS AT JANUARY 1, 2017
CATEGORY TONNES Cu (%) Mo (g/t) Ag (g/t) Au (g/t)
CONSTANCIA
Measured 161,800,000 0.19 55 2.26 0.031
Indicated 287,800,000 0.17 50 1.89 0.026
Measured and Indicated 449,600,000 0.18 52 2.02 0.028
Inferred 138,100,000 0.17 40 1.70 0.018
PAMPACANCHA
Measured 7,500,000 0.35 57 4.13 0.235
Indicated 15,200,000 0.18 90 2.85 0.180
Measured and Indicated 22,700,000 0.23 79 3.27 0.198
Total Measured and Indicated 472,300,000 0.18 53 2.08 0.036
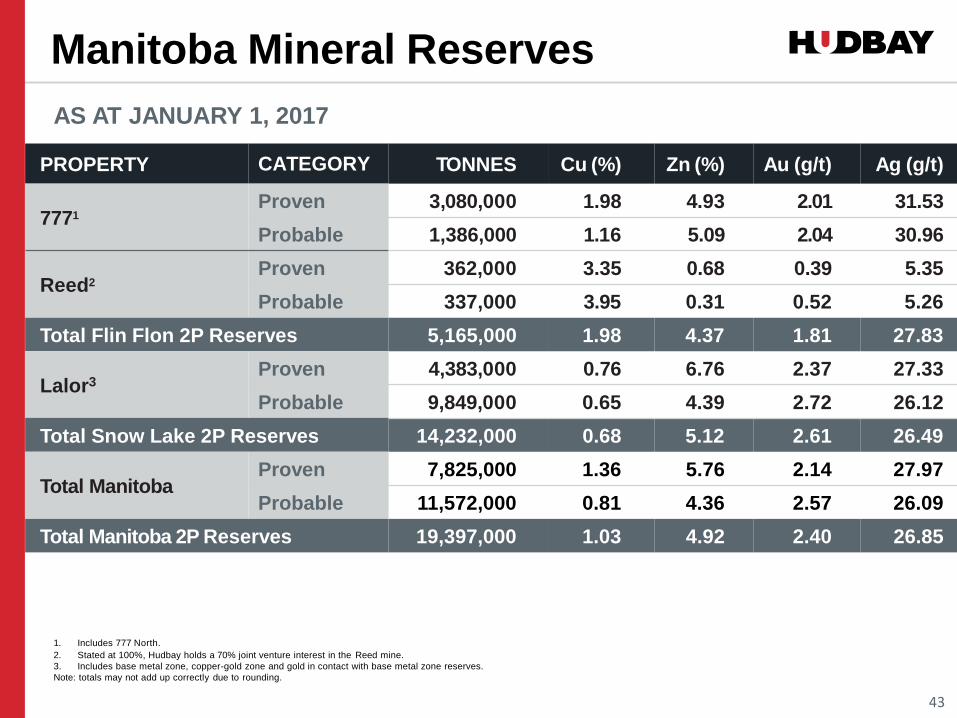
Manitoba Mineral Reserves
43
1. Includes 777 North.
2. Stated at 100%, Hudbay holds a 70% joint venture interest in the Reed mine.
3. Includes base metal zone, copper-gold zone and gold in contact with base metal zone reserves.
Note: totals may not add up correctly due to rounding.
PROPERTY CATEGORY TONNES Cu (%) Zn (%) Au (g/t) Ag (g/t)
7771 Proven 3,080,000 1.98 4.93 2.01 31.53
Probable 1,386,000 1.16 5.09 2.04 30.96
Reed2 Proven 362,000 3.35 0.68 0.39 5.35
Probable 337,000 3.95 0.31 0.52 5.26
Total Flin Flon 2P Reserves 5,165,000 1.98 4.37 1.81 27.83
Lalor3 Proven 4,383,000 0.76 6.76 2.37 27.33
Probable 9,849,000 0.65 4.39 2.72 26.12
Total Snow Lake 2P Reserves 14,232,000 0.68 5.12 2.61 26.49
Total Manitoba Proven 7,825,000 1.36 5.76 2.14 27.97
Probable 11,572,000 0.81 4.36 2.57 26.09
Total Manitoba 2P Reserves 19,397,000 1.03 4.92 2.40 26.85
AS AT JANUARY 1, 2017

Manitoba Mineral Resources
44
AS AT SEPTEMBER 30, 2016
PROPERTY CATEGORY TONNES Cu (%) Zn (%) Au (g/t) Ag (g/t)
7771 Indicated 736,000 0.99 3.53 1.82 26.24
Inferred 673,000 1.01 4.26 1.72 30.95
Reed2 Inferred 88,000 3.13 0.42 0.79 6.00
Total Flin Flon Indicated 736,000 0.99 3.53 1.82 26.24
Inferred 761,000 1.26 3.82 1.61 28.06
Lalor – Base Metal Indicated 2,100,000 0.49 5.34 1.69 28.10
Inferred 545,300 0.32 8.15 1.45 22.28
Lalor – Gold3 Indicated 1,750,000 0.34 0.40 5.18 30.61
Inferred 4,124,000 0.90 0.31 5.02 27.61
Total Snow Lake Measured & Indicated 3,850,000 0.42 3.09 3.28 26.24
Inferred 4,669,300 0.83 1.23 4.60 26.99
Total Manitoba Measured & Indicated 4,586,000 0.51 3.16 3.04 28.76
Inferred 5,430,300 0.89 1.59 4.18 27.14
1. Includes 777 North
2. Stated at 100%, Hudbay holds a 70% joint venture interest in the Reed mine.
3. Includes gold zone and copper-gold zone resources.
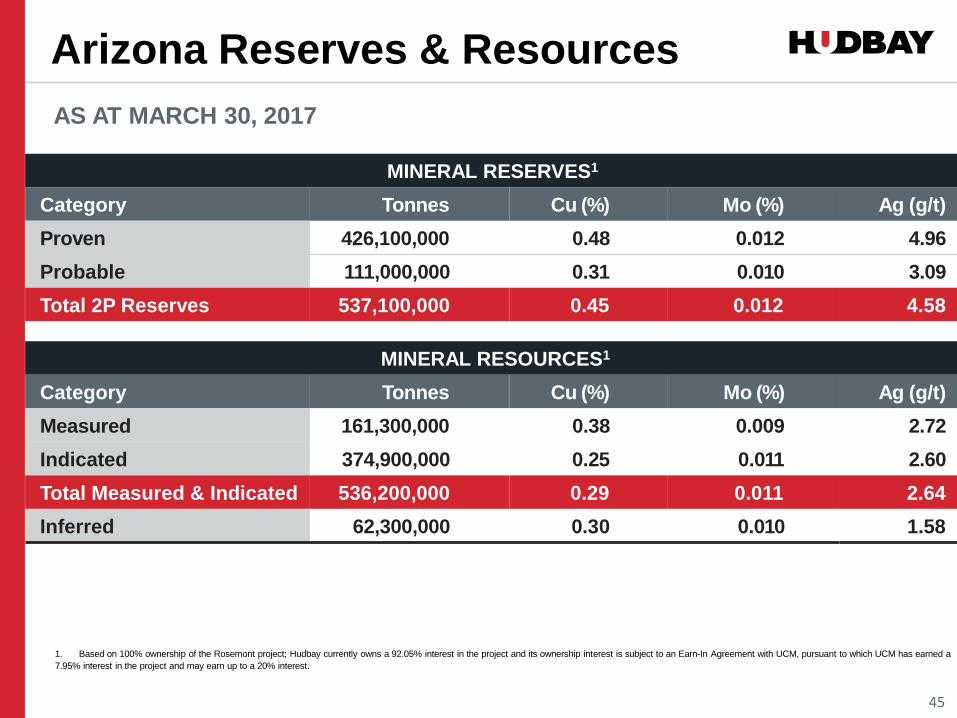
Arizona Reserves & Resources
45
MINERAL RESERVES1
Category Tonnes Cu (%) Mo (%) Ag (g/t)
Proven 426,100,000 0.48 0.012 4.96
Probable 111,000,000 0.31 0.010 3.09
Total 2P Reserves 537,100,000 0.45 0.012 4.58
MINERAL RESOURCES1
Category Tonnes Cu (%) Mo (%) Ag (g/t)
Measured 161,300,000 0.38 0.009 2.72
Indicated 374,900,000 0.25 0.011 2.60
Total Measured & Indicated 536,200,000 0.29 0.011 2.64
Inferred 62,300,000 0.30 0.010 1.58
AS AT MARCH 30, 2017
1. Based on 100% ownership of the Rosemont project; Hudbay currently owns a 92.05% interest in the project and its ownership interest is subject to an Earn-In Agreement with UCM, pursuant to which UCM has earned a
7.95% interest in the project and may earn up to a 20% interest.

Additional Information The reserve and resource estimates included in this presentation were prepared in accordance with National Instrument 43-101 – Standards of Disclosure for Mineral Projects (“NI 43-101”) and the Canadian Institute of Mining, Metallurgy and Petroleum Standards on Mineral Resources and Reserves: Definitions and Guidelines.
46
MANITOBA
• Mineral resources are exclusive of and additional to stated mineral reserves. Mineral resources that are not mineral reserves do not have demonstrated economic viability.
• A zinc price of $1.24 per pound (includes premium), copper price of $2.67 per pound, a gold price of $1,300 per ounce and silver price of $18.00 per ounce using an exchange rate of 1.25 C$/US$ was used to estimate 777 mineral reserves and mineral resources.
• A zinc price of $1.22 per pound (includes premium), copper price of $2.50 per pound, gold price of $1,300 per ounce and silver price of $18.00 per ounce using an exchange rate of 1.28 C$/US$ was used to estimate mineral reserves at Reed. A zinc price of $1.24 per pound (includes premium), copper price of $2.67 per pound, gold price of $1,300 per ounce and silver price of $18.00 per ounce using an exchange rate of 1.25 C$/US$ was used to estimate mineral resources at Reed.
• Lalor mineral reserves are estimated at an NSR cut-off of $88 per tonne for longhole open stope mining method and $111 per tonne for cut and fill mining method. A zinc price of $1.07 per pound (includes premium), copper price of $3.00 per pound, a gold price of $1,260 per ounce and silver price of $18.00 per ounce. An exchange rate of 1.10 C$/US$ was used to estimate mineral reserves.
• Lalor base metal mineral resources: A zinc metal price of $1.19 per pound, a copper price of $2.67 per pound, gold price of $1,300 per ounce and a siliver price of $18.00 per ounce were used to calculate a zinc equivalence (Zn Eq) cut-off of 4.1%, where Zn Eq = Zn% + (1.98 x Cu%) + (1.11 x Au g/t) + (0.01 x Ag g/t) – (0.01 x Pb%). An exchange rate of 1.25 C$/US$ was used to estimate mineral resources. The Zn Eq considers the ratio of milling recovery, payability and value of metals after application of downstream processing costs. The Zn Eq cut-off of 4.1% covers administration overhead, mining removal, milling and general and administration costs.
• Lalor gold mineral resources: A gold metal price of $1.300 per ounce, a copper price of $2.67 per pound and a silver price of $18.00 per ounce were used to calculate a gold equivalence (Au Eq) cut-off of 2.4 g/t Au Eq, where Au Eq = Au g/t + (1.34 x Cu %) + (0.01 x Ag g/t). An exchange rate of 1.25 C$/US$ was used to estimate mineral resources. The Au Eq considers the ratio of milling recovery, payability and value of metals after application of downstream processing costs. Au Eq cut-off of 2.4 g/t covers administration overhead, mining removal, milling and general and administration costs.
• For additional details relating to the estimates of mineral reserves and resources at the 777 mine, including data verification and quality assurance/ quality control processes refer to the “Technical Report 777 Mine, Flin Flon, Manitoba, Canada” dated October 15, 2012 on SEDAR.
• For additional details relating to the estimates of mineral reserves and resources at the Lalor mine, including data verification and quality assurance/ quality control processes refer to the “Technical Report, Lalor Mine” dated March 30, 2017 on SEDAR.
• For additional details relating to the estimates of mineral reserves and resources at the Reed mine, including data verification and quality assurance/ quality control processes refer to the “Pre-Feasibility Study Technical Report on the Reed Copper Deposit, Central Manitoba, Canada” as filed on SEDAR by VMS Ventures Inc. on May 14, 2012.
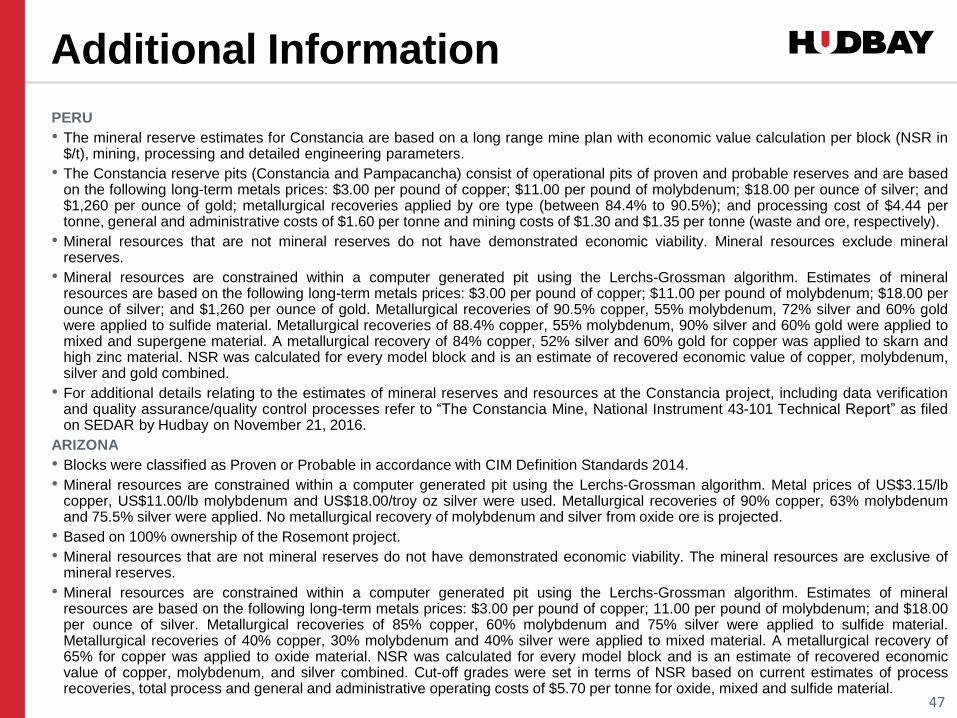
Additional Information
47
PERU
• The mineral reserve estimates for Constancia are based on a long range mine plan with economic value calculation per block (NSR in $/t), mining, processing and detailed engineering parameters.
• The Constancia reserve pits (Constancia and Pampacancha) consist of operational pits of proven and probable reserves and are based on the following long-term metals prices: $3.00 per pound of copper; $11.00 per pound of molybdenum; $18.00 per ounce of silver; and $1,260 per ounce of gold; metallurgical recoveries applied by ore type (between 84.4% to 90.5%); and processing cost of $4.44 per tonne, general and administrative costs of $1.60 per tonne and mining costs of $1.30 and $1.35 per tonne (waste and ore, respectively).
• Mineral resources that are not mineral reserves do not have demonstrated economic viability. Mineral resources exclude mineral reserves.
• Mineral resources are constrained within a computer generated pit using the Lerchs-Grossman algorithm. Estimates of mineral resources are based on the following long-term metals prices: $3.00 per pound of copper; $11.00 per pound of molybdenum; $18.00 per ounce of silver; and $1,260 per ounce of gold. Metallurgical recoveries of 90.5% copper, 55% molybdenum, 72% silver and 60% gold were applied to sulfide material. Metallurgical recoveries of 88.4% copper, 55% molybdenum, 90% silver and 60% gold were applied to mixed and supergene material. A metallurgical recovery of 84% copper, 52% silver and 60% gold for copper was applied to skarn and high zinc material. NSR was calculated for every model block and is an estimate of recovered economic value of copper, molybdenum, silver and gold combined.
• For additional details relating to the estimates of mineral reserves and resources at the Constancia project, including data verification and quality assurance/quality control processes refer to “The Constancia Mine, National Instrument 43-101 Technical Report” as filed on SEDAR by Hudbay on November 21, 2016.
ARIZONA
• Blocks were classified as Proven or Probable in accordance with CIM Definition Standards 2014.
• Mineral resources are constrained within a computer generated pit using the Lerchs-Grossman algorithm. Metal prices of US$3.15/lb copper, US$11.00/lb molybdenum and US$18.00/troy oz silver were used. Metallurgical recoveries of 90% copper, 63% molybdenum and 75.5% silver were applied. No metallurgical recovery of molybdenum and silver from oxide ore is projected.
• Based on 100% ownership of the Rosemont project.
• Mineral resources that are not mineral reserves do not have demonstrated economic viability. The mineral resources are exclusive of mineral reserves.
• Mineral resources are constrained within a computer generated pit using the Lerchs-Grossman algorithm. Estimates of mineral resources are based on the following long-term metals prices: $3.00 per pound of copper; 11.00 per pound of molybdenum; and $18.00 per ounce of silver. Metallurgical recoveries of 85% copper, 60% molybdenum and 75% silver were applied to sulfide material. Metallurgical recoveries of 40% copper, 30% molybdenum and 40% silver were applied to mixed material. A metallurgical recovery of 65% for copper was applied to oxide material. NSR was calculated for every model block and is an estimate of recovered economic value of copper, molybdenum, and silver combined. Cut-off grades were set in terms of NSR based on current estimates of process recoveries, total process and general and administrative operating costs of $5.70 per tonne for oxide, mixed and sulfide material.

Additional Cautionary Information
The technical and scientific information in this presentation related to the Constancia mine and the Rosemont project has been
approved by Cashel Meagher, P. Geo, Hudbay’s Senior Vice President and Chief Operating Officer. The technical and scientific
information related to the Manitoba sites and projects contained in this presentation has been approved by Robert Carter, P. Eng,
Hudbay’s General Manager Mining Operations, Manitoba Business Unit. Messrs. Meagher and Carter are qualified persons pursuant to
NI 43-101. For a description of the key assumptions, parameters and methods used to estimate mineral reserves and resources, as
well as data verification procedures and a general discussion of the extent to which the estimates of scientific and technical information
may be affected by any known environmental, permitting, legal title, taxation, sociopolitical, marketing or other relevant factors, please
see the Technical Reports for the company’s material properties as filed by Hudbay on SEDAR at www.sedar.com.
This presentation has been prepared in accordance with the requirements of the securities laws in effect in Canada, which may differ
materially from the requirements of United States securities laws applicable to U.S. issuers. Information concerning Hudbay’s mineral
properties has been prepared in accordance with the requirements of Canadian securities laws, which differ in material respects from
the requirements of the Securities and Exchange Commission (the “SEC”) set forth in Industry Guide 7. Under the SEC's Industry
Guide 7, mineralization may not be classified as a “reserve” unless the determination has been made that the mineralization could be
economically and legally produced or extracted at the time of the reserve determination, and the SEC does not recognize the reporting
of mineral deposits which do not meet the SEC Industry Guide 7 definition of “Reserve”. In accordance with National Instrument 43-101
– Standards of Disclosure for Mineral Projects (“NI 43-101”) of the Canadian Securities Administrators, the terms “mineral reserve”,
“proven mineral reserve”, “probable mineral reserve”, “mineral resource”, “measured mineral resource”, “indicated mineral resource”
and “inferred mineral resource” are defined in the Canadian Institute of Mining, Metallurgy and Petroleum (the “CIM”) Definition
Standards for Mineral Resources and Mineral Reserves adopted by the CIM Council on May 10, 2014. While the terms “mineral
resource”, “measured mineral resource”, “indicated mineral resource” and “inferred mineral resource” are recognized and required by
NI 43-101, the SEC does not recognize them. You are cautioned that, except for that portion of mineral resources classified as mineral
reserves, mineral resources do not have demonstrated economic value. Inferred mineral resources have a high degree of uncertainty
as to their existence and as to whether they can be economically or legally mined. It cannot be assumed that all or any part of an
inferred mineral resource will ever be upgraded to a higher category. Therefore, you are cautioned not to assume that all or any part of
an inferred mineral resource exists, that it can be economically or legally mined, or that it will ever be upgraded to a higher category.
Likewise, you are cautioned not to assume that all or any part of measured or indicated mineral resources will ever be upgraded into
mineral reserves.
48
FOR MORE INFORMATION CONTACT:
Carla Nawrocki, Director, Investor Relations
416.362.7362 | [email protected]