Embed Size (px)
Citation preview

1
Investor Presentation
September 2017

2
Safe Harbor
Caution Concerning Forward-Looking Statements Various remarks that the Company makes contain forward-looking statements regarding acquisitions, acquisition integration, growth, growth priorities or plans, new products and related investment, revenues, adjusted OIBDA, churn, seats, lines or accounts, average revenue per user, cost of telephony services, the Company’s share repurchase plan, new products and related investment, capital expenditures, and other statements that are not historical facts or information constitute forward-looking statements for purposes of the safe harbor provisions under The Private Securities Litigation Reform Act of 1995. The forward-looking statements are based on information available at the time the statements are made and/or management's belief as of that time with respect to future events and involve risks and uncertainties that could cause actual results and outcomes to be materially different. Important factors that could cause such differences include but are not limited to: the competition we face; the expansion of competition in the cloud communications market; our ability to adapt to rapid changes in the cloud communications market; the nascent state of the cloud communications for business market; our ability to retain customers and attract new customers; the risk associated with developing and maintaining effective internal sales teams and effective distribution channels; risks related to the acquisition or integration of businesses we have acquired; security breaches and other compromises of information security; risks associated with sales of our services to medium-sized and enterprise customers; our reliance on third party hardware and software; our dependence on third party facilities, equipment, systems and services; system disruptions or flaws in our technology and systems; our ability to scale our business and grow efficiently; our dependence on third party vendors; the impact of fluctuations in economic conditions, particularly on our small and medium business customers; our ability to comply with data privacy and related regulatory matters; our ability to obtain or maintain relevant intellectual property licenses; failure to protect our trademarks and internally developed software; fraudulent use of our name or services; intellectual property and other litigation that have been and may be brought against us; reliance on third parties for our 911 services; uncertainties relating to regulation of VoIP services; risks associated with legislative, regulatory or judicial actions regarding our CPaaS products; the impact of governmental export controls or sanctions on our CPaaS products; our ability to establish and expand strategic alliances; risks associated with operating abroad; risks associated with the taxation of our business; risks associated with a material weakness in our internal controls; our dependence upon key personnel; governmental regulation and taxes in our international operations; liability under anti-corruption laws; our dependence on our customers' existing broadband connections; differences between our services and traditional telephone service; restrictions in our debt agreements that may limit our operating flexibility; foreign currency exchange risk; the market for our stock; our ability to obtain additional financing if required; any reinstatement of holdbacks by our credit card processors; our history of net losses and ability to achieve consistent profitability in the future; and other factors that are set forth in the “Risk Factors” in our Annual Report on Form 10-K for the year ended December 31, 2016, in the Company’s Quarterly Reports on Form 10-Q and Current Reports on Form 8-K. While the Company may elect to update forward-looking statements at some point in the future, the Company specifically disclaims any obligation to do so, and therefore, you should not rely on these forward-looking statements as representing the Company's views as of any date subsequent to today. Non-GAAP Financial Measures This presentation contains non-GAAP financial measures (including adjusted operating income before depreciation and amortization (“adjusted OIBDA”), adjusted OIBDA less capex, adjusted net income, net debt (cash),free cash flow, organic growth and adjusted revenues), as defined in Regulation G adopted by the SEC. The Company provides a reconciliation of these non-GAAP financial measures to the most directly comparable financial measure at the end of the presentation and in the Company's quarterly earnings releases, which can be found on the Vonage Investor Relations website at http://ir.vonage.com.

3
Industry Leader in Business Cloud Communications
Proven growth strategy via organic growth and M&A built on:
Broad portfolio of Cloud Communications solutions
Powerful, iconic brand provides competitive advantage
Large scale network terminating billions of minutes and messages
Strong cash flows and balance sheet driven by Consumer
$8
$94
$219
$376
~$500
2013 2014 2015 2016 2017E Guidance
Vonage Business Revenues ($MM)

4
UCaaS and CPaaS are a Powerful Combination, Giving Vonage the Right Set of Assets to Win in Cloud Communications
UCaaS | SaaS Delivery CPaaS | PaaS Delivery
Prebuilt PBX and Contact Center Solution
Integration with Business Apps
Embedded real-time communications
Programmable into Apps and software
Underlying Communications Platform
Voice SMS / Chat Conferencing Recording Video Analytics Call Controls
Common Network
MPLS QoS SmartWAN QoS Bring-your-own-broadband (OTT)

5
$41B
2021
$8B CPaaS
Vonage is a Leader Across the Large and Rapidly Growing Cloud Communications Market, Which is Comprised of Both UCaaS and CPaaS Delivery Models
Source: Vonage, IDC (2017)
$21B
2017
$1B CPaaS
$20B UCaaS $33B
UCaaS By 2021 the Cloud Communications
TAM is expected to double

6
Quality Network Foundation MPLS QoS SmartWAN QoS
Flexible Network Options Bring-Your- Own-Broadband SmartWAN QoS
UCaaS Growth Driven by Two Purpose-Built Solutions
Enterprise
SMB
Prem
ier
Esse
ntia
ls
Cloud-based PBX Mobile SaaS Integration Collaboration
Unified Communications
Collaboration Contact Center
Video Analytics Administration SIP Trunking
SaaS Integration

7
Representative Customers
Vonage’s UCaaS Product Set is Purpose-Built for Enterprise Customers
1000+
250
50 Under 50 Seats
Strong Mid-market and Enterprise Presence Recent Mid-market and Enterprise Activity
Fortune
500 Financial Services Provider
Fortune
500 Real Estate Brokerage
40% of MRR Up Market
- 999
Seats
-249
MRR as a% of Total MRR
Seats
Seats
Strong UCaaS Performance SmartWAN and MPLS
CPaaS Advanced Contact Center
Won customer due to:
UCaaS SmartWAN Wireless Backup
Won 20,000 seat customer due to:
UCaaS SmartWAN and MPLS Integration
Significant expansion under 5 year term due to:

8
Nexmo, the Vonage API Platform, Producing Strong Results
1. Excludes unqualified developer signups 2. Growth is organic. 2Q’16 pro forma to reflect full quarter of ownership and net-to-gross revenue reporting adjustment
155 176 207
249 309
2Q'16 3Q'16 4Q'16 1Q'17 2Q'17
(in 0
00's
)
Registered Developers1
$24
$35
2Q'16 2Q'17
($ in
mm
's)
CPaaS Revenues2
44% YoY
Customers & Partners
Record Customer Adds in Q2’17 n Under Full Quarter Vonage Ownership

9
Nexmo Enables Developers to Easily Embed Communications to Drive Better Business Outcomes
VAPI offers a diverse range of call controls that enable innovative voice use cases Enterprise Grade, Global Reach • Backed by the quality, strength and reliability of the
Vonage network • Largest global reach with numbers in 85 countries
Lower Cost • Pay-per-use model • Per second billing

10
Integrating the Business Communications Value Chain Enhances Vonage’s Value Proposition
Voice Video
QoS Contact Center
Voice Call Control
SMS Chat
Workplace Tools for CRM & Productivity
UCaaS for Employees
CPaaS for Customers

11
Vonage Brand Awareness is Significantly Higher Than Other Pure-Play UCaaS Market Participants
5% 8%
56%
More than $2 billion invested to build brand
Extending the Vonage brand to business services has accelerated growth
Aided Brand Awareness Among Non-Customers
Source: Vonage small business brand tracking study, Fourth Quarter 2016

12
Vonage has the Most Robust Omni-channel Distribution Platform in Cloud Communications
Executing on NFL City Strategy in Field Sales • Opened 9 new markets year-to-date • Expect to have field sales presence in 21
markets by end of 2017
UCaaS Salesforce Will Begin Selling CPaaS Products in Q3 • Significant force multiplier to our CPaaS
sales teams
Accelerating CPaaS Salesforce to Capitalize on the Growing Enterprise Adoption • Added sales leadership in APAC
and EMEA • Expect to have 3 sales offices in
Shenzhen, Beijing and Shanghai by end of 2017
Inside Sales Channel Sales Field Sales Enterprise Sales Developers

13
UCaaS VoIP CPaaS
Vonage Cloud Communications Products Utilize the Same Network and Termination Relationships
1. As of June 30, 2017
20 Billion Minutes and
Messages Per Year
Products
Quality
Cost Termination Network
Peering Connections Volume Pricing Owned Phone
Numbers
Data Centers Points of Presence Diverse Redundant Backbone
Consumer Business
Global Carrier Presence
Common Network Infrastructure
1.6M Subscriber Lines1
683K Seats1
309K Developers1

VONAGE, PROPRIETARY & CONFIDENTIAL
Financial Overview and Analysis

15
1. GAAP Vonage Business Revenues
Cloud Communications Growth Strategy
Q2 Year-Over-Year Business Revenues Growth1
$23
$49
$86
$124
Q2'14 Q2'15 Q2'16 Q2'17
Organic: - Increase salesforce and geographic markets
- Expand Enterprise presence
- Accelerate Product Innovation
Inorganic: - Disciplined Acquirer
- Cost of capital advantage
- Scaled platform to integrate future acquisitions

16
Optimization of Consumer is Driving Strong Cash Flows
• Second quarter consolidated Adjusted OIBDA of $41 million
• Expect Consumer to generate more than $600 million of after-tax free cash flow through 2021
Vonage Annual Adjusted OIBDA
$110M
2013
$124M $144M
$160M
2014 2015 2016
2.5% 2.6%
2.3% 2.2%
~$165M
2017E Guidance
Customer Churn
2.0% 1H’17

17
$990M
LTM Adjusted OIBDA - CAPEX
NOL
U.S. Patents
LTM Consolidated Revenues
$156M $124M $586M
160+
LTM Adjusted OIBDA Financial Strength and
Complementary Assets are a Strategic and Competitive Advantage

18
Capital Allocation Strategy
Invest to grow Vonage Business organically
• Invest in new markets, salesforce and product expansion
Acquire selectively to grow Vonage Business
• Accretively acquire customers, sales force, technologies, geographic footprint and / or product
Maintain strategic and financial flexibility
• Operate Consumer for cash flow and profitable subscriber base
• Manage leverage
Return capital to shareholders • Opportunistically execute share repurchase
through $100 million authorization

19
Proven and Experienced Leadership Team
David Pearson Chief Financial Officer Since 2013
Omar Javaid Chief Product Officer Since 2015
Ted Gilvar Chief Marketing Officer Since 2015
Sue Quackenbush Chief Human Resources Officer Since 2015
Vinod Lala Chief Strategy Officer Since 2014
Alan Masarek Chief Executive Officer Since 2014
Randy Rutherford Chief Legal Officer Since 2016
Johan Hybinette Chief Information Security Officer Since 2017
Kenny Wyatt Chief Revenue Officer Since 2017
Graham McGonigal SVP of Networks Since 2012

20
THANK YOU
20

VONAGE, PROPRIETARY & CONFIDENTIAL
Second Quarter Financial Results

22
Recent Highlights
• Grew total consolidated revenues to $252 million, an 8% GAAP increase, and the 9th consecutive quarter of year-over-year growth - Grew Vonage Business organic revenues 23% year-over-year
- Grew Nexmo organic revenues 44% year-over-year
• Accelerated traction in Mid-Market and Enterprise segments - Closed four UCaaS deals with a total contract value greater than $30 million
- Launched several product enhancements leading to Mid-Market and Enterprise wins
• Invested in Omni-channel distribution platform to drive growth - Expanded field sales presence to 9 new markets year-to-date
- Hired CPaaS sales leadership in APAC and DHAC • Optimizing the value of Consumer Services
- Achieved best-ever reported Customer churn of 1.9%
- Delivered the lowest sequential revenue decline in 13 quarters

23
Consolidated Revenues
• Consolidated revenues up 8% GAAP from the prior year due to: - UCaaS organic growth
- Addition of Nexmo and subsequent organic growth and reporting adjustment
- Offset by Consumer decline
• Business revenues represented 49% of total revenues
$234
$243
2Q'16 1Q'17 2Q'17
$252
($ in millions)
8% GAAP YoY

24
Segment Revenues
1. Growth rate is organic. We define organic growth as the increase in Business revenues after giving pro forma effect for the acquisition of Nexmo, the change in accounting treatment with respect to certain CPaaS revenues being recognized on a gross rather than net basis and the exclusion of one-time items.
• Vonage Business revenues up 23% organically from the prior year – UCaaS organic revenues growth
– Addition of Nexmo and subsequent organic growth
2Q'16 1Q'17 2Q'17
Service Product & USF
Business
Consumer
• Consumer revenues down 13% year-over-year – Lowest sequential dollar decline in more
than 3 years
– Lowest ever reported Customer churn
$124 $112 $86
($ in millions)
23% Organic YoY1
2Q'16 1Q'17 2Q'17
Service Product & USF
$128 $132 $148
44% GAAP YoY

25
Consumer: Record Churn Driving Lowest Sequential Revenue Decline in 13 Quarters
$5.4
$6.0
$4.2
$8.3
$5.1
$6.5
$7.1
$6.2
$5.0
$5.9 $5.8
$4.7
$3.4
2.6% 2.6%
2.4% 2.4%
2.2%
2.3%
2.2% 2.2%
2.1% 2.2% 2.2% 2.2%
1.9%
$2.0
$4.0
$6.0
$8.0
2Q'14 3Q'14 4Q'14 1Q'15 2Q'15 3Q'15 4Q'15 1Q'16 2Q'16 3Q'16 4Q'16 1Q'17 2Q'17
Churn
Sequential dollar decline ($ in millions)

26
Adjusted OIBDA1
1. This is a non-GAAP financial measure. Please refer to the end of the presentation for a reconciliation to GAAP income from operations.
($ in millions)
Income From Operations
Adjusted OIBDA1
• Operating Income up from the prior year due to: – Lower Consumer marketing spend
$5 $5 $7
2Q'16 1Q'17 2Q'17
$40 $37
$41
2Q'16 1Q'17 2Q'17
• Operating Income down from the prior year due to: – Lower Consumer marketing spend
– Partially offset by higher G&A

27
Cash Flow, Stock Buyback and Balance Sheet
• Cash1: $29 million • Total debt: $317 million • Net debt2: $290 million (Gross Debt less Unrestricted Cash and Marketable Securities)
Net debt/Adjusted OIBDA = 2.1x
Cash Flow ($ in millions) Q2 2017 Cash from operations $16
Capital expenditures and software ($9) Free cash flow2 $7
Significant strategic and financial flexibility
Stock Repurchase Program • Year-to-date, repurchased 1.6 million shares for $10 million at an average price of $5.95 • Repurchased 57 million shares for $191 million since August 2012
28
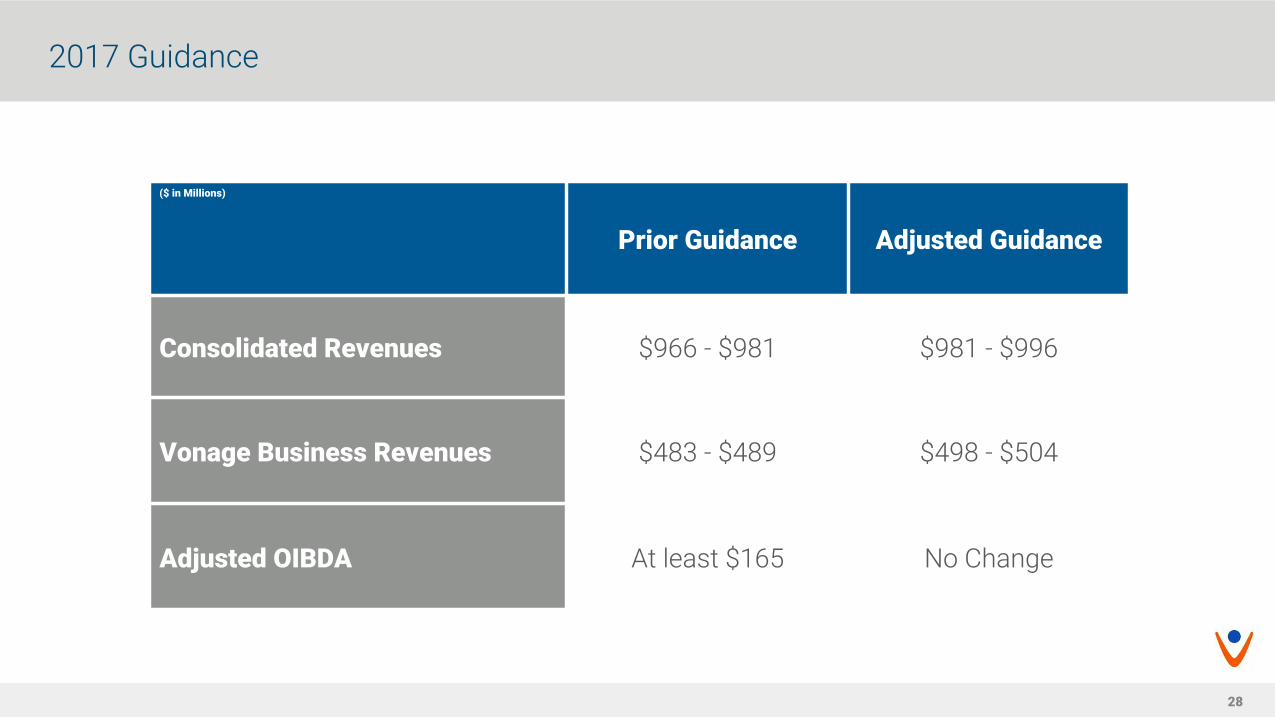
2017 Guidance
($ in Millions)
Prior Guidance Adjusted Guidance
Consolidated Revenues $966 - $981 $981 - $996
Vonage Business Revenues $483 - $489 $498 - $504
Adjusted OIBDA At least $165 No Change

29
Business Revenues Reconciliation
($ in millions) Q2-16 Q3-16 Q4-16 Q1-17 Q2-17
GAAP total UCaaS revenues $78.0 $82.4 $84.0 $85.6 $88.5 Bad debt policy reclassification (0.4) - - - - Early termination fee (0.5) Accounts receivable write-down (0.3) 0.3 0.3
Total UCaaS revenues incl. one-time items (Non-GAAP) $77.1 $82.1 $84.3 $85.9 $88.5
Hosted Infrastructure Business1 (1.6) (1.6) (1.7) (1.6) (1.1)
Adjusted total UCaaS Revenues (non-GAAP) $75.5 $80.5 $82.6 $84.3 $87.4 Product 13.3 13.6 12.7 13.4 13.4 USF 5.4 6.0 6.2 6.2 6.5 Adjusted total UCaaS Service Revenues (non-GAAP) $56.9 $60.9 $63.8 $64.7 $67.6
GAAP total CPaaS revenue $7.7 $23.9 $26.5 $26.2 $35.2 Nexmo pre-acquisition revenues $14.2 Pro forma CPaaS revenues 21.9 23.9 26.5 26.2 35.2
Net-to-gross revenue reporting adjustment 2.5 2.5 2.8 3.4
Adjusted total CPaaS revenues (non-GAAP) $24.4 $26.4 $29.4 $29.6 $35.2
GAAP Vonage Business revenues $85.7 $106.3 $110.5 $111.8 $123.7
1. Hosted Infrastructure Business sold on June 1, 2017- revenues only reported through the date of sale

30
Non-GAAP Reconciliation
VONAGE HOLDINGS CORP. RECONCILIATION OF GAAP INCOME FROM OPERATIONS
TO ADJUSTED OIBDA AND TO ADJUSTED OIBDA MINUS CAPEX (Dollars in thousands)
(unaudited)
Three Months Ended Six Months Ended
June 30, March 31, June 30, June 30,
2017 2017 2016 2017 2016
Income from operations $ 6,659 $ 5,124 $ 5,387 $ 11,783 $ 23,911 Depreciation and amortization 18,394 17,947 18,218 36,341 35,197 Share-based expense 7,412 7,064 7,962 14,476 14,265 Acquisition related transaction and integration costs 18 139 5,057 157 5,150 Organizational transformation 4,000 — — 4,000 — Acquisition related consideration accounted for as compensation 4,310 6,763 3,312 11,073 3,312
Adjusted OIBDA 40,793 37,037 39,936 $ 77,830 $ 81,835 Less:
Capital expenditures (5,294 ) (3,701 ) (7,053 ) $ (8,995 ) $ (15,948 ) Acquisition and development of software assets (3,504 ) (3,380 ) (3,343 ) $ (6,884 ) $ (5,655 )
Adjusted OIBDA Minus Capex $ 31,995 $ 29,956 $ 29,540 $ 61,951 $ 60,232

31
RECONCILIATION OF GAAP NET INCOME ATTRIBUTABLE TO VONAGE TO NET INCOME ATTRIBUTABLE TO VONAGE EXCLUDING ADJUSTMENTS
(Dollars in thousands, except per share amounts) (unaudited)
Three Months Ended Six Months Ended
June 30, March 31, June 30, June 30,
2017 2017 2016 2017 2016
(revised) (1) (revised) (1) Net income $ 4,825 $ 5,913 $ 218 $ 10,738 $ 8,149
Amortization of acquisition - related intangibles 9,069 8,999 8,274 18,068 15,236 Acquisition related transaction and integration costs 18 139 5,057 157 5,150 Acquisition related consideration accounted for as compensation 4,310 6,763 3,312 11,073 3,312 Organizational transformation 4,000 — — 4,000 — Tax effect on adjusting items (7,188 ) (6,569 ) (6,876 ) (13,757 ) (9,791 )
Adjusted net income $ 15,034 $ 15,245 $ 9,985 $ 30,279 $ 22,056 Earnings per common share:
Basic $ 0.02 $ 0.03 $ — $ 0.05 $ 0.04 Diluted $ 0.02 $ 0.02 $ — $ 0.04 $ 0.04
Weighted-average common shares outstanding: Basic 223,492 220,371 213,558 221,930 213,800 Diluted 239,938 239,486 222,700 239,923 223,978
Earnings per common share, excluding adjustments: Basic $ 0.07 $ 0.07 $ 0.05 $ 0.14 $ 0.10 Diluted $ 0.06 $ 0.06 $ 0.04 $ 0.13 $ 0.10
Weighted-average common shares outstanding: Basic 223,492 220,371 213,558 221,930 213,800 Diluted 239,938 239,486 222,700 239,923 223,978
(1) Revised due to the correction of prior period financial statements.
Non-GAAP Reconciliation

32
VONAGE HOLDINGS CORP. FREE CASH FLOW (Dollars in thousands)
(unaudited)
Three Months Ended Six Months Ended
June 30, March 31, June 30, June 30,
2017 2017 2016 2017 2016
(Revised) (1) (Revised) (1) Net cash provided by operating activities $ 15,432 $ 17,261 $ 25,059 $ 32,693 $ 42,527 Less:
Capital expenditures (5,294 ) (3,701 ) (7,053 ) (8,995 ) (15,948 ) Acquisition and development of software assets (3,504 ) (3,380 ) (3,343 ) (6,884 ) (5,655 )
Free cash flow $ 6,634 $ 10,180 $ 14,663 $ 16,814 $ 20,924 (1) Revised due to the adoption of new Accounting Standard Updates and the correction of prior period financial statements.
Non-GAAP Reconciliation

33
RECONCILIATION OF NOTES PAYABLE, INDEBTEDNESS UNDER REVOLVING CREDIT FACILITY, AND CAPITAL LEASES TO NET DEBT
(Dollars in thousands) (unaudited)
June 30, December 31,
2017 2016
Current maturities of capital lease obligations $ 1,021 $ 3,288 Current portion of notes payable 18,750 18,750 Notes payable and indebtedness under revolving credit facility, net of current maturities and debt related costs 295,953 300,124 Unamortized debt related cost 859 1,064 Capital lease obligations, net of current maturities 46 140 Gross debt 316,629 323,366 Less:
Unrestricted cash and marketable securities 26,825 29,679 Net debt $ 289,804 $ 293,687
Non-GAAP Reconciliation