Embed Size (px)
Citation preview

Investor PresentationSeptember/October 2019
https://www.livewest.co.uk/about-us/for-investors

DisclaimerThe information contained in this investor presentation ((including the presentation slides and any relates speeches made or to be made by the management of LiveWest Homes Limited any questions and any answers thereto or any relatedverbal or written communications in respect thereof , the “Presentation”) has been prepared to assist interested parties in making their own evaluation of LiveWest. This presentation and a proposed offering of notes of LiveWest (the “Notes”) isbelieved to be in all material respects accurate, although it has not been independently verified by LiveWest and does not purport to be all-inclusive. This Presentation and its contents are strictly confidential, are intended for use by the recipientfor information purposes only and may not be reproduced in any form or further distributed to any other person or published, in whole or in part, for any purpose. Failure to comply with this restriction may constitute a violation of applicablesecurities laws. By reading this Presentation, you agree to be bound by the following limitations. Neither LiveWest nor any of their representative directors, board members, officers, managers, agents, employees or advisers makes anyrepresentations or warranty (express or implied) or accepts any responsibility as to or in relation to the accuracy or completeness of the information in this Presentation (and no one is authorised to do so on behalf of any of them) and (save in thecase of fraud) any liability in respect of such information or any inaccuracy therein or omission therefrom is hereby expressly disclaimed, in particular, if for reasons of commercial confidentiality information on certain matters that might be ofrelevance to a prospective purchaser has not been included in this Presentation.
No representation or warranty is given as to the achievement or reasonableness of any projections, estimates, prospects or returns contained in this Presentation or any other information. Neither LiveWest nor any other person connected tothem shall be liable (whether in negligence or otherwise) for any direct, indirect or consequential loss or damage suffered by any person as a result of relying on any statement in or omission from this Presentation or any other information andany such liability is expressly disclaimed. This Presentation includes certain statements, estimates and projections prepared and provided by the management of LiveWest with respect to the anticipated future performance of the group. Suchstatements, estimates and projections reflect various assumptions by LiveWest‘s management concerning anticipated results and have been included solely for illustrative purposes. No representations are made as to the accuracy of suchstatements, estimates or projections or with respect to any other materials herein. Actual results may vary from the projected results contained herein.
The Notes have not been and will not be registered under the U.S. Securities Act of 1933, as amended (the "Securities Act"), or the laws of any state or other jurisdiction of the United States, and may not be offered or sold within the UnitedStates, or for the account or benefit of, U.S. Persons (as such terms are defined in Regulation S under the Securities Act), absent registration or an exemption from, or in a transaction not subject to, the registration requirements of the SecuritiesAct and applicable state laws. This Presentation is made to and is directed only at persons who are (a) "investment professionals" as defined under Article 19 of the Financial Services and Markets Act 2000 (Financial Promotion) Order 2005, asamended (the "Order") or (b) high net worth entities falling within article 49(2)(a) to (d) of the Order (all such persons together being referred to as "relevant persons"). Any person who is not a relevant person should not act or rely on thisPresentation or any of its contents. Any investment or investment activity to which this Presentation relates is available only to and will only be engaged in with such relevant persons.
The Notes are not intended to be offered, sold or otherwise made available to and should not be offered, sold or otherwise made available to any retail investor in the European Economic Area (EEA). For these purposes, a retail investor means aperson who is one (or more) of: (i) a retail client as defined in point (11) of Article 4(1) of Directive 2014/65/EU (as amended, "MiFID II") or (ii) a customer within the meaning of Directive 2002/92/EC ("IMD"), where that customer would notqualify as a professional client as defined in point (10) of Article 4(1) of MiFID II. Consequently no key information document required by Regulation (EU) No 1286/2014 (the "PRIIPs Regulation") for offering or selling the securities described hereinor otherwise making them available to retail investors in the EEA has been or will be prepared and therefore offering or selling the Securities or otherwise making them available to any retail investor in the EEA may be unlawful under the PRIIPSRegulation.
MiFID II product governance / Professional investors and ECPs only target market – Solely for the purposes of each manufacturer's product approval process, the target market assessment in respect of the Notes has led to the conclusion that: (i)the target market of the Notes is eligible counterparties and professional clients only, each as defined in MiFID II; and (ii) all channels for the distribution of the Notes to eligible counterparties and professional clients are appropriate. Any personsubsequently offering, selling or recommending the Notes (a distributor) should take into consideration the manufacturers' target market assessment; however, a distributor subject to MiFID II is responsible for undertaking its own target marketassessment in respect of the Notes (by either adopting or refining the manufacturers' target market assessment) and determining appropriate distribution channels.
The information contained in this investor presentation ((including the presentation slides and any relates speeches made or to be made by the management of LiveWest Homes Limited any questions and any answers thereto or any relatedverbal or written communications in respect thereof , the “Presentation”) has been prepared to assist interested parties in making their own evaluation of LiveWest. This presentation and a proposed offering of notes of LiveWest (the “Notes”) isbelieved to be in all material respects accurate, although it has not been independently verified by LiveWest and does not purport to be all-inclusive. This Presentation and its contents are strictly confidential, are intended for use by the recipientfor information purposes only and may not be reproduced in any form or further distributed to any other person or published, in whole or in part, for any purpose. Failure to comply with this restriction may constitute a violation of applicablesecurities laws. By reading this Presentation, you agree to be bound by the following limitations. Neither LiveWest nor any of their representative directors, board members, officers, managers, agents, employees or advisers makes anyrepresentations or warranty (express or implied) or accepts any responsibility as to or in relation to the accuracy or completeness of the information in this Presentation (and no one is authorised to do so on behalf of any of them) and (save in thecase of fraud) any liability in respect of such information or any inaccuracy therein or omission therefrom is hereby expressly disclaimed, in particular, if for reasons of commercial confidentiality information on certain matters that might be ofrelevance to a prospective purchaser has not been included in this Presentation.
The distribution of this Presentation and other information in connection with the Notes in certain jurisdictions may be restricted by law and persons into whose possession this Presentation or any document or other information referred toherein comes should inform themselves about and observe any such restrictions. Any failure to comply with these restrictions may constitute a violation of the securities laws of any such jurisdiction. This Presentation and any materialsdistributed in connection with this Presentation are not directed to, or intended for distribution to or use by, any person or entity that is a citizen or resident or located in any locality, state, country or other jurisdiction where such distribution,publication, availability or use would be contrary to law or regulation or which would require any registration or licensing within such jurisdiction. LiveWest does not accept any liability to any person in relation to the distribution or possession ofthis presentation in or from any jurisdiction.Sourcing – unless otherwise stated: LiveWest Financial Statements 2019 and associated Offering Materials
2

Our Presenting Team
Melvyn Garrett, Deputy Chief Executive and Executive Director of Finance
• Joined LiveWest in 2013 (then Devon and Cornwall Housing (DCH))• Previously Europe, Middle East and Africa Finance and Operations Director at Motorola Mobility• Previously held finance, strategy and chief executive positions in the transport, electronics and
distribution sectors; with eight years spent in the USA
Andrew Hart, Director of Corporate Finance
• Joined LiveWest in 2014 (then Devon and Cornwall Housing (DCH))• 25 years’ finance experience including 10 years in corporate finance consultancy• Previously Managing Director at TradeRisks specialising in treasury risk management
3

4
• Introduction to LiveWest
• Company Overview
• Operational Performance
• Business and Development Plan
• Financial Performance
• Treasury
• Transaction Overview
Agenda

Introduction to LiveWest
Daffodil Fields, Goldsithney, Cornwall

Company Highlights
6
Homes England Strategic Partner
Own and manage
36,222 homes
in South West
Strong Financial
Management (Moody’s Credit
Report June 2019)
2.67xEBITDA MRI
Interest Cover
G1 / V1Highest regulatory
ratingJuly 2019
A2 (stable)Moody’s rating
(updated June 2019)
40%Gearing Ratio
2.12xSocial lettings Income cover
£2.2m invested incommunity investment
schemes
75%Income from social
lettings as % of Turnover
£1bnBorrowing capacity
1,337Skilled and committed employees, living our
values and making things happen
Improved Satisfaction Levels:
90%Overall customer
satisfaction
434People moved in the
past year from supported housing to
live independently

Introduction
• Devon and Cornwall Housing (DCH) and Knightstone merged on 5 March 2018 to form LiveWest Homes
• South West of England focus, operating from Gloucestershire to the Isles of Scilly
• Own and manage over 36,000 properties in just 24 Local Authorities
• Operate in strong urban areas including Bristol, Exeter, Plymouth, Taunton and Truro
• High demand with house prices averaging 8.8 times salaries in the South West
1974
Devon and Cornwall Housing Association
(DCHA) and Knightstone established
Knightstone merge with Taunton Deane Housing Association
1988 2006-07
Penwith Housing Association (PHA) and
Tor Homes (two LSVTs) join the DCHA group
2011-12
DCHA, Tor Homes and PHA amalgamate to
form DCH
2015
West Devon Homes amalgamate with
DCH
Mar2018
Knightstone and DCHA merge to form Liverty –subsequently
LiveWest Homes Ltd
2013
Knightstone Capital Plc issued £100m bond
(£50m retained and £49m forward funded)
Settled the £49m forward funded
placement
Aug2018
Knightstone Capital plc changes name
to LiveWest Capital plc
2017
Sept2018
Sell £50m retained bond
LiveWest Treasury Ltd converts to
LiveWest Treasury plc
Aug2019
Sept2019
EMTN Programme established through
LiveWest Treasury plc
7

Merger Achievements
2019 2018 2017
LiveWest
Social – owned and managed
33,734 33,021 32,127
Non-Social 2,488 2,418 2,418
Total 36,222 35,439 34,473
Turnover £233m £231m £220m
Operating Margin (before asset disposals)
28% 27% 33%
Net Debt £788m £712m £682m
Net Debt per Unit Owned £22,518 £20,721 £20,213
• Integration progressing well
• Signed Homes England Strategic Partnership to
provide 935 additional homes
• £200m of new financing (retained bond sale and
revolving credit facilities)
• Transition to:
o New management team
o New brand
• Over 1,000 affordable homes developed since merger
• Outperformed budget in 2018/19
• Merger savings ahead of target
• As a result efficiency targets increased from £12m by 2020/21 to £17m by 2022/23
8

Strategy
9
The LiveWest strategy is to take forward the key themes from our merger business case to:
1. Deliver 16,000 new homes over the next 10 years
2. Continue to deliver high-quality services, and ensure these are fit for the future:
3. Ensure the financial and organisational resilience that underpins our ambitious plans
All this whilst creating significant social value for customers and the broader community.
We are more than just a landlord: we invest in
empowerment and support services that add value to our
work, improve people’s life chances and sustain
communities
We are working with and empowering local
communities: we invest in neighbourhoods making them
stronger for the long term, building the foundations of a
better future
We are directing resources to services and communities where there is greatest need:
where we can make the biggest impact, and where community
investment makes the most substantial difference to
customer satisfaction and our overall service
offer
Company & Governance Overview
Tayberry Close, Stoke-Sub-Hamdon, Somerset
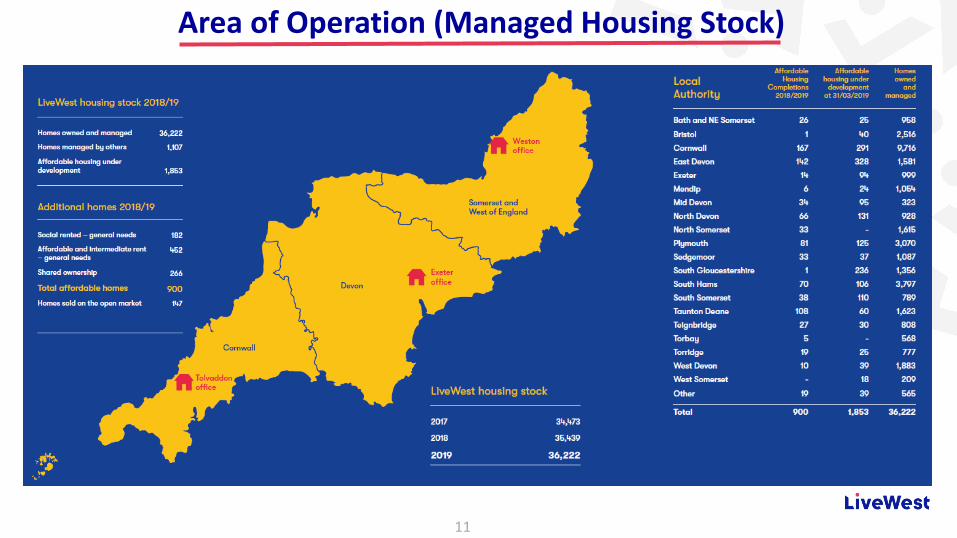
Area of Operation (Managed Housing Stock)
11
0
1,000
2,000
3,000
4,000
5,000
6,000
7,000
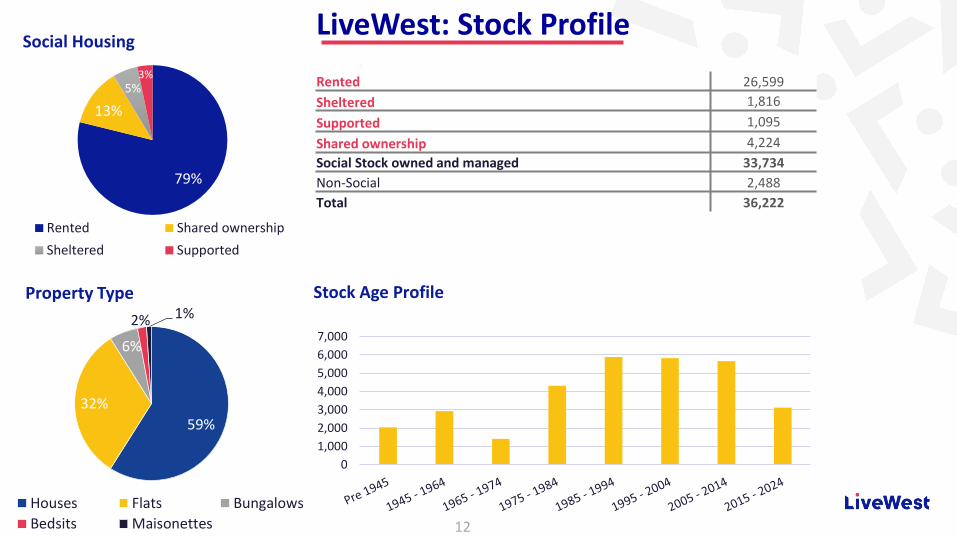
59%
32%
6%
2% 1%Property Type
Houses Flats Bungalows
Bedsits Maisonettes
LiveWest: Stock Profile
12
Stock Age Profile
Rented 26,599
Sheltered 1,816
Supported 1,095
Shared ownership 4,224
Social Stock owned and managed 33,734
Non-Social 2,488
Total 36,222
79%
13%
5%3%
Social Housing
Rented Shared ownership
Sheltered Supported

Corporate Structure
13
• Only one Registered Provider in the group, LiveWest Homes Limited• A programme of rationalisation of subsidiaries is anticipated, with the aim of simplifying the structure further over time
* Programme Issuing Entity
** £100m Bond issued by this entity
LiveWest Homes Limited
LiveWest Capital PLC**
Great Western Assured
Growth Ltd
LiveWest Charitable
Housing Ltd
Westco Properties Ltd
Arc Developments
South West Ltd
LiveWest Treasury
plc *
LiveWest Properties
Limited
Non-dormant companies only

Board and Governance
14
• Our board comprises:
• Eight independent members, two executives:
o Chair: Linda Nash
o CEO: Paul Crawford
• Treasury and Development committees each include
a specialist co-opted member
• Board experience includes: construction; national
housebuilder; financial; regulator; housing sector

Our Executive team structure:
“LiveWest's management team demonstrate strong financial management, which is captured in their 'a' score for
financial management.” Moody’s Credit Rating Report June 201915
CEOPaul Crawford
EXECUTIVE DIRECTOR OF BUSINESS & DIGITAL
CHANGEIan Fisher
EXECUTIVE DIRECTOR OF DEVELOPMENT
Russell Baldwinson
EXECUTIVE DIRECTOR OF GOVERNANCE &
COMPLIANCEJill Farrar
DEPUTY CEO / EXECUTIVE DIRECTOR OF FINANCE
Melvyn Garrett
Finance – Business Planning, Treasury Management,
DevelopmentFinance
People Services
Facilities Management
Communications &Public Affairs
Strategy & Customer Insight
Governance
Legal Services&
Audit Risk
Procurement
Information Technology
Business Systems
Data Management
Programme Management
Business Intelligence
Housing Development
Open Market & Shared Ownership
Asset Disposals
Housing Management
Property Services & Asset
Management
Compliance (Home Standards,
Health & Safety & Environmental)
Customer Services
Supported Housing
Leasehold Management
EXECUTIVE DIRECTOR OF OPERATIONSSuzanne Brown
Board and Governance

Operational Performance
Fort Gardens, Plymouth, Devon

Key Indicators
17
March 2019 March 2018 March 2017
Management cost per unit £1,052 £1,083 £1,051
Maintenance cost per unit £1,701 £1,618 £1,600
Social housing interest cover 212% 228% 237%
Rent arrears 1.83% 1.90% 2.09%
Void rent loss 0.51% 0.51% 0.42%
Landlord Surplus % 33% 31% 33%
Operating surplus % 28% 27% 30%
Net Debt per unit owned £22,518 £20,721 £20,213
Units developed (affordable) 900 812 829
Customer satisfaction 90% 89% NR
• Management costs per unit in both 2018 & 2019 include one-off restructuring costs. If these were excluded the cost per unit in 2019 would have been <£1,000, a c.10% real reduction from 2017
• Total maintenance cost per unit reflects the planned investment across LiveWest
• Rent arrears % remains in the top quartile and has improved over the last 2 years despite Universal Credit recipients totalling morethan 4,000
• Void rent loss performance remains top quartile
• Customer satisfaction is a key measure of us meeting our aim to deliver high quality services

LiveWest: ESG
Source LiveWest Financial Statements 2019LiveWest Resident and Community Investment Annual Report April 2018 – March 2019Ministry of Housing Communities and Local Government English Housing Survey Headline Report 2017-18
18
• Average SAP rating: 71 vs National Average of 62:o Efficiency improvements are prioritised on lowest performers with a disposal plan where improvements are not possible
• Supported 1,400 customers with issues including family breakdown, mental health and benefit navigation – securing £1.6m in governmentpayments
• Delivered Get Active project with Sport England – 4,700 participants
• 317 grants for community groups, reducing isolation, improving communal spaces
• 434 people moved on from supported housing to live independently
• 1,196 volunteer hours donated by LiveWest staff
• £2.2m invested in Community investment schemes in 2019
• Housing First – lead partner in Bristol and Cornwall
Accreditations and Memberships
SAP ratings
A0%
B8%
C61%
D28%
E3%
F0%
G0%
Modular homes have 20% lower
heating bills than other new build
Bridgwater Pilot SchemeMix of 12 traditional build and 25 modular homes
13 Affordable Rented and 24 Shared Ownership units

Rent Collection
19
March 2019
March 2018
March 2017
Rent arrears 1.83% 1.90% 2.09%
Void rent loss (general needs) 0.51% 0.51% 0.42%
Tenants in receipt of Universal Credit 4,010 1,319 631
Average days to re-let 22.8 24.1 24.6
• Improving arrears performance in spite of welfare reform measures:
o Seven day waiting period scrapped, meaning first payment to be made in five weeks instead of six weeks
o Where a claimant migrates from Housing Benefit (HB) to Universal Credit, HB will continue to be paid for a two week period followingthe UC claim date – Some Local Authorities using Discretionary Housing Payments (DHP) to cover rent until UC is paid to claimant
o ‘Managed migration’ to UC for working aged tenants from January 2020 to December 2023
• Controls/mitigators include:
o Trusted Partner status with the Department of Work and Pensions
o Weekly monitoring of arrears and void performance
o Modelling the impact of Universal Credit on our income
o Financial Inclusion Strategy and action plan in place
o Mitigation plans in place for known welfare reform changes
As at March 2019:
• £1m arrears balance of tenants on Universal Credit:
o Represents 5.76% Rent arrears of tenants onUniversal Credit (0.6% of Income from SocialHousing Lettings)
• 44% of income received direct as Housing Benefit
• 14,947 Tenants on Housing Benefit of which 9,583 onfull Housing Benefit

20
• Continued robust processes to assure effective landlord safety management
• Fire risk management:
o No buildings with ACMs (Aluminium Composite Materials)o 10 blocks over six storeys and one of nine storeyso Structured response to Grenfell across the organisationo Supported Ministry of Housing, Communities, and Local Government (MHCLG) reporting requirementso Reviewed procedures with support of our fire brigade partnerso Re-assessed all buildings where potential for additional risks was identified, any necessary actions implementedo Resources made available for any necessary workso Ongoing resourcing of fire risk management across the organisationo Retrofit of sprinkler systems based on tenant vulnerabilityo New developments include consultation with fire specialists at an early stage of our design process
• Business plan includes £23m provision for additional fire safety measures
Fire Safety

Development Plan
Nansledan, Newquay, Cornwall

-
5,000
10,000
15,000
20,000
25,000
30,000
35,000
40,000
45,000
Waiting Lists and Stock by LA
LiveWest Stock Other HA Stock Total Demand
Market Conditions (1)
22
Source: https://assets.publishing.service.gov.uk/government/uploads/system/uploads/attachment_data/file/773004/LT_600.xlsxhttps://assets.publishing.service.gov.uk/government/uploads/system/uploads/attachment_data/file/795586/SDR_Additional_Tables_2018_FINAL_v01.3.xlsxLiveWest Financial Statements 2019

23
Annual change in house prices by LA as at May 2019
Source: https://www.gov.uk/government/publications/uk-house-price-index-england-may-2019/uk-house-price-index-england-may-2019LiveWest Financial Statements 2019
Average rent as a % of LHA rate
- 1,000 2,000 3,000 4,000 5,000 6,000 7,000 8,000 9,000 10,000
0%
20%
40%
60%
80%
100%
StockRent % Stock Rent as % of LHA
- 1,000 2,000 3,000 4,000 5,000 6,000 7,000 8,000 9,000 10,000
0%2%4%6%8%
10%12%14%16%
Stock% ChangeStock Change in house price May 19
Market Conditions (2)

Development Strategy
24
• Build on a proven track record
• Business plan of at least 7,000 homes over the next 5 years and 16,000 homes over next 10 years
o Over 90% affordable tenures (affordable rent, social rent, shared ownership)
o Remainder open market sales as a means of creating financial capacity for investing in new affordable homes, along with control over s106 provision
o 1,853 new affordable homes in contract as at 31 March 2019
• Open market focus on principal housing market areas: Bristol, Exeter, Plymouth, Truro and Taunton
• Homes England – Partnership with Sovereign to deliver a total of 2,275 new homes by March 2024. LiveWest is committed to deliver 935 of these homes with £46m grant
• Increasing focus on modern methods of construction, including modular homes
Development target areasMinimum 1/3 in Devon& Cornwall
Minimum 1/3 inSomerset & West ofEnglandRemainder OpportunityLed
0
500
1000
1500
2019/2020 2020/2021 2021/2022 2022/2023 2023/2024
Delivery Profile - contracted units

Development Risk Policy and Appraisal Criteria
25
• Investment appraisal – yield and profit margin targets set annually by the board and monitored by the Development Committee
• Internal Financial Framework Limit of 30% on the proportion of all sales (including shared ownership) to total turnover
• Impairment exposure limits to keep land holdings within risk limits
• Scheme approvals at board, Development Committee or officer level dependent on size and duration
• The Development Review Team has oversight of our housing market activity (sales and affordable units) on a monthly basis with
quarterly reporting to the Development Committee
• Minimum 2 year liquidity policy (including uncommitted spend)
• Liquidity buffer to account for sales risk – equivalent to six months’ sales delay and a 15% fall in values
• Contractor exposure limits
• Housing market scenario testing with early warning trigger levels

Development Track Record
26
• Affordable housing delivered through land led schemes and s.106
• Open market sites delivered through joint venture with house builders, or contractors for smaller sites
• Sales of open market and shared ownership homes totalled 399 units for the year (422 for the year to March 2018)
• At 31 March 2019 we had 125 shared ownership homes in stock (March 2018: 111) and 2 open market homes (March 2018: 28)
Gross Development Spend (£m) 2019 2018
Housing Properties 115 85
Houses for sale 60 48
0
50
100
<1 mth 2-3 mths 4-6 mths >6 mths
Shared ownership stock
Unsold Reserved/Exchanged
166 182 271
333452
543313
266
404
159115
112
2017/2018 2018/2019 2019/2020
Homes developed
Social Rented Affordable Rented Shared Ownership Non Social
812 900
1,218
Affordable Totals

Waters Edge, Exmouth, Devon
27
8 Shared
Ownership
18 Outright Sale
10 Rented
36 home development
Cross subsidising social housing with open market sales allowed us to double the affordable provision on the site from 9 to 18 homes

Nansledan , Cornwall
28
4 year development
69 Shared Ownership
64 Affordable rented
133 Home Scheme
Duchy of Cornwall led Initiative providing a school and doctors surgery

Financial Performance
Tennyson Court ,Taunton

Financial Performance
30
2019 2018 2017
Landlord turnover - £m 175 171 168
Surplus landlord activities - £m 57 52 56
Landlord Surplus % 33% 31% 33%
1st tranche property sales - £m 22 23 23
Open market sales - £m 29 29 20
Total property sales - £m 51 52 43
Property sales % of turnover 22% 23% 20%
Total Turnover 233 231 220
Operating Surplus - £m (pre asset disposals) 66 62 66
Operating Surplus - £m (post asset disposals) 81 69 74
Operating Margin % (pre asset disposals) 28% 27% 30%
Net surplus - £m 56 45 52
Net surplus % 24% 19% 24%
Gearing % 40% 38% 38%
EBITDA-MRI Interest cover % 267% 252% 289%
Debt as multiple of turnover 3.44 3.09 3.10
Net Debt per unit owned 22,518 20,721 20,213
• Well positioned to continue to increase development, improve our service offerings and maximise the opportunities that willresult from merger

31
• Operating surplus increased to £66m from £62m in 2018 largely as a result of efficiencies brought about by merger
• Value for money initiatives have maintained the underlying operating margin, and improved landlord margin in spite of welfare reform
200%
300%
2017 2018 2019
EBITDA-MRI Interest cover %
• Within 2018 interest costs are one off merger costs for lender consent of £0.7m and termination fees in respect of an uneconomic loan facility of £3.7m, affecting interest cover in that year
• Significant interest cover and gearing headroom compared with lenders covenants and internal targets
35%
40%
45%
2017 2018 2019
Gearing - %
15,000
20,000
25,000
2017 2018 2019
Net Debt per Unit Owned
• Increased investment in land and work-in-progress has led to debtper unit of £23k, against £21k in 2018
200
250
2017 2018 2019
Total Turnover - £m
25%
30%
35%
2017 2018 2019
Operating Surplus - %
Financial Performance

Benchmarking
32
Operating margin – social housing lettings EBITDA – MRI Interest Cover %
Headline social housing Cost Per Unit (£) Gearing %
• Comparing LiveWest against a selection of Moody’s rated housing associations using HouseMark data
• Comprises of current A2 or higher rated associations
Source: LiveWest financial Statements 2019NHF & Housemark Sector Scorecard Analysis Report 2018
Replace with total cost per unit
Treasury
Tarka View, Crediton, Devon

£m
Debt Portfolio – March 2019
34
Loans Swaps Net loans % Target rangeFixed 275 366 641 80% 60% - 90%Floating 527 (386) 141 17% 0% - 40%Index linked 4 20 24 3% 0% - 25%Total Debt 806 - 806 100%
Cash and liquid investments (18) - (18)
Net Debt 788 - 788
• £106m MtM value Swaps
• MtM is fully secured (Including buffer against rate movement)
• Weighted Average Maturity of 11 years
£806m
£296mDrawn Debt
Undrawn Debt
Average cost of borrowing 3.16%
NAB Security Pool -Current Units
Total Value
£m
MV-STT 3,957 414.2
EUV-SH 5,897 325.5
Shared Ownership 823 48.8
Nil Value 140 -
Total 10,817 788.5
£1bn borrowing capacity
Treasury Policy
35
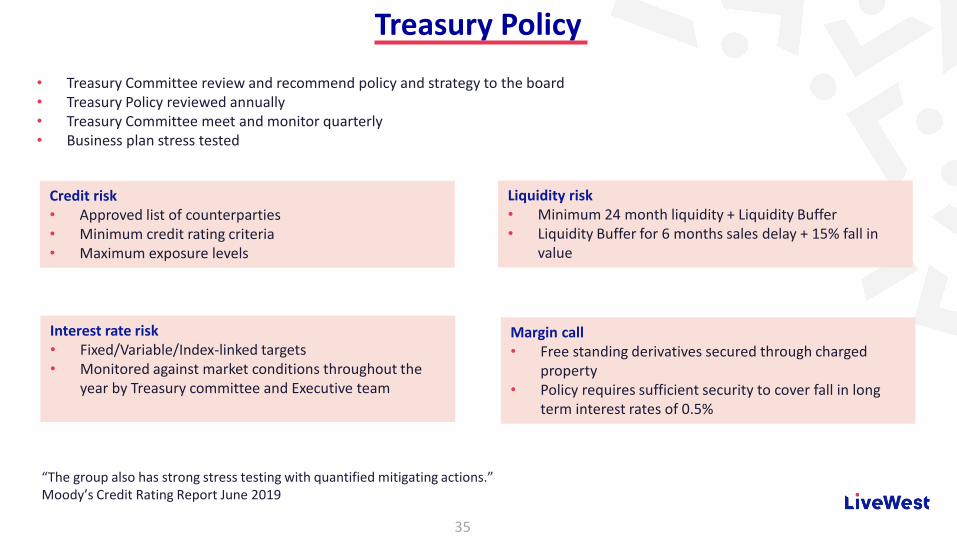
• Treasury Committee review and recommend policy and strategy to the board• Treasury Policy reviewed annually • Treasury Committee meet and monitor quarterly• Business plan stress tested
Margin call• Free standing derivatives secured through charged
property• Policy requires sufficient security to cover fall in long
term interest rates of 0.5%
Credit risk• Approved list of counterparties• Minimum credit rating criteria• Maximum exposure levels
Liquidity risk• Minimum 24 month liquidity + Liquidity Buffer• Liquidity Buffer for 6 months sales delay + 15% fall in
value
Interest rate risk• Fixed/Variable/Index-linked targets• Monitored against market conditions throughout the
year by Treasury committee and Executive team
“The group also has strong stress testing with quantified mitigating actions.”Moody’s Credit Rating Report June 2019

Transaction Overview
36Sherford, Plymouth, Devon

Transaction Terms
37
Indicative Transaction Overview
Issuer LiveWest Treasury plc
Initial Guarantor LiveWest Homes Limited
Programme Rating A2 by Moody’s
Deal size £250 million (with up to a £100m retained element)
Maturity Long dated
Documentation As per Programme Admission Particulars dated 24 September 2019
Asset Cover 105% EUV-SH / 115% MV-ST + Charged Cash
Information Covenants Compliance Certificate, financial statements, meetings on request
Denominations £100k+1k
Listing London, International Securities Market
Bookrunners Lloyds Bank Corporate Markets / MUFG / Santander
Note and Security Trustee Prudential Trustee Company Limited
Target Market MiFID II Professional and Eligible Counterparties only
Please refer to Programme Admission Particulars dated 24 September 2019 https://www.londonstockexchange.com/companies-and-advisors/international/documents/livewest.pdf

Company Highlights
38
Homes England Strategic Partner
Own and manage
36,222 homes
in South West
Strong Financial
Management (Moody’s Credit
Report June 2019)
2.67xEBITDA MRI
Interest Cover
G1 / V1Highest regulatory
ratingJuly 2019
A2 (stable)Moody’s rating
(updated June 2019)
40%Gearing Ratio
2.12xSocial lettings Income cover
£2.2m invested incommunity investment
schemes
75%Income from social
lettings as % of Turnover
£1bnBorrowing capacity
1,337Skilled and committed employees, living our
values and making things happen
Improved Satisfaction Levels:
90%Overall customer
satisfaction
434People moved in the
past year from supported housing to
live independently