Embed Size (px)
Citation preview

Investor Presentation | September 2017
2
Confidential: Not for distribution or publication
Disclaimer
Forward-Looking Statements
This presentation contains “forward-looking statements” within the meaning of the Federal Private Securities Litigation Reform Act of 1995. Forward-looking
statements may include, but are not limited to, statements relating to our 2017 Adjusted EBITDA outlook. Some of the forward-looking statements can be identified
by the use of terms such as “may,” “intend,” “might,” “will,” “should,” “could,” “would,” “expect,” “believe,” “estimate,” “anticipate,” “predict,” “project,” “potential,” or
the negative of these terms, and similar expressions. You should be aware that these forward-looking statements are subject to risks and uncertainties that are
beyond our control. Further, any forward-looking statement speaks only as of the date on which it is made, and we undertake no obligation to update any forward-
looking statement to reflect events or circumstances after the date on which it is made or to reflect the occurrence of anticipated or unanticipated events or
circumstances. New factors emerge from time to time that may cause our business not to develop as we expect, and it is not possible for us to predict all of them.
Factors that may cause actual results to differ materially from those expressed or implied by the forward-looking statements include, but are not limited to, the
following: cyclicality in residential and commercial construction markets; general economic and financial conditions; weather conditions, seasonality and availability
of water to end-users; laws and government regulations applicable to our business that could negatively impact demand for our products; public perceptions that
our products and services are not environmentally friendly; competitive industry pressures; product shortages and the loss of key suppliers; product price
fluctuations; inventory management risks; ability to implement our business strategies and achieve our growth objectives; acquisition and integration risks;
increased operating costs; and other risks, as described in Item 1A, “Risk Factors,” and elsewhere in our Annual Report on Form 10-K for the fiscal year ended
January 1, 2017.
Non-GAAP Financial Information
This release includes certain financial information, not prepared in accordance with U.S. GAAP. Because not all companies calculate non-GAAP financial
information identically (or at all), the presentations herein may not be comparable to other similarly titled measures used by other companies. Further, these
measures should not be considered substitutes for the information contained in the historical financial information of the Company prepared in accordance with
U.S. GAAP that is set forth herein.
We present Adjusted EBITDA in order to evaluate the operating performance and efficiency of our business. Adjusted EBITDA represents EBITDA as further
adjusted for items permitted under the covenants of our credit facilities. EBITDA represents our Net income (loss) plus the sum of Income tax (benefit),
Depreciation and amortization and interest expense, net of interest income. Adjusted EBITDA is also adjusted for stock-based compensation expense, related
party advisory fees, (gain) loss on sale of assets, other non-cash items and other non-recurring (income) loss. Adjusted EBITDA does not include pre-acquisition
acquired Adjusted EBITDA of any acquired company. Adjusted EBITDA is not a measure of our liquidity or financial performance under GAAP and should not be
considered as an alternative to net income, operating income or any other performance measures derived in accordance with GAAP, or as an alternative to cash
flow from operating activities as a measure of our liquidity. The use of Adjusted EBITDA instead of net income has limitations as an analytical tool. Because not all
companies use identical calculations, our presentation of Adjusted EBITDA may not be comparable to other similarly titled measures of other companies, limiting
its usefulness as a comparative measure. See the Appendix for a reconciliation of Adjusted EBITDA to net income. Net debt is defined as long-term debt (net of
issuance costs and discounts) plus capital leases, net of cash and cash-equivalents on our balance sheet. Leverage Ratio is defined as Net Debt to the trailing
twelve months Adjusted EBITDA. We define Organic Daily Sales as Organic Sales divided by the number of Selling Days in the relevant reporting period. We
define Organic Sales as Net sales, including Net sales from newly-opened greenfield stores, but excluding Net sales from acquired stores until they have been
under our ownership for at least four full fiscal quarters at the start of the fiscal year. Selling Days are the number of business days, excluding Saturdays, Sundays
and holidays, that SiteOne branches are open during the relevant reporting period.
3
Confidential: Not for distribution or publication
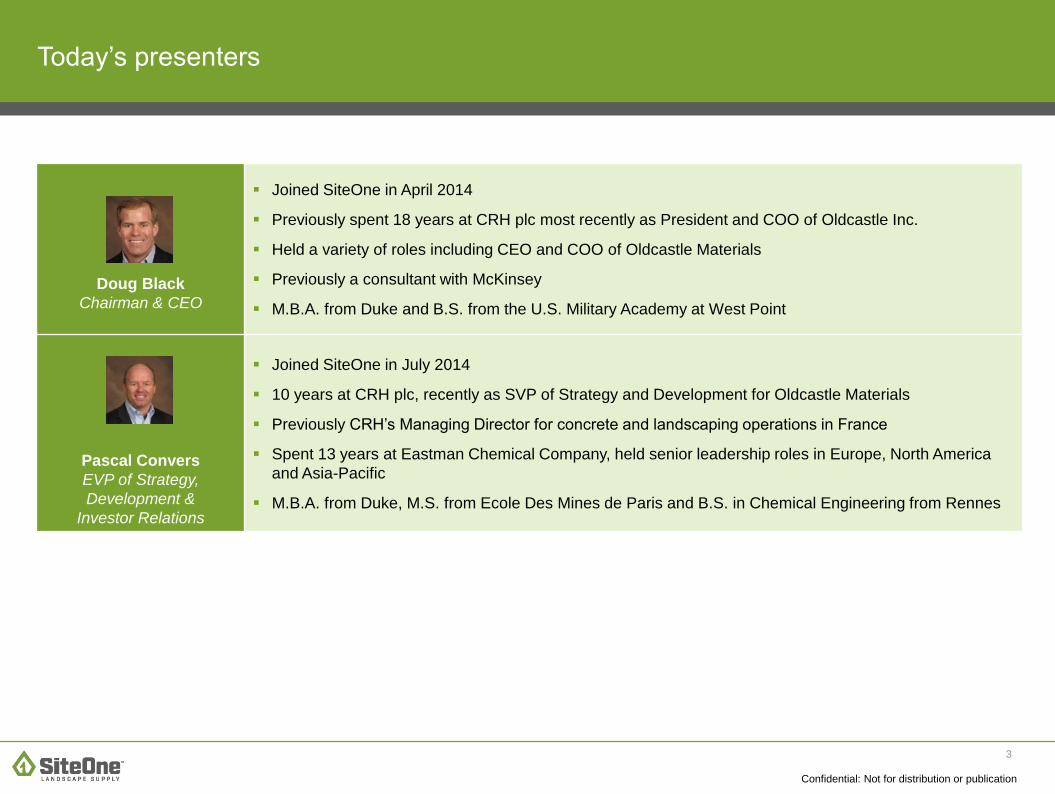
Today’s presenters
Doug Black
Chairman & CEO
▪ Joined SiteOne in April 2014
▪ Previously spent 18 years at CRH plc most recently as President and COO of Oldcastle Inc.
▪ Held a variety of roles including CEO and COO of Oldcastle Materials
▪ Previously a consultant with McKinsey
▪ M.B.A. from Duke and B.S. from the U.S. Military Academy at West Point
Pascal Convers
EVP of Strategy,
Development &
Investor Relations
▪ Joined SiteOne in July 2014
▪ 10 years at CRH plc, recently as SVP of Strategy and Development for Oldcastle Materials
▪ Previously CRH’s Managing Director for concrete and landscaping operations in France
▪ Spent 13 years at Eastman Chemical Company, held senior leadership roles in Europe, North America
and Asia-Pacific
▪ M.B.A. from Duke, M.S. from Ecole Des Mines de Paris and B.S. in Chemical Engineering from Rennes

Section 1Company overview
5
Confidential: Not for distribution or publication
Adjusted EBITDANet sales
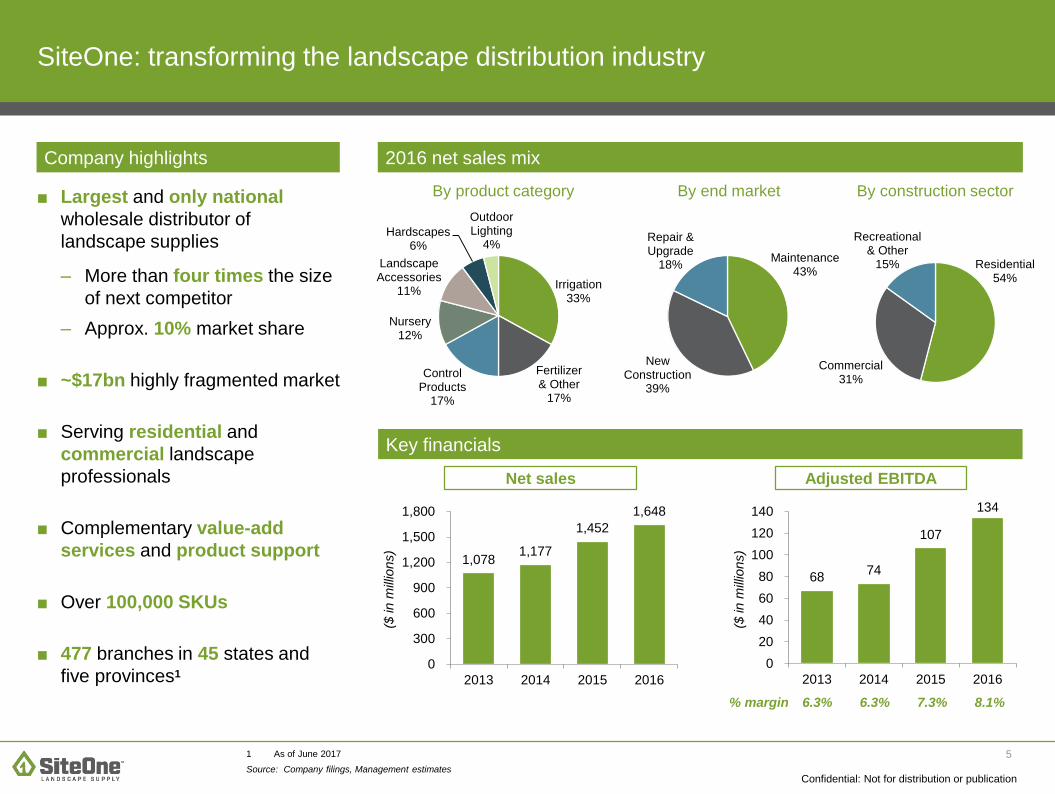
■ Largest and only national
wholesale distributor of
landscape supplies
– More than four times the size
of next competitor
– Approx. 10% market share
■ ~$17bn highly fragmented market
■ Serving residential and
commercial landscape
professionals
■ Complementary value-add
services and product support
■ Over 100,000 SKUs
■ 477 branches in 45 states and
five provinces1
2016 net sales mix
By product category By end market By construction sector
Company highlights
Key financials
SiteOne: transforming the landscape distribution industry
% margin 6.3% 6.3% 7.3% 8.1%
1 As of June 2017
Source: Company filings, Management estimates
Irrigation33%
Fertilizer& Other
17%
Control Products
17%
Nursery12%
Landscape Accessories
11%
Hardscapes6%
Outdoor Lighting
4%Maintenance
43%
New Construction
39%
Repair & Upgrade
18% Residential54%
Commercial31%
Recreational & Other
15%
1,078 1,177
1,452
1,648
0
300
600
900
1,200
1,500
1,800
2013 2014 2015 2016
($ in m
illio
ns)
68 74
107
134
0
20
40
60
80
100
120
140
2013 2014 2015 2016
($ in m
illio
ns)
6
Confidential: Not for distribution or publication
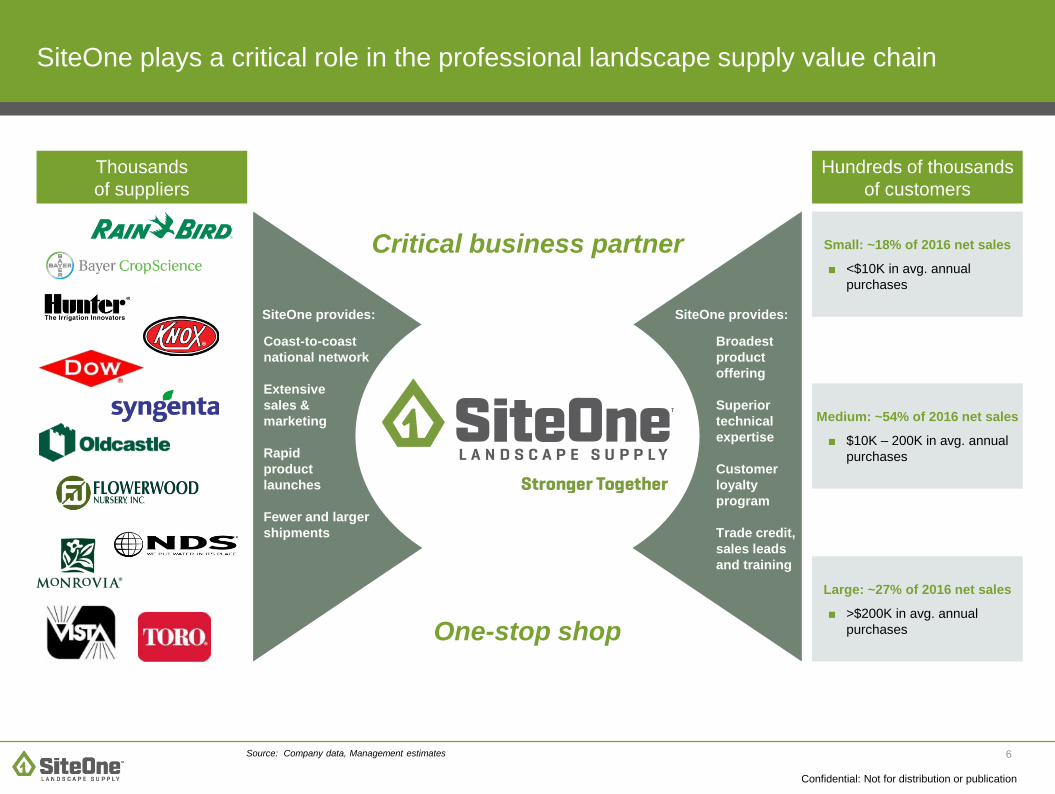
SiteOne plays a critical role in the professional landscape supply value chain
Thousands
of suppliers
Hundreds of thousands
of customers
Large: ~27% of 2016 net sales
■ >$200K in avg. annual
purchases
Medium: ~54% of 2016 net sales
■ $10K – 200K in avg. annual
purchases
Coast-to-coast
national network
Extensive
sales &
marketing
Rapid
product
launches
Fewer and larger
shipments
Broadest
product
offering
Superior
technical
expertise
Customer
loyalty
program
Trade credit,
sales leads
and training
SiteOne provides: SiteOne provides:
Critical business partner Small: ~18% of 2016 net sales
■ <$10K in avg. annual
purchases
One-stop shop
Source: Company data, Management estimates
7
Confidential: Not for distribution or publication
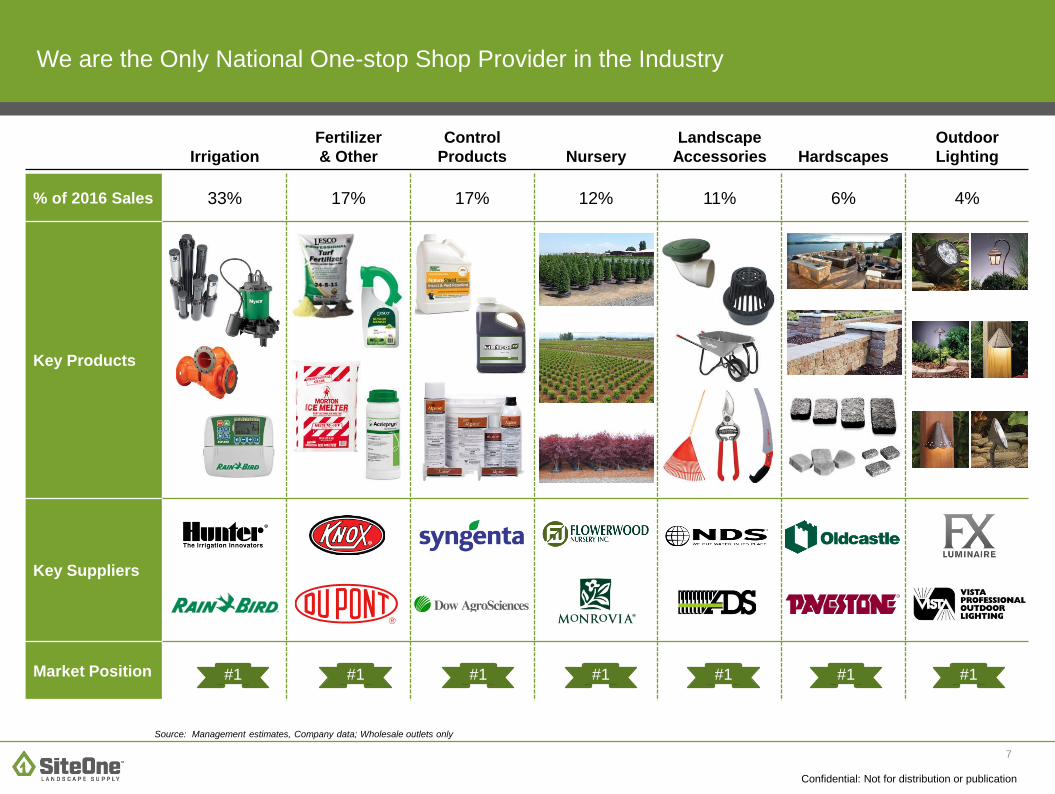
We are the Only National One-stop Shop Provider in the Industry
Source: Management estimates, Company data; Wholesale outlets only
Irrigation
Fertilizer
& Other
Control
Products Nursery
Landscape
Accessories Hardscapes
Outdoor
Lighting
% of 2016 Sales 33% 17% 17% 12% 11% 6% 4%
Key Products
Key Suppliers
Market Position #1 #1#1#1 #1 #1#1
8
Confidential: Not for distribution or publication
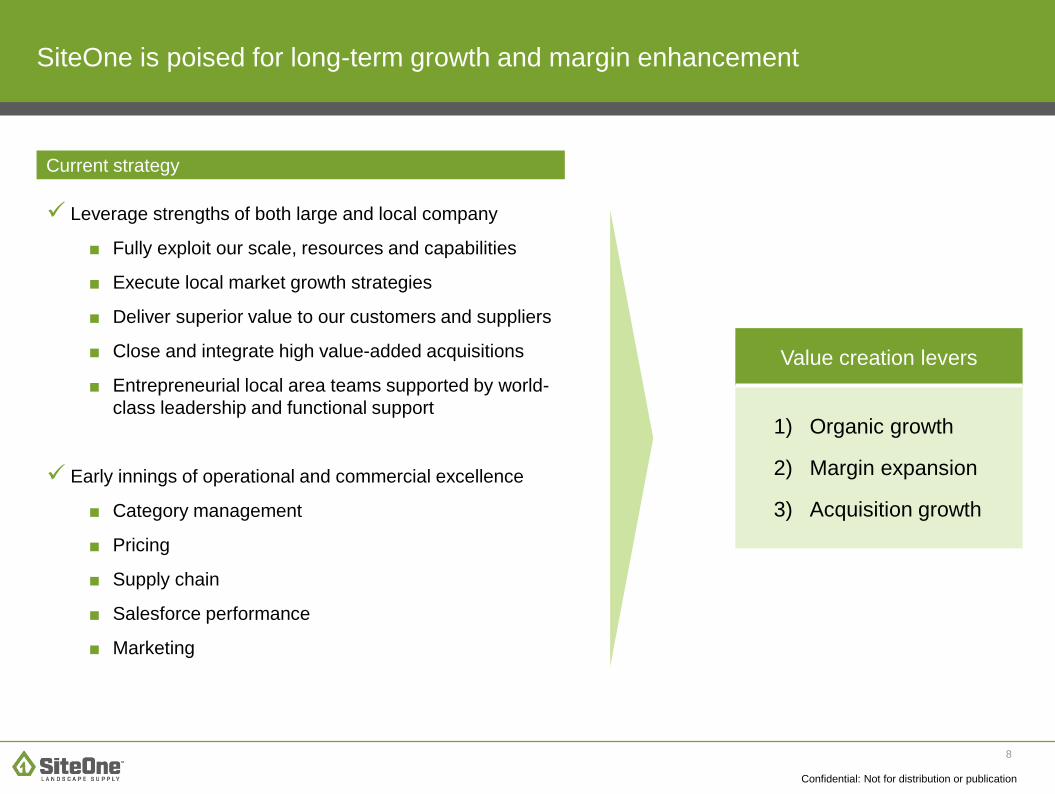
SiteOne is poised for long-term growth and margin enhancement
Current strategy
✓ Leverage strengths of both large and local company
■ Fully exploit our scale, resources and capabilities
■ Execute local market growth strategies
■ Deliver superior value to our customers and suppliers
■ Close and integrate high value-added acquisitions
■ Entrepreneurial local area teams supported by world-
class leadership and functional support
✓ Early innings of operational and commercial excellence
■ Category management
■ Pricing
■ Supply chain
■ Salesforce performance
■ Marketing
Value creation levers
1) Organic growth
2) Margin expansion
3) Acquisition growth
9
Confidential: Not for distribution or publication
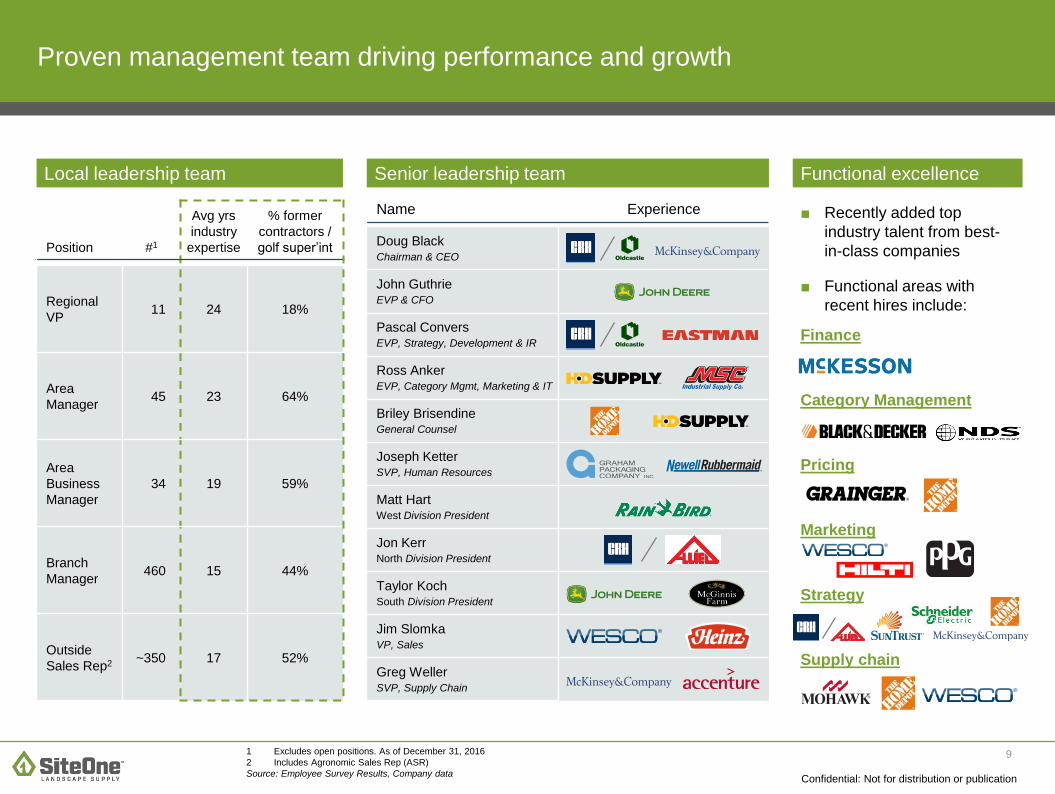
Position #1
Avg yrs
industry
expertise
% former
contractors /
golf super’int
Regional
VP11 24 18%
Area
Manager45 23 64%
Area
Business
Manager
34 19 59%
Branch
Manager460 15 44%
Outside
Sales Rep2 ~350 17 52%
Functional excellenceLocal leadership team Senior leadership team
■ Recently added top
industry talent from best-
in-class companies
■ Functional areas with
recent hires include:
Finance
Category Management
Pricing
Marketing
Strategy
Supply chain
Name Experience
Doug BlackChairman & CEO
John GuthrieEVP & CFO
Pascal ConversEVP, Strategy, Development & IR
Ross AnkerEVP, Category Mgmt, Marketing & IT
Briley BrisendineGeneral Counsel
Joseph Ketter SVP, Human Resources
Matt HartWest Division President
Jon KerrNorth Division President
Taylor Koch South Division President
Jim Slomka VP, Sales
Greg Weller SVP, Supply Chain
1 Excludes open positions. As of December 31, 2016
2 Includes Agronomic Sales Rep (ASR)
Source: Employee Survey Results, Company data
Proven management team driving performance and growth
10
Confidential: Not for distribution or publication
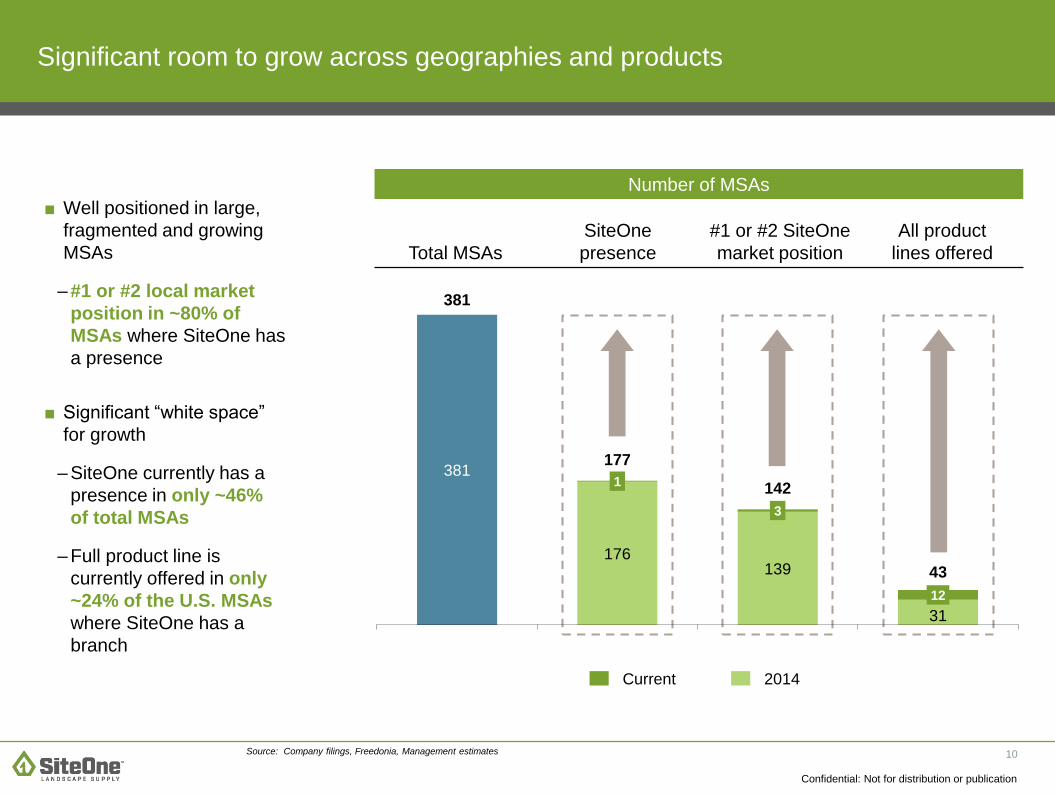
Number of MSAs
Total MSAs
SiteOne
presence
#1 or #2 SiteOne
market position
All product
lines offered
Significant room to grow across geographies and products
■ Well positioned in large,
fragmented and growing
MSAs
– #1 or #2 local market
position in ~80% of
MSAs where SiteOne has
a presence
■ Significant “white space”
for growth
– SiteOne currently has a
presence in only ~46%
of total MSAs
– Full product line is
currently offered in only
~24% of the U.S. MSAs
where SiteOne has a
branch
Source: Company filings, Freedonia, Management estimates
Current 2014
381
176 139
31
1
3
12
381
177
142
43
11
Confidential: Not for distribution or publication
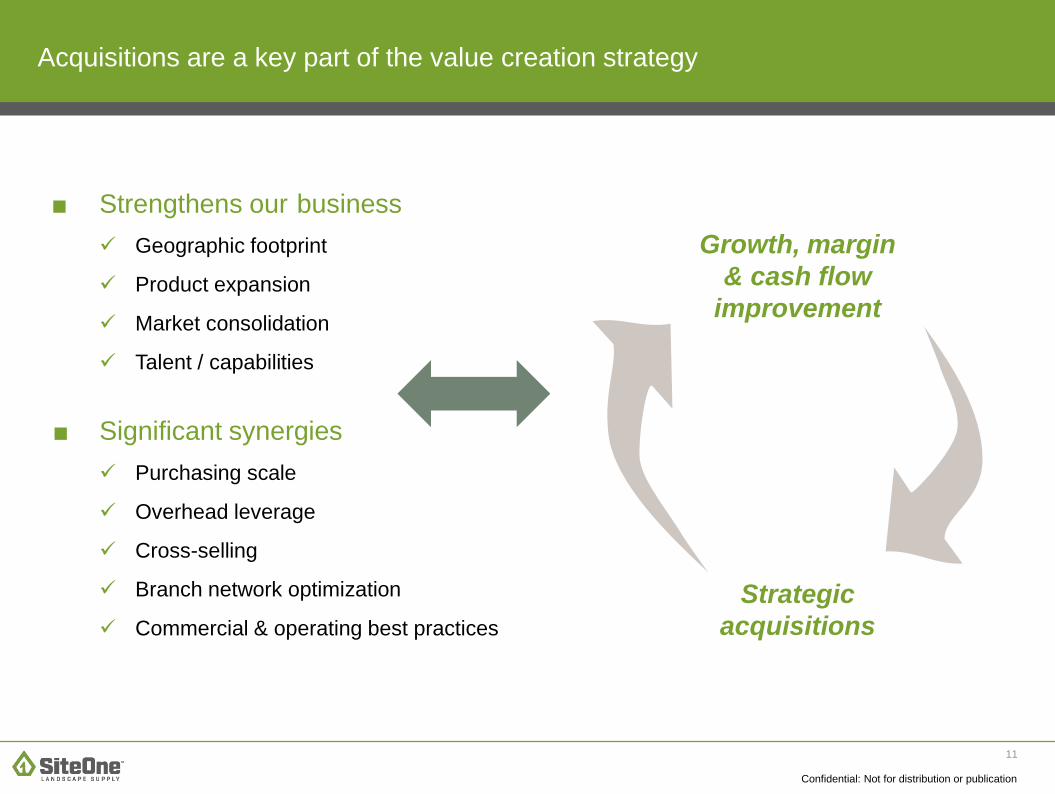
Acquisitions are a key part of the value creation strategy
■ Strengthens our business
✓ Geographic footprint
✓ Product expansion
✓ Market consolidation
✓ Talent / capabilities
■ Significant synergies
✓ Purchasing scale
✓ Overhead leverage
✓ Cross-selling
✓ Branch network optimization
✓ Commercial & operating best practices
Growth, margin
& cash flow
improvement
Strategic
acquisitions
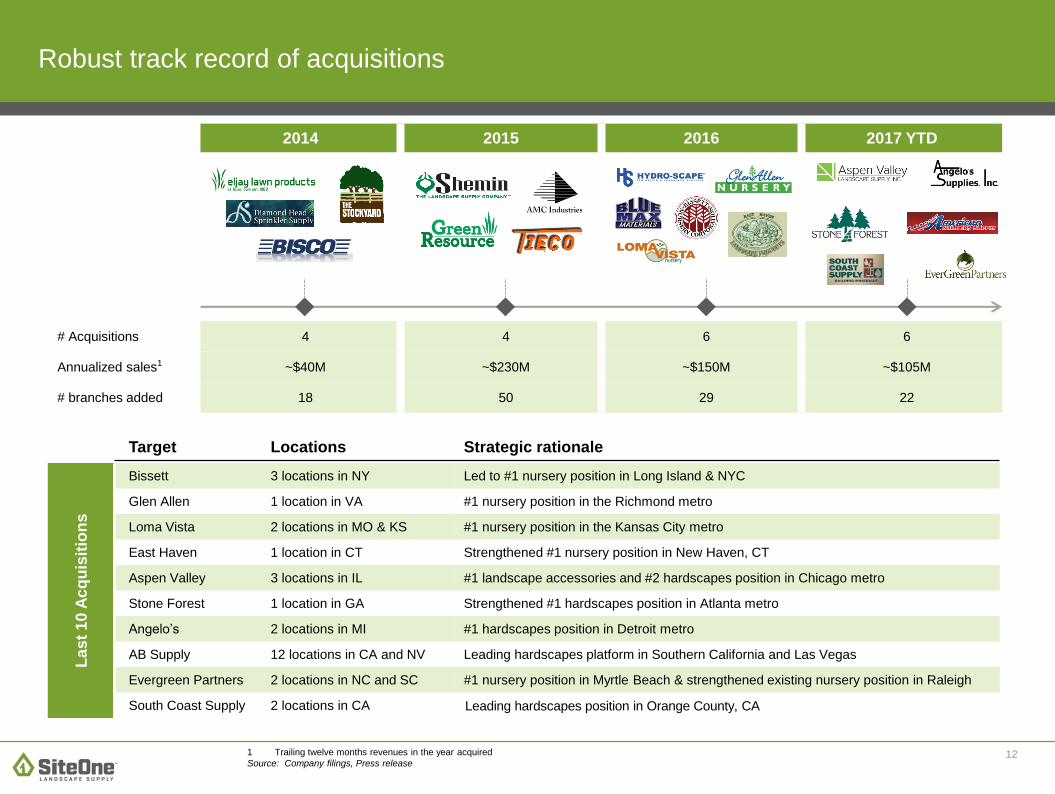
12
2014 2015 2016 2017 YTD
# Acquisitions 4 4 6 6
Annualized sales1 ~$40M ~$230M ~$150M ~$105M
# branches added 18 50 29 22
Robust track record of acquisitions
Target Locations Strategic rationale
La
st
10
Ac
qu
isit
ion
s
Bissett 3 locations in NY Led to #1 nursery position in Long Island & NYC
Glen Allen 1 location in VA #1 nursery position in the Richmond metro
Loma Vista 2 locations in MO & KS #1 nursery position in the Kansas City metro
East Haven 1 location in CT Strengthened #1 nursery position in New Haven, CT
Aspen Valley 3 locations in IL #1 landscape accessories and #2 hardscapes position in Chicago metro
Stone Forest 1 location in GA Strengthened #1 hardscapes position in Atlanta metro
Angelo’s 2 locations in MI #1 hardscapes position in Detroit metro
AB Supply 12 locations in CA and NV Leading hardscapes platform in Southern California and Las Vegas
Evergreen Partners 2 locations in NC and SC #1 nursery position in Myrtle Beach & strengthened existing nursery position in Raleigh
South Coast Supply 2 locations in CA Leading hardscapes position in Orange County, CA
1 Trailing twelve months revenues in the year acquired
Source: Company filings, Press release
13
Confidential: Not for distribution or publication
Chicago
Woodstock
Geneva
Wheaton
NapervilleAurora
Joliet
SiteOne
Shemin
Aspen Valley
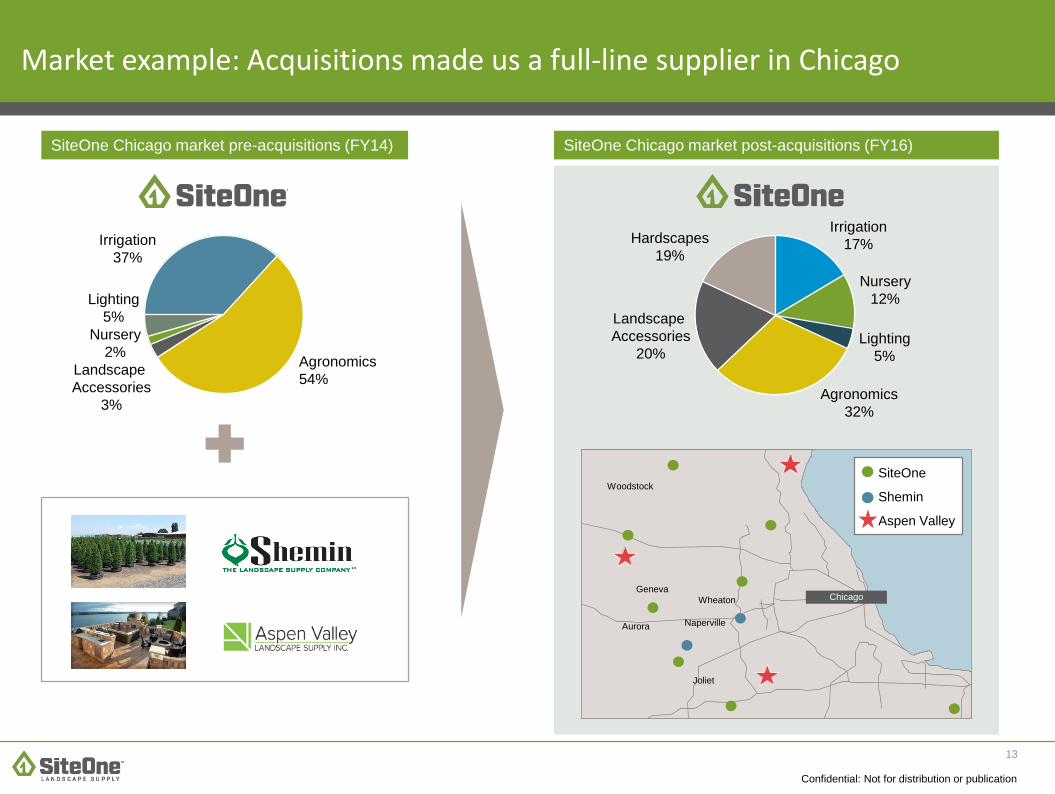
Market example: Acquisitions made us a full-line supplier in Chicago
Lighting
5%
Nursery
12%
Irrigation
17%Hardscapes
19%
Landscape
Accessories
20%
Agronomics
32%
Irrigation
37%
Lighting
5%
Nursery
2%Agronomics
54%Landscape
Accessories
3%
SiteOne Chicago market pre-acquisitions (FY14) SiteOne Chicago market post-acquisitions (FY16)
14
Confidential: Not for distribution or publication
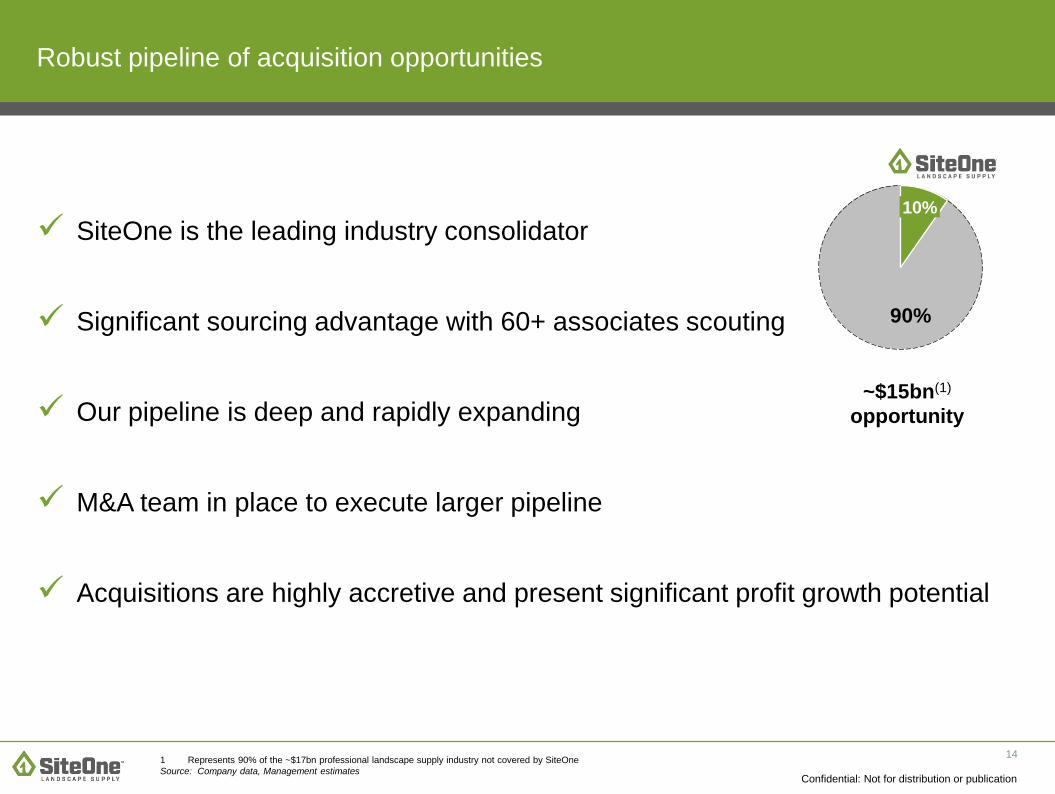
✓ SiteOne is the leading industry consolidator
✓ Significant sourcing advantage with 60+ associates scouting
✓ Our pipeline is deep and rapidly expanding
✓ M&A team in place to execute larger pipeline
✓ Acquisitions are highly accretive and present significant profit growth potential
Robust pipeline of acquisition opportunities
10%
~$15bn(1)
opportunity
90%
1 Represents 90% of the ~$17bn professional landscape supply industry not covered by SiteOne
Source: Company data, Management estimates
15
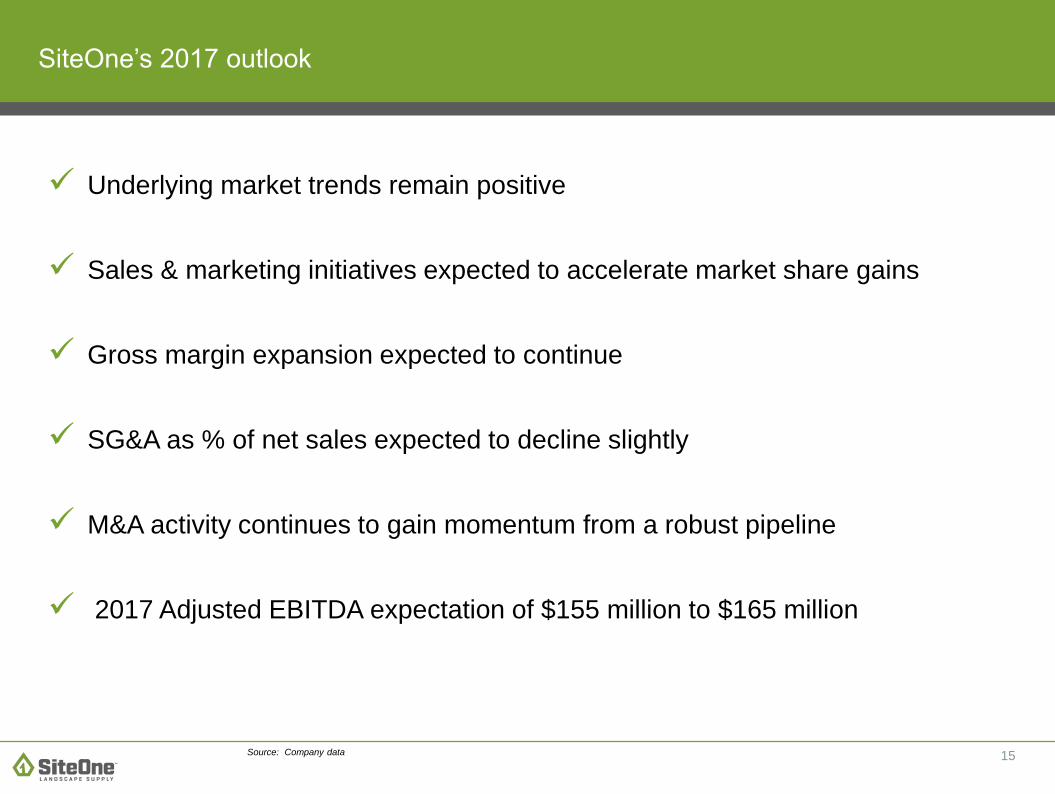
SiteOne’s 2017 outlook
✓ Underlying market trends remain positive
✓ Sales & marketing initiatives expected to accelerate market share gains
✓ Gross margin expansion expected to continue
✓ SG&A as % of net sales expected to decline slightly
✓ M&A activity continues to gain momentum from a robust pipeline
✓ 2017 Adjusted EBITDA expectation of $155 million to $165 million
Source: Company data

AppendixNon-GAAP Reconciliations
17
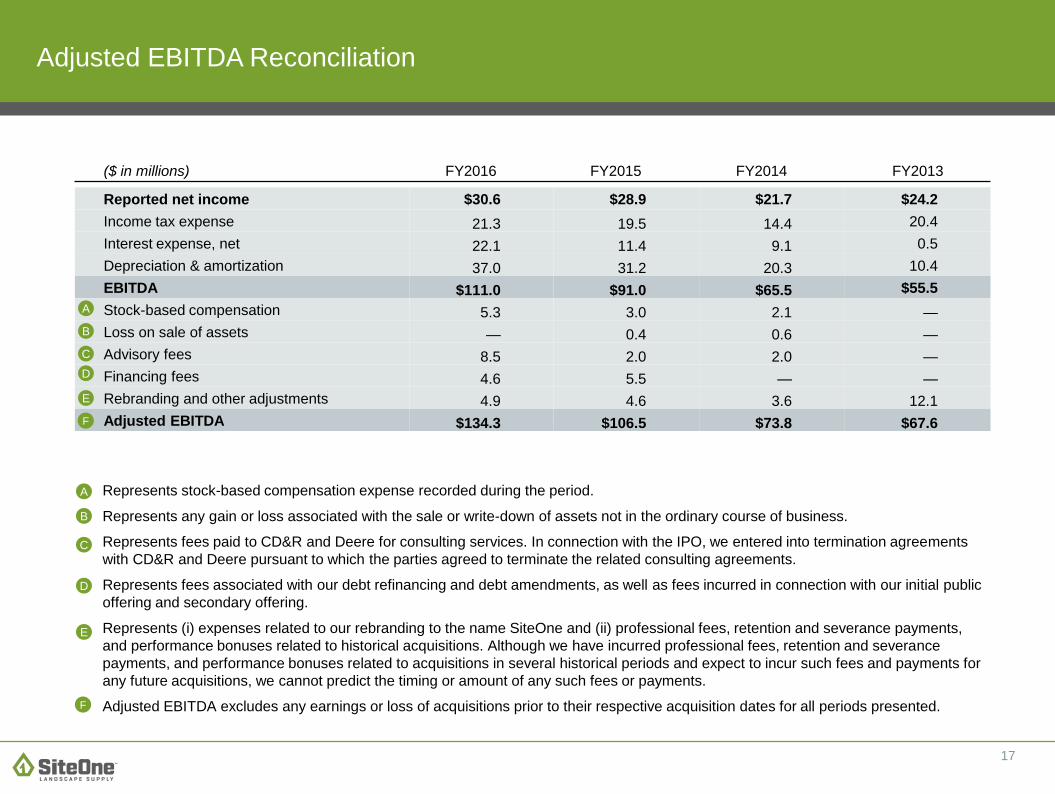
Adjusted EBITDA Reconciliation
($ in millions) FY2016 FY2015 FY2014 FY2013
Reported net income $30.6 $28.9 $21.7 $24.2
Income tax expense 21.3 19.5 14.4 20.4
Interest expense, net 22.1 11.4 9.1 0.5
Depreciation & amortization 37.0 31.2 20.3 10.4
EBITDA $111.0 $91.0 $65.5 $55.5
Stock-based compensation 5.3 3.0 2.1 —
Loss on sale of assets — 0.4 0.6 —
Advisory fees 8.5 2.0 2.0 —
Financing fees 4.6 5.5 — —
Rebranding and other adjustments 4.9 4.6 3.6 12.1
Adjusted EBITDA $134.3 $106.5 $73.8 $67.6
A
B
C
D
E
Represents stock-based compensation expense recorded during the period.
Represents any gain or loss associated with the sale or write-down of assets not in the ordinary course of business.
Represents fees paid to CD&R and Deere for consulting services. In connection with the IPO, we entered into termination agreements
with CD&R and Deere pursuant to which the parties agreed to terminate the related consulting agreements.
Represents fees associated with our debt refinancing and debt amendments, as well as fees incurred in connection with our initial public
offering and secondary offering.
Represents (i) expenses related to our rebranding to the name SiteOne and (ii) professional fees, retention and severance payments,
and performance bonuses related to historical acquisitions. Although we have incurred professional fees, retention and severance
payments, and performance bonuses related to acquisitions in several historical periods and expect to incur such fees and payments for
any future acquisitions, we cannot predict the timing or amount of any such fees or payments.
Adjusted EBITDA excludes any earnings or loss of acquisitions prior to their respective acquisition dates for all periods presented.
A
B
C
D
E
F
F


![2016 Jefferies Presentation (NOV Handout) [Read-Only] · Investor Presentation November 2016 Investor Presentation November 2016 . Forward-Looking ... Emerge from the current cycle](https://img.pdfslide.us/doc/110x75/5ec4c3d5f27e4d70fb21f9cd/2016-jefferies-presentation-nov-handout-read-only-investor-presentation-november.jpg)