Embed Size (px)
Citation preview

INVESTOR PRESENTATION
QUARTER 4, 2015
Patrick S. WilliamsPresident & CEO
Ian CleminsonExecutive Vice President &
Chief Financial Officer
February 17, 2016
FORWARD-LOOKING STATEMENTS
This presentation contains certain "forward-looking statements" within the meaning of the PrivateSecurities Litigation Reform Act of 1995. All statements other than statements of historical factsincluded or incorporated herein may constitute forward-looking statements. Such forward-lookingstatements include statements (covered by words like “expects,” “estimates,” “anticipates,” “may,”“believes,” “feels” or similar words or expressions), for example, which relate to earnings, growthpotential, operating performance, events or developments that we expect or anticipate will or mayoccur in the future. Although forward-looking statements are believed by management to bereasonable when made, they are subject to certain risks, uncertainties and assumptions, and ouractual performance or results may differ materially from these forward-looking statements. Additionalinformation regarding risks, uncertainties and assumptions relating to Innospec and affecting ourbusiness operations and prospects are described in Innospec’s Annual Report on Form 10-K for theyear ended December 31, 2014, and other reports filed with the U.S. Securities and ExchangeCommission. You are urged to review our discussion of risks and uncertainties that could causeactual results to differ from forward-looking statements under the heading "Risk Factors” in suchreports. Innospec undertakes no obligation to publicly update or revise any forward-lookingstatements, whether as a result of new information, future events or otherwise.
2

USE OF NON-GAAP FINANCIAL MEASURES
The information presented in this presentation includes financial measures that are not calculated orpresented in accordance with Generally Accepted Accounting Principles in the United States (GAAP).These non-GAAP financial measures comprise EBITDA, income before income taxes excluding specialitems and net income excluding special items and related per share amounts. EBITDA is net income perour consolidated financial statements adjusted for the exclusion of charges for interest expense, net,income taxes, depreciation, amortization and acquisition fair value adjustments. Income before incometaxes, net income and diluted EPS, excluding special items, per our consolidated financial statements areadjusted for the exclusion of adjustment to fair value of contingent consideration, amortization of acquiredintangible assets, fair value acquisition accounting, adjustment of income tax provisions, profit on disposalof subsidiary, foreign currency exchange losses/(gains) and acquisition-related costs. Reconciliations ofthese non-GAAP financial measures to their most directly comparable GAAP financial measures areprovided herein and in the appendices below. The Company believes that such non-GAAP financialmeasures provide useful information to investors and may assist them in evaluating the Company’sunderlying performance and identifying operating trends. In addition, management uses these non-GAAPfinancial measures internally to allocate resources and evaluate the performance of the Company’soperations. While the Company believes that such measures are useful in evaluating the Company’sperformance, investors should not consider them to be a substitute for financial measures prepared inaccordance with GAAP. In addition, these non-GAAP financial measures may differ from similarly-titlednon-GAAP financial measures used by other companies and do not provide a comparable view of theCompany’s performance relative to other companies in similar industries. Management believes the mostdirectly comparable GAAP financial measure is GAAP net income and has provided a reconciliation ofEBITDA and net income excluding special items, and related per share amounts, to GAAP net incomeherein and in the appendices below.
3

INNOSPEC – SUMMARY OF 4TH QUARTER PERFORMANCE
Record Sales and EBITDA for full year 2015
Sales above $1 billion in line with strategic plan
Strategic objectives achieved
Consolidation of Oilfield Services businesses
Focus on Personal Care through divestment of Aroma Chemicals
Challenging 4th Quarter especially in Oilfield Services
Volumes down in line with customers plans
Performance Chemicals continues to perform to our high expectations
Softer Quarter for Fuel Specialties
4

Ian CleminsonExecutive Vice President &
Chief Financial Officer
FINANCIAL PRESENTATION

Q4 2015 CONSOLIDATED RESULTS
Challenging quarter – net sales down 15% on prior year
Gross margins remain good at 35.1%
Adjusted EPS down just 3% on Q4 2014
Q4 2014 Q4 2015 Growth
$m $m %
Net sales 290.7 246.0 (15)%
Gross profit 94.1 86.3 (8)%
Gross margin 32.4% 35.1% 2.7%pt
Operating income * 42.1 25.2 (40)%
EBITDA 49.5 39.8 (20)%
EPS (diluted) 1.11 1.28 15%
EPS (adjusted) 1.28 1.24 (3)%
*Operating Income is before Fair Value Adjustments
6

Q4 2015 FUEL SPECIALTIES
Net sales down 14% compared to Q4 2014
Reduced volume in Oilfield Services
Softer quarter in Fuel Specialties
Margins still strongQ4 2014 Q4 2015 Growth
$m $m %
Net sales 216.8 186.3 (14)%
Gross profit 69.9 65.7 (6)%
Gross margin 32.2% 35.3% 3.1%pt
Operating income 36.6 25.6 (30)%
EBITDA 40.8 34.9 (14)%
7
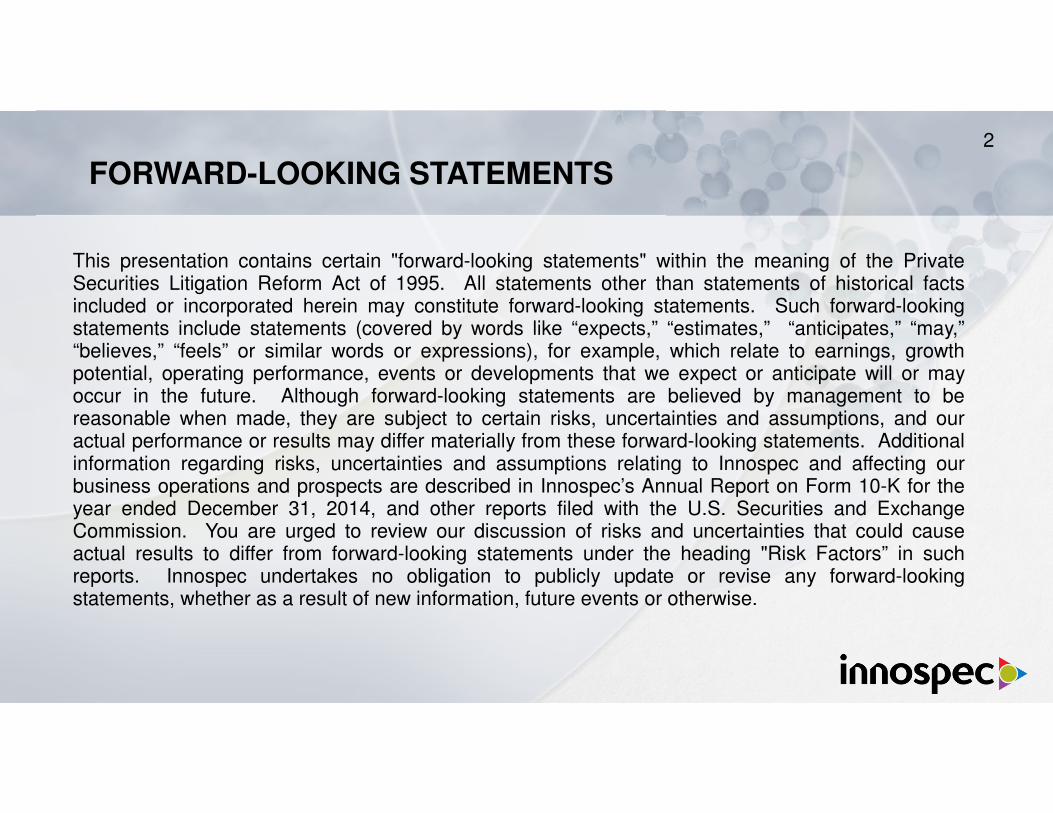
Q4 2015 PERFORMANCE CHEMICALS
Adjusted for divestment, growth is strong
Driven by new products in Personal Care
Softer quarter for Polymers
Q4 2014 Q4 2015 Growth
$m $m %
Net sales 51.0 39.2 (23)%
Gross profit 11.8 10.7 (9)%
Gross margin 23.1% 27.3% 4.2%pt
Operating income 4.7 4.2 (11)%
EBITDA 6.8 5.9 (13)%
8
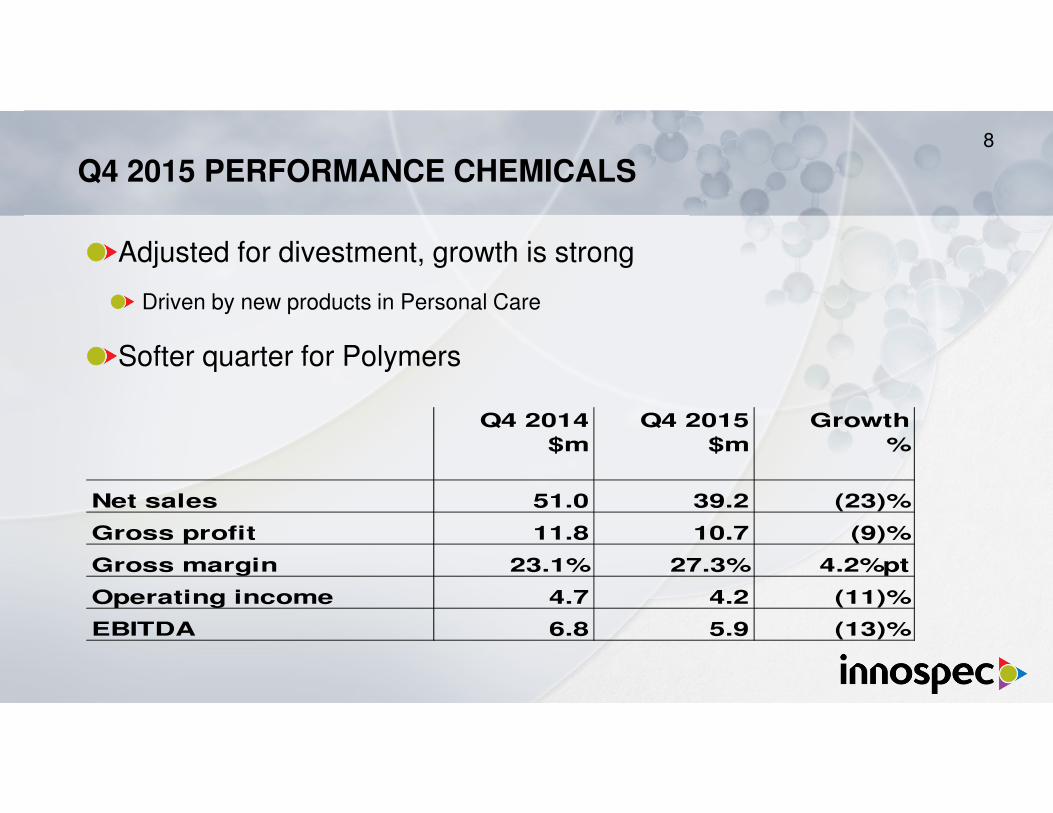
Q4 2015 OCTANE ADDITIVES
Q4 order delivered as anticipated
Sales broadly similar to Q4 2014
New order received for first part of 2016. Limited visibility beyond that.
Q4 2014 Q4 2015 Growth
$m $m %
Net sales 22.9 20.5 (10)%
Gross profit 12.4 9.9 (20)%
Gross margin 54.1% 48.3% (5.8%)pt
Operating income 10.6 8.8 (17)%
EBITDA 10.7 8.9 (17)%
9
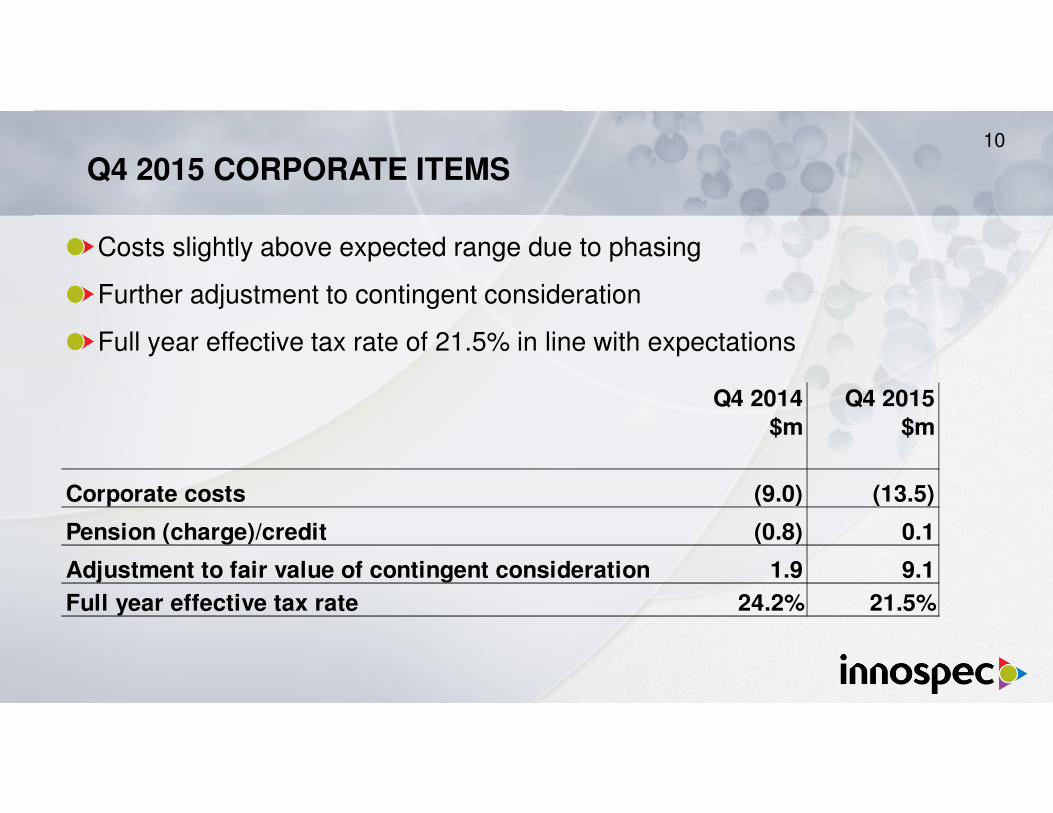
Q4 2015 CORPORATE ITEMS
Costs slightly above expected range due to phasing
Further adjustment to contingent consideration
Full year effective tax rate of 21.5% in line with expectations
Q4 2014 Q4 2015
$m $m
Corporate costs (9.0) (13.5)
Pension (charge)/credit (0.8) 0.1
Adjustment to fair value of contingent consideration 1.9 9.1
Full year effective tax rate 24.2% 21.5%
10

Q4 2015 CASH FLOW & BALANCE SHEET
Continue to generate good cash flow
Net cash positive at the end of the quarter
Healthy balance sheet
Q4 2014 Q4 2015$m $m
Total cash and cash equivalents 46.3 141.7
Total debt (141.6) (136.1)
Net (debt)/cash (95.3) 5.6
Total working capital 192.7 167.1
11

Patrick WilliamsPresident & CEO
CONCLUDING COMMENTS

CONCLUDING COMMENTS13
Challenging fourth quarter with inevitable impact of low crude oil prices
Full year performance hit record sales and EBITDA
Adjusted EPS of $4.36 per share
Annual dividend up 11% on 2014
Continued good cash generation
Balance sheet remains healthy going into 2016

YOUR OPPORTUNITY TO ASK QUESTIONS

FINAL COMMENTS15
Thanks to investors and customers for continued support
Q1 2016 results timetable
Results announced after close on May 3, 2016
Conference Call at 9am ET on Wednesday May 4, 2016

APPENDIX

INNOSPEC INCOME STATEMENT - QUARTER 4
Q4 2014 Q4 2015 Variance Pr. Yr.
$m $m $m
Net sales 290.7 246.0 (44.7)
Sales growth 20.3% (15.4)% N/A
Gross profit 94.1 86.3 (7.8)
Gross margin 32.4% 35.1% 2.7%pt
SAR expenses (52.0) (61.1) (9.1)
Operating income 42.1 25.2 (16.9)
Operating margin 14.5% 10.2% (4.3%)pt
Adjustment to fair value of contingent consideration 1.9 9.1 7.2
Interest expense, net (0.9) (1.1) (0.2)
Other net (expense)/income (0.4) 2.0 2.4
Income before income taxes 42.7 35.2 (7.5)
Income taxes (14.8) (3.7) 11.1
Net income 27.9 31.5 3.6
EBITDA 49.5 39.8 (9.7)
EBITDA margin 17.0% 16.2% (0.8%)pt
EBITDA margin represents EBITDA as a percentage of sales
17
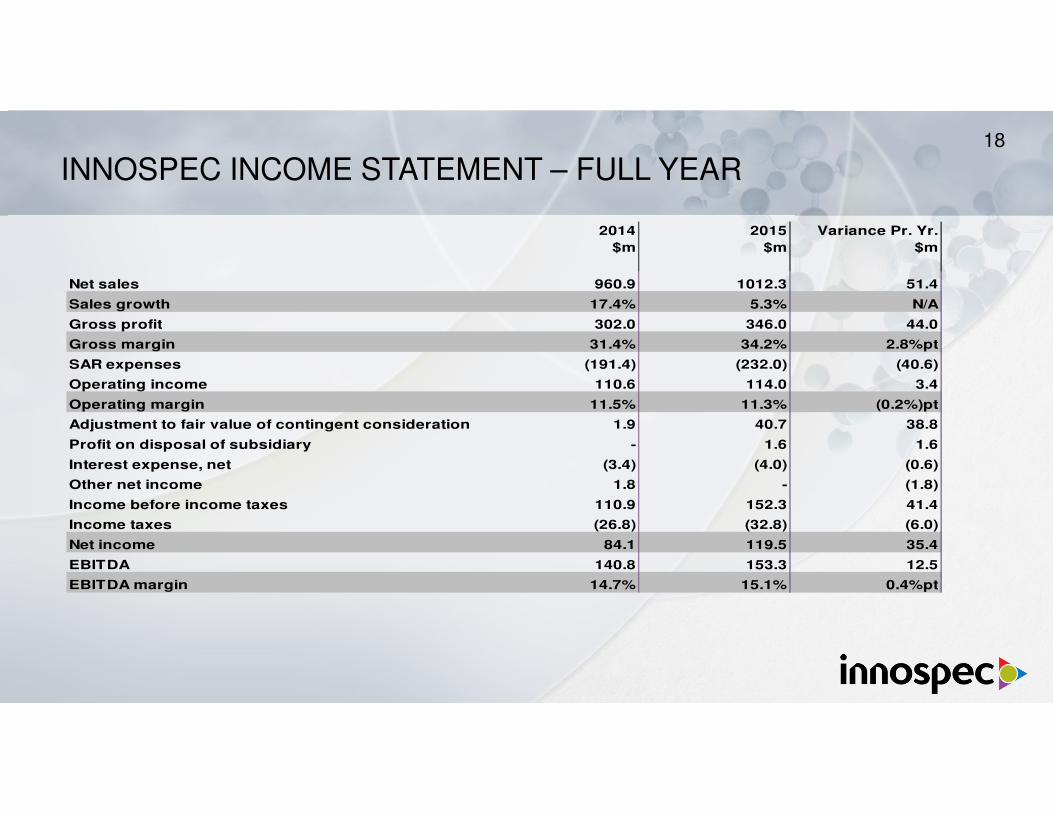
INNOSPEC INCOME STATEMENT – FULL YEAR
2014 2015 Variance Pr. Yr.
$m $m $m
Net sales 960.9 1012.3 51.4
Sales growth 17.4% 5.3% N/A
Gross profit 302.0 346.0 44.0
Gross margin 31.4% 34.2% 2.8%pt
SAR expenses (191.4) (232.0) (40.6)
Operating income 110.6 114.0 3.4
Operating margin 11.5% 11.3% (0.2%)pt
Adjustment to fair value of contingent consideration 1.9 40.7 38.8
Profit on disposal of subsidiary - 1.6 1.6
Interest expense, net (3.4) (4.0) (0.6)
Other net income 1.8 - (1.8)
Income before income taxes 110.9 152.3 41.4
Income taxes (26.8) (32.8) (6.0)
Net income 84.1 119.5 35.4
EBITDA 140.8 153.3 12.5
EBITDA margin 14.7% 15.1% 0.4%pt
18

FUEL SPECIALTIES - QUARTER 4
Q4 2014 Q4 2015 Variance Pr. Yr.
$m $m $m
Net sales 216.8 186.3 (30.5)
Sales growth 32.4% (14.1%) N/A
Gross profit 69.9 65.7 (4.2)
Gross margin 32.2% 35.3% 3.1%pt
Selling (24.4) (26.4) (2.0)
Administrative (4.6) (8.6) (4.0)
Research (4.3) (5.1) (0.8)
SAR expenses (33.3) (40.1) (6.8)
SAR % (15.4%) (21.5%) (6.1%)pt
Operating income 36.6 25.6 (11.0)
Operating income margin 16.9% 13.7% (3.2%)pt
EBITDA 40.8 34.9 (5.9)
EBITDA margin 18.8% 18.7% (0.1%)pt
19

FUEL SPECIALTIES – FULL YEAR
2014 2015 Variance Pr. Yr.
$m $m $m
Net sales 682.2 758.3 76.1
Sales growth 20.2% 11.2% N/A
Gross profit 219.0 265.1 46.1
Gross margin 32.1% 35.0% 2.9%pt
Selling (79.7) (111.3) (31.6)
Administrative (16.5) (29.2) (12.7)
Research (18.4) (20.7) (2.3)
SAR expenses (114.6) (161.2) (46.6)
SAR % (16.8%) (21.3%) (4.5%)pt
Operating income 104.4 103.9 (0.5)
Operating income margin 15.3% 13.7% (1.6%)pt
EBITDA 118.0 128.8 10.8
EBITDA margin 17.3% 17.0% (0.3%)pt
20

PERFORMANCE CHEMICALS - QUARTER 4
Q4 2014 Q4 2015 Variance Pr. Yr.
$m $m $m
Net sales 51.0 39.2 (11.8)
Sales growth (2.3%) (23.1%) N/A
Gross profit 11.8 10.7 (1.1)
Gross margin 23.1% 27.3% 4.2%pt
Selling (3.8) (4.7) (0.9)
Administrative (2.7) (0.9) 1.8
Research (0.6) (0.9) (0.3)
SAR expenses (7.1) (6.5) 0.6
SAR % (13.9%) (16.6%) (2.7%)pt
Operating income 4.7 4.2 (0.5)
Operating income margin 9.2% 10.7% 1.5%pt
EBITDA 6.8 5.9 (0.9)
EBITDA margin 13.3% 15.1% 1.8%pt
21

PERFORMANCE CHEMICALS – FULL YEAR
2014 2015 Variance Pr. Yr.
$m $m $m
Net sales 223.5 194.5 (29.0)
Sales growth 16.2% (13.0%) N/A
Gross profit 54.4 52.4 (2.0)
Gross margin 24.3% 26.9% 2.6%pt
Selling (15.1) (15.7) (0.6)
Administrative (9.9) (8.6) 1.3
Research (3.8) (4.6) (0.8)
SAR expenses (28.8) (28.9) (0.1)
SAR % (12.9%) (14.9%) (2.0%)pt
Operating income 25.6 23.5 (2.1)
Operating income margin 11.5% 12.1% 0.6%pt
EBITDA 34.2 30.5 (3.7)
EBITDA margin 15.3% 15.7% 0.4%pt
22
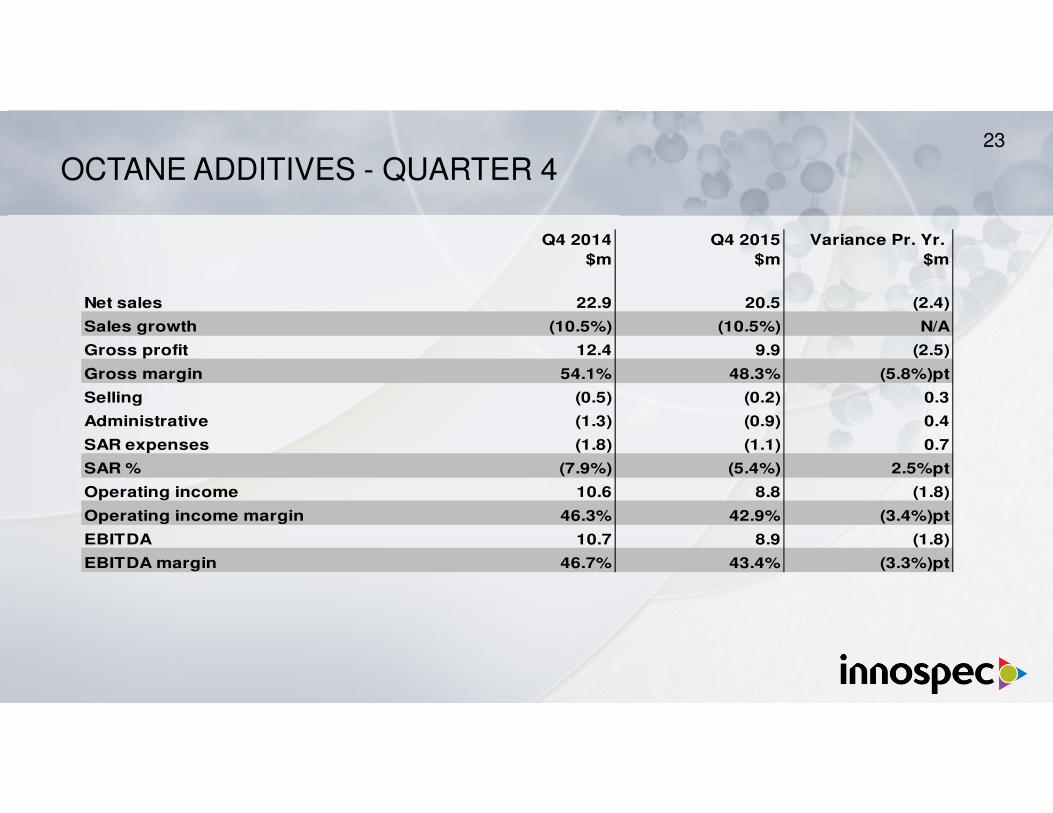
OCTANE ADDITIVES - QUARTER 4
Q4 2014 Q4 2015 Variance Pr. Yr.
$m $m $m
Net sales 22.9 20.5 (2.4)
Sales growth (10.5%) (10.5%) N/A
Gross profit 12.4 9.9 (2.5)
Gross margin 54.1% 48.3% (5.8%)pt
Selling (0.5) (0.2) 0.3
Administrative (1.3) (0.9) 0.4
SAR expenses (1.8) (1.1) 0.7
SAR % (7.9%) (5.4%) 2.5%pt
Operating income 10.6 8.8 (1.8)
Operating income margin 46.3% 42.9% (3.4%)pt
EBITDA 10.7 8.9 (1.8)
EBITDA margin 46.7% 43.4% (3.3%)pt
23

OCTANE ADDITIVES – FULL YEAR
2014 2015 Variance Pr. Yr.
$m $m $m
Net sales 55.2 59.5 4.3
Sales growth (6.4%) 7.8% N/A
Gross profit 28.6 28.5 (0.1)
Gross margin 51.8% 47.9% (3.9%)pt
Selling (1.9) (1.3) 0.6
Administrative (4.1) (2.5) 1.6
SAR expenses (6.0) (3.8) 2.2
SAR % (10.9%) (6.4%) 4.5%pt
Operating income 22.6 24.7 2.1
Operating income margin 40.9% 41.5% 0.6%pt
EBITDA 23.0 25.1 2.1
EBITDA margin 41.7% 42.2% 0.5%pt
24
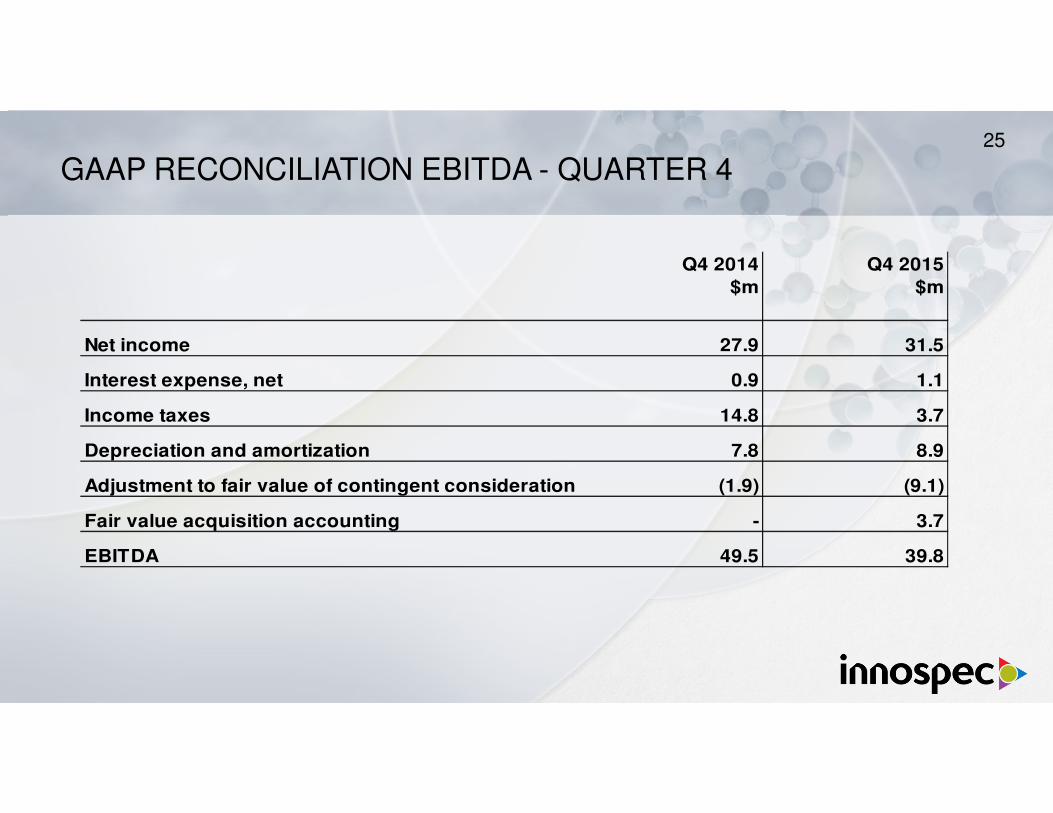
GAAP RECONCILIATION EBITDA - QUARTER 4
Q4 2014 Q4 2015
$m $m
Net income 27.9 31.5
Interest expense, net 0.9 1.1
Income taxes 14.8 3.7
Depreciation and amortization 7.8 8.9
Adjustment to fair value of contingent consideration (1.9) (9.1)
Fair value acquisition accounting - 3.7
EBITDA 49.5 39.8
25

GAAP RECONCILIATION EBITDA – FULL YEAR
2014 2015
$m $m
Net Income 84.1 119.5
Interest expense, net 3.4 4.0
Income taxes 26.8 32.8
Depreciation and amortization 28.4 34.0
Adjustment to fair value of contingent consideration (1.9) (40.7)
Fair value acquisition accounting - 3.7
EBITDA 140.8 153.3
26

GAAP RECONCILIATION: NET INCOME EXCLUDING SPECIAL ITEMS - QUARTER 4
Income before
income taxes Net income Diluted EPS
Income before
income taxes Net income Diluted EPS
$m $m $ $m $m $
Reported GAAP amounts 42.7 27.9 1.11 35.2 31.5 1.28
Adjustment to fair value of contingent consideration (1.9) (1.4) (0.06) (9.1) (5.6) (0.23)
Amortization of acquired intangible assets 4.1 3.0 0.12 4.3 3.4 0.14
Fair value acquisition accounting - - - 3.7 2.4 0.10
Foreign currency exchange losses/(gains) 0.4 0.3 0.01 (2.0) (1.5) (0.06)
Adjustment of income tax provisions 2.0 2.0 0.08 0.3 0.3 0.01
Acquisition-related costs 0.5 0.4 0.02 - - -
Adjusted non-GAAP amounts 47.8 32.2 1.28 32.4 30.5 1.24
Q4 2014 Q4 2015
27

GAAP RECONCILIATION: NET INCOME EXCLUDING SPECIAL ITEMS – FULL YEAR
Income before
income taxes Net income Diluted EPS
Income before
income taxes Net income Diluted EPS
$m $m $ $m $m $
Reported GAAP amounts 110.9 84.1 3.38 152.3 119.5 4.86
Adjustment to fair value of contingent consideration (1.9) (1.4) (0.06) (40.7) (24.2) (0.98)
Amortization of acquired intangible assets 14.0 10.5 0.42 17.0 13.3 0.54
Fair value acquisition accounting - - - 3.7 2.4 0.10
Adjustment of income tax provisions (1.9) (1.9) (0.07) (2.3) (2.3) (0.09)
Profit on disposal of subsidiary - - - (1.6) (1.6) (0.07)
Foreign currency exchange gains (1.8) (1.4) (0.06) - - -
Acquisition-related costs 1.8 1.4 0.06 - - -
Adjusted non-GAAP amounts 121.1 91.3 3.67 128.4 107.1 4.36
2014 2015
28