Embed Size (px)
Citation preview

Investor Presentation Quarter 3, 2016
Patrick S. WilliamsPresident & CEO
Ian CleminsonExecutive Vice President &
Chief Financial Officer
November 3, 2016

Forward-looking Statements2
This presentation contains certain "forward-looking statements" within the meaning of the Private
Securities Litigation Reform Act of 1995. All statements other than statements of historical facts includedor incorporated herein may constitute forward-looking statements. Such forward-looking statements
include statements (covered by words like “expects,” “estimates,” “anticipates,” “may,” “believes,” “feels” orsimilar words or expressions), for example, which relate to earnings, growth potential, operating
performance, events or developments that we expect or anticipate will or may occur in the future.Although forward-looking statements are believed by management to be reasonable when made, they are
subject to certain risks, uncertainties and assumptions, and our actual performance or results may differmaterially from these forward-looking statements. Additional information regarding risks, uncertainties
and assumptions relating to Innospec and affecting our business operations and prospects are describedin Innospec’s Annual Report on Form 10-K for the year ended December 31, 2015, Innospec’s Quarterly
Report on Form 10-Q for the quarter ended June 30, 2016 and other reports filed with the U.S. Securitiesand Exchange Commission. You are urged to review our discussion of risks and uncertainties that could
cause actual results to differ from forward-looking statements under the heading "Risk Factors” in suchreports. Innospec undertakes no obligation to publicly update or revise any forward-looking statements,
whether as a result of new information, future events or otherwise.
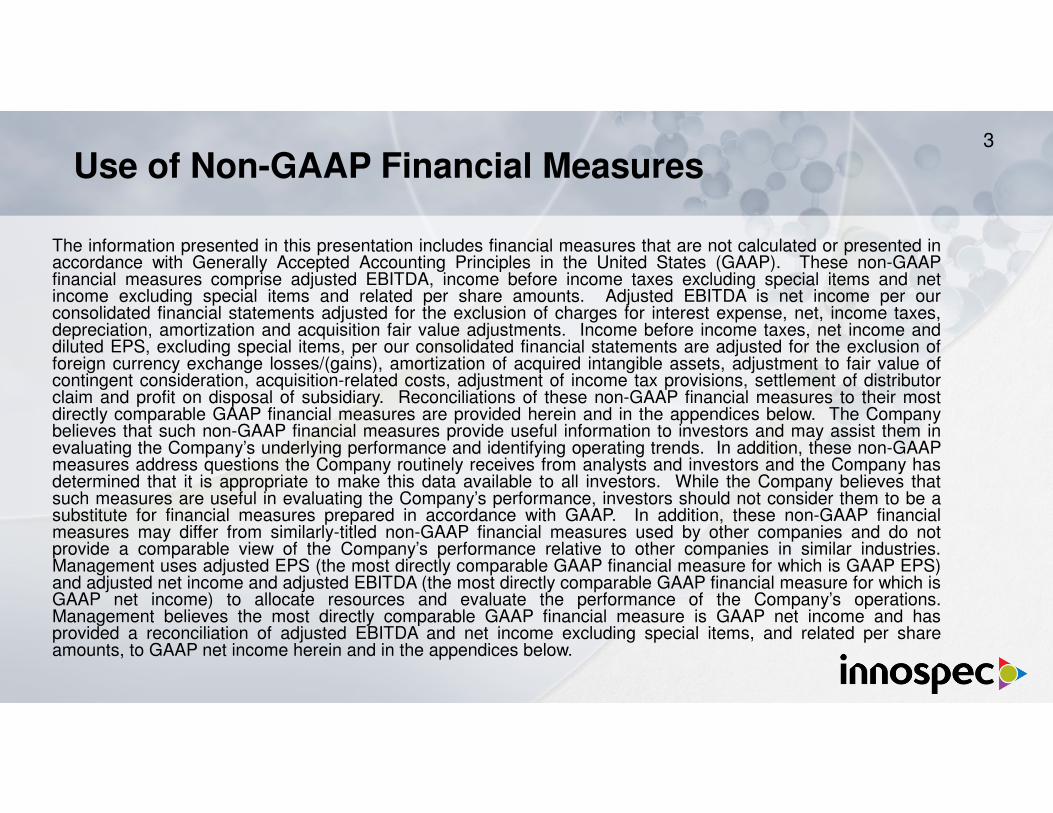
The information presented in this presentation includes financial measures that are not calculated or presented inaccordance with Generally Accepted Accounting Principles in the United States (GAAP). These non-GAAPfinancial measures comprise adjusted EBITDA, income before income taxes excluding special items and netincome excluding special items and related per share amounts. Adjusted EBITDA is net income per ourconsolidated financial statements adjusted for the exclusion of charges for interest expense, net, income taxes,depreciation, amortization and acquisition fair value adjustments. Income before income taxes, net income anddiluted EPS, excluding special items, per our consolidated financial statements are adjusted for the exclusion offoreign currency exchange losses/(gains), amortization of acquired intangible assets, adjustment to fair value ofcontingent consideration, acquisition-related costs, adjustment of income tax provisions, settlement of distributorclaim and profit on disposal of subsidiary. Reconciliations of these non-GAAP financial measures to their mostdirectly comparable GAAP financial measures are provided herein and in the appendices below. The Companybelieves that such non-GAAP financial measures provide useful information to investors and may assist them inevaluating the Company’s underlying performance and identifying operating trends. In addition, these non-GAAPmeasures address questions the Company routinely receives from analysts and investors and the Company hasdetermined that it is appropriate to make this data available to all investors. While the Company believes thatsuch measures are useful in evaluating the Company’s performance, investors should not consider them to be asubstitute for financial measures prepared in accordance with GAAP. In addition, these non-GAAP financialmeasures may differ from similarly-titled non-GAAP financial measures used by other companies and do notprovide a comparable view of the Company’s performance relative to other companies in similar industries.Management uses adjusted EPS (the most directly comparable GAAP financial measure for which is GAAP EPS)and adjusted net income and adjusted EBITDA (the most directly comparable GAAP financial measure for which isGAAP net income) to allocate resources and evaluate the performance of the Company’s operations.Management believes the most directly comparable GAAP financial measure is GAAP net income and hasprovided a reconciliation of adjusted EBITDA and net income excluding special items, and related per shareamounts, to GAAP net income herein and in the appendices below.
3
Use of Non-GAAP Financial Measures

Innospec – Summary of 3rd Quarter Performance
Underlying business performance is right on track
One-off charges & order phasing impact EPS in the short-term
Fuel Specialties – strong growth in operating margin
Performance Chemicals – innovation continues to drive great growth
Oilfield Services – break even with modest market recovery
Further increase in semi-annual dividend
Acquisition of Huntsman European surfactant business on track for Q4.
4

Ian CleminsonExecutive Vice President &
Chief Financial Officer
Financial Presentation

Q3 2016 Consolidated Results
Sales below a very strong comparative quarter (Octane Additives; Oilfield Services)
Order phasing in Oilfield and Fuel Specialties; Gross Margin Improvement
One-off costs impacting EPS
6
Q3 2015 Q3 2016 Growth
$m $m %
Net sales 254.2 205.5 (19)%
Gross profit 90.4 79.2 (12)%
Gross margin 35.6% 38.5% 2.9%pt
Operating income * 31.1 16.6 (47)%
Adjusted EBITDA 42.1 21.2 (50)%
EPS (diluted) 1.45 0.47 (68)%
EPS (adjusted) 1.18 0.78 (34)%
*Operating Income is before Fair Value Adjustments and Profit on Disposal of Subsidiary

Q3 2016 Fuel Specialties
Revenues lower in Americas, flat in EMEA, excellent growth in Asia Pacific
Richer mix drives higher gross margins
12% Growth in Operating Income
7
Q3 2015 Q3 2016 Growth
$m $m %
Net sales 121.3 114.4 (6)%
Gross profit 39.5 43.8 11%
Gross margin 32.6% 38.3% 5.7%pt
Operating income 21.6 24.1 12%
EBITDA 22.5 25.2 12%

Q3 2016 Performance Chemicals
Continued excellent growth, based on both existing and new products
Personal Care growth drives richer mix and improved margins
Business well positioned to combine with new acquisition
8
Q3 2015 Q3 2016 Growth
$m $m %
Net sales 33.7 36.8 9%
Gross profit 9.9 12.3 24%
Gross margin 29.4% 33.4% 4.0%pt
Operating income 3.6 4.2 17%
EBITDA 5.1 5.8 14%

Q3 2016 Oilfield Services
Business break-even in the quarter
Sales down on 2015 but up 7% sequentially on Q2
Customer activity picking up slowly
9
Q3 2015 Q3 2016 Growth
$m $m %
Net sales 78.9 49.7 (37)%
Gross profit 32.0 20.6 (36)%
Gross margin 40.6% 41.4% 0.8%pt
Operating income 7.2 - (100)%
EBITDA 11.7 4.6 (61)%

Q3 2016 Octane Additives
Sales down on very strong comparative quarter
Last portion of Algeria order delayed until October
No further visibility on orders
10
Q3 2015 Q3 2016 Growth
$m $m %
Net sales 20.3 4.6 (77)%
Gross profit 9.0 2.5 (72)%
Gross margin 44.3% 54.3% 10.0%pt
Operating income 8.0 1.9 (76)%
EBITDA 8.1 2.0 (75)%

Q3 2016 Corporate Items
Significant impact of one-off items on EPS
Underlying corporate costs in expected range
Tax rate for year expected to be 20%
11
Q3 2015 Q3 2016
$m $m
Corporate costs (9.3) (15.2)
Pension credit - 1.6
Adjustment to fair value of contingent consideration 8.5 2.3
Profit on disposal of subsidiary 1.6 -
GAAP effective tax rate 14.0% 13.6%

Q3 2016 Balance Sheet
Balance sheet remains very strong
$29.8 million of cash generation; net cash of $19.6 million
Further increase in semi-annual dividend
12
Q4 2015 Q3 2016$m $m
Total cash and cash equivalents 141.7 167.1
Total debt (136.1) (147.5)
Net cash 5.6 19.6
Total working capital 167.1 160.4

Patrick WilliamsPresident & CEO
Concluding Comments

Concluding Comments14
Business performance on-track
EPS impacted by one-off items
Business continues to grow and generate good cash
Acquisition from Huntsman – on track for Q4
Increase in semi-annual dividend
Very well placed for Quarter 4, and for 2017

Your Opportunity To Ask Questions

Final Comments16
Thanks to investors, customers and employees for their continued support
Q4 2016 results timetable (provisional)
Results announced after close on February 16, 2016
Conference Call at 10am ET on Friday February 17, 2016

Appendix

Innospec Income Statement - Quarter 318
Q3 2015 Q3 2016 Variance Pr. Yr.
$m $m $m
Net sales 254.2 205.5 (48.7)
Sales growth 11.4% (19.2)% N/A
Gross profit 90.4 79.2 (11.2)
Gross margin 35.6% 38.5% 2.9%pt
SAR expenses (59.3) (62.6) (3.3)
Operating income 31.1 16.6 (14.5)
Operating margin 12.2% 8.1% (4.1%)pt
Adjustment to fair value of contingent consideration 8.5 2.3 (6.2)
Profit on disposal of subsidiary 1.6 - (1.6)
Interest expense, net (1.0) (0.7) 0.3
Other net income/(expense) 1.2 (5.0) (6.2)
Income before income taxes 41.4 13.2 (28.2)
Income taxes (5.8) (1.8) 4.0
Net income 35.6 11.4 (24.2)
Adjusted EBITDA 42.1 21.2 (20.9)
Adjusted EBITDA margin 16.6% 10.3% (6.3%)pt

Innospec Income Statement - YTD19
2015 2016 Variance Pr. Yr.
$m $m $m
Net sales 766.3 645.6 (120.7)
Sales growth 14.3% (15.8%) N/A
Gross profit 259.7 240.9 (18.8)
Gross margin 33.9% 37.3% 3.4%pt
SAR expenses (170.9) (172.7) (1.8)
Operating income 88.8 68.2 (20.6)
Operating margin 11.6% 10.6% (1.0%)pt
Adjustment to fair value of contingent consideration 31.6 6.3 (25.3)
Profit/(loss) on disposal of subsidiary 1.6 (1.4) (3.0)
Interest expense, net (2.9) (2.2) 0.7
Other net (expense)/income (2.0) 3.2 5.2
Income before income taxes 117.1 74.1 (43.0)
Income taxes (29.1) (14.9) 14.2
Net income 88.0 59.2 (28.8)
Adjusted EBITDA 113.5 98.3 (15.2)
Adjusted EBITDA margin 14.8% 15.2% 0.4%pt

Fuel Specialties - Quarter 320
Q3 2015 Q3 2016 Variance Pr. Yr.
$m $m $m
Net sales 121.3 114.4 (6.9)
Sales growth (7.4%) (5.7%) N/A
Gross profit 39.5 43.8 4.3
Gross margin 32.6% 38.3% 5.7%pt
Selling (10.6) (11.4) (0.8)
Administrative (2.9) (4.1) (1.2)
Research (4.4) (4.2) 0.2
SAR expenses (17.9) (19.7) (1.8)
SAR % (14.8%) (17.2%) (2.4%)pt
Operating income 21.6 24.1 2.5
Operating income margin 17.8% 21.1% 3.3%pt
EBITDA 22.5 25.2 2.7
EBITDA margin 18.5% 22.0% 3.5%pt

Fuel Specialties - YTD21
2015 2016 Variance Pr. Yr.
$m $m $m
Net sales 386.6 367.1 (19.5)
Sales growth (5.7%) (5.0%) N/A
Gross profit 125.4 129.5 4.1
Gross margin 32.4% 35.3% 2.9%pt
Selling (32.1) (31.9) 0.2
Administrative (9.3) (12.2) (2.9)
Research (13.3) (13.2) 0.1
SAR expenses (54.7) (57.3) (2.6)
SAR % (14.1%) (15.6%) (1.5%)pt
Operating income 70.7 72.2 1.5
Operating income margin 18.3% 19.7% 1.4%pt
EBITDA 73.7 75.7 2.0
EBITDA margin 19.1% 20.6% 1.5%pt

Performance Chemicals - Quarter 322
Q3 2015 Q3 2016 Variance Pr. Yr.
$m $m $m
Net sales 33.7 36.8 3.1
Sales growth (27.1%) 9.2% N/A
Gross profit 9.9 12.3 2.4
Gross margin 29.4% 33.4% 4.0%pt
Selling (3.0) (4.6) (1.6)
Administrative (2.0) (2.1) (0.1)
Research (1.3) (1.4) (0.1)
SAR expenses (6.3) (8.1) (1.8)
SAR % (18.7%) (22.0%) (3.3%)pt
Operating income 3.6 4.2 0.6
Operating income margin 10.7% 11.4% 0.7%pt
EBITDA 5.1 5.8 0.7
EBITDA margin 15.1% 15.8% 0.7%pt

Performance Chemicals - YTD23
2015 2016 Variance Pr. Yr.
$m $m $m
Net sales 124.4 106.8 (17.6)
Sales growth (8.9%) (14.1%) N/A
Gross profit 33.3 34.4 1.1
Gross margin 26.8% 32.2% 5.4%pt
Selling (10.0) (12.2) (2.2)
Administrative (6.6) (5.4) 1.2
Research (3.6) (3.5) 0.1
SAR expenses (20.2) (21.1) (0.9)
SAR % (16.2%) (19.8%) (3.6%)pt
Operating income 13.1 13.3 0.2
Operating income margin 10.5% 12.5% 2.0%pt
EBITDA 17.8 18.0 0.2
EBITDA margin 14.3% 16.9% 2.6%pt

Oilfield Services - Quarter 324
Q3 2015 Q3 2016 Variance Pr. Yr.
$m $m $m
Net sales 78.9 49.7 (29.2)
Sales growth 119.8% (37.0%) N/A
Gross profit 32.0 20.6 (11.4)
Gross margin 40.6% 41.4% 0.8%pt
Selling (19.3) (16.8) 2.5
Administrative (4.6) (2.9) 1.7
Research (0.9) (0.9) -
SAR expenses (24.8) (20.6) 4.2
SAR % (31.4%) (41.4%) (10.0%)pt
Operating income 7.2 - (7.2)
Operating income margin 9.1% - (9.1%)pt
EBITDA 11.7 4.6 (7.1)
EBITDA margin 14.8% 9.3% (5.5%)pt

Oilfield Services - YTD25
2015 2016 Variance Pr. Yr.
$m $m $m
Net sales 216.3 132.4 (83.9)
Sales growth 136.4% (38.8%) N/A
Gross profit 82.4 52.1 (30.3)
Gross margin 38.1% 39.4% 1.3%pt
Selling (53.8) (48.7) 5.1
Administrative (12.4) (7.6) 4.8
Research (2.4) (2.9) (0.5)
SAR expenses (68.6) (59.2) 9.4
SAR % (31.7%) (44.7%) (13.0%)pt
Operating income 13.8 (7.1) (20.9)
Operating income margin 6.4% (5.4%) (11.8%)pt
EBITDA 27.0 6.4 (20.6)
EBITDA margin 12.5% 4.8% (7.7%)pt

Octane Additives - Quarter 3 26
Q3 2015 Q3 2016 Variance Pr. Yr.
$m $m $m
Net sales 20.3 4.6 (15.7)
Sales growth 34.4% (77.3%) N/A
Gross profit 9.0 2.5 (6.5)
Gross margin 44.3% 54.3% 10.0%pt
Selling (0.4) (0.2) 0.2
Administrative (0.6) (0.4) 0.2
SAR expenses (1.0) (0.6) 0.4
SAR % (4.9%) (13.0%) (8.1%)pt
Operating income 8.0 1.9 (6.1)
Operating income margin 39.4% 41.3% 1.9%pt
EBITDA 8.1 2.0 (6.1)
EBITDA margin 39.9% 43.5% 3.6%pt

Octane Additives - YTD 27
2015 2016 Variance Pr. Yr.
$m $m $m
Net sales 39.0 39.3 0.3
Sales growth 20.7% 0.8% N/A
Gross profit 18.6 24.9 6.3
Gross margin 47.7% 63.4% 15.7%pt
Selling (1.1) (0.7) 0.4
Administrative (1.6) (1.7) (0.1)
SAR expenses (2.7) (2.4) 0.3
SAR % (6.9%) (6.1%) 0.8%pt
Operating income 15.9 22.5 6.6
Operating income margin 40.8% 57.3% 16.5%pt
EBITDA 16.2 22.9 6.7
EBITDA margin 41.5% 58.3% 16.8%pt
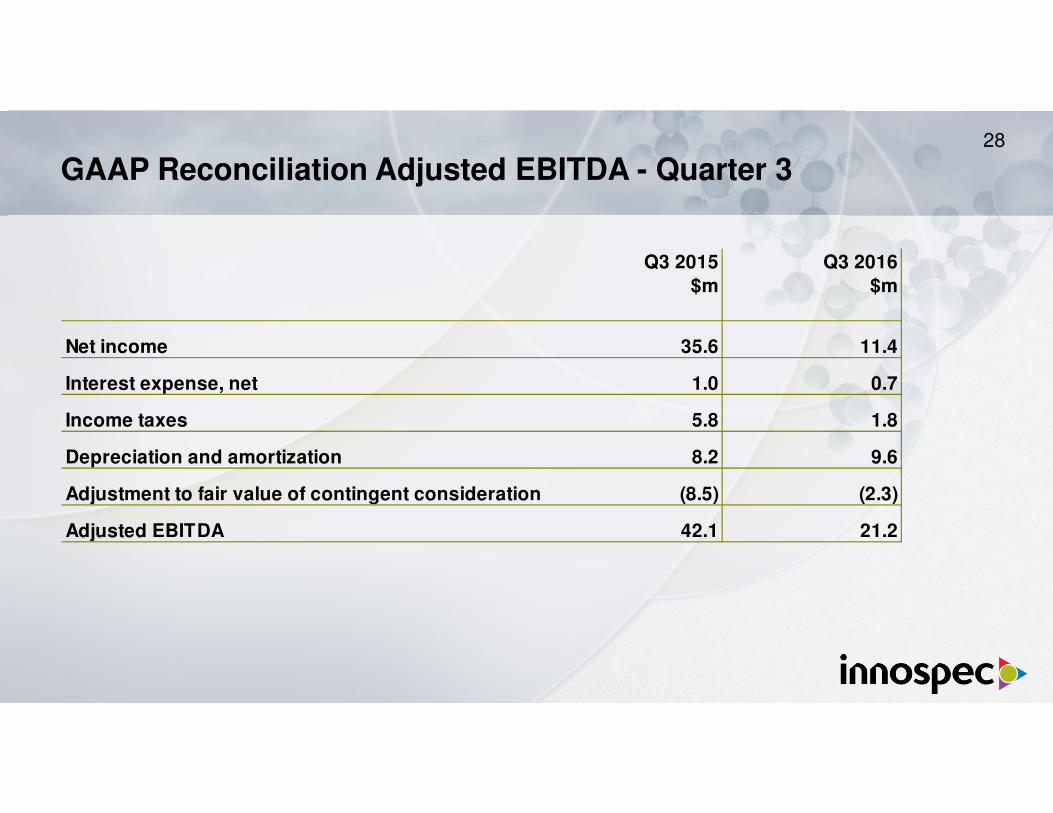
GAAP Reconciliation Adjusted EBITDA - Quarter 328
Q3 2015 Q3 2016
$m $m
Net income 35.6 11.4
Interest expense, net 1.0 0.7
Income taxes 5.8 1.8
Depreciation and amortization 8.2 9.6
Adjustment to fair value of contingent consideration (8.5) (2.3)
Adjusted EBITDA 42.1 21.2

GAAP Reconciliation Adjusted EBITDA - YTD29
2015 2016
$m $m
Net Income 88.0 59.2
Interest expense, net 2.9 2.2
Income taxes 29.1 14.9
Depreciation and amortization 25.1 28.3
Adjustment to fair value of contingent consideration (31.6) (6.3)
Adjusted EBITDA 113.5 98.3

GAAP Reconciliation: Net Income Excluding Special Items - Quarter 330
Income before
income taxes Net income Diluted EPS
Income before
income taxes Net income Diluted EPS
$m $m $ $m $m $
Reported GAAP amounts 41.4 35.6 1.45 13.2 11.4 0.47
Foreign currency exchange (gains)/losses (1.2) (0.9) (0.04) 5.0 4.3 0.18
Amortization of acquired intangible assets 4.3 3.4 0.14 4.3 3.7 0.15
Adjustment to fair value of contingent consideration (8.5) (4.8) (0.20) (2.3) (1.4) (0.06)
Acquisition-related costs - - - 1.7 1.7 0.07
Adjustment of income tax provisions (2.7) (2.7) (0.11) (1.2) (1.2) (0.05)
Settlement of distributor claim - - - 1.0 0.6 0.02
Profit on disposal of subsidiary (1.6) (1.6) (0.06) - - -
Adjusted non-GAAP amounts 31.7 29.0 1.18 21.7 19.1 0.78
Q3 2015 Q3 2016