Embed Size (px)
Citation preview

Investor Presentation March-2014
1
IMPORTANT NOTICE
2
No representation or warranty, express or implied is made as to, and no reliance should be placed on, thefairness, accuracy, completeness or correctness of such information or opinions contained herein. The informationcontained in this presentation is only current as of its date. Certain statements made in this presentation may not bebased on historical information or facts and may be “forward looking statements”, including those relating to theCompany’s general business plans and strategy, its future financial condition and growth prospects, and futuredevelopments in its industry and its competitive and regulatory environment. Actual results may differ materially fromthese forward-looking statements due to a number of factors, including future changes or developments in theCompany’s business, its competitive environment and political, economic, legal and social conditions in India. Thiscommunication is for general information purpose only, without regard to specific objectives, financial situations andneeds of any particular person. This presentation does not constitute an offer or invitation to purchase or subscribe forany shares in the Company and neither any part of it shall form the basis of or be relied upon in connection with anycontract or commitment Important Notice whatsoever. The Company may alter, modify or otherwise change in anymanner the content of this presentation, without obligation to notify any person of such revision or changes. Thispresentation can not be copied and/or disseminated in any manner.
2

Table of Contents
3
• Overview • Snapshot • Transformation• Strategy
• Business Performance • Financial Highlights • Results
• Network• Shareholders• Accolades

Snapshot
4
Last 5 year CAGR: 17% business; PAT CAGR of 17%; Improving asset yield as bank builds fee income streams in addition to interest income
Higher asset quality; GNPA at 1.19%, NNPA 0.78%
Mr. Amitabha Guha , Non Exec, Chairman (ex-Dy MD of SBI, ex MD -SBT, SBH)Proactive management led by Dr. V. A. Joseph, well supported by 1 Executive vicepresident, 2 Executive Directors, 2CGMs and 9 GMs – 8 GMs life time bankers at thebank
Young workforce (avg. age of 34 years) with continuity of management2 CEOs in the last decade
85 year old franchise; Leading position in Kerala; Expanding fast outside
Strong protection of stakeholder interestStock return of 595% since IPO
Growth and Profitability
Quality
Board and Management
Building for future
Track record
Stakeholder value

5
Significant Transformation Since 2010
2.77
3.063.10
3.21
3.02
2.50
2.60
2.70
2.80
2.90
3.00
3.10
3.20
3.30
Mar-10 Mar-11 Mar-12 Mar-13 Mar-14
NIM
1.071.05
1.12
1.17
1.00
0.90
0.95
1.00
1.05
1.10
1.15
1.20
Mar-10 Mar-11 Mar-12 Mar-13 Mar-14
RoAA
47.1446.82
48.65
47.48
49.96
45.0045.5046.0046.5047.0047.5048.0048.5049.0049.5050.0050.50
Mar-10 Mar-11 Mar-12 Mar-13 Mar-14
Cost to Income
0.390.29 0.28
0.78 0.78
0.000.100.200.300.400.500.600.700.800.90
Mar-10 Mar-11 Mar-12 Mar-13 Mar-14
Net NPA
Strategy
6
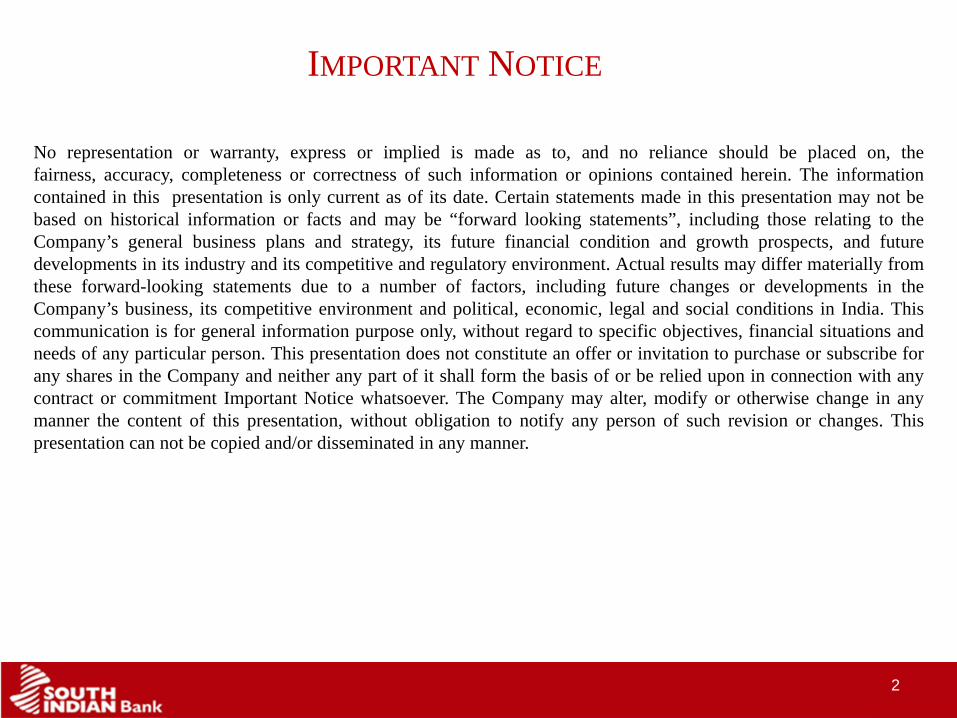
50 addition to branches, 250 ATM additions per yearProportion of branches outside Kerala : 1:1Second largest player in Kerala among private banks
Priority banking in 80 centers; NRE banking to attract depositsCASA ratio to increase 1% per annumCost/Income to decline 1% per annum
35% from wholesale banking ; 30% from SME and 35% from retail by FY17Credit growth rate of 25% till FY15; NIM to be maintained in 3% rangeFee income to be increased by 10%NNPA to be under 1.0%
Strong distribution network
Low cost liabilities and Cost/Income
Growth with quality

Business Performance
7

8
Financial Highlights – As on March 2014
8
Rs. In Crore
Q4 FY 14 Q4 FY 13 Y-o-Y (%) Q3 FY 14 Q-o-Q (%)
Capital & LiabilitiesCapital 134.39 133.85 0.40 134.22 0.13Reserves & Surplus 3,233.65 2,869.76 12.68 3,238.53 -0.15Deposits 47,491.09 44,262.30 7.29 44,645.16 6.37Borrowings 2,730.78 1,284.56 112.58 1,917.25 42.43Other Liabs. &Provisions 1,396.05 1,244.56 12.17 1,082.11 29.01
Total 54,985.96 49,795.03 10.42 51,017.27 7.78AssetsCash & Balances with RBI 2,200.81 1,696.70 29.71 2090.15 5.29Balances with Banks 1,017.12 2,639.20 -61.46 1014.29 0.28Investments 14,351.78 12,523.47 14.60 13423.10 6.92Advances 36,229.85 31,815.53 13.87 33321.84 8.73Fixed Assets 412.20 396.12 4.06 405.25 1.71Other Assets 774.20 724.01 6.93 762.63 1.52Total 54,985.96 49,795.03 10.42 51017.27 7.78Business (Advances+Deposit) 83,720.95 76,077.83 10.05 77967.00 7.38
Balance Sheet Overview

9
Result Review
9
Rs. In Crore
Q4FY14 Q4FY13 Y-o-Y (%) Q3FY14 Q-o-Q (%)Net Interest Income 364.68 333.70 9.28 350.47 4.05Other Income 96.58 120.96 -20.16 84.62 14.13Total Income 461.26 454.66 1.45 435.09 6.01Operating Expenses 256.34 248.56 3.13 219.20 16.94Operating Profit 204.92 206.10 -0.57 215.89 -5.08
Provisions & Contingencies 28.28 65.89 -57.08 74.58 -62.08Profit before Tax 176.64 140.21 25.98 213.86 -17.40Provision for Tax 52.04 -13.62 -482.09 72.55 -28.27Profit after Tax 124.60 153.83 -19.00 141.31 -11.83
Profit and Loss Account (Quarter Alone)

10
Performance Highlights Mar-13 Jun-13 Sep-13 Dec-13 Mar-14
CRAR Basel 2 (%) 13.9% 13.7% 13.2% 12.4% 12.5%RoAA (Annualised) 1.2% 0.9% 1.0% 1.0% 1.0%NIM (%) 3.2% 2.9% 3.1% 3.0% 3.0%Gross NPA (%) 1.3% 1.6% 1.9% 1.7% 1.2%Net NPA (%) 0.8% 1.1% 1.4% 1.2% 0.8%Provision Coverage 53.2% 57.9% 53.5% 55.8% 62.7%CASA % 18.6% 20.6% 21.3% 21.2% 20.7%
Other Performance Highlights
10
11
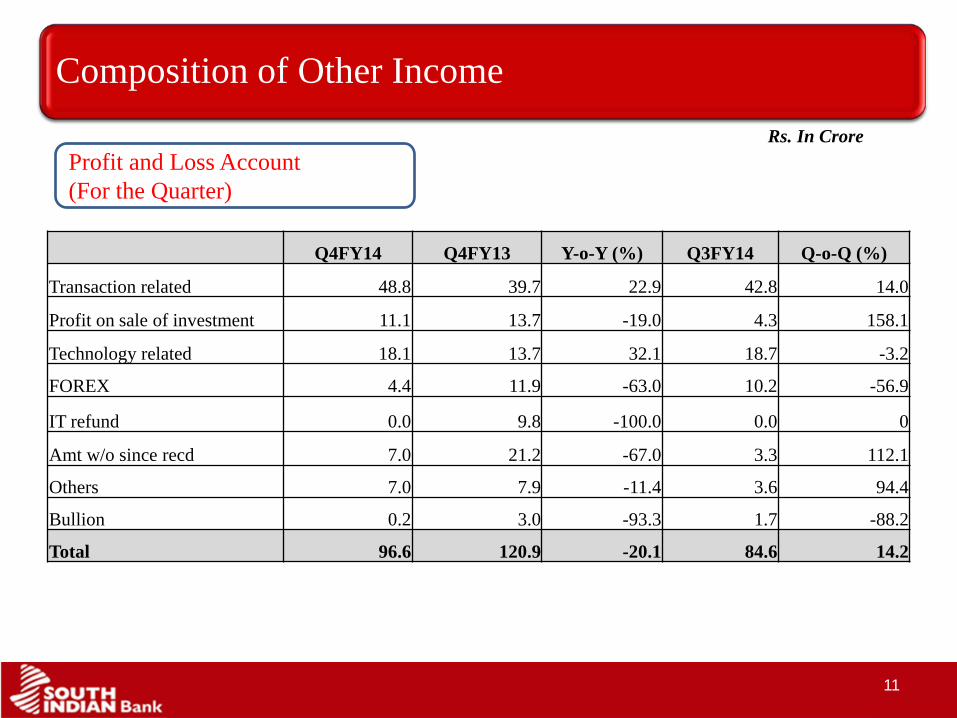
Composition of Other Income
11
Composition of Other Income
Q4FY14 Q4FY13 Y-o-Y (%) Q3FY14 Q-o-Q (%)
Transaction related 48.8 39.7 22.9 42.8 14.0
Profit on sale of investment 11.1 13.7 -19.0 4.3 158.1
Technology related 18.1 13.7 32.1 18.7 -3.2
FOREX 4.4 11.9 -63.0 10.2 -56.9
IT refund 0.0 9.8 -100.0 0.0 0
Amt w/o since recd 7.0 21.2 -67.0 3.3 112.1
Others 7.0 7.9 -11.4 3.6 94.4
Bullion 0.2 3.0 -93.3 1.7 -88.2
Total 96.6 120.9 -20.1 84.6 14.2
Rs. In CroreProfit and Loss Account (For the Quarter)

12
Trend in Cost of Deposits
Trend in Cost & Yield (Annualized)
Trend in Yield on Advances
12.72
12.36 12.38 12.36 12.37
10.00
11.00
12.00
13.00
14.00
15.00
Mar-13 June-13 Sept-13 Dec-13 Mar-14
YOA
8.29
8.17
8.078.11 8.13
7.70
8.00
8.30
8.60
Mar-13 June-13 Sept-13 Dec-13 Mar-14
COD

13
Break-up of Provision
13
Particulars Q4 FY 14 Q4 FY13 Q3 FY 14
For NPA advance -0.3 42.1 -10.7
For Depreciation on Investments -8.7 9.7 -3.6
For standard assets & others 36.49 14.2 7.7
For Restructured advances 0.8 -0.1 8.6
Taxes 52.01 -13.63 72.6
Total Provisions and Contingencies 80.3 52.3 74.6
Rs. In Crore(Quarter alone)

14
Composition of Loan Book
10229 9006 7891
4551 746010298
1269315548
18214
0
5000
10000
15000
20000
25000
30000
35000
40000
Mar'12 Mar'13 Mar'14
Retail Adv SME & Agri Corporate
Rs. In Crore
3728 22
17
23 28
4649 50
0
20
40
60
80
100
120
Mar'12 Mar'13 Mar'14
Retail Adv SME & Agri Corporate
In %
Retail Advance - exposure less than Rs. 5 Crore

15
Advances – Composition (Mar 2014)
Rs. In Crore
Sl.no Advance Total 31.03.2013 31.03.2014
1 Agri & MSME 7,460 10,298
2 Retail 9,006 7,891
3 Corporate 15,548 18,214
Gross Advance 32,014 36,403
Sl.no Agri & MSME Break up 31.03.2013 31.03.2014
1 Agri General 1,368 1,732
2 Agri Gold 892 1,262
3 MSE General 4,103 5,436
4 MSE Gold 448 1,073
5 Medium Enterprise General 649 795
Total 7,460 10,298

16
Advances – Composition (Mar 2014)......(contd)
Sl.no Retail Advances-Break up 31.03.2013 31.03.20141 Gold 5,583 3,9402 Fully Secured loan against deposit 624 6783 Housing 1,232 1,5314 Vehicle 148 1435 Education 117 1436 Personal & Consumer Credit 111 1547 Other Retail 1,191 1,301
Total 9,006 7,891
Sl.no Corporate Advances-Break up 31.03.2013 31.03.20141 Food Credit 555 6142 Infrastructure 4,805 5,2083 Textile Manufacturing 481 5304 Metal and Metal Manufacturing 1,250 1,4655 Other Manufacturing 2,981 3,3936 NBFC/SFC/MFI/HFI 2,720 3,4617 Traders 976 1,1898 Other Corporate 1,780 2,353
Total 15,548 18,214
Rs. In Crore

Strong Core Capital (Tier 1 & Tier 2 CRAR)
17
Strong Core Capital. Low Dependence on Capital Instruments
BASEL II Figures
13.66 13.16 12.35 12.35 12.5312.05 11.84 11.40 10.68 10.89
0.00
2.00
4.00
6.00
8.00
10.00
12.00
14.00
16.00
Mar-13 June-13 Sept-13 Dec-13 Mar-14
CRAR CORE-CRAR
BASEL IIICRAR CORE CRAR
12.42 10.79

18
Branch Network
No. of Branches
North 49
South 667
East 27
West 57
Total 800
Target 1:1 Outside Kerala

19
Branch Network Distribution
STATENo. of
Branches STATE/UTNo. of
BranchesKerala 437 Jharkhand 2
Tamil Nadu 138 Madhya Pradesh 2Andhra Pradesh 49 Orissa 2
Karnataka 43 Pondicherry 2Maharashtra 28 Rajasthan 2
Delhi 25 Bihar 1Gujarat 18 Chandigarh 1
West Bengal 16 Himachal Pradesh 1Uttar Pradesh 9 Jammu & Kashmir 1
Goa 5 Meghalaya 1Haryana 4 Mizoram 1Punjab 4 Nagaland 1
Chattisgarh 3 Tripura 1Assam 2 Uttaranchal 1

20
Strong Retail Franchise
Total Branch NetworkTotal ATM Network
ATM : Branch ratio above 1.0x
373489
663
800
1000
0
200
400
600
800
1000
1200
Mar-10 Mar-11 Mar-12 Mar-13 Mar-14
580641
700750
800
0
100
200
300
400
500
600
700
800
900
Mar-10 Mar-11 Mar-12 Mar-13 Mar-14

21
Ownership Profile
Major Institutional Shareholders (%)
Public, 34.28
Domestic 9.67NRI,
5.21
FII, 41.69
Corp & Banks, 8.51
Others, 0.65
Strong Institutional Ownership
1 IFCI LTD 4.96
2 FIRST CARLYLE VENTURESMAURITIUS 4.95
3 INDIA CAPITAL FUND LIMITED 4.65
4 LIFE INSURANCE CORPORATIONOF INDIA 4.45
5 GKFF VENTURES 4.22
6 MULTIPLES PRIVATE EQUITY FII I 4.03
7 CX SECURITIES LIMITED 3.34
8JM FINANCIAL TRUSTEECOMPANY PVT LTD - JMFINANCIAL INDIA FUND III
3.31
9 YUSUFFALI MUSALIAM VEETTILABDUL KADER . 2.98
10 DEUTSCHE SECURITIESMAURITIUS LIMITED 2.65

Recognitions
22
TECHNOLOGY EXCELLENCE AWARD 2011-12 FROM IDRBT
SOUTH INDIAN BANK BAGS FIRST MASTERCARD INNOVATION AWARD FOR ACTIVATION AND USAGE PROGRAM
SOUTH INDIAN BANK, WINS 4 COVETED NATIONAL AWARDS IN MID-SIZED BANK CATEGORY-1. BEST BANKER AWARD, 2. BEST PRIVATE SECTOR BANKER AWARD, 3. BEST BANKER- ALL ROUND EXPANSION AWARD AND 4. BEST BANKER - EFFICIENCY AND PROFITABILITY
AWARD, IN THE SUNDAY STANDARD BEST BANKERS -2013 AWARDS INSTITUTED BY THE NEW INDIAN EXPRESS GROUP.
“BUSINESS TODAY” HAS ADJUDGED MANAGING DIRECTOR & CEO, DR.V.A.JOSEPH AS ONE AMONG INDIA’S TOP 100 CEOS