Embed Size (px)
Citation preview

INVESTOR PRESENTATION Q3FY17

©2016 Xactly Corporation. All rights reserved.
This presentation and other items we publish, including through social media outlets, may contain “forward-looking” statements that are based on our management’s current
expectations and projections about future events and trends that we believe may affect our business, financial condition, operating results and growth prospects. Forward-looking
statements include all statements other than statements of historical fact contained in this presentation, including information relating to future events or our future financial or
operating performance, such as our future product release dates. Forward-looking statements are subject to substantial risks, uncertainties and other factors, including: our future
financial performance, including our expectations regarding our revenue, cost of revenue, gross profit or gross margin, operating expenses, ability to generate cash flow and ability to
achieve and maintain positive cash flow from operations or future profitability; our ability to anticipate market needs and timely develop new and enhanced solutions and services to
meet those needs, and our ability to successfully monetize them; the evolution of technology affecting our solutions, services and markets; the impact of competition in our industry
and innovation by our competitors; the anticipated trends, growth rates and challenges in our business and in the markets in which we operate; the effects of seasonal trends on our
operating results; maintaining and expanding our customer base and our relationships with other companies; our liquidity and working capital requirements; our anticipated growth
and growth strategies and our ability to effectively manage that growth and effect these strategies; our ability to sell our solutions and expand internationally; our failure to anticipate
and adapt to future changes in our industry; our reliance on our third-party service providers; the impact of any failure of our solutions; our ability to hire and retain necessary
qualified employees to expand our operations; our ability to adequately protect our intellectual property; the anticipated effect on our business of litigation to which we are or may
become a party; our ability to stay abreast of new or modified laws and regulations that currently apply or become applicable to our business both in the U.S. and internationally; the
increased expenses and administrative workload associated with being a public company; our ability to maintain an effective system of internal controls necessary to accurately report
our financial results and prevent fraud; the estimates and estimate methodologies used in preparing our consolidated financial statements; and the future trading prices of our
common stock and the impact of securities analysts’ reports on these prices. These factors, together with those that may be described in greater detail in the company’s filings with
the Securities and Exchange Commission (“SEC”), may cause our actual results, events, or circumstances to differ materially from those described in our forward-looking statements.
All such filings are available on the SEC Filings section of the Investor page of our website at http://investors.xactlycorp.com. You should not rely upon forward-looking statements as
predictions of future events. Our forward-looking statements relate only to events as of the date on which the statements are made. We undertake no obligation to update any
forward-looking statements to reflect events or circumstances after the date of this presentation or to reflect new information or the occurrence of unanticipated events, except as
required by law. In addition to financial measures prepared in accordance with generally accepted accounting principles in the United States (“U.S. GAAP”), this website and other
items we publish may include certain non-GAAP financial measures. We believe that these non-GAAP financial measures are useful as a supplement in evaluating our ongoing
operational performance and enhancing an overall understanding of our past financial performance. The non-GAAP financial measures included in this website and other items we
publish should not be considered in isolation from, or as a substitute for, financial information prepared in accordance with U.S. GAAP. A reconciliation between each non-GAAP
financial measure and its nearest GAAP equivalent is included.
SAFE HARBOR
2

© 2016 Xactly Corporation. All rights reserved. 3
COMPANY OVERVIEW
Leading provider of cloud-based incentive compensation solutions
for employee and sales performance management
Company founded in 2005
870 customers worldwide*
More than 450 employees
Locations in San Jose, Denver, Washington D.C., UK, and India
* As of January 31, 2016
©2016 Xactly Corporation. All rights reserved.
4.5
©2016 Xactly Corporation. All rights reserved. 4©2016 Xactly Corporation. All rights reserved.

© 2016 Xactly Corporation. All rights reserved. 5
INVESTMENT HIGHLIGHTS
annual recurring total
addressable market 1
$7billion
revenue retention
for FY16
of empirical data
used to create
unique insights
basis points increase
in EBITDA margin
Q3FY17 over Q3FY16
cloud-based
multi-tenant SaaS
architecture
subscription
revenue CAGRsubscriber
CAGR
1,600 11 years 105%
35% 29% 100%
1: TAM for 2014. See slide 9 for full analysis.
©2016 Xactly Corporation. All rights reserved.

©2016 Xactly Corporation. All rights reserved. 6
ANNUAL REVENUE SUMMARY
28% CAGR
Dollars in Millions
FY13 FY14 FY15 FY16
$36.3
$47.2
$61.1
$76.0
9%
91%
BY SEGMENT
10%
90%
BY GEOGRAPHY
ROW U.S.SMB Mid-Market/Enterprise
Segment and geography breakdowns are as of Jan 31, 2016.

©2016 Xactly Corporation. All rights reserved. 7
ANNUAL SUBSCRIBERS SUMMARY
35% CAGR
1/31/13 1/31/14 1/31/15 1/31/16
108,000
140,000
194,000
266,000
31%
69%
BY GEOGRAPHY
26%
74%
BY EMPLOYEE TYPE
Non-Sales SalesROW U.S.
Segment and geography breakdowns are as of Jan 31, 2016.
As of:

©2016 Xactly Corporation. All rights reserved. 8
THE CURRENT PARADIGM
29.6 million sales people in the U.S. and E.U.
85% of businesses use spreadsheets or
homegrown systems to calculate incentives
$800B paid annually to sales people in
the U.S. alone
Significant error rates associated with
spreadsheets
Lost productivity due to lack of
visibility and rep shadow accounting
Rep turnover due to lack of trust in
the system
RESULTS IN

©2016 Xactly Corporation. All rights reserved. 9
1: Sales and related occupations in the US in 2013 2: Source: U.S. Bureau of Labor Statistics in 2013 3: Source: ICF and Cedefop for the European Commission 4: Average subscription revenue per subscriber in
FY15
SIGNIFICANT MARKET OPPORTUNITY
Does not include non-sales professional services and ROW
©2016 Xactly Corporation. All rights reserved.

©2016 Xactly Corporation. All rights reserved. 10
LEADING COMPANIES TRUST XACTLY

©2016 Xactly Corporation. All rights reserved.
Xactly Big Data PlatformMBOs
Compensation Benchmarks
Quota Coaching
Analytics
11©2016 Xactly Corporation. All rights reserved.

©2016 Xactly Corporation. All rights reserved. 12
AUTOMATE
MITIGATE ERRORSSignificantly reduce costly errors associated with
manual processes.
REDUCE ADMINAlleviate pressure on resource constrained
compensation team and allow them to be more
strategic.
REDUCE RISKEnable traceability, audit, forecast, accruals and single
source of truth for data.
Business Case Impact
Automate
Compensation Big Data PlatformROI

©2016 Xactly Corporation. All rights reserved. 13
MOTIVATE
MOBILEKeep reps engaged with their incentives in real-time.
ALIGNMENTEnsure your incentives align with your business goals
and improve rep quota attainment.
REDUCE SHADOW ACCOUNTINGBy eliminating reps’ mistrust in their commissions
system, they can spend more time selling.
Business Case Impact
Motivate
Compensation Big Data PlatformROI

©2016 Xactly Corporation. All rights reserved. 14
OPTIMIZE
COMPAREUse industry benchmarks to reveal the truth about how comp
plans stack up compared to peer companies. Pay
competitively.
PERFORMANCEDiscover how reps perform compared to the rest of the
industry.
ATTRACT AND RETAINLearn how incentives are tied to attracting and retaining top
sales performers.
Optimize
Compensation Big Data PlatformROI
Business Case Impact

©2016 Xactly Corporation. All rights reserved. 15
WORLD-CLASS PARTNERS
Platform Partners
Referral Partners
Consulting and Implementation Partners
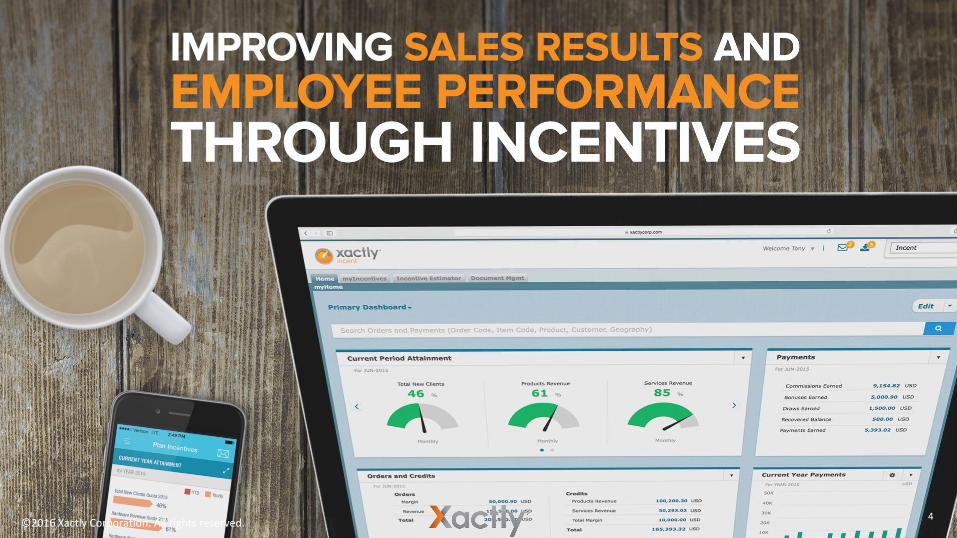
© 2016 Xactly Corporation. All rights reserved. 16
Longest standing customer
Invested in 2010
Xactly is an AppExchange Customer Choice
Award winner
>50% of our customer base uses Salesforce
©2016 Xactly Corporation. All rights reserved.
©2016 Xactly Corporation. All rights reserved.
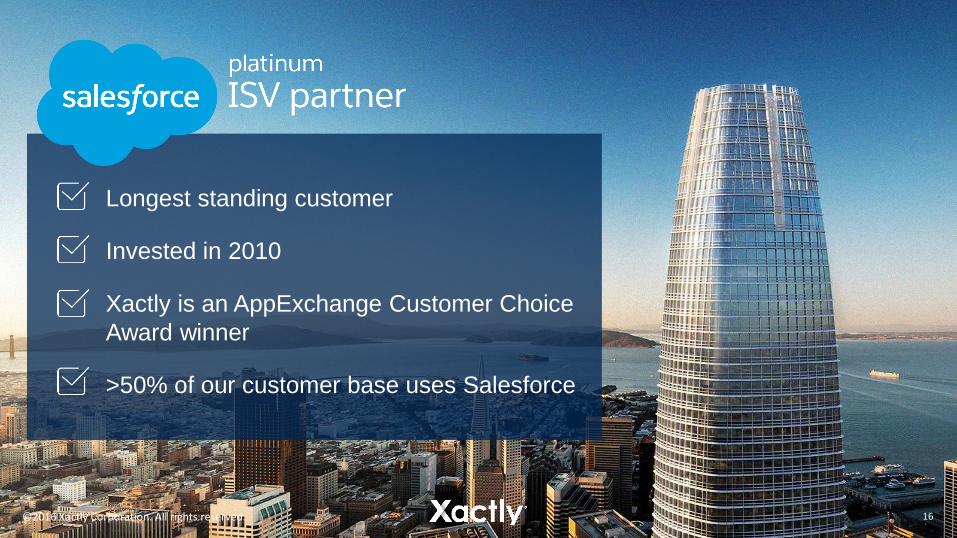
PayrollCeridian, ADP, Paychex
MobileReal-time Visibility for Reps
Xactly Insights™Benchmarks & Best Practices
17
BENCHMARKS AND INSIGHTS DERIVED FROM RICH
DATA SOURCES
©2016 Xactly Corporation. All rights reserved.

©2016 Xactly Corporation. All rights reserved. 18
Xactly Insights™
Unique and Growing Empirical Data
~8 BILLIONTransactions
per Quarter
11 YEARSof Data from a
Cross Section of
Industries
Anonymized
and
Aggregated
$20 BILLIONin Incentive
Payments in the
Last Two Years
©2016 Xactly Corporation. All rights reserved.

©2016 Xactly Corporation. All rights reserved.
Team Mix
Best performing companies have
only 5 people credited per deal
Most successful team mix
• 1 Account Executive
• 1 Solutions Consultant
• 2 Sales Managers
• 1 Sales Executive
HOW DATA HELPS YOU PAY PRECISELY
©2016 Xactly Corporation. All rights reserved.

©2016 Xactly Corporation. All rights reserved. 20
GARTNER RECOGNIZES XACTLY AS A LEADER IN SPM FOR THE
THIRD TIME IN A ROW
“Xactly received the highest customer
satisfaction scores of the leading SPM vendors
in terms of revenue.”
“Clients commended the quality of its customer
support, customer advisory board and
commitment to deploying enhancements
submitted by customers.”
“By deploying new functions every month, Xactly
has one of the strongest product release
schedules in the SPM market.”

©2016 Xactly Corporation. All rights reserved. 21
GROWTH DRIVERS
Acquire new customers
Sell more subscriptions and modules to
our existing customer base
Enhance existing offerings and develop
new solutions
Expand internationally
Grow our partner ecosystem
Monetize big data insights
©2016 Xactly Corporation. All rights reserved.

© 2016 Xactly Corporation. All rights reserved. 22
EXPERIENCED MANAGEMENT TEAM
Christopher W. Cabrera
Founder & CEOL. Evan Ellis Jr.
President & COOJoe Consul
CFO
Desta Price
SVP, Products
& Education
Ron Rasmussen
CTO & SVP Engineering
Colleen Pouliot
General Counsel &
Secretary
Nitin Mathur
VP, Professional Services
Sean Murray
VP, General Business
Sales
Robert Blohm
VP, Strategic Services
Steve De Marco
VP, Worldwide
Sales & Alliances
Dan Welch
VP, Enterprise Sales
Steve Giusti
VP, Corporate Controller
Leanne Bernhardt
VP, Human Resources
Erik Charles
VP, Product Marketing
Bernie Kassar
Chief Customer Officer
Micheline Nijmeh
Chief Marketing Officer
100+ Years in the Compensation Automation Space
©2016 Xactly Corporation. All rights reserved.

©2016 Xactly Corporation. All rights reserved. 23
FINANCIAL HIGHLIGHTS
• Strong topline growth
• Highly visible and recurring subscription revenue
• Revenue retention rates consistently 100%+
• Gross margin improving with scale
• Investing in growth
• No significant customer concentration

©2016 Xactly Corporation. All rights reserved. 24
STRONG TOPLINE GROWTH
Subscription services revenue
Professional services revenue
FY13 FY14 FY15
$76.028% CAGR
$36.3
$47.2
$61.1
8.8
27.5
35.9
11.3
47.3
13.8
59.2
16.8
FY16
Note: Values in millions; Fiscal year-end January 31
Q3 FY16
3.9
15.2
$19.1
Q3 FY17
5.5
18.5
$23.9
+25%

©2016 Xactly Corporation. All rights reserved. 25
STRONG CALCULATED BILLINGS1 GROWTH
35.9
Note: Values in millions; Fiscal year-end January 31
1 Calculated billings defined as revenue plus the change in deferred revenue in the period; Refer to appendix for reconciliation
$40.4
$55.5
$65.7
$86.3
FY13 FY14 FY15 FY16
29% CAGR
$21.5
$25.8
Q3FY16 Q3FY17
+20%

©2016 Xactly Corporation. All rights reserved. 26
RECURRING REVENUE MODEL WITH HIGH VISIBILITY
SUBSCRIPTION REVENUE REVENUE RETENTION RATE
FY13 FY14 FY15 FY13 FY14 FY15FY16
$27.5
$35.9
$47.3
$59.2
29% CAGR
FY16
102% 102%
104%105%
Note: Values in millions; Fiscal year-end January 31

©2016 Xactly Corporation. All rights reserved. 27
LAND AND EXPANDRepresentative examples of ARR growth after initial purchase.
LARGE SOFTWARE COMPANY
YR 1 YR 2 YR 3 YR 4 YR 5 YR 1 YR 2 YR 3 YR 4 YR 5
$122K
$235K
$477K
$888K
$1,170K
LEADING MEDIA COMPANY
LARGE SOFTWARE COMPANYLARGE IT COMPANY
$90K
$254K$305K
$550K
$795K
YR 1 YR 2 YR 3 YR 4 YR 5
$156K
$242K
$402K$422K
$447K
YR 1 YR 2 YR 3 YR 4 YR 5
$352K
$458K
$590K$610K
$730K

©2016 Xactly Corporation. All rights reserved. 28
STRONG SUBSCRIBER GROWTH
JAN 31,
2013
JAN 31,
2014
JAN 31,
2015
JAN 31,
2016
108,000
140,000
194,000
266,000
35% CAGR
Note: Subscribers rounded to nearest thousand
+22%
OCT 31,
2015OCT 31,
2016
235,000
287,000

©2016 Xactly Corporation. All rights reserved. 29
ATTRACTIVE LONG-TERM OPERATING MODEL
Note: Metrics are Non-GAAP and exclude stock-based compensation, litigation expenses and other items; Fiscal year-end January 31;
Refer to appendix for GAAP to Non-GAAP reconciliation
FY13 FY14 FY15 FY16 FY17 TTM Long-term Model
Revenue Mix
Subscription services 76% 76% 77% 78% 76% 80 – 85%
Professional services 24% 24% 23% 22% 24% 15 – 20%
Gross Margin 53% 59% 60% 60% 62% 65 – 70%
Subscription services 68% 74% 76% 74% 77%
Professional services 4% 12% 4% 9% 11%
% of Revenue
Research and development 18% 19% 19% 19% 17% 11 – 13%
Sales and marketing 42% 43% 47% 45% 42% 25 – 30%
General and administrative 14% 16% 15% 17% 14% 7 – 9%
Operating margin (22%) (19%) (21%) (21%) (12%) 18 – 22%
EBITDA margin (18%) (16%) (18%) (17%) (8%) 22 – 26%

©2016 Xactly Corporation. All rights reserved.
INVESTMENT HIGHLIGHTS
• 1,600 basis points increase in EBITDA
margin Q3FY17 over Q3FY16
• Unique insights based on 11 years of
empirical data
• 105% revenue retention for FY16
• Subscriber CAGR of 35%
• Subscription revenue CAGR of 29%
• Cloud-based 100% multi-tenant SaaS
architecture
30©2016 Xactly Corporation. All rights reserved.

Appendix

©2016 Xactly Corporation. All rights reserved. 32
GAAP TO NON-GAAP RECONCILIATION
Twelve months ended
October 31,
(in $ thousands) 2013 2014 2015 2016 2015 2016 2016
Subscription services $27,519 $35,893 $47,309 $59,211 $15,157 $18,455 $70,249
Professional services 8,806 11,327 13,802 16,763 3,940 5,490 21,616
Total revenue 36,325 47,220 61,111 75,974 19,097 23,945 91,865
Gross profit – Subscription services
Gross profit (GAAP) 18,778 26,332 35,592 43,489 11,184 14,213 53,701
Stock-based compensation 61 74 237 456 133 146 568
Gross profit (Non-GAAP) 18,839 26,406 35,829 43,945 11,317 14,359 54,269
Gross margin % (Non-GAAP) 68.5% 73.6% 75.7% 74.2% 74.7% 77.8% 77.3%
Gross profit – Professional services
Gross profit (GAAP) 296 1,337 477 1,083 63 532 1,578
Stock-based compensation 33 43 61 454 154 276 882
Gross profit (Non-GAAP) 329 1,380 538 1,537 217 808 2,460
Gross margin % (Non-GAAP) 3.7% 12.2% 3.9% 9.2% 5.5% 14.7% 11.4%
Gross profit – Total
Gross profit (GAAP) 19,074 27,669 36,069 44,572 11,247 14,745 55,279
Stock-based compensation 94 117 298 910 287 422 1,450
Gross profit (Non-GAAP) $19,168 $27,786 $36,367 $45,482 $11,534 $15,167 $56,729
Gross margin % (Non-GAAP) 52.8% 58.8% 59.5% 59.9% 60.4% 63.3% 61.8%
Three months ended
October 31,
Fiscal year ended
January 31,

©2016 Xactly Corporation. All rights reserved. 33
GAAP TO NON-GAAP RECONCILIATION (CONT’D)Twelve months ended
October 31,
(in $ thousands) 2013 2014 2015 2016 2015 2016 2016
Research and development
Research and development (GAAP) $6,567 $9,114 $11,867 $15,650 $4,130 $4,622 $17,664
Stock-based compensation 84 134 272 898 308 570 1,764
Research and development (Non-GAAP) 6,483 8,980 11,595 14,752 3,822 4,052 15,900
Research and development % of revenue (Non-GAAP) 17.8% 19.0% 19.0% 19.4% 20.0% 16.9% 17.3%
Sales and marketing
Sales and marketing (GAAP) 15,410 20,532 28,877 34,836 9,319 10,440 40,106
Stock-based compensation 156 165 312 893 266 567 1,788
Sales and marketing (Non-GAAP) 15,254 20,367 28,565 33,943 9,053 9,873 38,318
Sales and marketing % of revenue (Non-GAAP) 42.0% 43.1% 46.7% 44.7% 47.4% 41.2% 41.7%
General and administrative
General and administrative (GAAP) 5,424 7,901 10,087 14,502 3,330 3,725 15,462
Stock-based compensation 181 280 776 1,156 304 692 2,223
XactlyOne Stock Donation – – – 498 – – –
General and administrative (Non-GAAP) 5,243 7,621 9,311 12,848 3,026 3,033 13,239
General and administrative % of revenue (Non-GAAP) 14.4% 16.1% 15.2% 16.9% 15.8% 12.7% 14.4%
Operating margin
Operating loss (GAAP) (9,052) (12,603) (15,469) (20,416) (5,532) (4,042) (17,953)
Stock-based compensation 515 696 1,658 3,857 1,165 2,251 7,225
Legal settlement – 2,000 – – – – –
Amortization of intangibles 725 725 707 – – – –
XactlyOne Stock Donation – – – 498 – – –
Operating loss (Non-GAAP) ($7,812) ($9,182) ($13,104) ($16,061) ($4,367) ($1,791) ($10,728)
Operating margin % (Non-GAAP) (21.5)% (19.4)% (21.4)% (21.1)% (22.9)% (7.5)% (11.7)%
Three months ended
October 31,
Fiscal year ended
January 31,
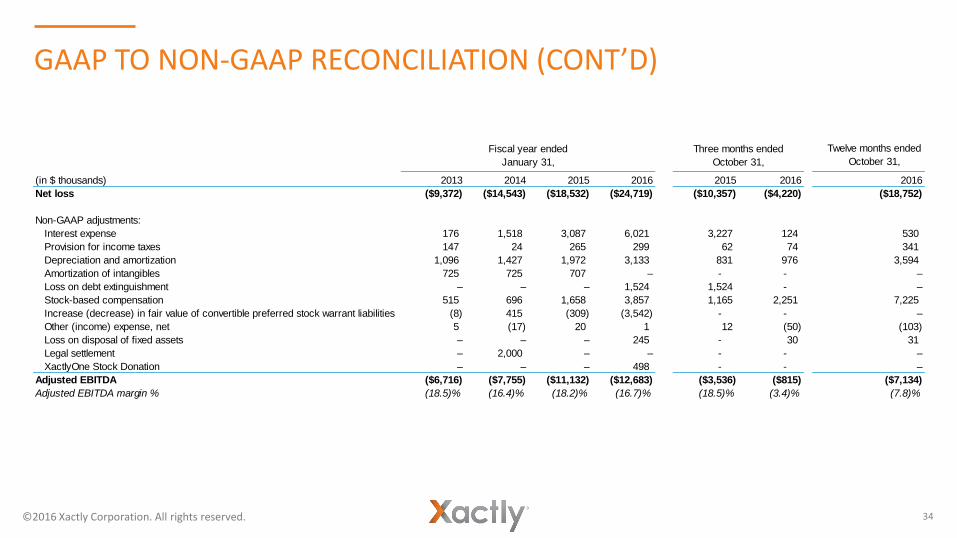
©2016 Xactly Corporation. All rights reserved. 34
GAAP TO NON-GAAP RECONCILIATION (CONT’D)
Twelve months ended
October 31,
(in $ thousands) 2013 2014 2015 2016 2015 2016 2016
Net loss ($9,372) ($14,543) ($18,532) ($24,719) ($10,357) ($4,220) ($18,752)
Non-GAAP adjustments:
Interest expense 176 1,518 3,087 6,021 3,227 124 530
Provision for income taxes 147 24 265 299 62 74 341
Depreciation and amortization 1,096 1,427 1,972 3,133 831 976 3,594
Amortization of intangibles 725 725 707 – - - –
Loss on debt extinguishment – – – 1,524 1,524 - –
Stock-based compensation 515 696 1,658 3,857 1,165 2,251 7,225
Increase (decrease) in fair value of convertible preferred stock warrant liabilities (8) 415 (309) (3,542) - - –
Other (income) expense, net 5 (17) 20 1 12 (50) (103)
Loss on disposal of fixed assets – – – 245 - 30 31
Legal settlement – 2,000 – – - - –
XactlyOne Stock Donation – – – 498 - - –
Adjusted EBITDA ($6,716) ($7,755) ($11,132) ($12,683) ($3,536) ($815) ($7,134)
Adjusted EBITDA margin % (18.5)% (16.4)% (18.2)% (16.7)% (18.5)% (3.4)% (7.8)%
Three months ended
October 31,
Fiscal year ended
January 31,

©2016 Xactly Corporation. All rights reserved. 35
NON-GAAP RECONCILIATION – CALCULATED BILLINGS
(in $ thousands) 2013 2014 2015 2016 2015 2016
Total revenue $36,325 $47,220 $61,111 $75,974 $19,097 $23,945
Deferred revenue, end of period 21,286 29,531 34,143 44,510 39,781 50,208
Less: deferred revenue, beginning of period 17,227 21,286 29,531 34,143 37,397 48,366
Calculated Billings $40,384 $55,465 $65,723 $86,341 $21,481 $25,787
Calculated billings % growth 37.3% 18.5% 31.4% 20.0%
Three months ended
October 31,
Fiscal year ended
January 31,

©2016 Xactly Corporation. All rights reserved. Xactly’s vision is to change the world of incentive compensation.For more information, visit www.xactlycorp.com


![PowerPoint Presentation · PRESENTATION Q3FY17. Standalone Highlights Q3FY17 PAT ` 880 cr [ ` 635 cr] ` 129,261 cr [ ` 115,345 cr] 1,348 [1,298] 4.49% [4.34%] 17.6%# [16.2%] 16.5%](https://img.pdfslide.us/doc/110x75/5f3bda7bb953a52b2823f5d7/powerpoint-presentation-presentation-q3fy17-standalone-highlights-q3fy17-pat-.jpg)