Embed Size (px)
Citation preview

Investor PresentationQ2 2016
June 2016

Forward-Looking Statements
From time to time, we make written or oral forward-looking statements within the meaning of certain securities laws, including in this presentation, in other filingswith Canadian securities regulators or the U.S. Securities and Exchange Commission and in other communications. All such statements are made pursuant to the “safeharbour” provisions of, and are intended to be forward-looking statements under applicable Canadian and U.S. securities legislation, including the U.S. PrivateSecurities Litigation Reform Act of 1995. These statements include, but are not limited to, statements made about our operations, business lines, financial condition,risk management, priorities, targets, ongoing objectives, strategies and outlook for calendar year 2016 and subsequent periods. Forward-looking statements aretypically identified by the words “believe”, “expect”, “anticipate”, “intend”, “estimate”, “forecast”, “target”, “objective” and other similar expressions or future orconditional verbs such as “will”, “should”, “would” and “could”. By their nature, these statements require us to make assumptions and are subject to inherent risksand uncertainties that may be general or specific. A variety of factors, many of which are beyond our control, affect our operations, performance and results, andcould cause actual results to differ materially from the expectations expressed in any of our forward-looking statements. These factors include: credit, market,liquidity, strategic, insurance, operational, reputation and legal, regulatory and environmental risk; the effectiveness and adequacy of our risk management andvaluation models and processes; legislative or regulatory developments in the jurisdictions where we operate, including the Dodd-Frank Wall Street Reform andConsumer Protection Act and the regulations issued and to be issued thereunder, the U.S. Foreign Account Tax Compliance Act and regulatory reforms in the UnitedKingdom and Europe, the Basel Committee on Banking Supervision’s global standards for capital and liquidity reform, and those relating to the payments system inCanada; amendments to, and interpretations of, risk-based capital guidelines and reporting instructions, and interest rate and liquidity regulatory guidance; theresolution of legal and regulatory proceedings and related matters; the effect of changes to accounting standards, rules and interpretations; changes in our estimatesof reserves and allowances; changes in tax laws; changes to our credit ratings; political conditions and developments; the possible effect on our business ofinternational conflicts and the war on terror; natural disasters, public health emergencies, disruptions to public infrastructure and other catastrophic events; relianceon third parties to provide components of our business infrastructure; potential disruptions to our information technology systems and services; increasing cybersecurity risks which may include theft of assets, unauthorized access to sensitive information, or operational disruption; social media risk; losses incurred as a result ofinternal or external fraud; anti-money laundering; the accuracy and completeness of information provided to us concerning clients and counterparties; the failure ofthird parties to comply with their obligations to us and our affiliates or associates; intensifying competition from established competitors and new entrants in thefinancial services industry including through internet and mobile banking; technological change; global capital market activity; changes in monetary and economicpolicy; currency value and interest rate fluctuations, including as a result of oil price volatility; general business and economic conditions worldwide, as well as inCanada, the U.S. and other countries where we have operations, including increasing Canadian household debt levels and Europe’s sovereign debt crisis; our success indeveloping and introducing new products and services, expanding existing distribution channels, developing new distribution channels and realizing increased revenuefrom these channels; changes in client spending and saving habits; our ability to attract and retain key employees and executives; our ability to successfully executeour strategies and complete and integrate acquisitions and joint ventures; and our ability to anticipate and manage the risks associated with these factors. This list isnot exhaustive of the factors that may affect any of our forward-looking statements. These and other factors should be considered carefully and readers should notplace undue reliance on our forward-looking statements. Any forward-looking statements contained in this presentation represent the views of management only as ofthe date hereof and are presented for the purpose of assisting our shareholders and financial analysts in understanding our financial position, objectives and prioritiesand anticipated financial performance as at and for the periods ended on the dates presented, and may not be appropriate for other purposes. We do not undertake toupdate any forward-looking statement that is contained in this presentation or in other communications except as required by law.
Investor Relations contacts:John Ferren, Senior Vice-President 416 980-2088Investor Relations Fax Number 416 980-5028Visit the Investor Relations section at www.cibc.com
2
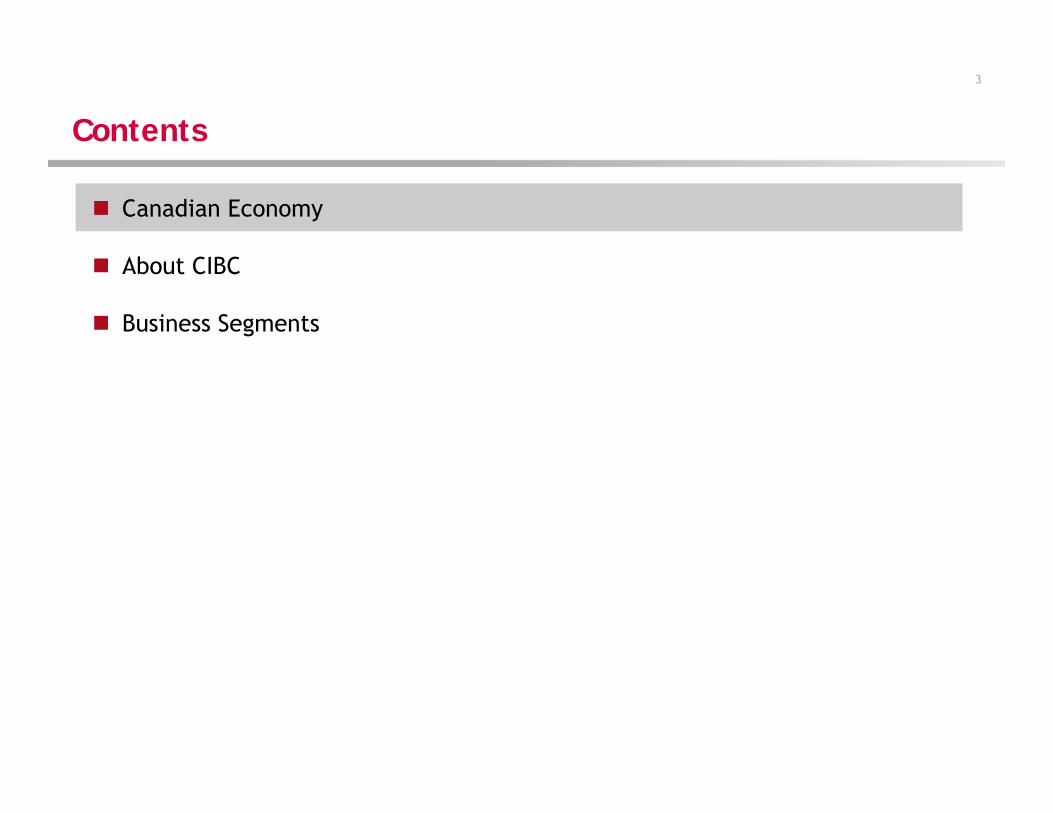
Contents
3
Canadian Economy
About CIBC
Business Segments
3
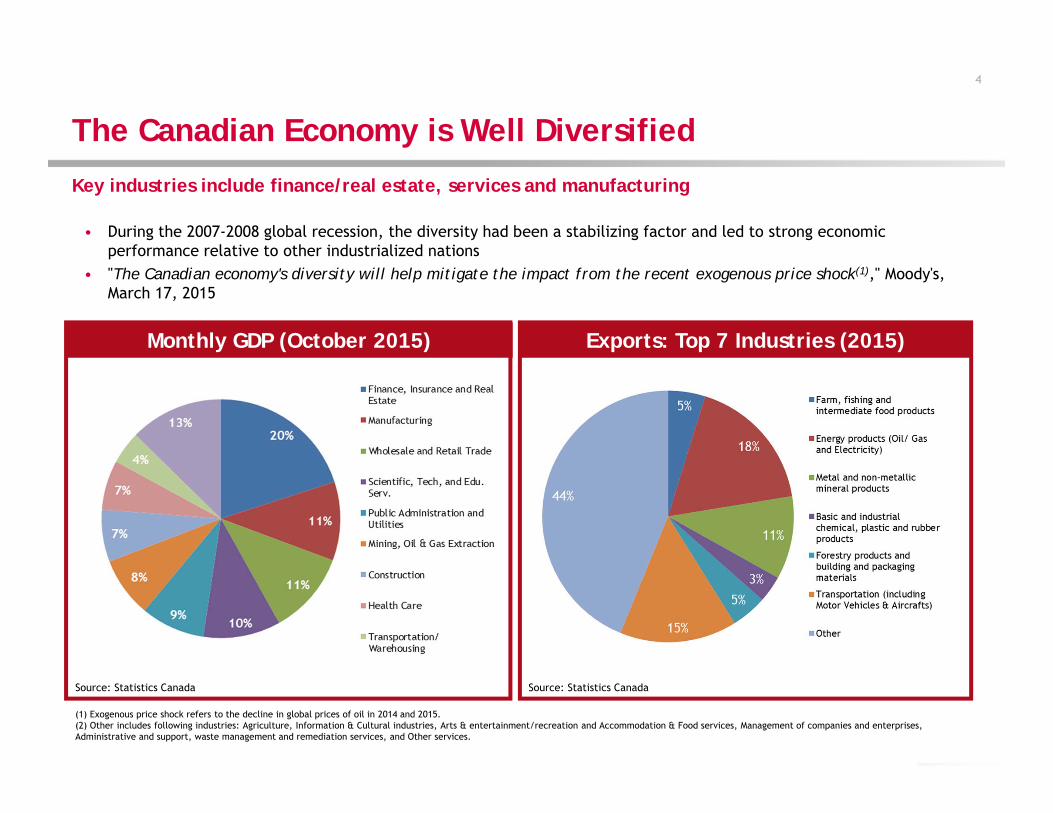
The Canadian Economy is Well Diversified
Key industries include finance/real estate, services and manufacturing
• During the 2007-2008 global recession, the diversity had been a stabilizing factor and led to strong economic performance relative to other industrialized nations
• "The Canadian economy's diversity will help mitigate the impact from the recent exogenous price shock(1)," Moody's, March 17, 2015
Source: Statistics Canada
Monthly GDP (October 2015) Exports: Top 7 Industries (2015)
Source: Statistics Canada
(1) Exogenous price shock refers to the decline in global prices of oil in 2014 and 2015.(2) Other includes following industries: Agriculture, Information & Cultural industries, Arts & entertainment/recreation and Accommodation & Food services, Management of companies and enterprises, Administrative and support, waste management and remediation services, and Other services.
4
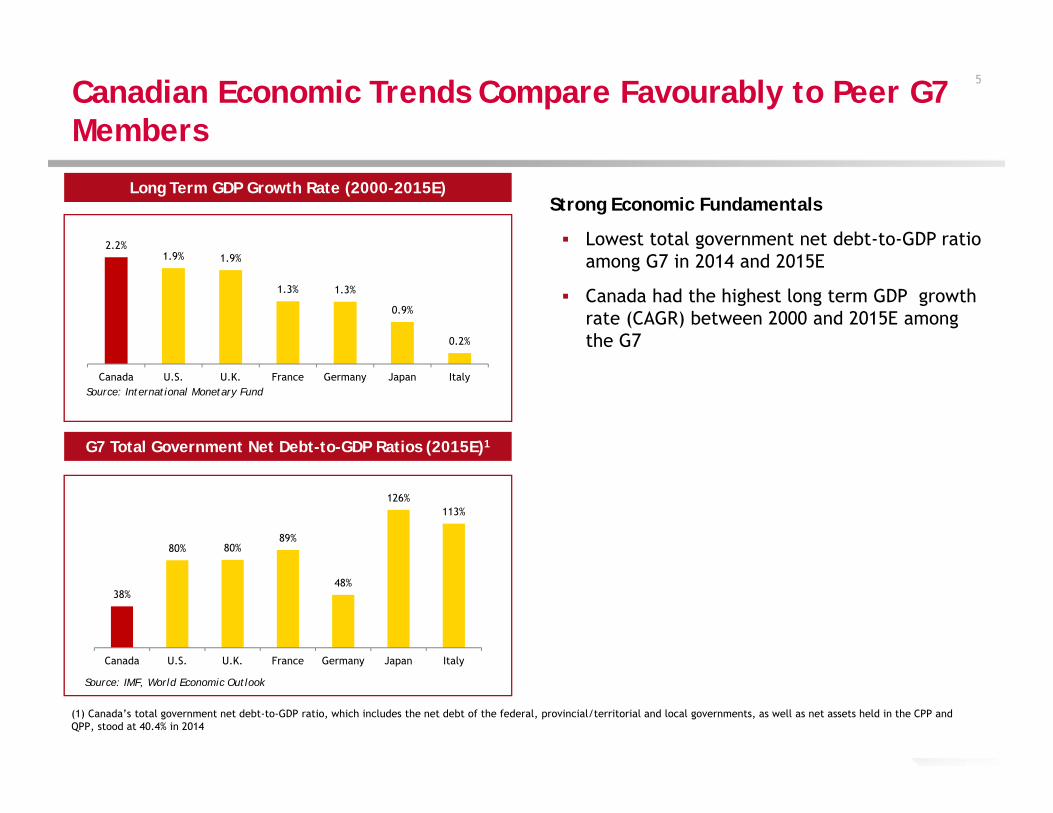
Canadian Economic Trends Compare Favourably to Peer G7 Members
Source: IMF, World Economic Outlook
Strong Economic Fundamentals
Lowest total government net debt-to-GDP ratio among G7 in 2014 and 2015E
Canada had the highest long term GDP growth rate (CAGR) between 2000 and 2015E among the G7
G7 Total Government Net Debt-to-GDP Ratios (2015E)1
Source: International Monetary Fund
Long Term GDP Growth Rate (2000-2015E)
5
(1) Canada’s total government net debt-to-GDP ratio, which includes the net debt of the federal, provincial/territorial and local governments, as well as net assets held in the CPP and QPP, stood at 40.4% in 2014
38%
80% 80%89%
48%
126%113%
Canada U.S. U.K. France Germany Japan Italy
2.2%1.9% 1.9%
1.3% 1.3%
0.9%
0.2%
Canada U.S. U.K. France Germany Japan Italy
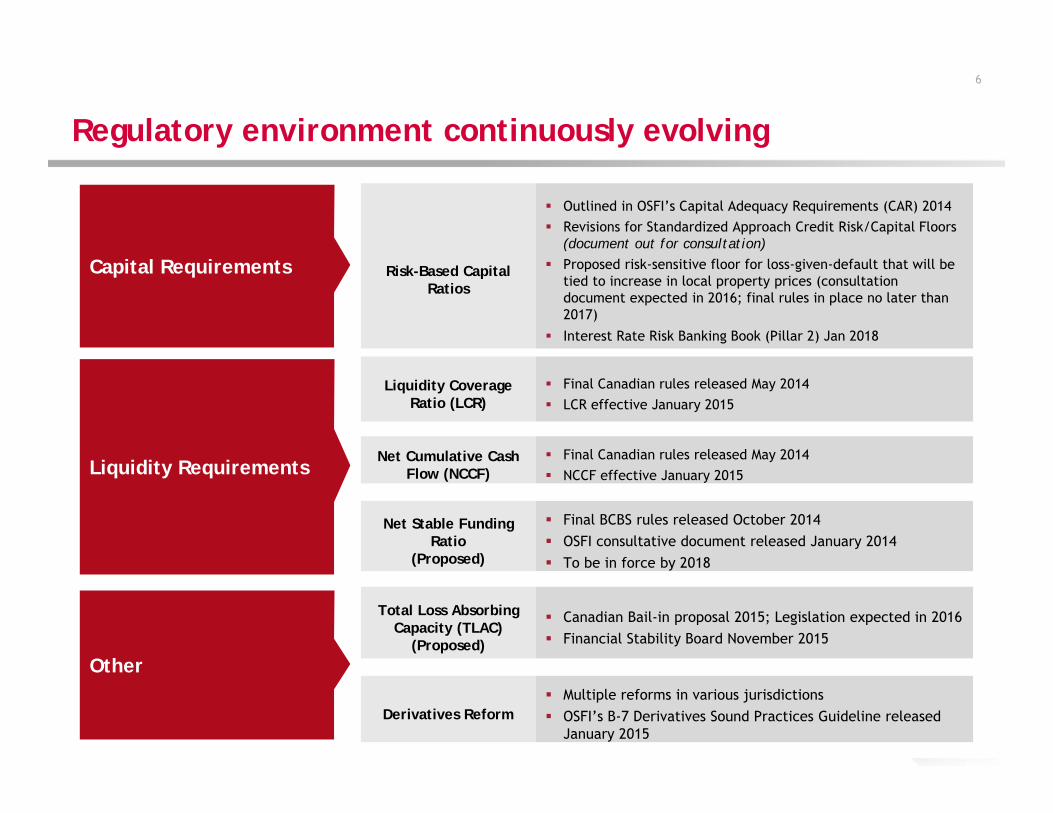
Regulatory environment continuously evolving
Liquidity Requirements
Other
Capital Requirements Risk-Based Capital Ratios
Outlined in OSFI’s Capital Adequacy Requirements (CAR) 2014 Revisions for Standardized Approach Credit Risk/Capital Floors
(document out for consultation) Proposed risk-sensitive floor for loss-given-default that will be
tied to increase in local property prices (consultation document expected in 2016; final rules in place no later than 2017)
Interest Rate Risk Banking Book (Pillar 2) Jan 2018
Liquidity Coverage Ratio (LCR)
Final Canadian rules released May 2014 LCR effective January 2015
Net Cumulative Cash Flow (NCCF)
Final Canadian rules released May 2014 NCCF effective January 2015
Net Stable Funding Ratio
(Proposed)
Final BCBS rules released October 2014 OSFI consultative document released January 2014 To be in force by 2018
Total Loss Absorbing Capacity (TLAC)
(Proposed)
Canadian Bail-in proposal 2015; Legislation expected in 2016 Financial Stability Board November 2015
Derivatives Reform Multiple reforms in various jurisdictions OSFI’s B-7 Derivatives Sound Practices Guideline released
January 20156
6
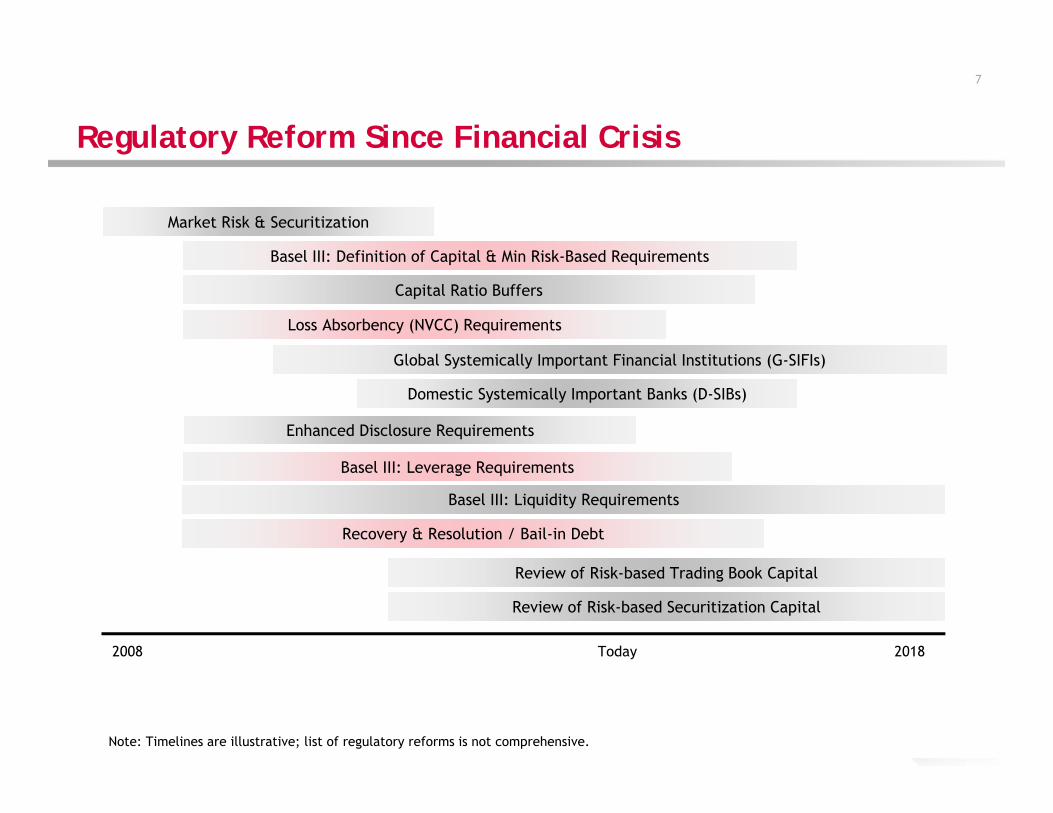
Regulatory Reform Since Financial Crisis
2008 2018
Note: Timelines are illustrative; list of regulatory reforms is not comprehensive.
Today
Market Risk & Securitization
Basel III: Definition of Capital & Min Risk-Based Requirements
Global Systemically Important Financial Institutions (G-SIFIs)
Domestic Systemically Important Banks (D-SIBs)
Basel III: Liquidity Requirements
Enhanced Disclosure Requirements
Recovery & Resolution / Bail-in Debt
Review of Risk-based Trading Book Capital
Review of Risk-based Securitization Capital
Capital Ratio Buffers
Loss Absorbency (NVCC) Requirements
Basel III: Leverage Requirements
7
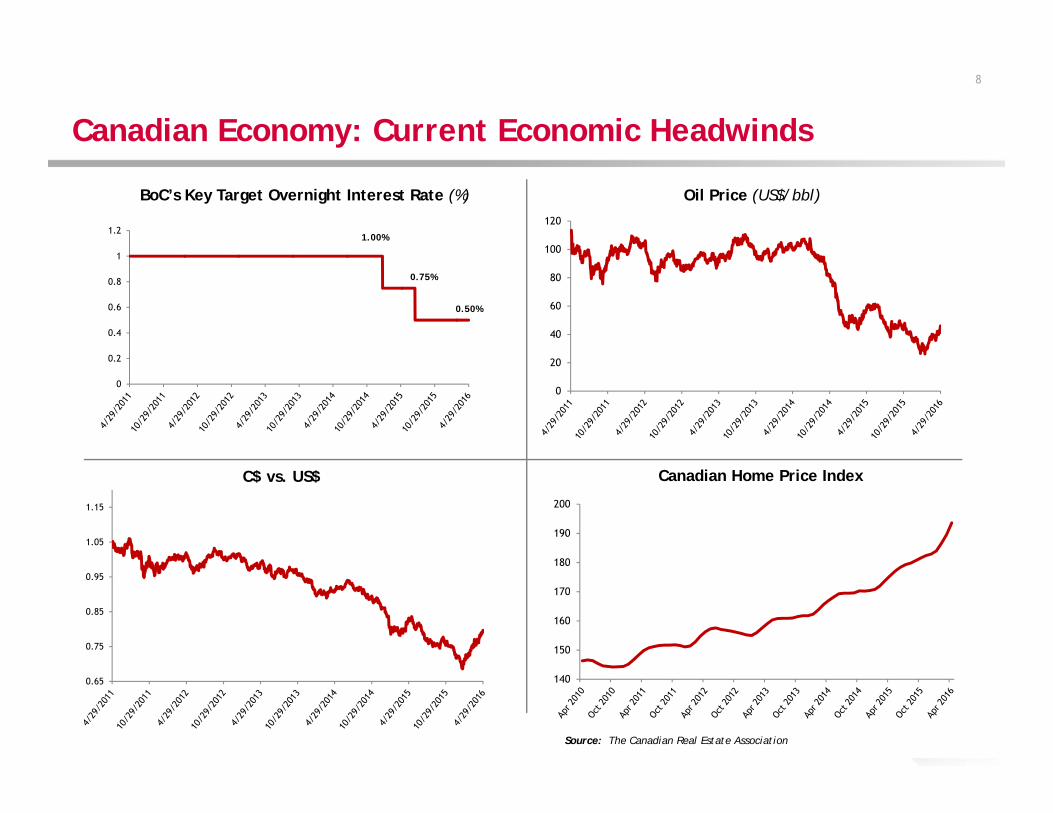
Canadian Economy: Current Economic Headwinds
BoC’s Key Target Overnight Interest Rate (%)
C$ vs. US$
Oil Price (US$/bbl)
8
Canadian Home Price Index
Source: The Canadian Real Estate Association
8
0.75%
1.00%
0.50%
140
150
160
170
180
190
200
0
20
40
60
80
100
120
0
0.2
0.4
0.6
0.8
1
1.2
0.65
0.75
0.85
0.95
1.05
1.15
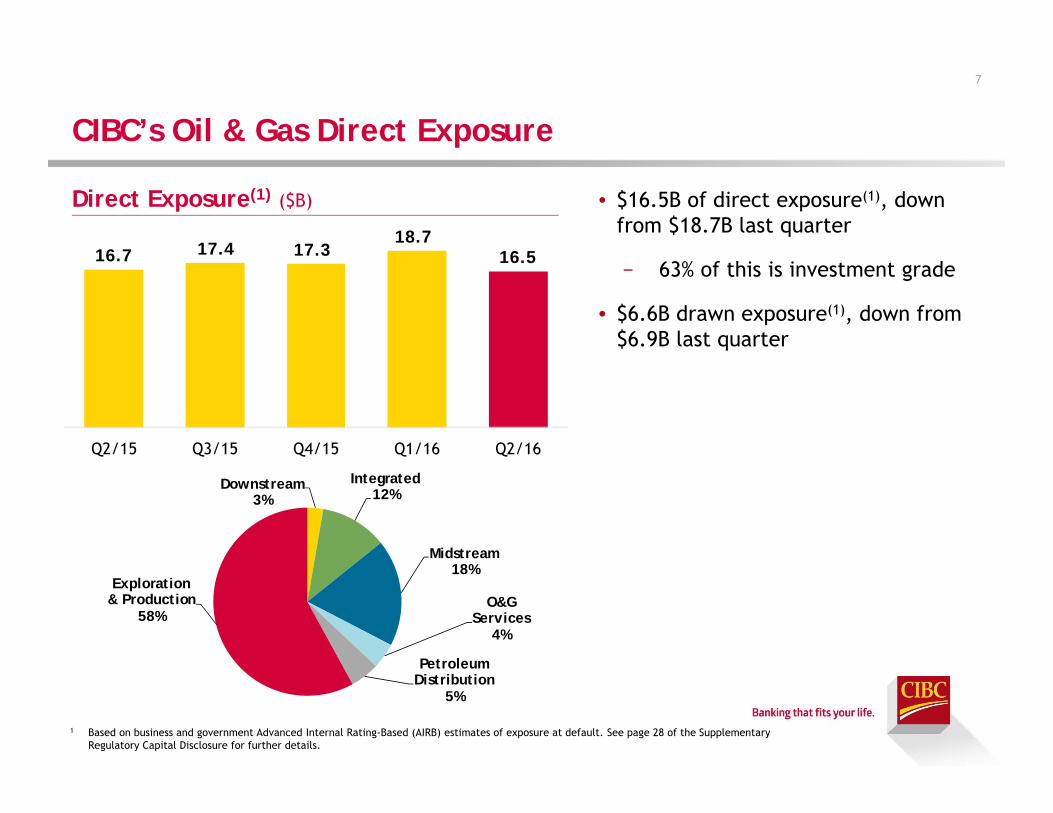
CIBC’s Oil & Gas Direct Exposure
1 Based on business and government Advanced Internal Rating-Based (AIRB) estimates of exposure at default. See page 28 of the Supplementary Regulatory Capital Disclosure for further details.
• $16.5B of direct exposure(1), down from $18.7B last quarter
− 63% of this is investment grade
• $6.6B drawn exposure(1), down from $6.9B last quarter
Direct Exposure(1) ($B)
7
16.7 17.4 17.3 18.7
16.5
Q2/15 Q3/15 Q4/15 Q1/16 Q2/16
Downstream3%
Integrated12%
Midstream18%
O&G Services
4%
Petroleum Distribution
5%
Exploration & Production
58%
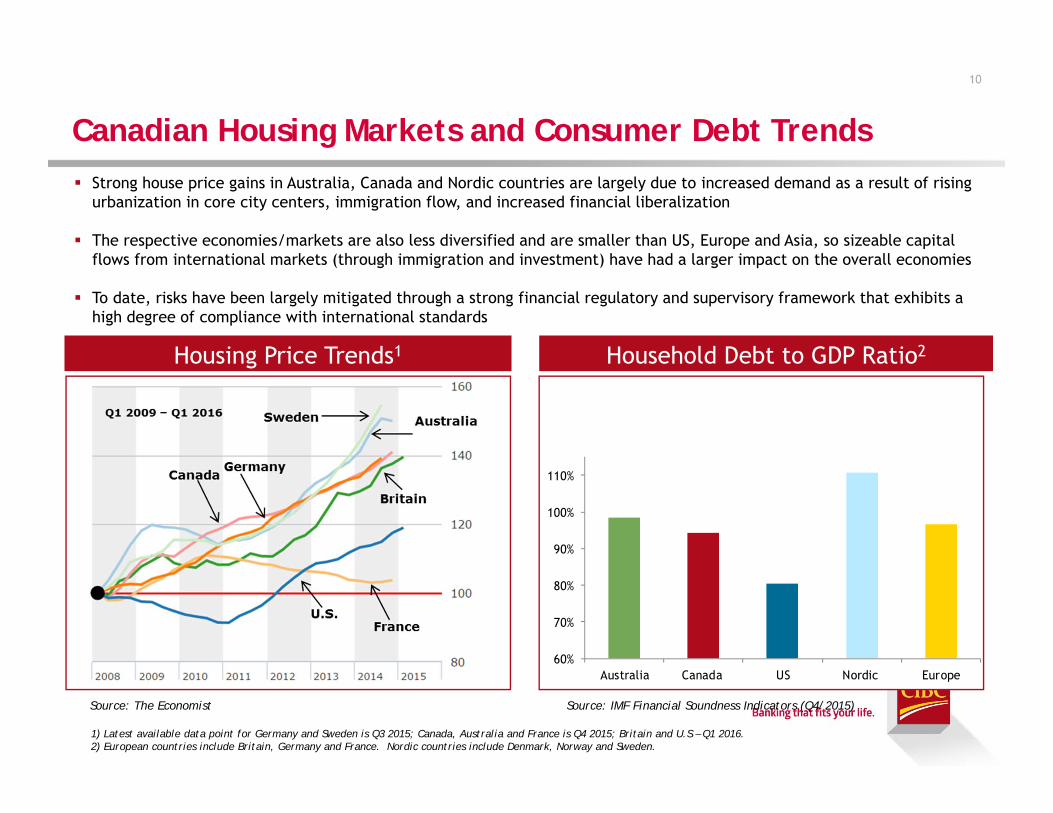
Canadian Housing Markets and Consumer Debt Trends
10
Housing Price Trends1
1) Latest available data point for Germany and Sweden is Q3 2015; Canada, Australia and France is Q4 2015; Britain and U.S – Q1 2016.2) European countries include Britain, Germany and France. Nordic countries include Denmark, Norway and Sweden.
60%
70%
80%
90%
100%
110%
Australia Canada US Nordic Europe
Household Debt to GDP Ratio2
Source: The Economist Source: IMF Financial Soundness Indicators (Q4/2015)
Strong house price gains in Australia, Canada and Nordic countries are largely due to increased demand as a result of rising urbanization in core city centers, immigration flow, and increased financial liberalization
The respective economies/markets are also less diversified and are smaller than US, Europe and Asia, so sizeable capital flows from international markets (through immigration and investment) have had a larger impact on the overall economies
To date, risks have been largely mitigated through a strong financial regulatory and supervisory framework that exhibits a high degree of compliance with international standards
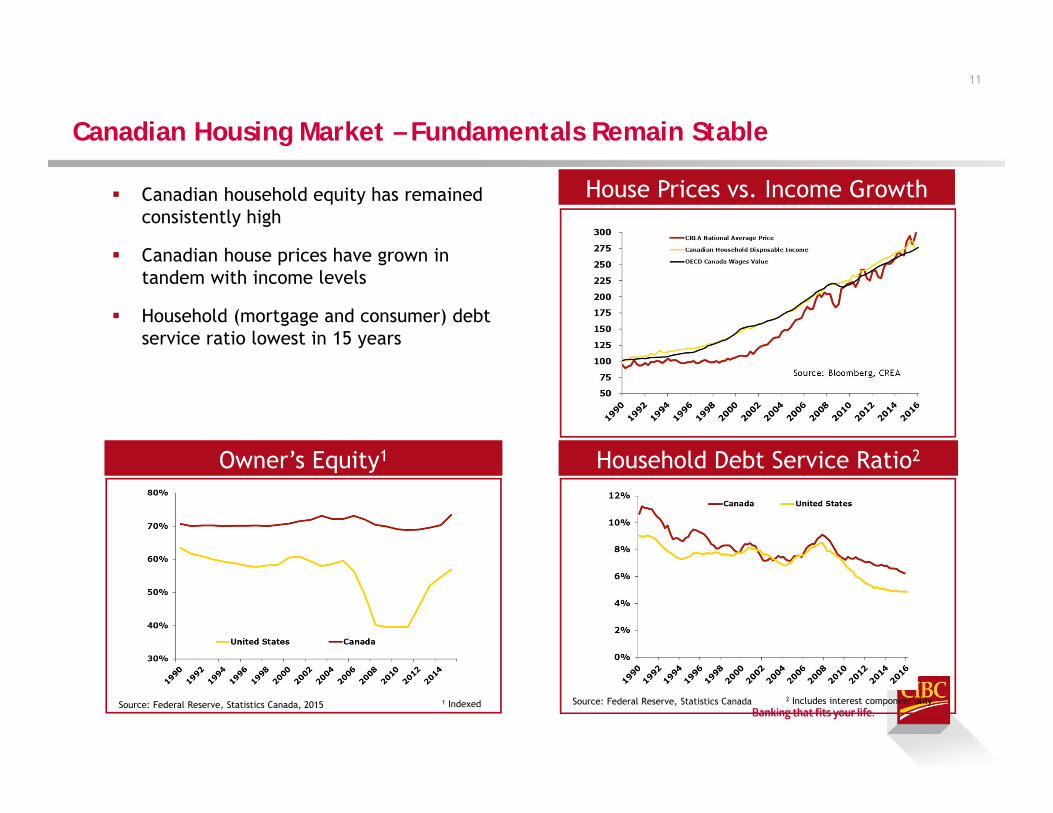
House Prices vs. Income Growth
Household Debt Service Ratio2
Canadian Housing Market – Fundamentals Remain Stable
Source: Bloomberg, CREA
Canadian household equity has remained consistently high
Canadian house prices have grown in tandem with income levels
Household (mortgage and consumer) debt service ratio lowest in 15 years
Owner’s Equity1
Source: Federal Reserve, Statistics Canada, 2015 Source: Federal Reserve, Statistics Canada 2 Includes interest component only1 Indexed
11
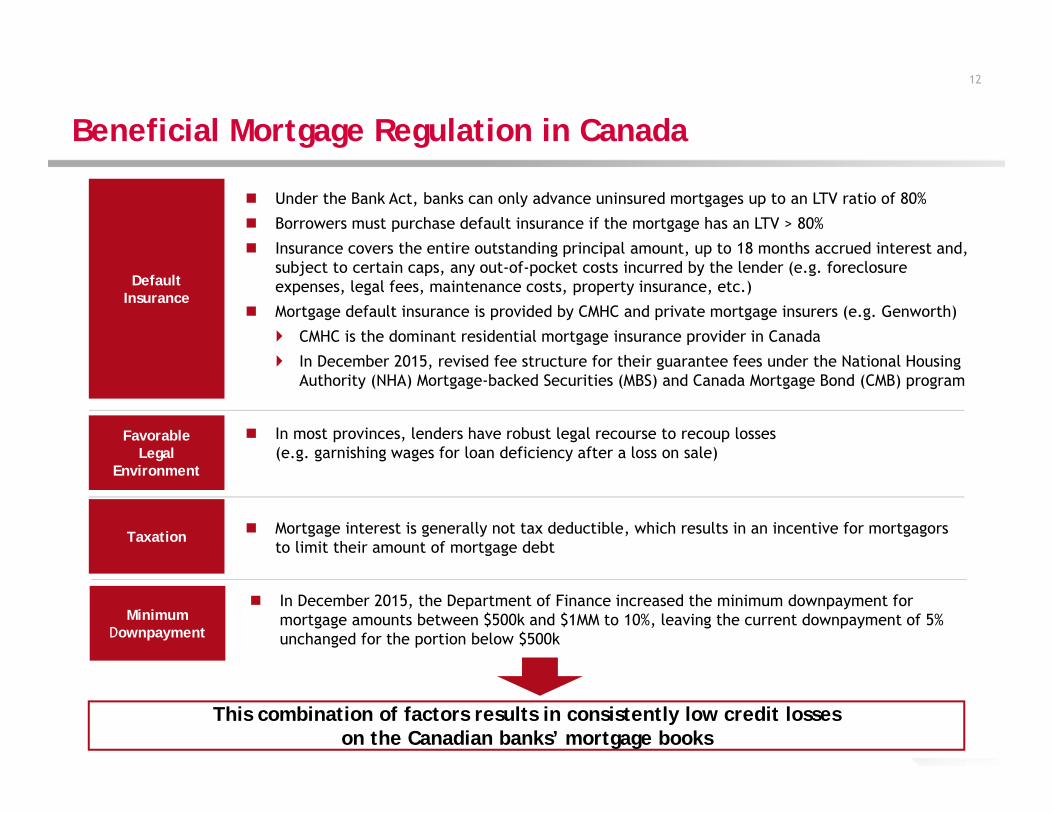
This combination of factors results in consistently low credit losses on the Canadian banks’ mortgage books
Beneficial Mortgage Regulation in Canada
Default Insurance
Under the Bank Act, banks can only advance uninsured mortgages up to an LTV ratio of 80%
Borrowers must purchase default insurance if the mortgage has an LTV > 80%
Insurance covers the entire outstanding principal amount, up to 18 months accrued interest and, subject to certain caps, any out-of-pocket costs incurred by the lender (e.g. foreclosure expenses, legal fees, maintenance costs, property insurance, etc.)
Mortgage default insurance is provided by CMHC and private mortgage insurers (e.g. Genworth)
CMHC is the dominant residential mortgage insurance provider in Canada
In December 2015, revised fee structure for their guarantee fees under the National Housing Authority (NHA) Mortgage-backed Securities (MBS) and Canada Mortgage Bond (CMB) program
Favorable Legal
Environment
In most provinces, lenders have robust legal recourse to recoup losses(e.g. garnishing wages for loan deficiency after a loss on sale)
Taxation Mortgage interest is generally not tax deductible, which results in an incentive for mortgagors to limit their amount of mortgage debt
12
Minimum Downpayment
In December 2015, the Department of Finance increased the minimum downpayment for mortgage amounts between $500k and $1MM to 10%, leaving the current downpayment of 5% unchanged for the portion below $500k

Recent Government Action to Strengthen Mortgage Oversight
2013
Intent to gradually limit insurance on low-ratio mortgages (Loan to Value (LTV) of < 80%) unless they are part of a CMHC-backed mortgage securitization program.
Allocate CMHC portfolio insurance limit equally among all mortgage lenders. Intent to prohibit Government-backed insured mortgages (both low and high ratio) from being used in
any non-CMHC sponsored securitization program.
CMHC announced increase to mortgage insurance premiums effective May 1, 2014 CMHC will no longer offer mortgage insurance to those buying second homes, self-employed borrowers
without third-party income validation, and developers for new condo construction2014
2012
Reduce maximum amortization period to 25 years from 30 for new government-backed insured mortgages with LTV >80%
Lower maximum borrowing amount in mortgage refinancing to 80% from 85% of home value Limit Gross Debt Service Ratio to 39% and Total Debt Service Ratio to 44%
Withdraw government insurance on home purchases that are $1 million or greater
13
2015
Department of Finance increased minimum downpayment for mortgage between $500k & $1MM to 10%. For mortgages < $500k, downpayment is unchanged at 5%
CMHC revised fee structure for their guarantee fees under the NHA MBS and CMB program
2016
Revisions for Standardized Approach Credit Risk/Capital Floors (document out for consultation) Proposed risk-sensitive floor for loss-given-default that will be tied to increase in local property prices
(consultation document expected in 2016; final rules in place no later than 2017)
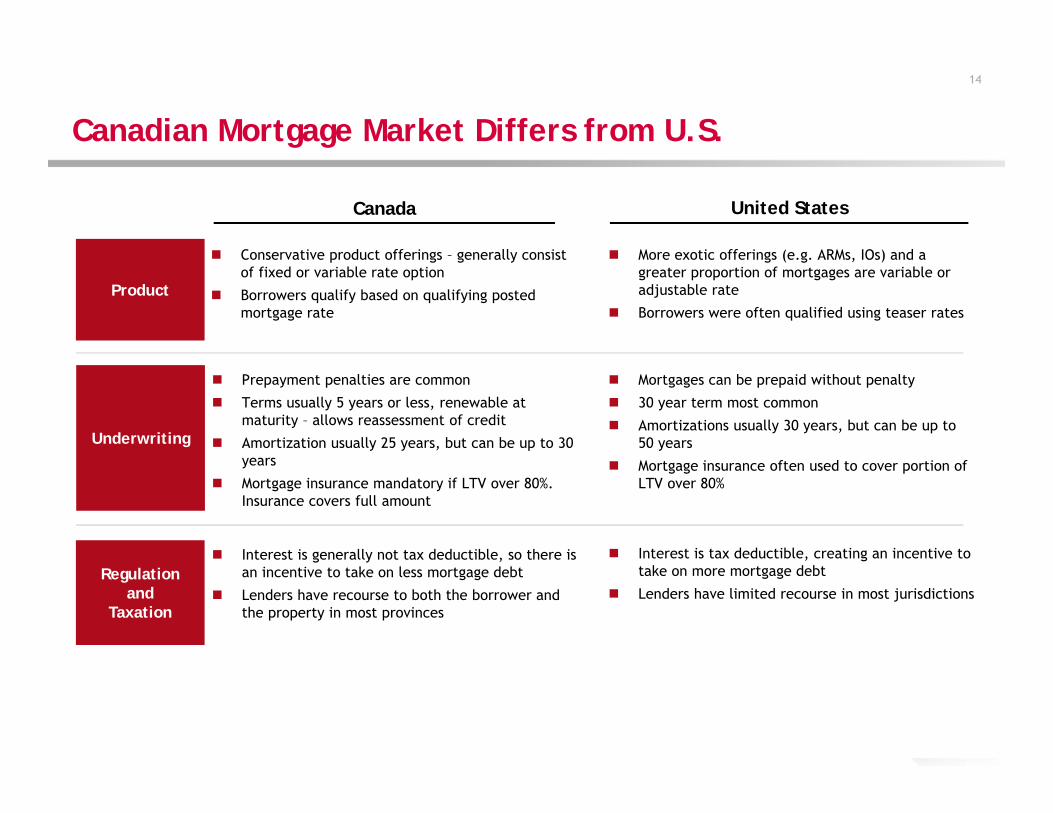
Canadian Mortgage Market Differs from U.S.
Product
Conservative product offerings – generally consist of fixed or variable rate option
Borrowers qualify based on qualifying posted mortgage rate
Underwriting
Regulation and
Taxation
More exotic offerings (e.g. ARMs, IOs) and a greater proportion of mortgages are variable or adjustable rate
Borrowers were often qualified using teaser rates
Prepayment penalties are common
Terms usually 5 years or less, renewable at maturity – allows reassessment of credit
Amortization usually 25 years, but can be up to 30 years
Mortgage insurance mandatory if LTV over 80%. Insurance covers full amount
Mortgages can be prepaid without penalty
30 year term most common
Amortizations usually 30 years, but can be up to 50 years
Mortgage insurance often used to cover portion of LTV over 80%
Interest is generally not tax deductible, so there is an incentive to take on less mortgage debt
Lenders have recourse to both the borrower and the property in most provinces
Interest is tax deductible, creating an incentive to take on more mortgage debt
Lenders have limited recourse in most jurisdictions
Canada United States
14
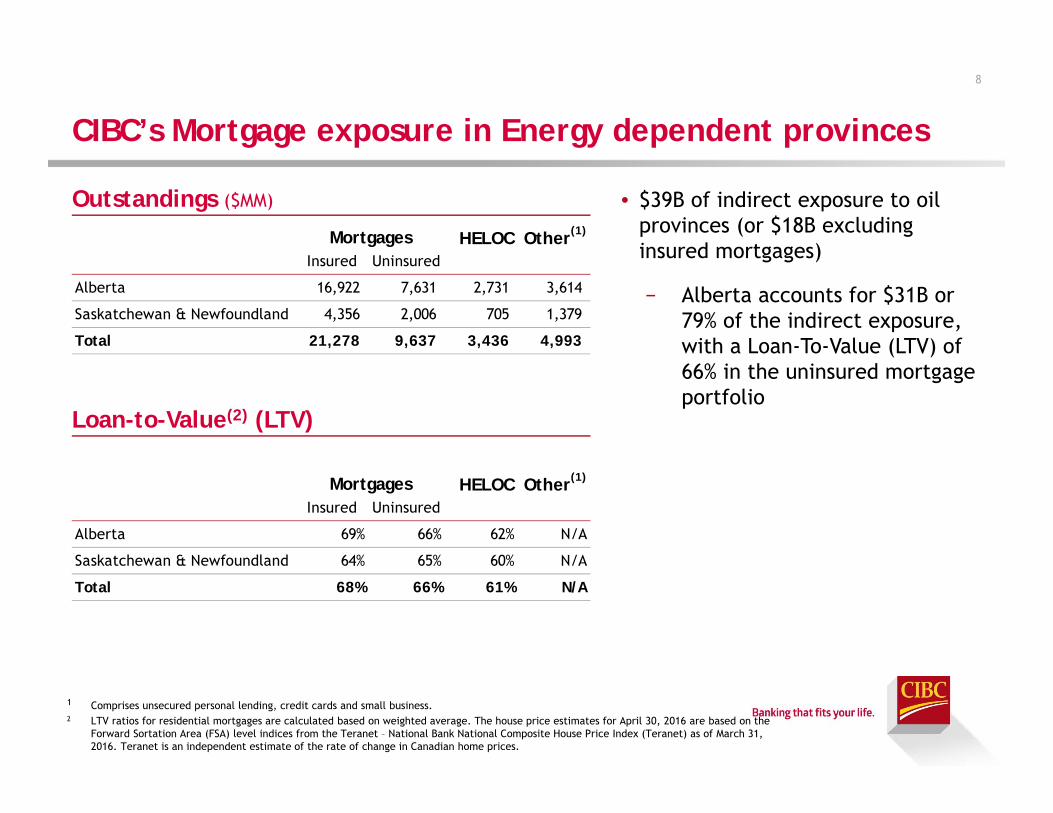
HELOC Other(1)
Insured Uninsured
Alberta 16,922 7,631 2,731 3,614
Saskatchewan & Newfoundland 4,356 2,006 705 1,379
Total 21,278 9,637 3,436 4,993
HELOC Other(1)
Insured Uninsured
Alberta 69% 66% 62% N/A
Saskatchewan & Newfoundland 64% 65% 60% N/A
Total 68% 66% 61% N/A
Mortgages
Mortgages
CIBC’s Mortgage exposure in Energy dependent provinces
Outstandings ($MM) • $39B of indirect exposure to oil provinces (or $18B excluding insured mortgages)
− Alberta accounts for $31B or 79% of the indirect exposure, with a Loan-To-Value (LTV) of 66% in the uninsured mortgage portfolio
Loan-to-Value(2) (LTV)
1 Comprises unsecured personal lending, credit cards and small business.2 LTV ratios for residential mortgages are calculated based on weighted average. The house price estimates for April 30, 2016 are based on the
Forward Sortation Area (FSA) level indices from the Teranet – National Bank National Composite House Price Index (Teranet) as of March 31, 2016. Teranet is an independent estimate of the rate of change in Canadian home prices.
8
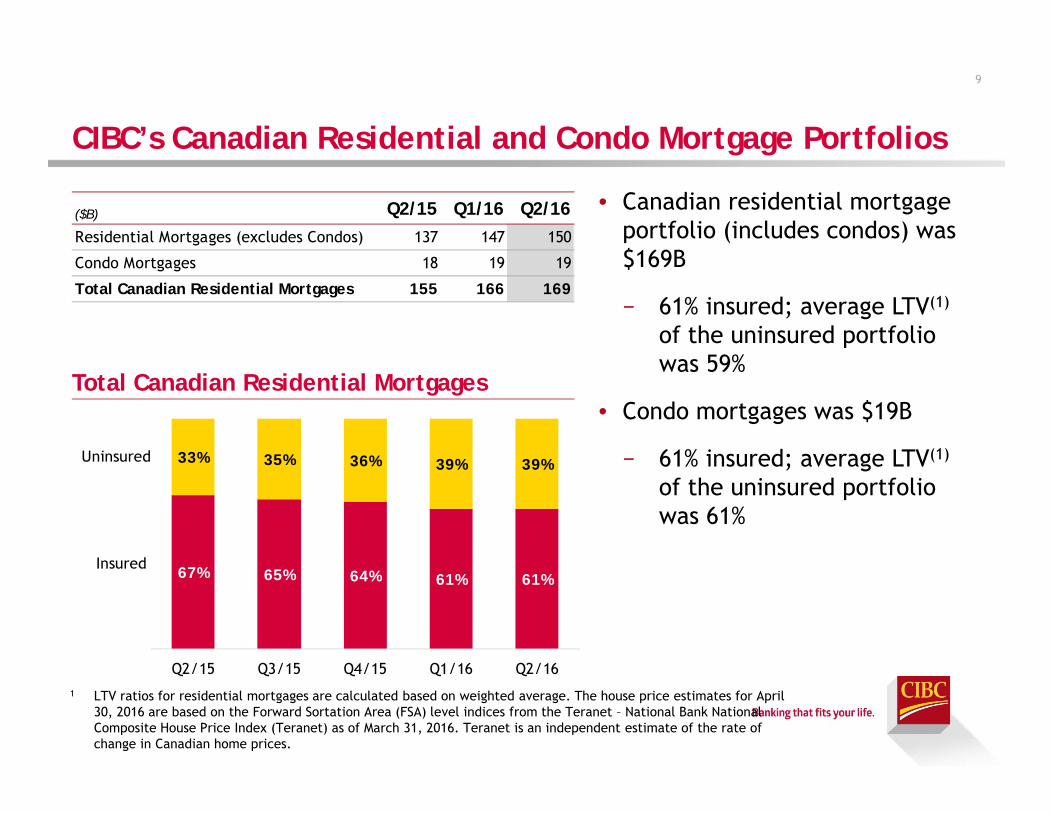
67% 65% 64% 61% 61%
33% 35% 36% 39% 39%
Q2/15 Q3/15 Q4/15 Q1/16 Q2/16
Insured
Uninsured
CIBC’s Canadian Residential and Condo Mortgage Portfolios
• Canadian residential mortgage portfolio (includes condos) was $169B
− 61% insured; average LTV(1)
of the uninsured portfolio was 59%
• Condo mortgages was $19B
− 61% insured; average LTV(1)
of the uninsured portfolio was 61%
1 LTV ratios for residential mortgages are calculated based on weighted average. The house price estimates for April 30, 2016 are based on the Forward Sortation Area (FSA) level indices from the Teranet – National Bank National Composite House Price Index (Teranet) as of March 31, 2016. Teranet is an independent estimate of the rate of change in Canadian home prices.
Total Canadian Residential Mortgages
9
($B) Q2/15 Q1/16 Q2/16Residential Mortgages (excludes Condos) 137 147 150
Condo Mortgages 18 19 19
Total Canadian Residential Mortgages 155 166 169
Contents
17
Canadian Economy
About CIBC
Business Segments
17
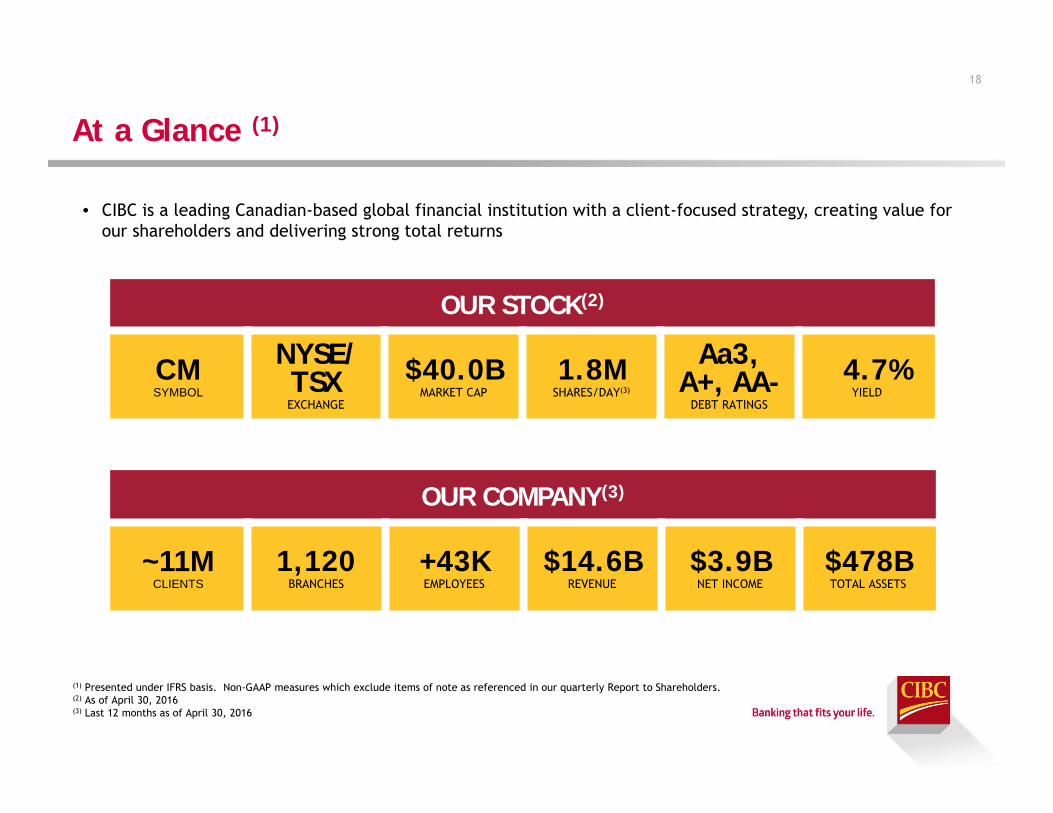
At a Glance (1)
• CIBC is a leading Canadian-based global financial institution with a client-focused strategy, creating value for our shareholders and delivering strong total returns
18
OUR STOCK(2)
CMSYMBOL
NYSE/TSXEXCHANGE
$40.0BMARKET CAP
1.8MSHARES/DAY(3)
Aa3, A+, AA-
DEBT RATINGS
4.7%YIELD
OUR COMPANY(3)
~11MCLIENTS
1,120BRANCHES
+43KEMPLOYEES
$14.6BREVENUE
$3.9BNET INCOME
$478BTOTAL ASSETS
(1) Presented under IFRS basis. Non-GAAP measures which exclude items of note as referenced in our quarterly Report to Shareholders.(2) As of April 30, 2016 (3) Last 12 months as of April 30, 2016
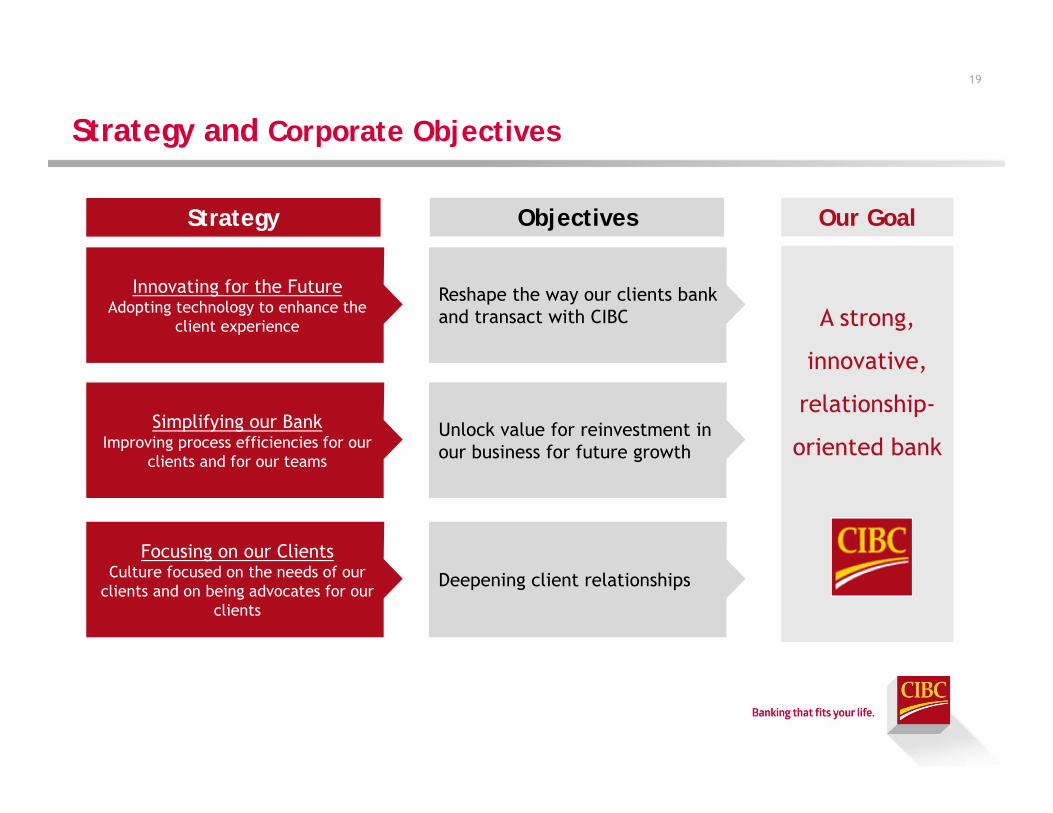
Strategy and Corporate Objectives
19
Simplifying our BankImproving process efficiencies for our
clients and for our teams
Focusing on our ClientsCulture focused on the needs of our
clients and on being advocates for our clients
Innovating for the FutureAdopting technology to enhance the
client experience
Unlock value for reinvestment in our business for future growth
Deepening client relationships
Reshape the way our clients bank and transact with CIBC A strong,
innovative,
relationship-
oriented bank
Strategy Objectives Our Goal
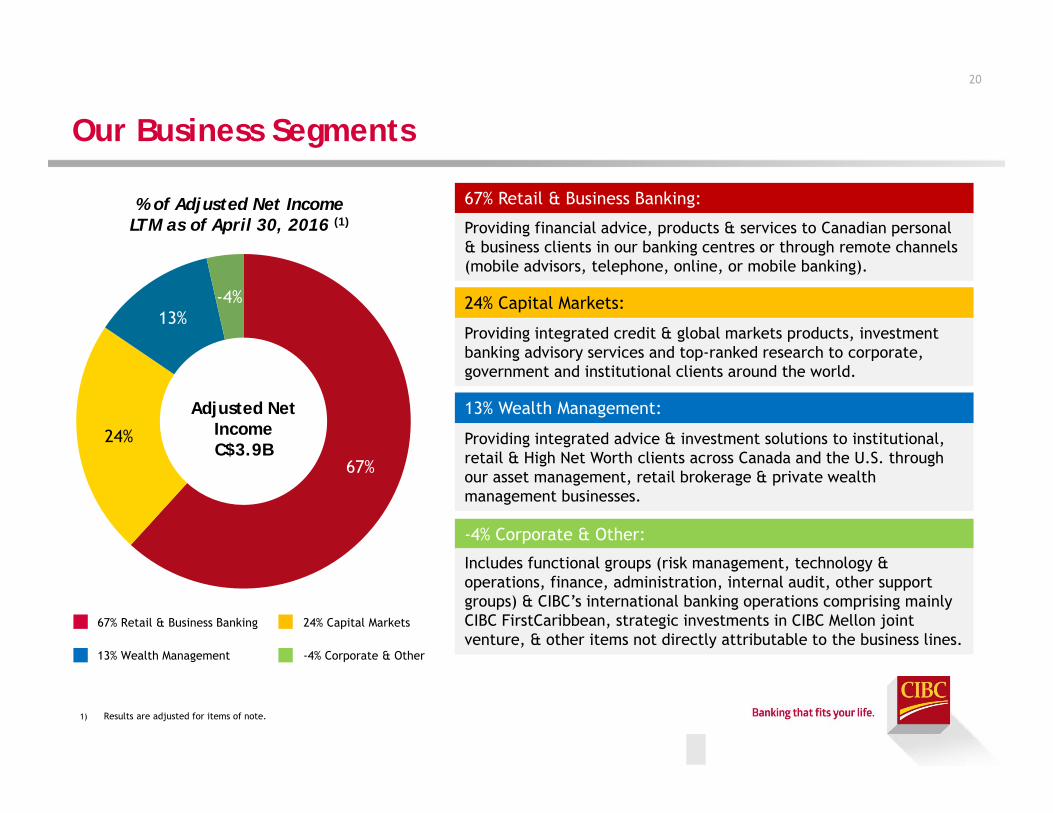
67%
24%
13%-4%
Our Business Segments
20
1) Results are adjusted for items of note.
% of Adjusted Net IncomeLTM as of April 30, 2016 (1)
67% Retail & Business Banking
13% Wealth Management
24% Capital Markets
-4% Corporate & Other
67% Retail & Business Banking:
Providing financial advice, products & services to Canadian personal & business clients in our banking centres or through remote channels (mobile advisors, telephone, online, or mobile banking).
24% Capital Markets:
Providing integrated credit & global markets products, investment banking advisory services and top-ranked research to corporate, government and institutional clients around the world.
13% Wealth Management:
Providing integrated advice & investment solutions to institutional, retail & High Net Worth clients across Canada and the U.S. through our asset management, retail brokerage & private wealth management businesses.
-4% Corporate & Other:
Includes functional groups (risk management, technology & operations, finance, administration, internal audit, other support groups) & CIBC’s international banking operations comprising mainly CIBC FirstCaribbean, strategic investments in CIBC Mellon joint venture, & other items not directly attributable to the business lines.
Adjusted Net IncomeC$3.9B
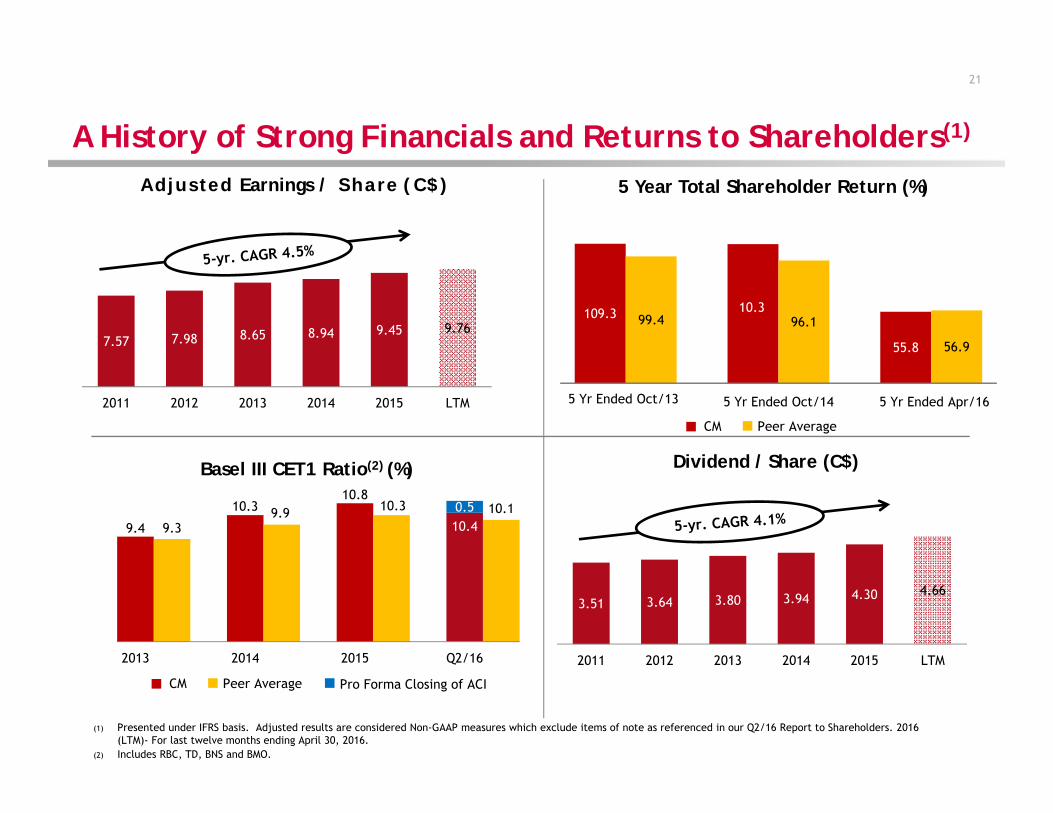
A History of Strong Financials and Returns to Shareholders(1)
5 Year Total Shareholder Return (%)
(1) Presented under IFRS basis. Adjusted results are considered Non-GAAP measures which exclude items of note as referenced in our Q2/16 Report to Shareholders. 2016 (LTM)- For last twelve months ending April 30, 2016.
(2) Includes RBC, TD, BNS and BMO.
21
Dividend / Share (C$)
3.51 3.64 3.80 3.94 4.30 4.66
2011 2012 2013 2014 2015 LTM
Adjusted Earnings / Share (C$)
7.57 7.98 8.65 8.94 9.45 9.76
2011 2012 2013 2014 2015 LTM
Basel III CET1 Ratio(2) (%)
10.49.4
10.310.8
0.5
9.39.9 10.3 10.1
2013 2014 2015 Q2/16
Peer Average Pro Forma Closing of ACICM
Peer AverageCM
109.3
55.8
99.410.3
96.1
56.9
5 Yr Ended Oct/13 5 Yr Ended Oct/14 5 Yr Ended Apr/16
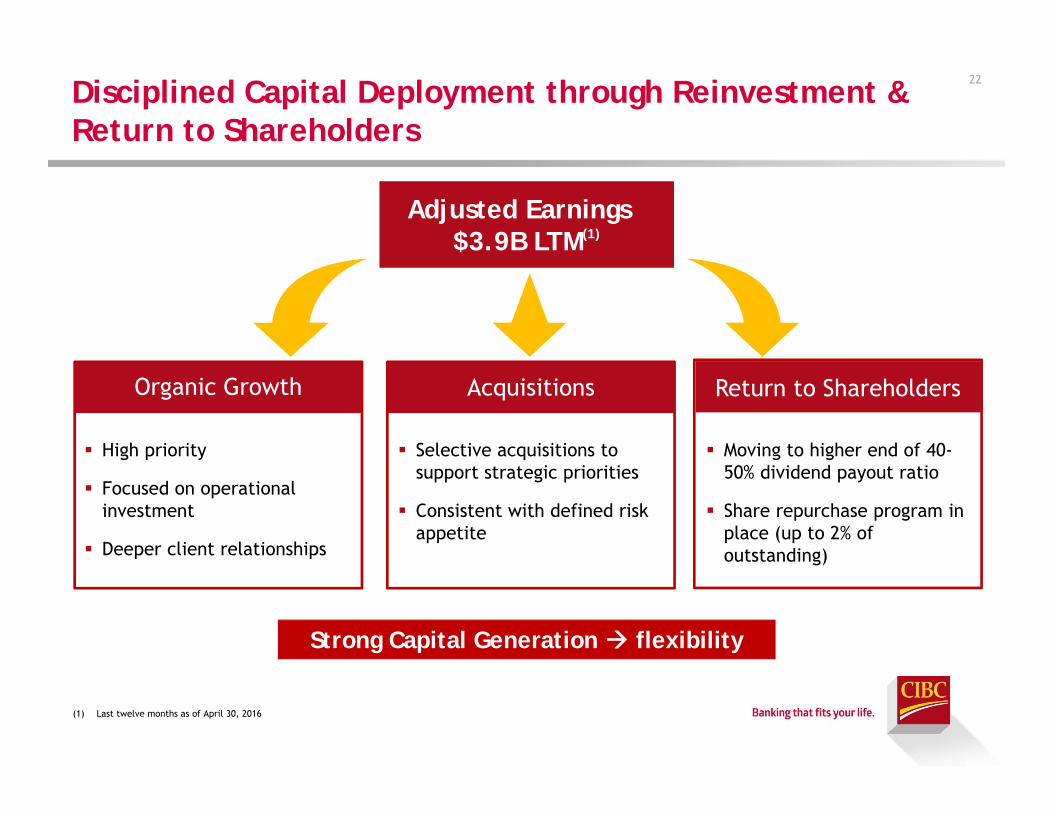
Disciplined Capital Deployment through Reinvestment & Return to Shareholders
22
(1) Last twelve months as of April 30, 2016
Adjusted Earnings $3.9B LTM(1)
Organic Growth
High priority
Focused on operational investment
Deeper client relationships
Acquisitions
Selective acquisitions to support strategic priorities
Consistent with defined risk appetite
Moving to higher end of 40-50% dividend payout ratio
Share repurchase program in place (up to 2% of outstanding)
Strong Capital Generation flexibility
Return to Shareholders
Contents
23
Canadian Economy
About CIBC
Business Segments
23
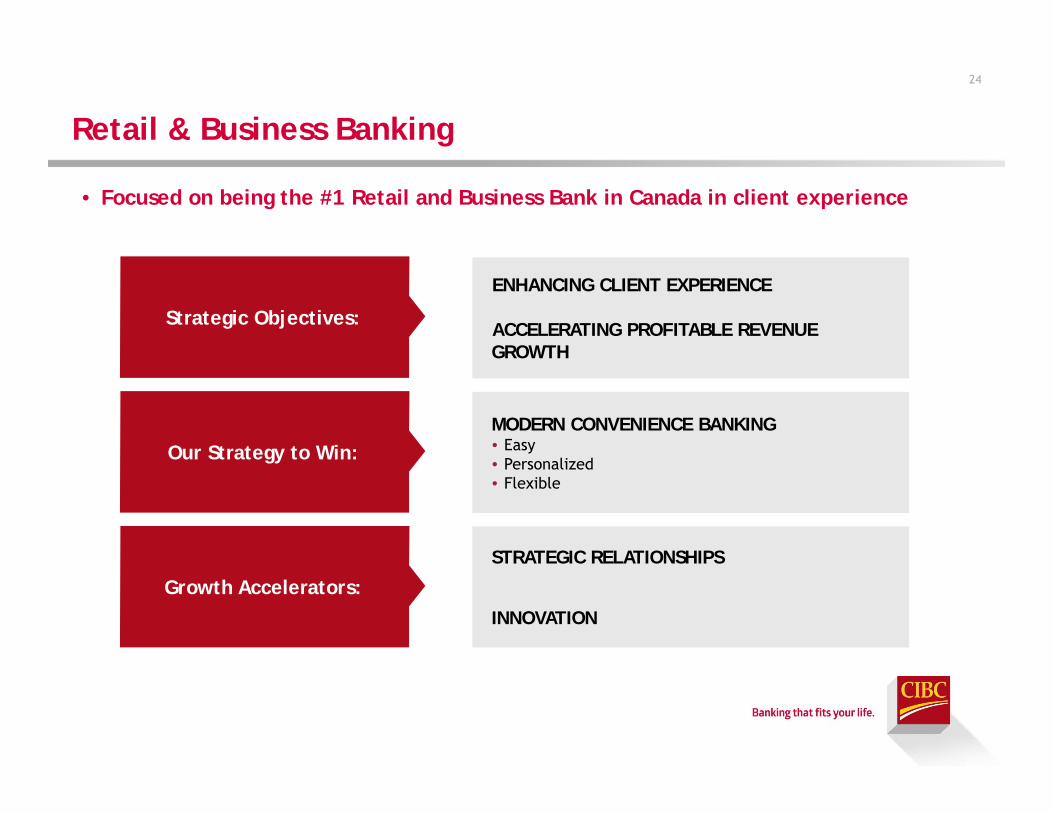
Retail & Business Banking
• Focused on being the #1 Retail and Business Bank in Canada in client experience
24
ENHANCING CLIENT EXPERIENCE
ACCELERATING PROFITABLE REVENUE GROWTH
MODERN CONVENIENCE BANKING• Easy• Personalized• Flexible
STRATEGIC RELATIONSHIPS
INNOVATION
Strategic Objectives:
Our Strategy to Win:
Growth Accelerators:
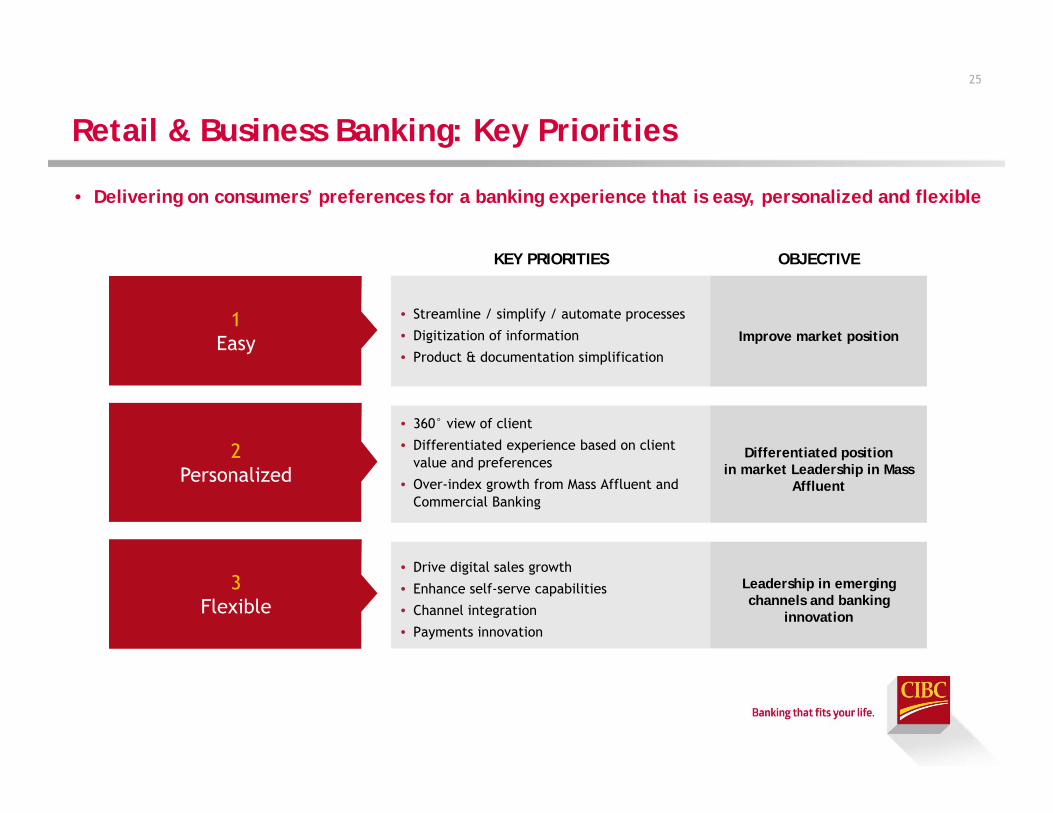
Retail & Business Banking: Key Priorities
• Delivering on consumers’ preferences for a banking experience that is easy, personalized and flexible
25
2Personalized
3Flexible
1Easy
KEY PRIORITIES OBJECTIVE
• Streamline / simplify / automate processes
• Digitization of information
• Product & documentation simplificationImprove market position
• 360° view of client
• Differentiated experience based on client value and preferences
• Over-index growth from Mass Affluent and Commercial Banking
Differentiated position in market Leadership in Mass
Affluent
• Drive digital sales growth
• Enhance self-serve capabilities
• Channel integration
• Payments innovation
Leadership in emerging channels and banking
innovation
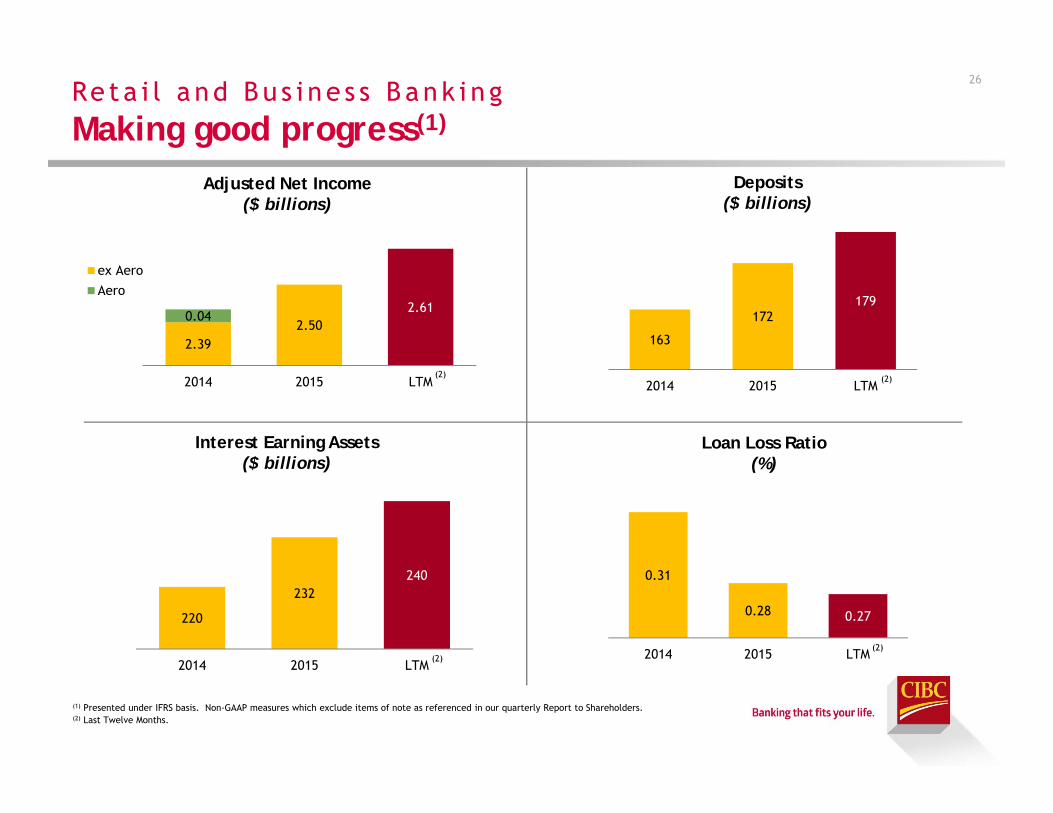
Re ta i l a nd Bu s i ne s s B ank i n gMaking good progress(1)
26
(1) Presented under IFRS basis. Non-GAAP measures which exclude items of note as referenced in our quarterly Report to Shareholders.(2) Last Twelve Months.
Adjusted Net Income($ billions)
Deposits($ billions)
Interest Earning Assets($ billions)
Loan Loss Ratio(%)
(2)
(2)
(2)
(2)
2.392.50
2.610.04
2014 2015 LTM
ex Aero
Aero
163
172179
2014 2015 LTM
220
232240
2014 2015 LTM
0.31
0.28 0.27
2014 2015 LTM
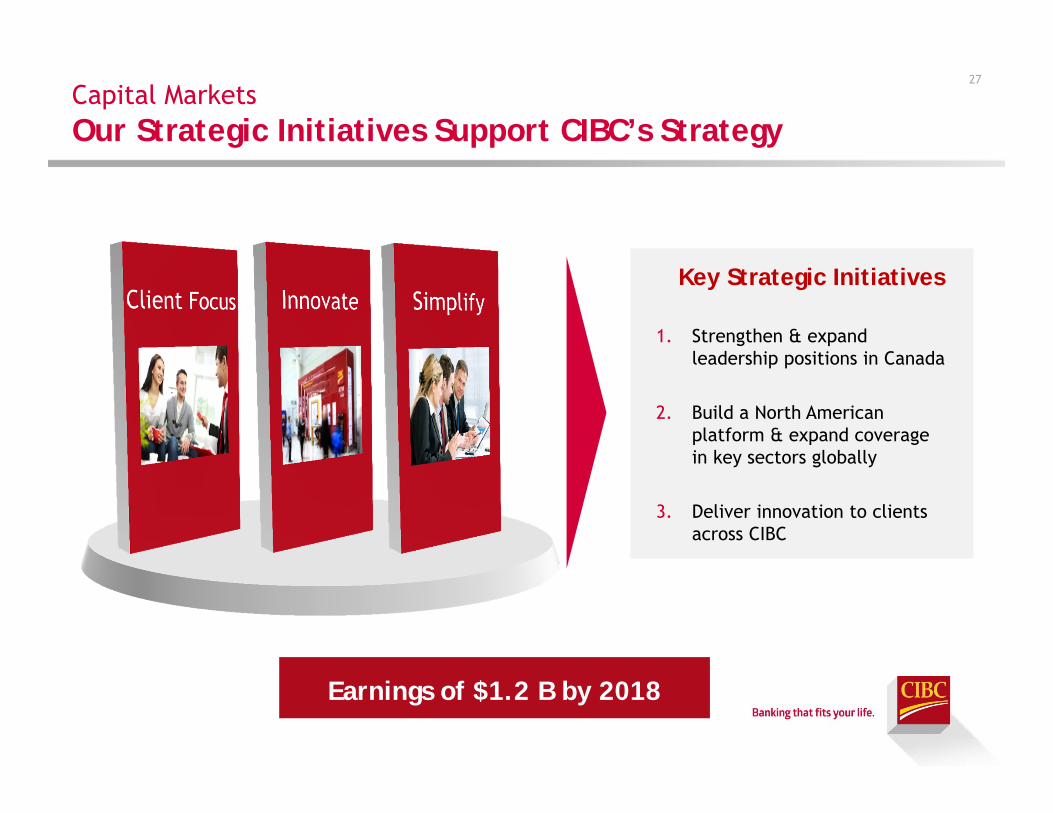
Capital MarketsOur Strategic Initiatives Support CIBC’s Strategy
Key Strategic Initiatives
1. Strengthen & expand leadership positions in Canada
2. Build a North American platform & expand coverage in key sectors globally
3. Deliver innovation to clients across CIBC
Earnings of $1.2 B by 2018
27
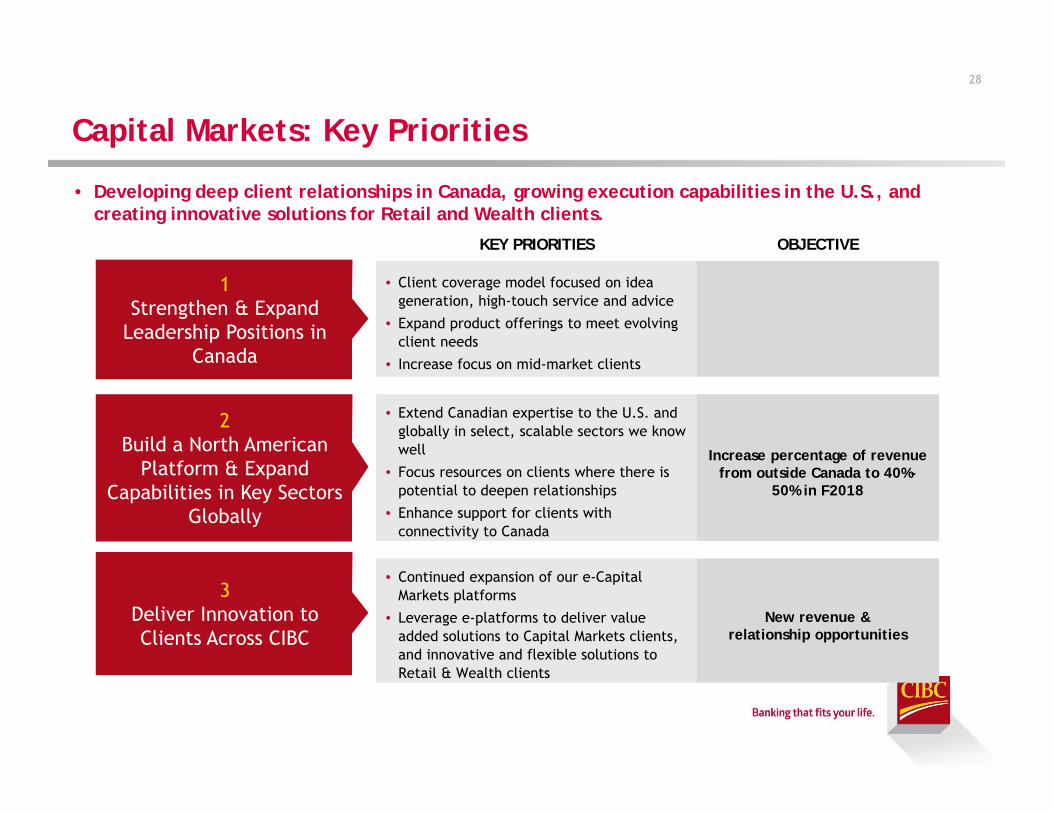
Capital Markets: Key Priorities
• Developing deep client relationships in Canada, growing execution capabilities in the U.S., and creating innovative solutions for Retail and Wealth clients.
28
2Build a North American
Platform & Expand Capabilities in Key Sectors
Globally
3Deliver Innovation to Clients Across CIBC
1Strengthen & Expand
Leadership Positions in Canada
KEY PRIORITIES OBJECTIVE
• Client coverage model focused on idea generation, high-touch service and advice
• Expand product offerings to meet evolving client needs
• Increase focus on mid-market clients
• Extend Canadian expertise to the U.S. and globally in select, scalable sectors we know well
• Focus resources on clients where there is potential to deepen relationships
• Enhance support for clients with connectivity to Canada
Increase percentage of revenue from outside Canada to 40%-
50% in F2018
• Continued expansion of our e-Capital Markets platforms
• Leverage e-platforms to deliver value added solutions to Capital Markets clients, and innovative and flexible solutions to Retail & Wealth clients
New revenue & relationship opportunities
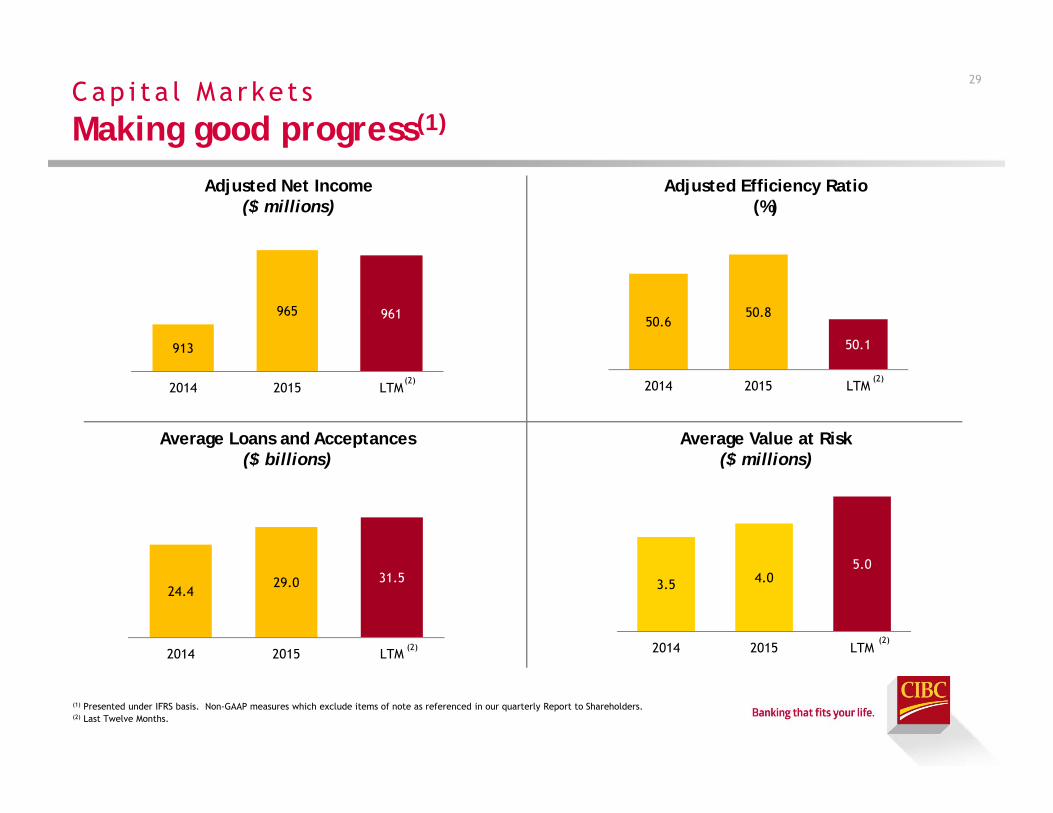
Cap i t a l Ma r ke t sMaking good progress(1)
29
(1) Presented under IFRS basis. Non-GAAP measures which exclude items of note as referenced in our quarterly Report to Shareholders.(2) Last Twelve Months.
Adjusted Net Income($ millions)
Adjusted Efficiency Ratio(%)
Average Loans and Acceptances($ billions)
Average Value at Risk($ millions)
(2) (2)
(2)(2)
913
965 961
2014 2015 LTM
50.650.8
50.1
2014 2015 LTM
24.429.0 31.5
2014 2015 LTM
3.5 4.05.0
2014 2015 LTM
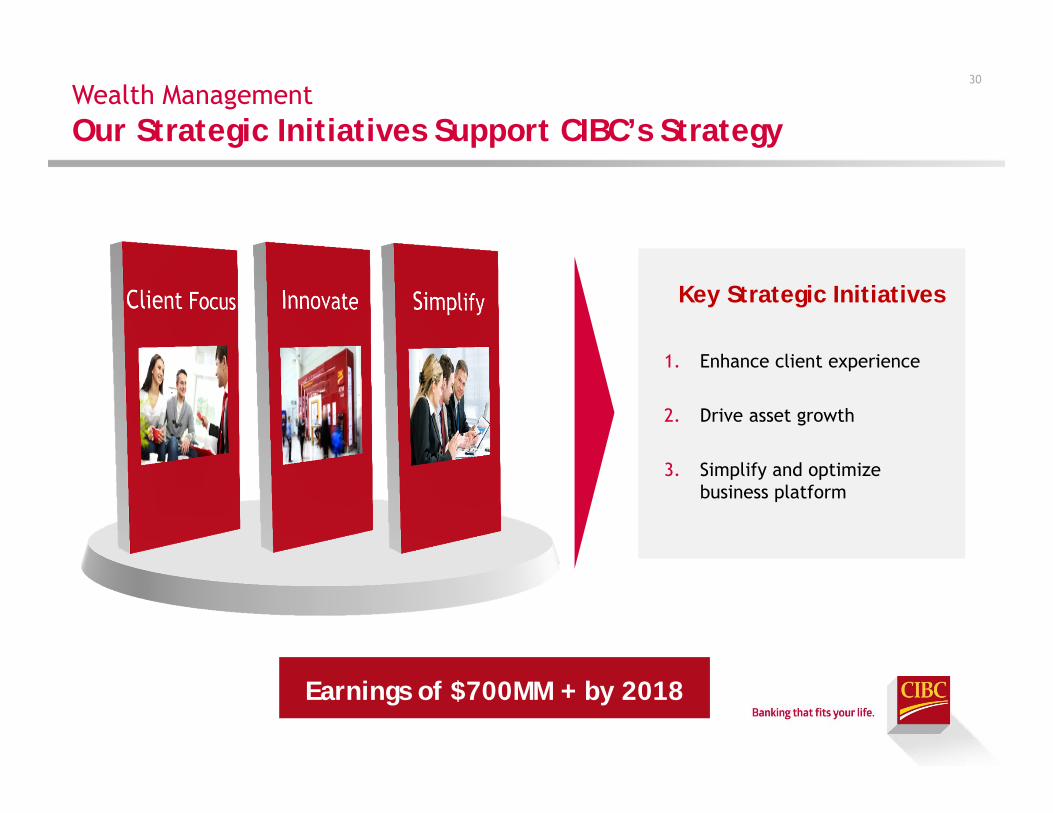
Wealth ManagementOur Strategic Initiatives Support CIBC’s Strategy
Key Strategic Initiatives
1. Enhance client experience
2. Drive asset growth
3. Simplify and optimize business platform
Earnings of $700MM + by 2018
30
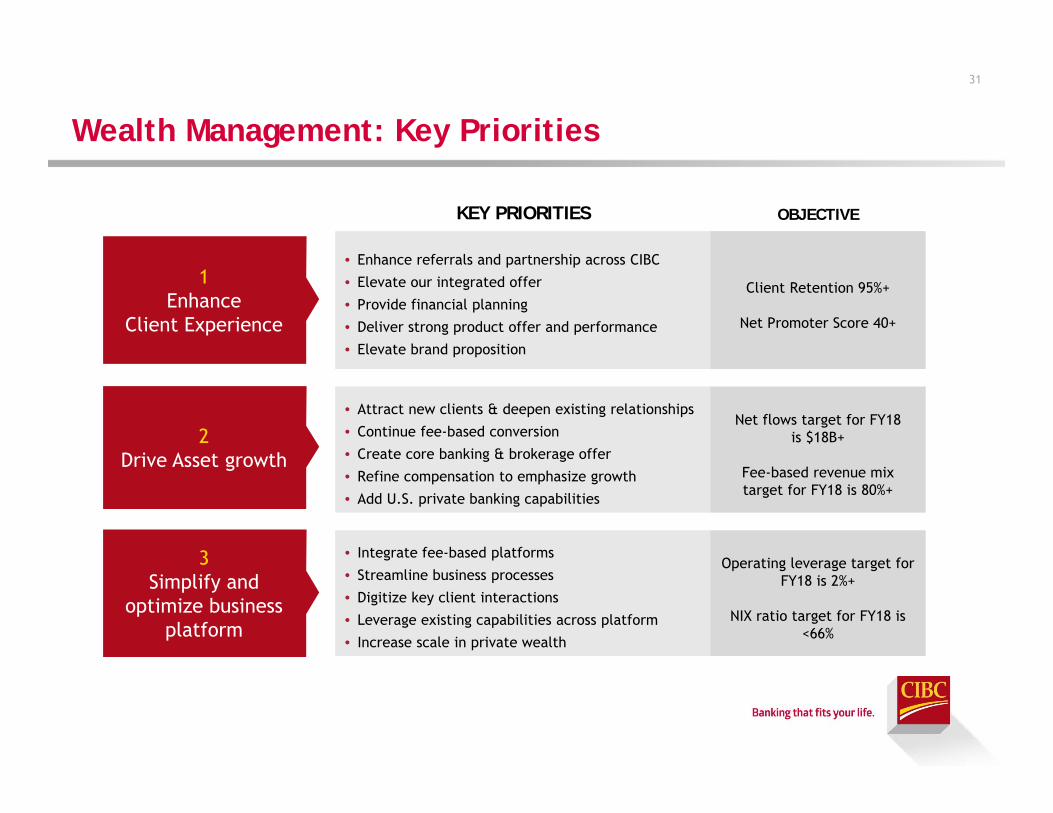
Wealth Management: Key Priorities
31
2Drive Asset growth
3Simplify and
optimize business platform
1Enhance
Client Experience
KEY PRIORITIES OBJECTIVE
• Enhance referrals and partnership across CIBC
• Elevate our integrated offer
• Provide financial planning
• Deliver strong product offer and performance
• Elevate brand proposition
Client Retention 95%+
Net Promoter Score 40+
• Attract new clients & deepen existing relationships
• Continue fee-based conversion
• Create core banking & brokerage offer
• Refine compensation to emphasize growth
• Add U.S. private banking capabilities
Net flows target for FY18 is $18B+
Fee-based revenue mix target for FY18 is 80%+
• Integrate fee-based platforms
• Streamline business processes
• Digitize key client interactions
• Leverage existing capabilities across platform
• Increase scale in private wealth
Operating leverage target for FY18 is 2%+
NIX ratio target for FY18 is <66%
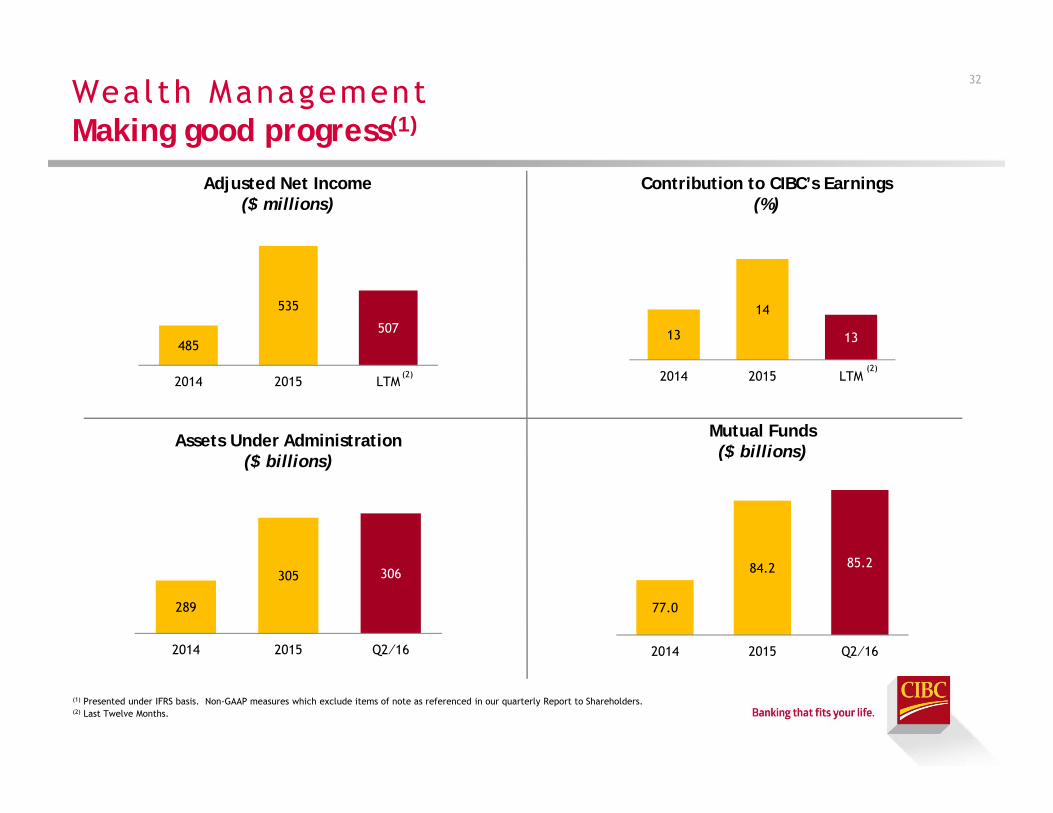
Wealth ManagementMaking good progress(1)
32
(1) Presented under IFRS basis. Non-GAAP measures which exclude items of note as referenced in our quarterly Report to Shareholders.(2) Last Twelve Months.
Adjusted Net Income($ millions)
Contribution to CIBC’s Earnings(%)
Assets Under Administration($ billions)
Mutual Funds($ billions)
(2)
485
535
507
2014 2015 LTM(2)
289
305 306
2014 2015 Q2⁄16
77.0
84.2 85.2
2014 2015 Q2⁄16
13
14
13
2014 2015 LTM
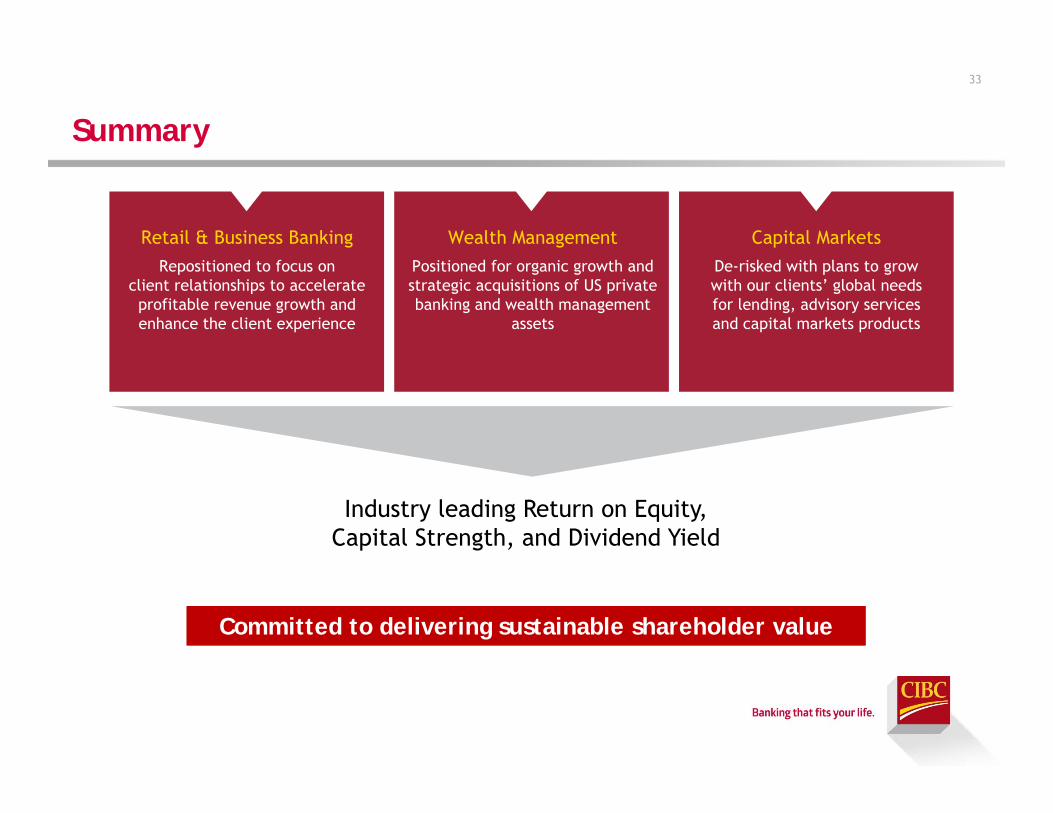
Summary
33
Retail & Business BankingRepositioned to focus on
client relationships to accelerate profitable revenue growth and enhance the client experience
Wealth ManagementPositioned for organic growth and strategic acquisitions of US private banking and wealth management
assets
Capital MarketsDe-risked with plans to grow with our clients’ global needs for lending, advisory services and capital markets products
Industry leading Return on Equity, Capital Strength, and Dividend Yield
Committed to delivering sustainable shareholder value
CIBC Contacts
JOHN FERREN, SENIOR VICE-PRESIDENTEmail: [email protected]
Phone: +1 416-980-2088
SELL-SIDE ANALYSTS, CONTACT:JASON PATCHETT, SENIOR DIRECTOR
Email: [email protected]: +1 416-980-8691
INSTITUTIONAL INVESTORS, CONTACT:ALICE DUNNING, SENIOR DIRECTOR
Email: [email protected]: +1 416-861-8870
34