Embed Size (px)
Citation preview

Fixed Income ixed Income Investor PresentationInvestor Presentation
All figures are in Canadian dollars and as at March 31, 2021, unless otherwise specified.
Q1 2021 Results
2
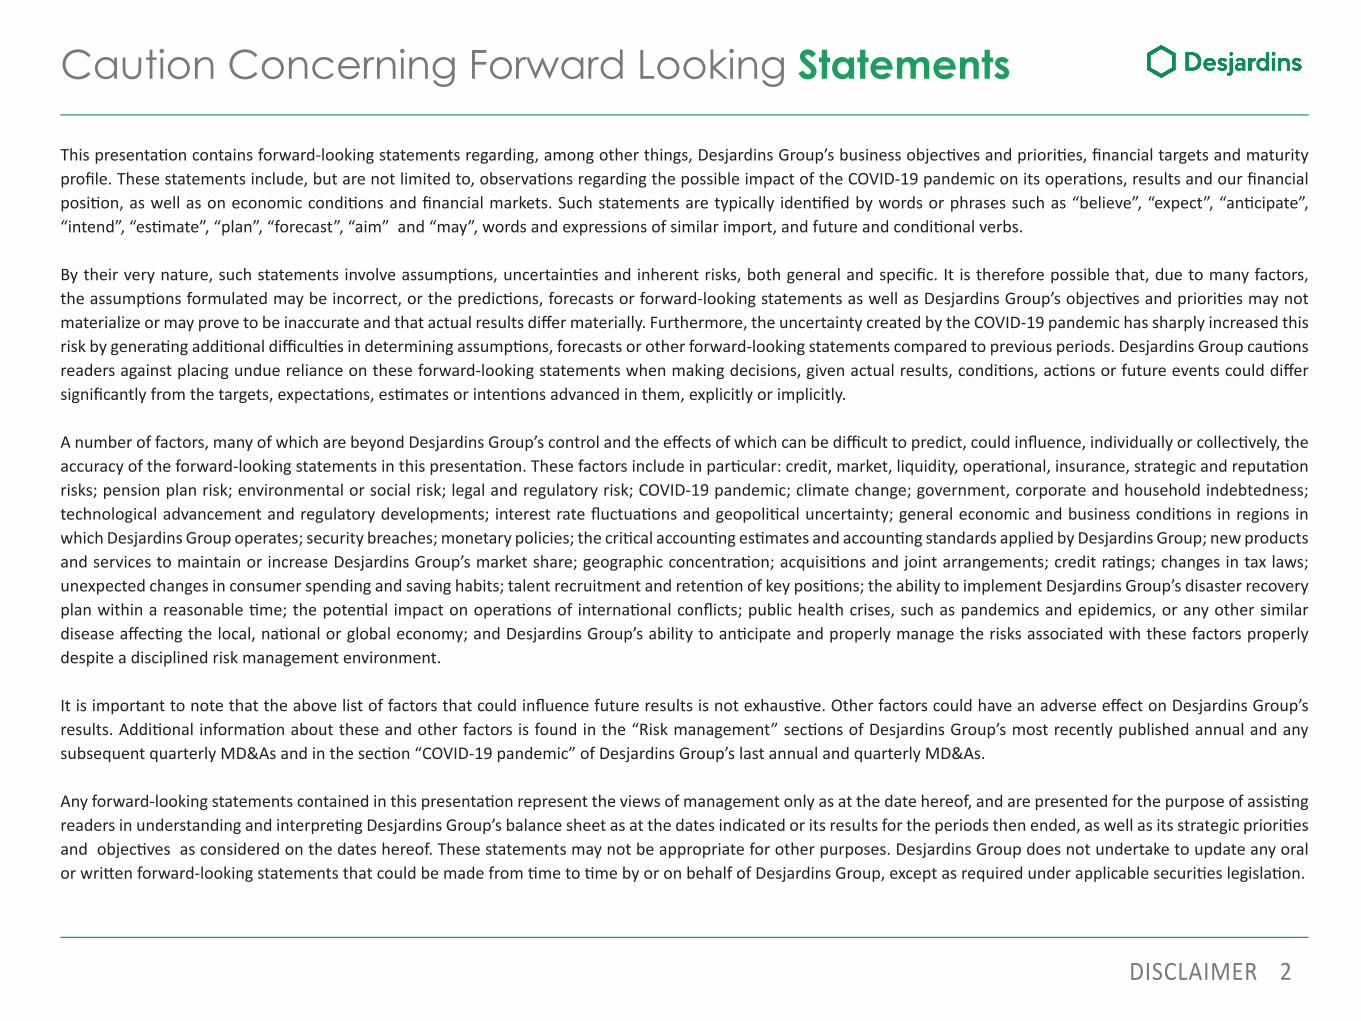
Caution Concerning Forward Looking Statements
DISCLAIMER
This presenta on contains forward-looking statements regarding, among other things, Desjardins Group’s business objec ves and priori es, fi nancial targets and maturity profi le. These statements include, but are not limited to, observa ons regarding the possible impact of the COVID-19 pandemic on its opera ons, results and our fi nancial posi on, as well as on economic condi ons and fi nancial markets. Such statements are typically iden fi ed by words or phrases such as “believe”, “expect”, “an cipate”, “intend”, “es mate”, “plan”, “forecast”, “aim” and “may”, words and expressions of similar import, and future and condi onal verbs.
By their very nature, such statements involve assump ons, uncertain es and inherent risks, both general and specifi c. It is therefore possible that, due to many factors, the assump ons formulated may be incorrect, or the predic ons, forecasts or forward-looking statements as well as Desjardins Group’s objec ves and priori es may not materialize or may prove to be inaccurate and that actual results diff er materially. Furthermore, the uncertainty created by the COVID-19 pandemic has sharply increased this risk by genera ng addi onal diffi cul es in determining assump ons, forecasts or other forward-looking statements compared to previous periods. Desjardins Group cau ons readers against placing undue reliance on these forward-looking statements when making decisions, given actual results, condi ons, ac ons or future events could diff er signifi cantly from the targets, expecta ons, es mates or inten ons advanced in them, explicitly or implicitly.
A number of factors, many of which are beyond Desjardins Group’s control and the eff ects of which can be diffi cult to predict, could infl uence, individually or collec vely, the accuracy of the forward-looking statements in this presenta on. These factors include in par cular: credit, market, liquidity, opera onal, insurance, strategic and reputa on risks; pension plan risk; environmental or social risk; legal and regulatory risk; COVID-19 pandemic; climate change; government, corporate and household indebtedness; technological advancement and regulatory developments; interest rate fl uctua ons and geopoli cal uncertainty; general economic and business condi ons in regions in which Desjardins Group operates; security breaches; monetary policies; the cri cal accoun ng es mates and accoun ng standards applied by Desjardins Group; new products and services to maintain or increase Desjardins Group’s market share; geographic concentra on; acquisi ons and joint arrangements; credit ra ngs; changes in tax laws; unexpected changes in consumer spending and saving habits; talent recruitment and reten on of key posi ons; the ability to implement Desjardins Group’s disaster recovery plan within a reasonable me; the poten al impact on opera ons of interna onal confl icts; public health crises, such as pandemics and epidemics, or any other similar disease aff ec ng the local, na onal or global economy; and Desjardins Group’s ability to an cipate and properly manage the risks associated with these factors properly despite a disciplined risk management environment.
It is important to note that the above list of factors that could infl uence future results is not exhaus ve. Other factors could have an adverse eff ect on Desjardins Group’s results. Addi onal informa on about these and other factors is found in the “Risk management” sec ons of Desjardins Group’s most recently published annual and any subsequent quarterly MD&As and in the sec on “COVID-19 pandemic” of Desjardins Group’s last annual and quarterly MD&As.
Any forward-looking statements contained in this presenta on represent the views of management only as at the date hereof, and are presented for the purpose of assis ng readers in understanding and interpre ng Desjardins Group’s balance sheet as at the dates indicated or its results for the periods then ended, as well as its strategic priori es and objec ves as considered on the dates hereof. These statements may not be appropriate for other purposes. Desjardins Group does not undertake to update any oral or wri en forward-looking statements that could be made from me to me by or on behalf of Desjardins Group, except as required under applicable securi es legisla on.
3
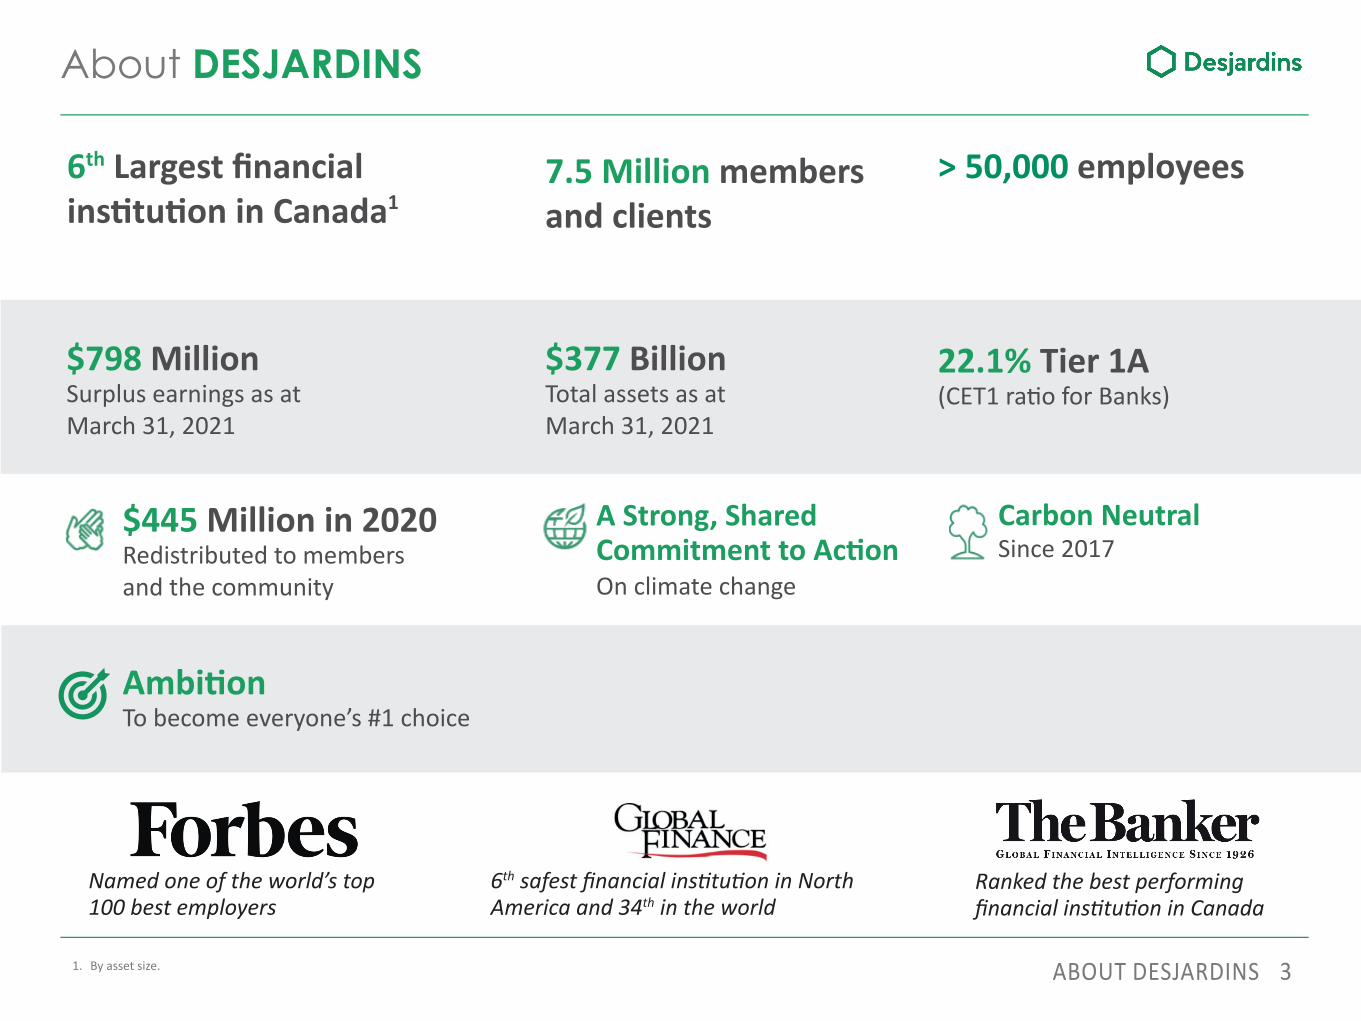
About DESJARDINS
ABOUT DESJARDINS1. By asset size.
6th Largest fi nancial ins tu on in Canada1
> 50,000 employees7.5 Million members and clients
$798 MillionSurplus earnings as at March 31, 2021
$377 BillionTotal assets as at March 31, 2021
22.1% Tier 1A(CET1 ra o for Banks)
$445 Million in 2020Redistributed to membersand the community
Carbon NeutralSince 2017
Ambi onTo become everyone’s #1 choice
Named one of the world’s top 100 best employers
6th safest fi nancial ins tu on in North America and 34th in the world
Ranked the best performing fi nancial ins tu on in Canada
A Strong, Shared Commitment to Ac on On climate change
4
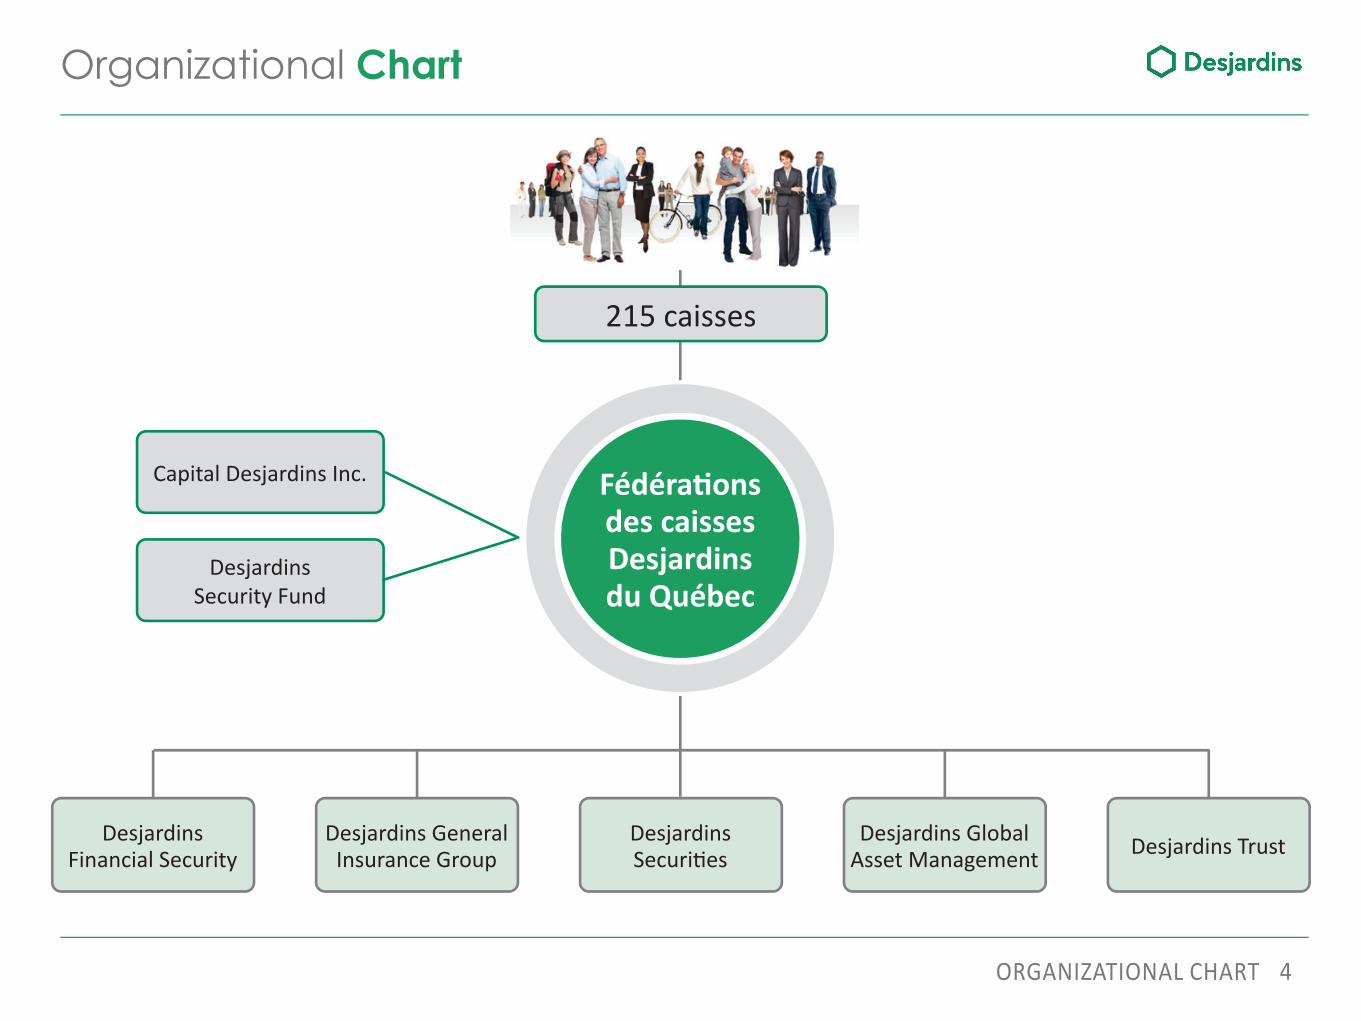
Organizational Chart
ORGANIZATIONAL CHART
215 caisses
Capital Desjardins Inc.
Desjardins Security Fund
Fédéra ons des caisses Desjardins du Québec
Desjardins Financial Security
Desjardins General Insurance Group
Desjardins Securi es
Desjardins Global Asset Management Desjardins Trust
5
FINANCIAL RESULTS
6FINANCIAL RESULTS
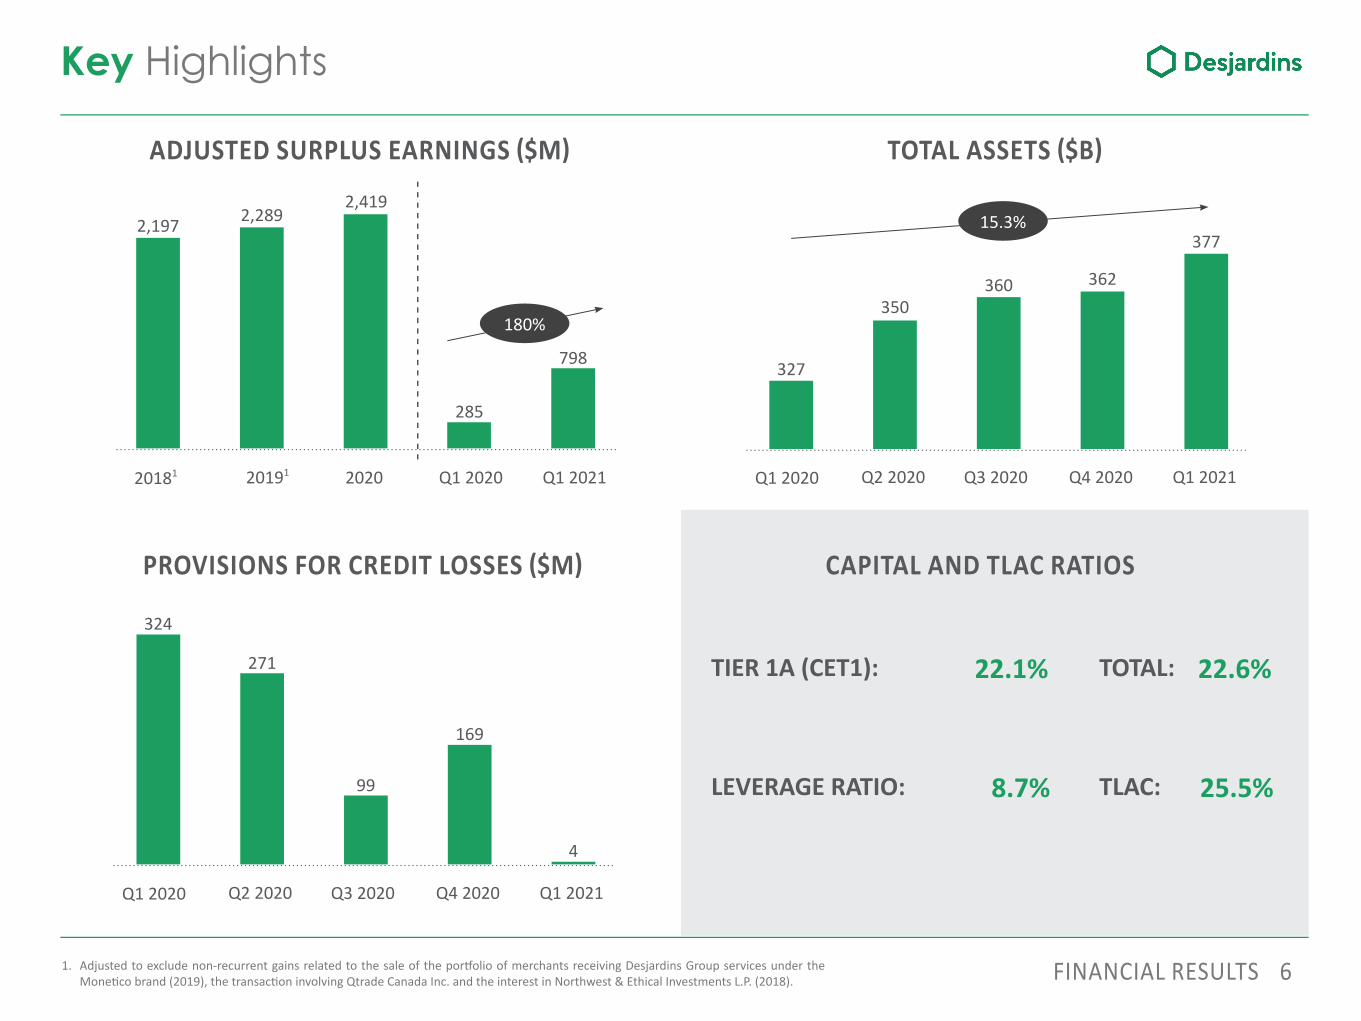
Key Highlights
ADJUSTED SURPLUS EARNINGS $M TOTAL ASSETS $B
PROVISIONS FOR CREDIT LOSSES $M CAPITAL AND TLAC RATIOS
TIER 1A (CET1):
LEVERAGE RATIO:
TOTAL:
TLAC:
22.6%
25.5%
22.1%
8.7%
Q1 2020 Q2 2020 Q3 2020 Q4 2020 Q1 2021
Q1 2020 Q2 2020 Q3 2020 Q4 2020 Q1 2021
15.3%
327
350360 362
377
324
271
169
4
99
2,197 2,2892,419
285
798
20181 20191 2020 Q1 2020 Q1 2021
1. Adjusted to exclude non-recurrent gains related to the sale of the por olio of merchants receiving Desjardins Group services under the Mone co brand (2019), the transac on involving Qtrade Canada Inc. and the interest in Northwest & Ethical Investments L.P. (2018).
180%
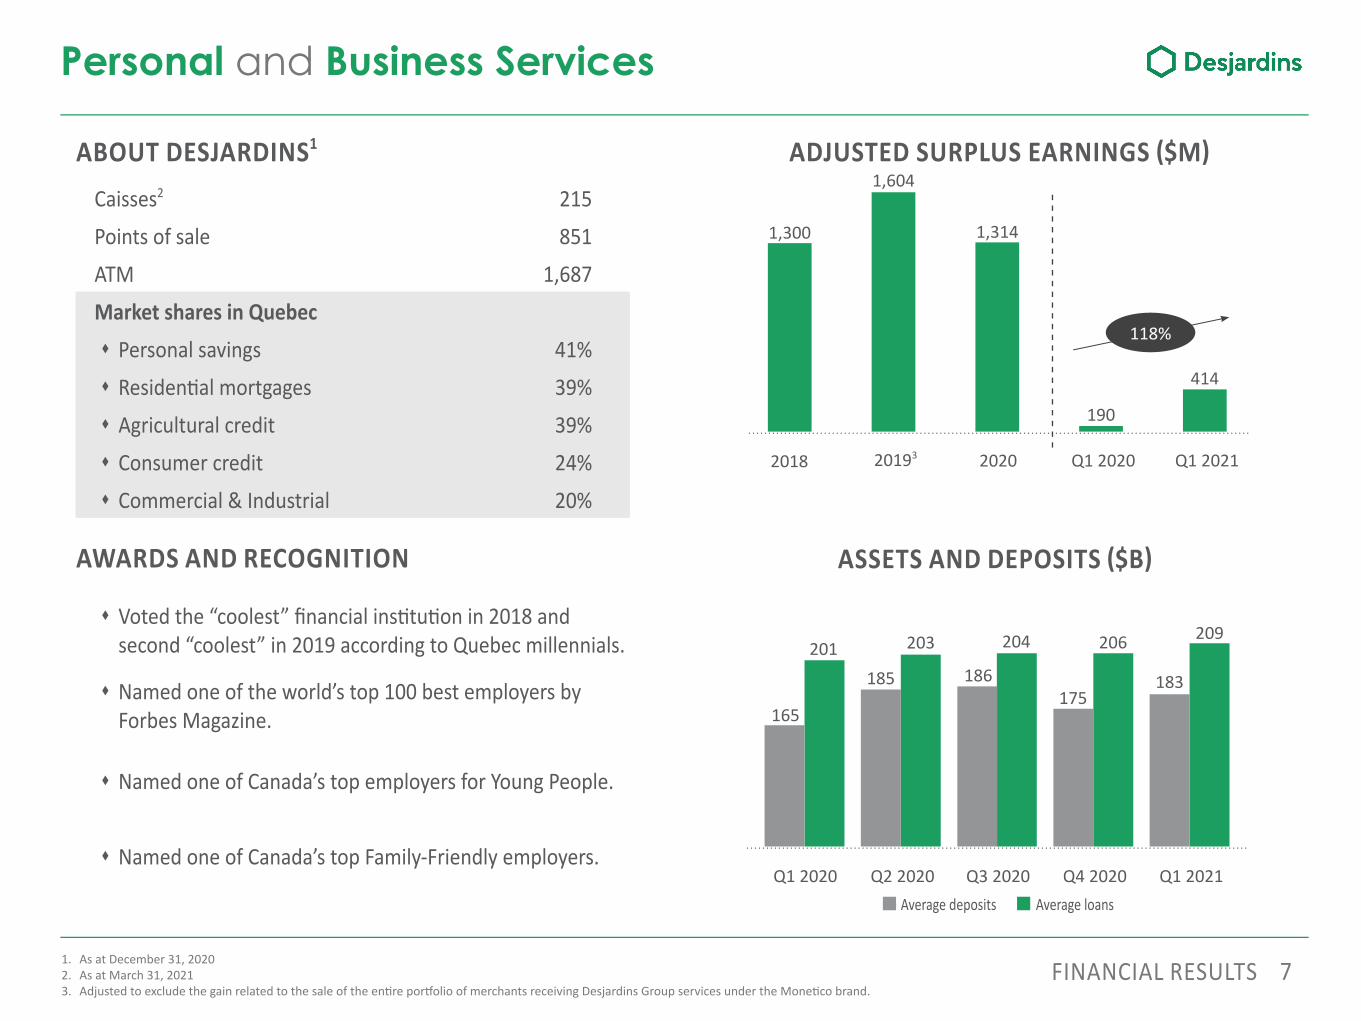
7FINANCIAL RESULTS1. As at December 31, 20202. As at March 31, 20213. Adjusted to exclude the gain related to the sale of the en re por olio of merchants receiving Desjardins Group services under the Mone co brand.
Personal and Business Services
ASSETS AND DEPOSITS $B
165
185 186175
183
201 203 204 206 209
ABOUT DESJARDINS1
Caisses2 215Points of sale 851ATM 1,687Market shares in Quebec Personal savings 41% Residen al mortgages 39% Agricultural credit 39% Consumer credit 24% Commercial & Industrial 20%
AWARDS AND RECOGNITION
Voted the “coolest” fi nancial ins tu on in 2018 and second “coolest” in 2019 according to Quebec millennials.
Named one of the world’s top 100 best employers by Forbes Magazine.
Named one of Canada’s top employers for Young People.
Named one of Canada’s top Family-Friendly employers.
ADJUSTED SURPLUS EARNINGS $M
Q1 2020 Q2 2020 Q3 2020 Q4 2020 Q1 2021Average deposits Average loans
2018 20193 2020 Q1 2020 Q1 2021
1,300
1,604
1,314
190
414
118%
8
2018 2019 2020 Q1 2020 Q1 2021
FINANCIAL RESULTS
PREMIUMS $B
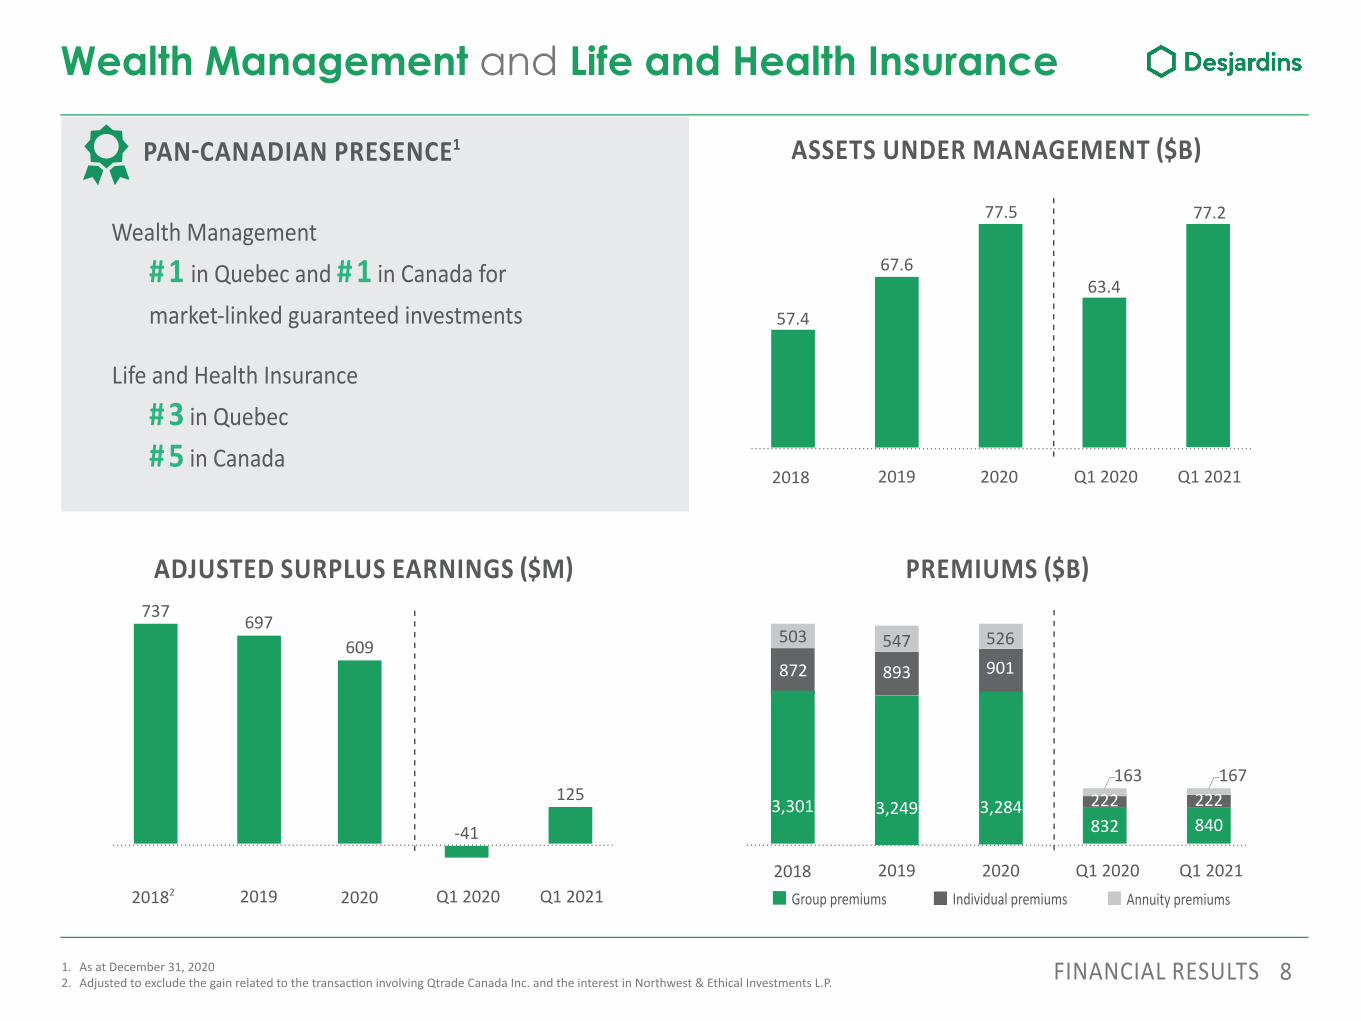
Wealth Management and Life and Health Insurance
PAN CANADIAN PRESENCE1
Wealth Management# 1 in Quebec and # 1 in Canada for market-linked guaranteed investments
Life and Health Insurance# 3 in Quebec # 5 in Canada
ADJUSTED SURPLUS EARNINGS $M
ASSETS UNDER MANAGEMENT $B
Group premiums Individual premiums Annuity premiums
-41
697609
737
125 3,301 3,249832 840
3,284
503 547
163 167
526
872 893
222 222
901
1. As at December 31, 20202. Adjusted to exclude the gain related to the transac on involving Qtrade Canada Inc. and the interest in Northwest & Ethical Investments L.P.
57.4
67.6
77.5
63.4
77.2
2018 2019 2020 Q1 2020 Q1 2021
20182 2019 2020 Q1 2020 Q1 2021
9
5,536
73.973.9 71.771.762.662.6 66.866.8
56.256.2
25.225.2 24.824.8 23.623.6 23.723.7 22.822.8
99.199.1 96.596.586.286.2 90.590.5
79.079.0
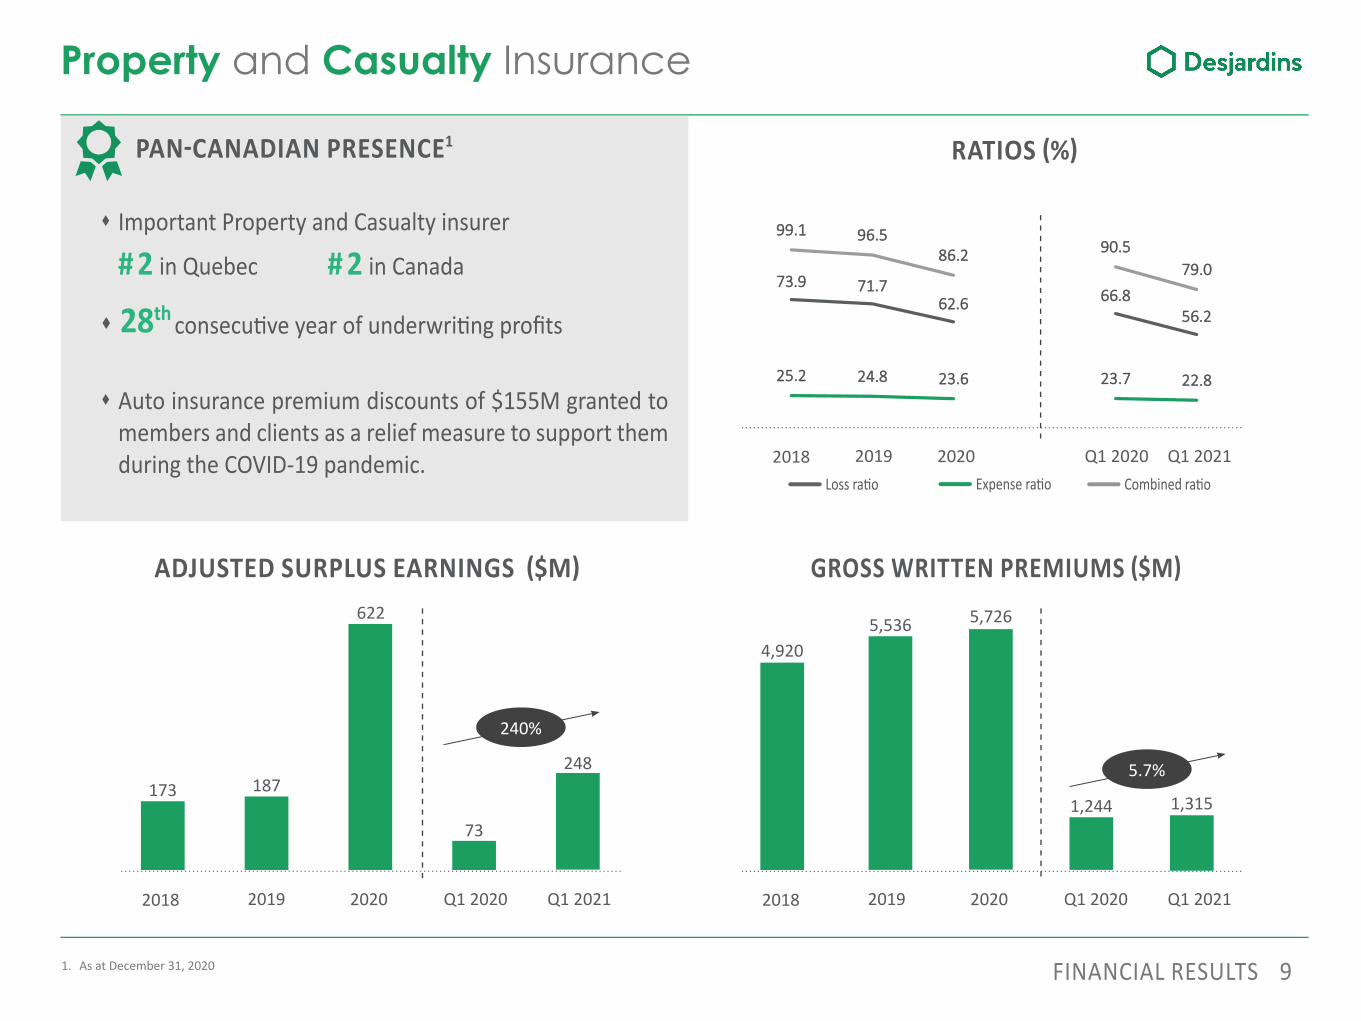
Property and Casualty Insurance
FINANCIAL RESULTS
GROSS WRITTEN PREMIUMS $MADJUSTED SURPLUS EARNINGS $M
RATIOS %
Important Property and Casualty insurer
# 2 in Quebec # 2 in Canada
consecu ve year of underwri ng profi ts
Auto insurance premium discounts of $155M granted to members and clients as a relief measure to support them during the COVID-19 pandemic.
28th
4,920
1,244 1,315
5,726
PAN CANADIAN PRESENCE1
Loss ra o Expense ra o Combined ra o
1. As at December 31, 2020
2018 2019 2020 Q1 2020 Q1 2021
173 187
622
73
248
2018 2019 2020 Q1 2020 Q1 2021 2018 2019 2020 Q1 2020 Q1 2021
5.7%
240%
10
BALANCE SHEET QUALITY
11BALANCE SHEET QUALITY
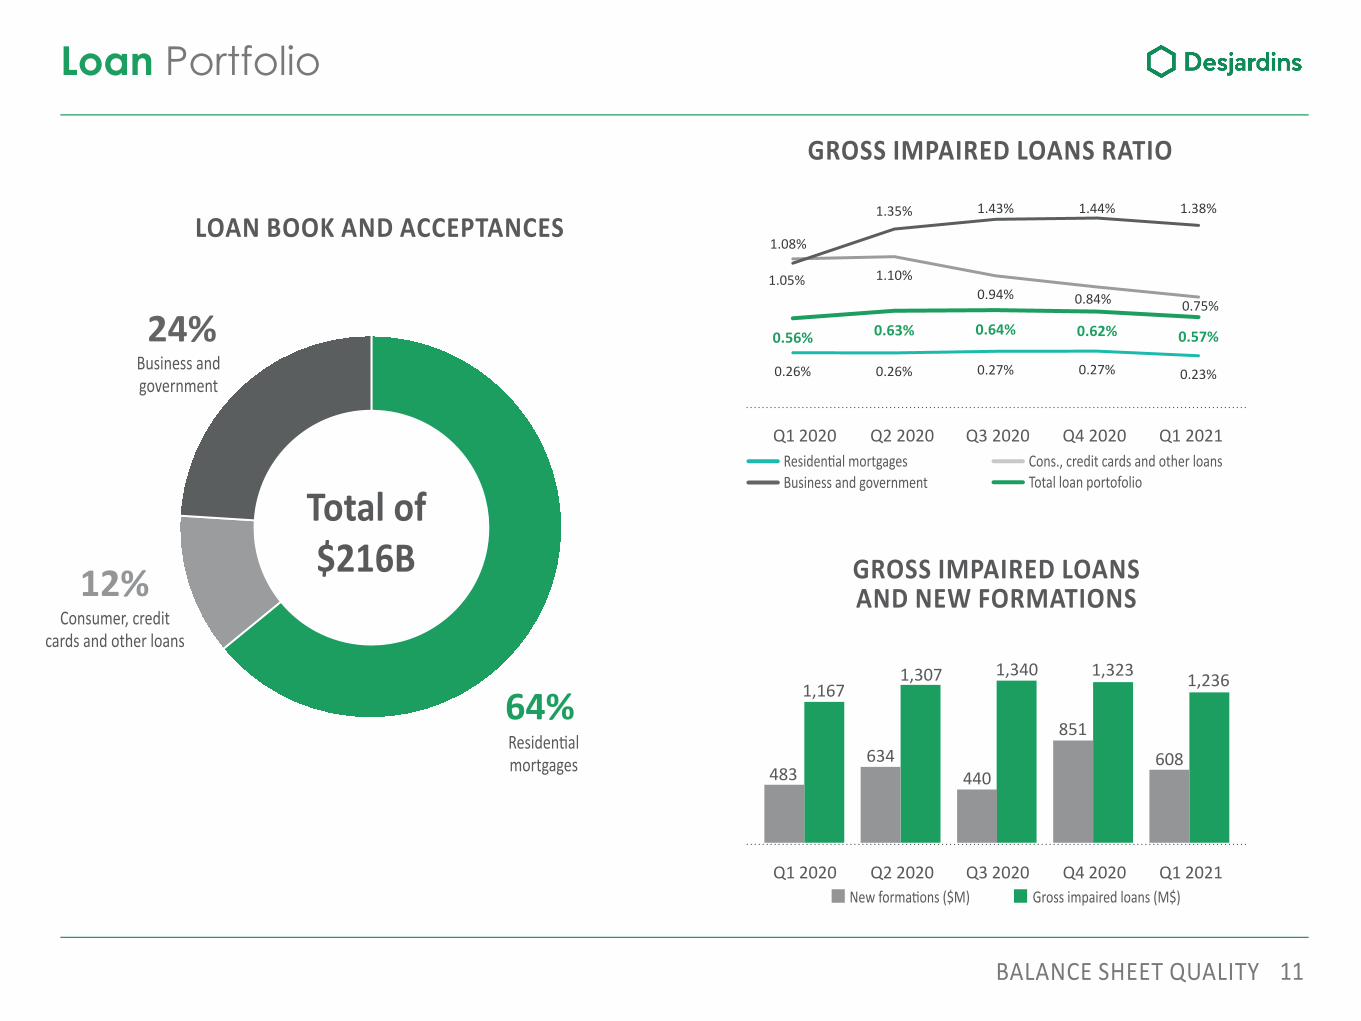
Loan Portfolio
LOAN BOOK AND ACCEPTANCES
GROSS IMPAIRED LOANS AND NEW FORMATIONS
GROSS IMPAIRED LOANS RATIO
Q1 2020 Q2 2020 Q3 2020 Q4 2020 Q1 2021
Business and government Total loan portofolioCons., credit cards and other loansResiden al mortgages
0.26% 0.26% 0.27% 0.27% 0.23%
1.08%
1.10%0.94% 0.84% 0.75%
1.05%
1.35% 1.43% 1.44% 1.38%
0.56% 0.63% 0.64% 0.62% 0.57%
483634
440
851608
1,1671,307 1,340 1,323 1,236
Q1 2020 Q2 2020 Q3 2020 Q4 2020 Q1 2021New forma ons ($M) Gross impaired loans (M$)
Residen al mortgages
64%
12%
24%Business and government
Consumer, credit cards and other loans
Total of $216B
12BALANCE SHEET QUALITY
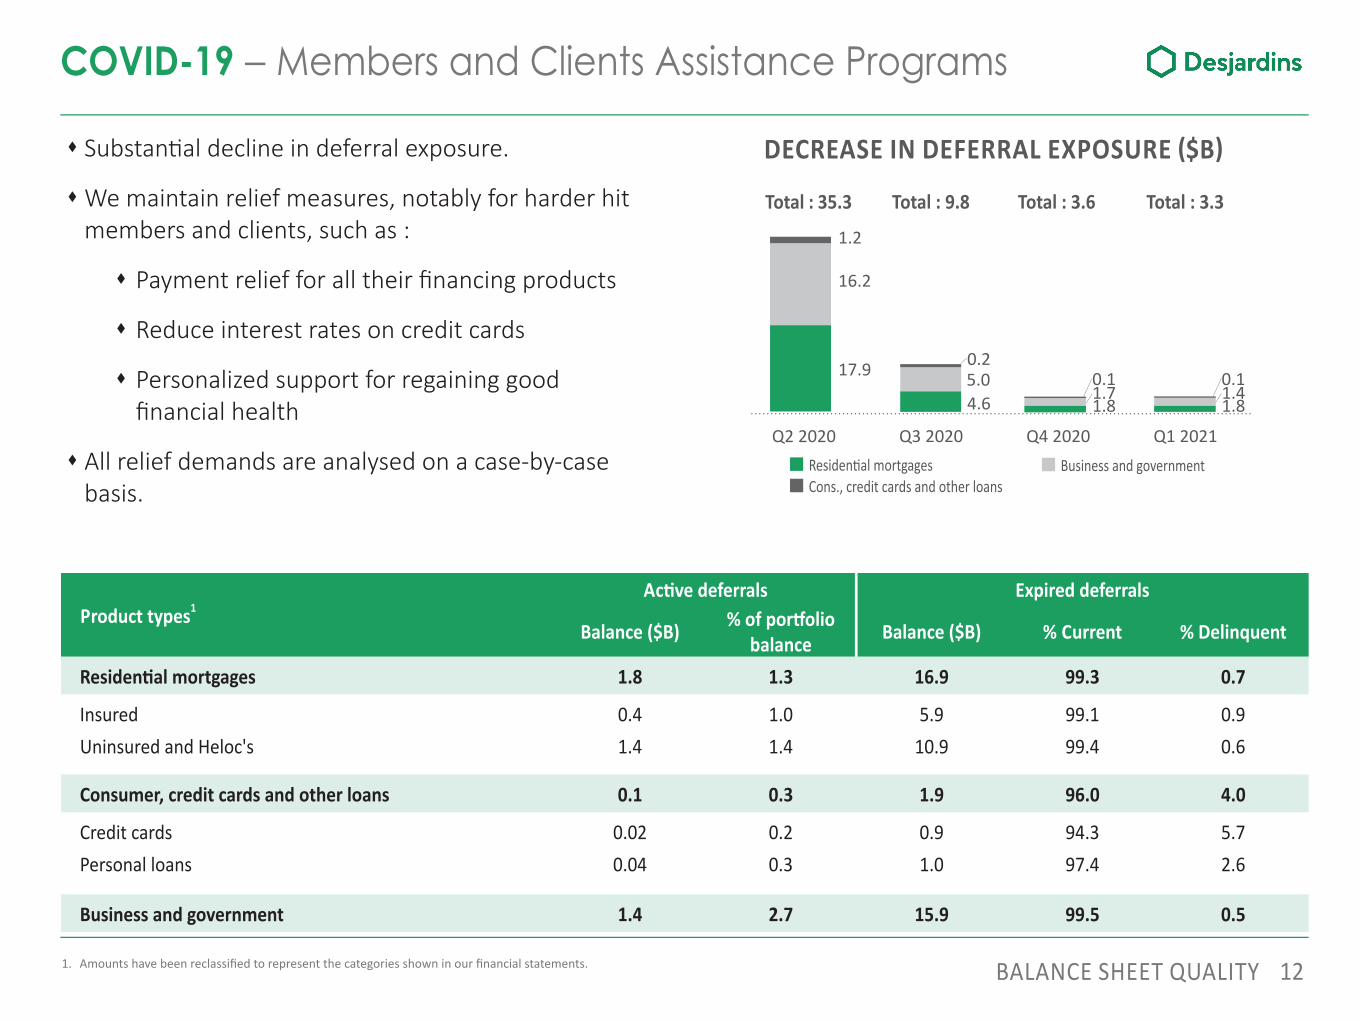
COVID-19 – Members and Clients Assistance Programs
DECREASE IN DEFERRAL EXPOSURE $B Substan al decline in deferral exposure.
We maintain relief measures, notably for harder hit members and clients, such as :
Payment relief for all their fi nancing products
Reduce interest rates on credit cards
Personalized support for regaining good fi nancial health
All relief demands are analysed on a case-by-case basis.
Residen al mortgagesCons., credit cards and other loans
Business and government
Q1 2021Q3 2020 Q4 2020
Total : 35.3 Total : 3.6 Total : 3.3
Product types1Ac ve deferrals Expired deferrals
Balance ($B) % of por olio balance Balance ($B) % Current % Delinquent
Residen al mortgages 1.8 1.3 16.9 99.3 0.7
Insured 0.4 1.0 5.9 99.1 0.9Uninsured and Heloc's 1.4 1.4 10.9 99.4 0.6
Consumer, credit cards and other loans 0.1 0.3 1.9 96.0 4.0
Credit cards 0.02 0.2 0.9 94.3 5.7Personal loans 0.04 0.3 1.0 97.4 2.6
Business and government 1.4 2.7 15.9 99.5 0.5
1. Amounts have been reclassifi ed to represent the categories shown in our fi nancial statements.
Q2 2020
Total : 9.8
4.65.00.2
1.81.70.1
1.81.40.117.9
16.2
1.2
13BALANCE SHEET QUALITY
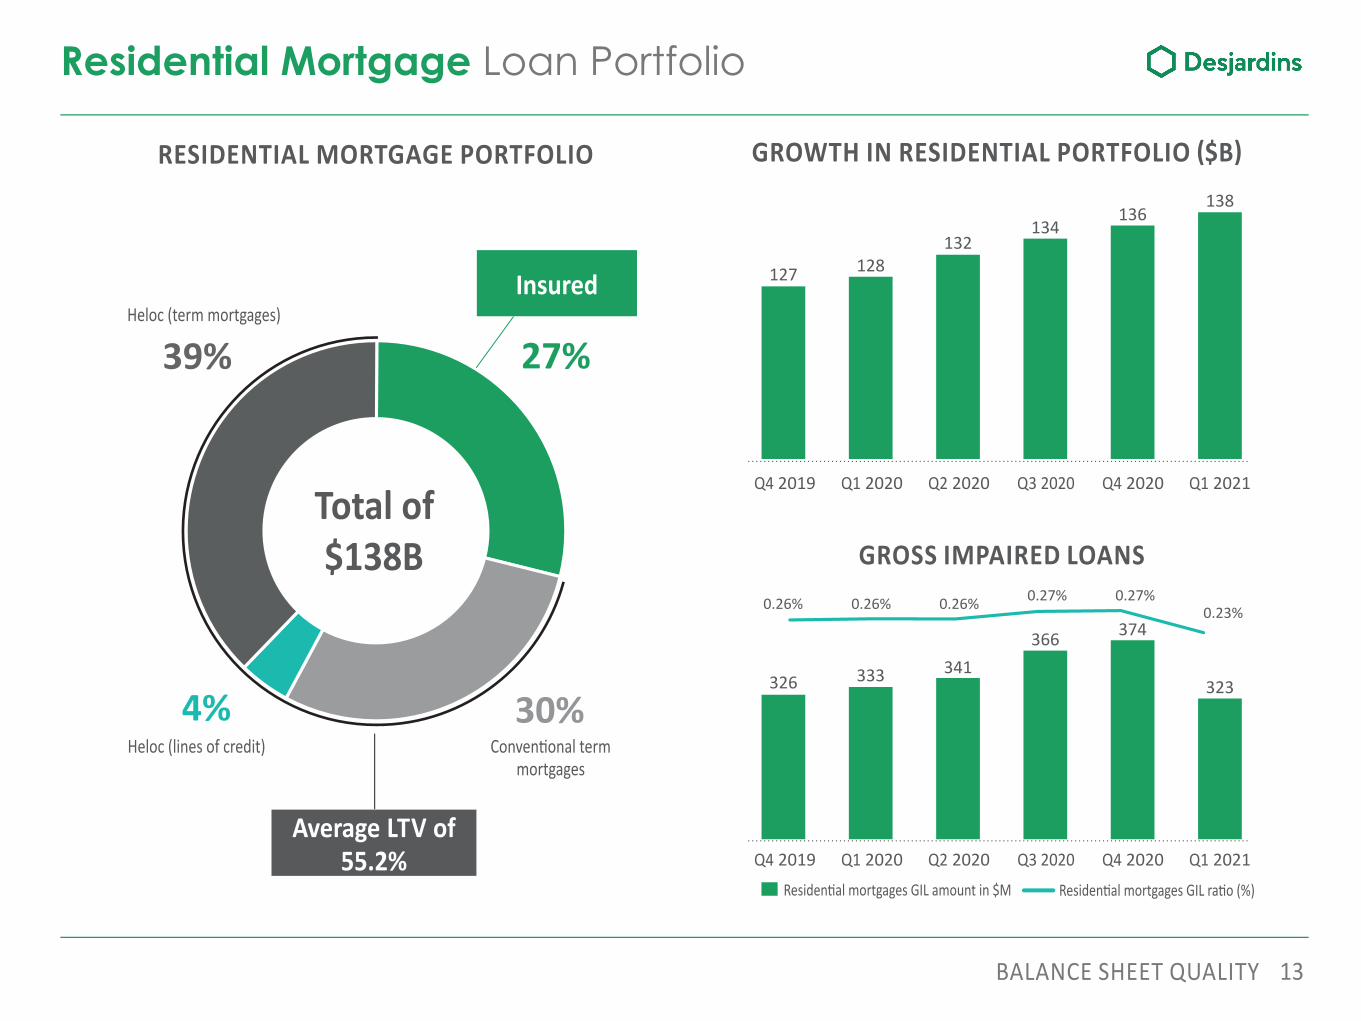
Residential Mortgage Loan Portfolio
RESIDENTIAL MORTGAGE PORTFOLIO
GROSS IMPAIRED LOANS
GROWTH IN RESIDENTIAL PORTFOLIO $B
127 128
136138
134
Q4 2020Q3 2020Q4 2019 Q1 2020 Q2 2020 Q1 2021
132
Q4 2020Q3 2020Q4 2019 Q1 2020 Q2 2020 Q1 2021Residen al mortgages GIL amount in $M Residen al mortgages GIL ra o (%)
27%
30%
39%
Heloc (lines of credit) Conven onal term mortgages
Total of $138B
Heloc (term mortgages)
4%
Average LTV of55.2%
Insured
326 333
374
323
366341
0.26% 0.26% 0.26% 0.27% 0.27%0.23%
14BALANCE SHEET QUALITY
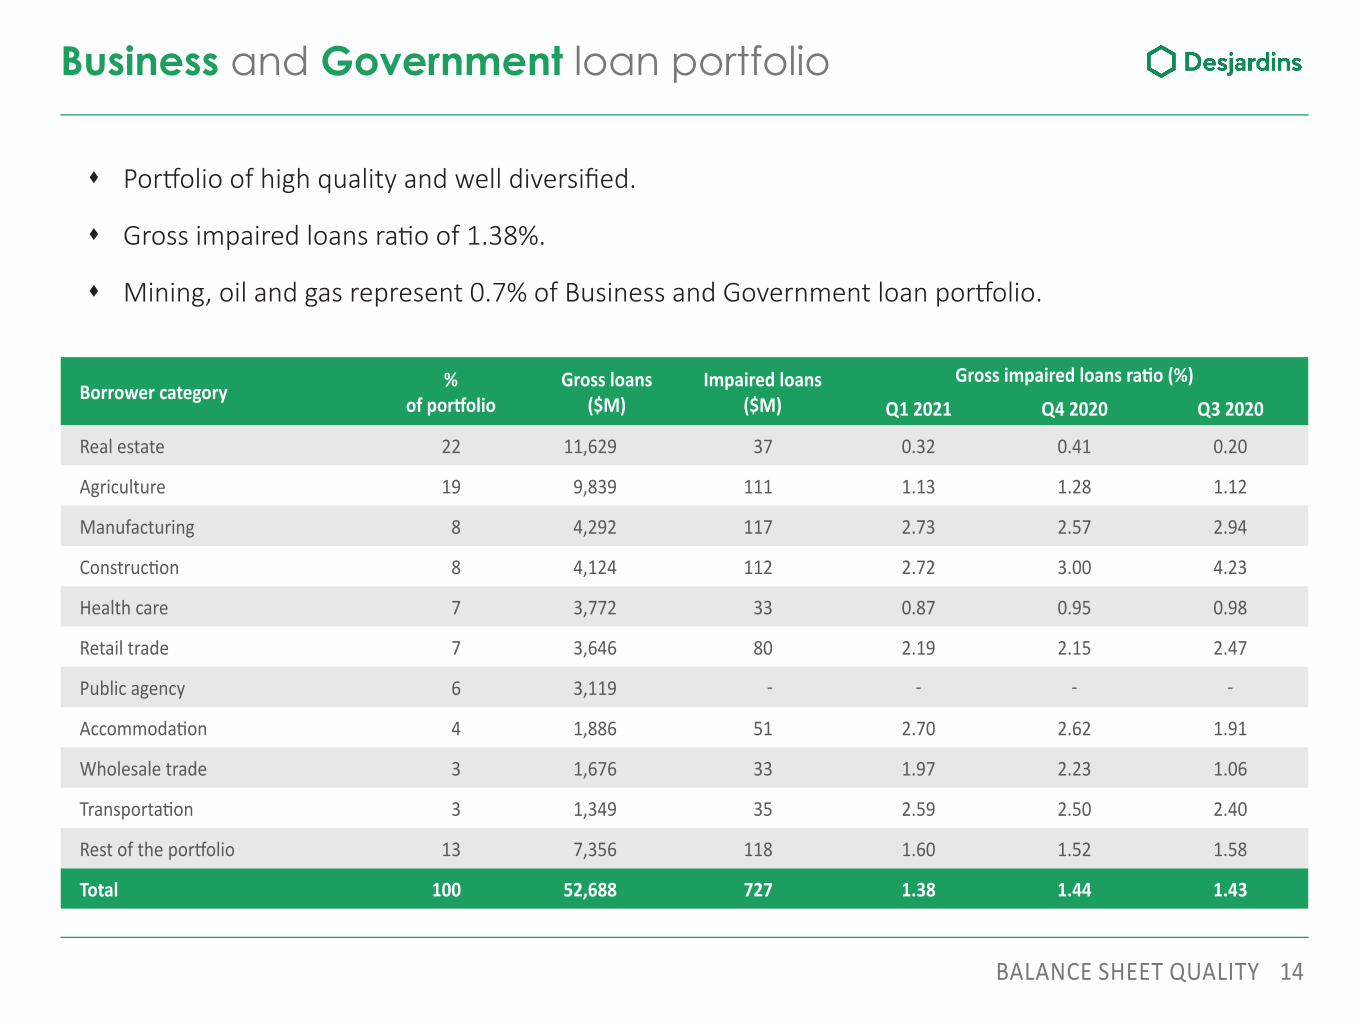
Business and Government loan portfolio
Por olio of high quality and well diversifi ed.
Gross impaired loans ra o of 1.38%.
Mining, oil and gas represent 0.7% of Business and Government loan por olio.
Borrower category % of por olio
Gross loans($M)
Impaired loans ($M)
Gross impaired loans ra o (%)Q1 2021 Q4 2020 Q3 2020
Real estate 22 11,629 37 0.32 0.41 0.20
Agriculture 19 9,839 111 1.13 1.28 1.12
Manufacturing 8 4,292 117 2.73 2.57 2.94
Construc on 8 4,124 112 2.72 3.00 4.23
Health care 7 3,772 33 0.87 0.95 0.98
Retail trade 7 3,646 80 2.19 2.15 2.47
Public agency 6 3,119
Accommoda on 4 1,886 51 2.70 2.62 1.91
Wholesale trade 3 1,676 33 1.97 2.23 1.06
Transporta on 3 1,349 35 2.59 2.50 2.40
Rest of the por olio 13 7,356 118 1.60 1.52 1.58
Total 100 52,688 727 1.38 1.44 1.43
15BALANCE SHEET QUALITY
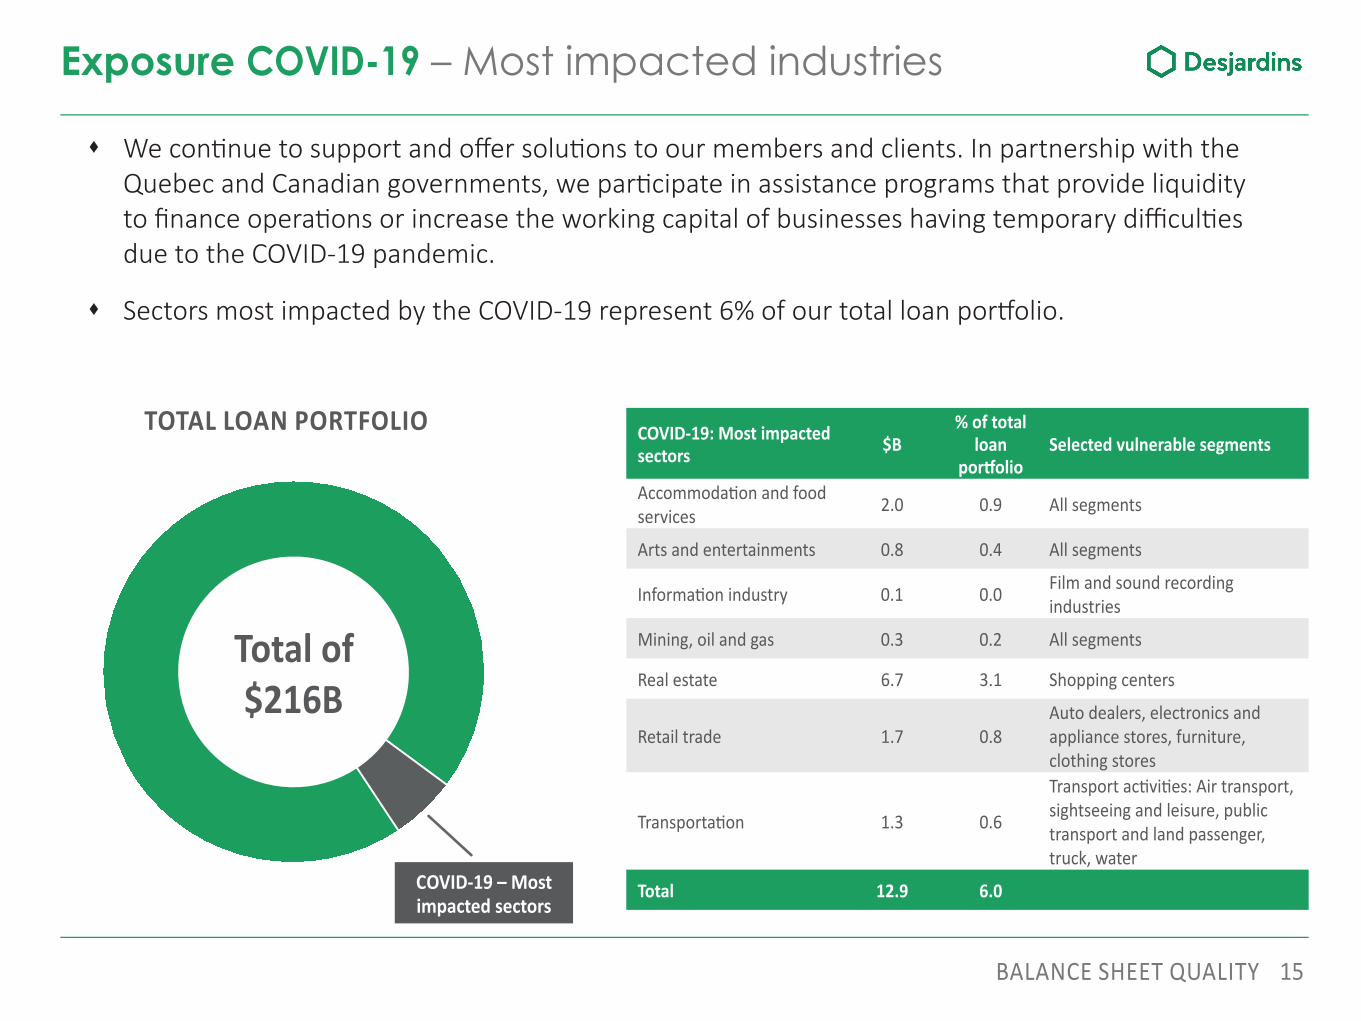
Exposure COVID-19 – Most impacted industries
We con nue to support and off er solu ons to our members and clients. In partnership with the Quebec and Canadian governments, we par cipate in assistance programs that provide liquidity to fi nance opera ons or increase the working capital of businesses having temporary diffi cul es due to the COVID-19 pandemic.
Sectors most impacted by the COVID-19 represent 6% of our total loan por olio.
TOTAL LOAN PORTFOLIO
Total of $216B
COVID-19: Most impacted sectors $B
% of total loan
por olioSelected vulnerable segments
Accommoda on and food services 2.0 0.9 All segments
Arts and entertainments 0.8 0.4 All segments
Informa on industry 0.1 0.0 Film and sound recording industries
Mining, oil and gas 0.3 0.2 All segments
Real estate 6.7 3.1 Shopping centers
Retail trade 1.7 0.8Auto dealers, electronics and appliance stores, furniture, clothing stores
Transporta on 1.3 0.6
Transport ac vi es: Air transport, sightseeing and leisure, public transport and land passenger, truck, water
Total 12.9 6.0COVID-19 – Most impacted sectors
16
LIQUIDITY and FUNDING
17
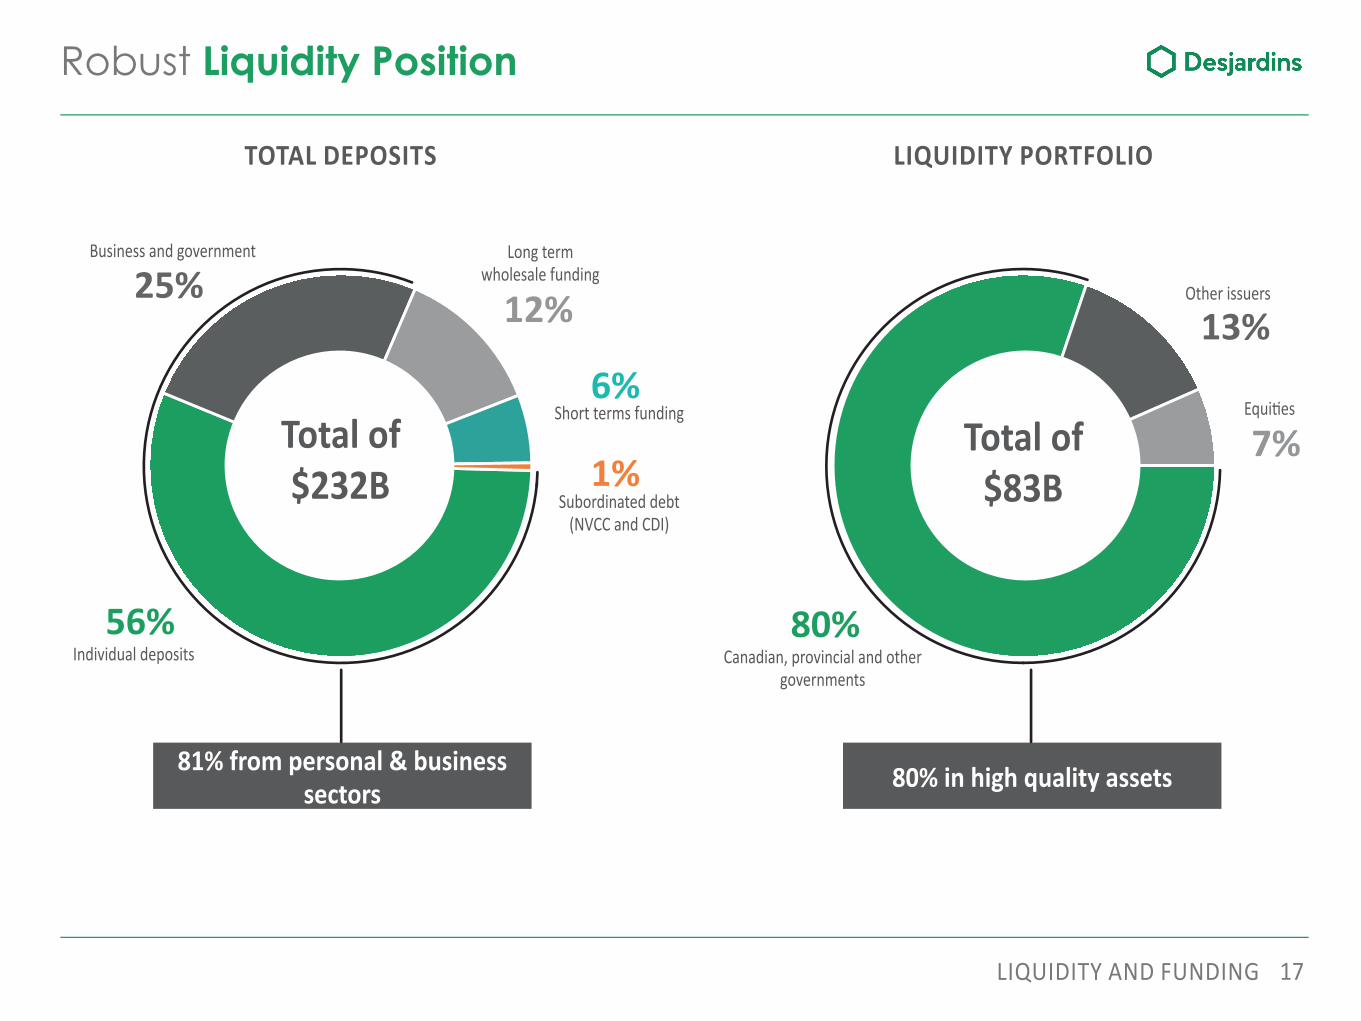
Robust Liquidity Position
LIQUIDITY AND FUNDING
TOTAL DEPOSITS
56%
12%25%Business and government Long term
wholesale funding
Subordinated debt (NVCC and CDI)
6%
81% from personal & business sectors
LIQUIDITY PORTFOLIO
1%
Individual deposits
Short terms funding
13%Other issuers
80% in high quality assets
7%Equi es
80%Canadian, provincial and other
governments
Total of $232B
Total of $83B
18
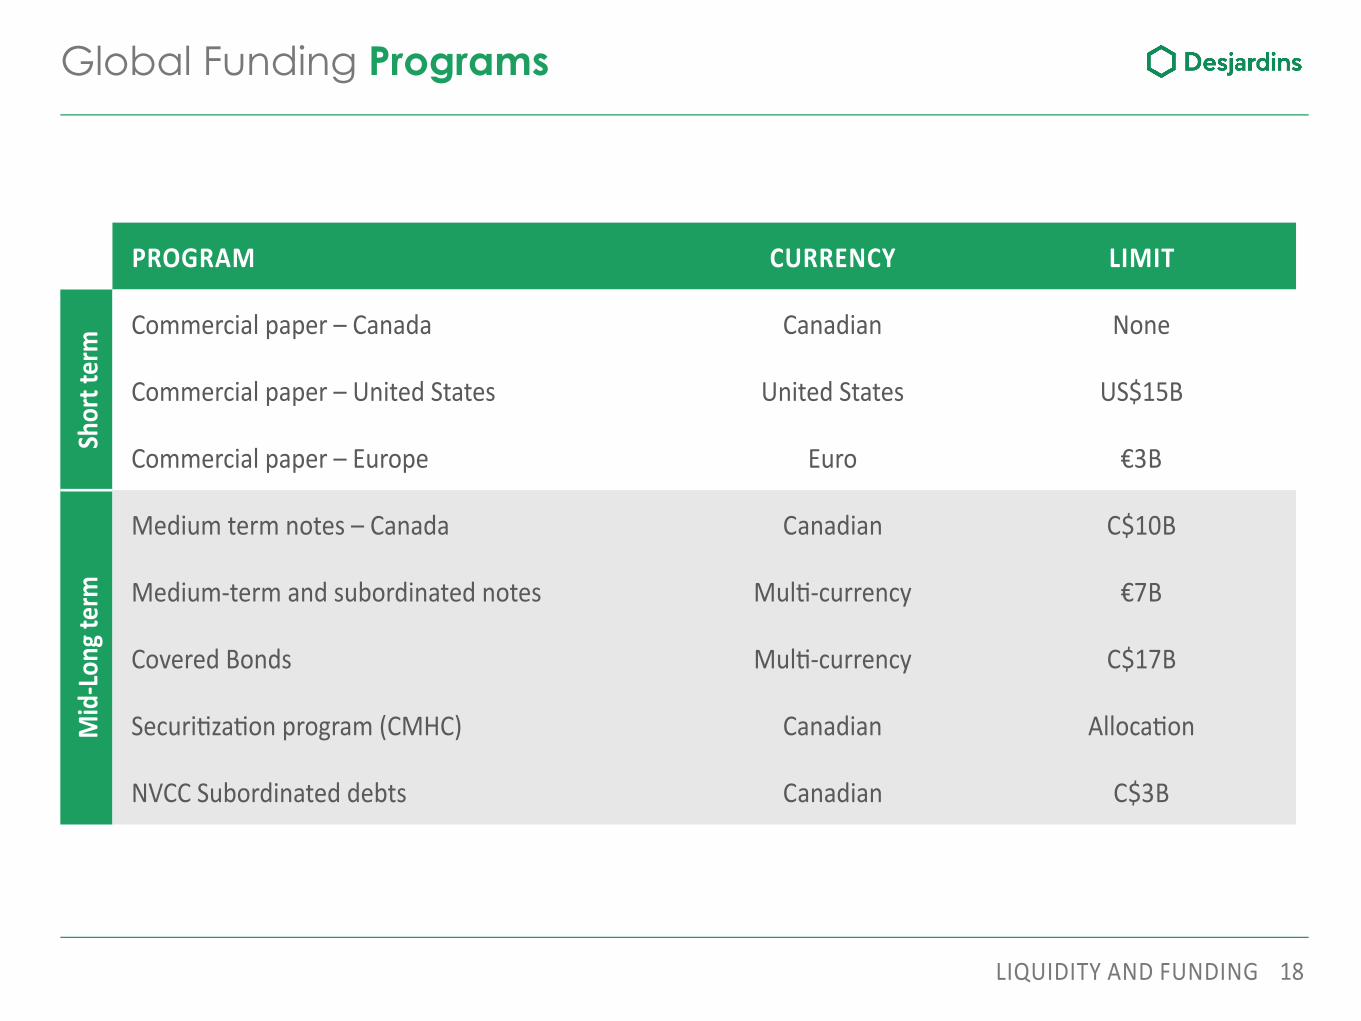
Global Funding Programs
LIQUIDITY AND FUNDING
PROGRAM CURRENCY LIMIT
Shor
t ter
m Commercial paper – Canada Canadian None
Commercial paper – United States United States US$15B
Commercial paper – Europe Euro €3B
Mid
-Long
term
Medium term notes – Canada Canadian C$10B
Medium-term and subordinated notes Mul -currency €7B
Covered Bonds Mul -currency C$17B
Securi za on program (CMHC) Canadian Alloca on
NVCC Subordinated debts Canadian C$3B
19
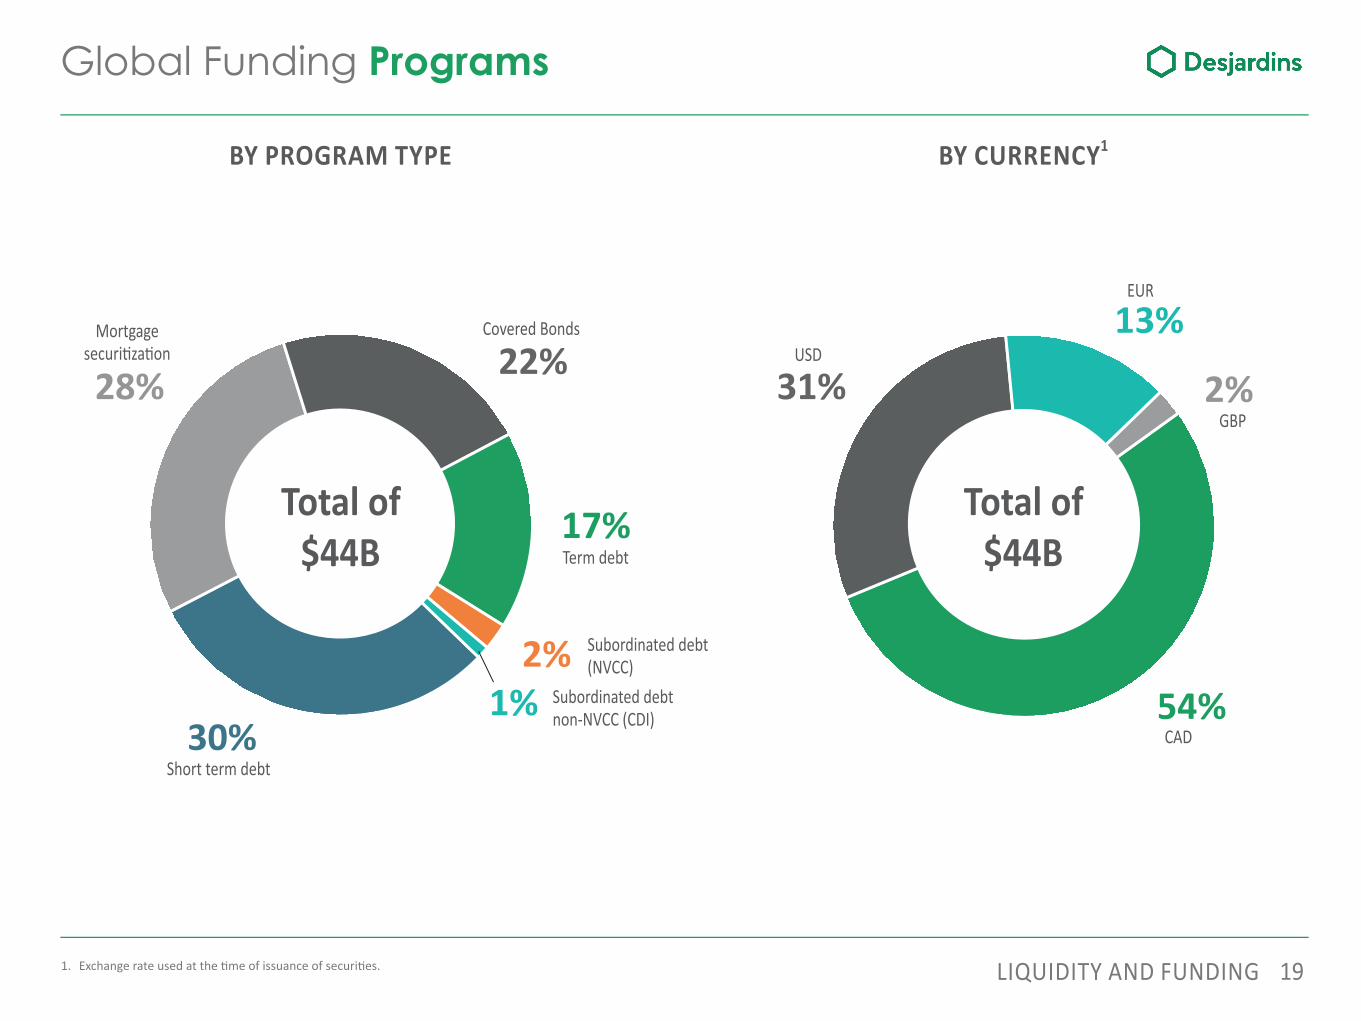
Global Funding Programs
LIQUIDITY AND FUNDING
BY PROGRAM TYPE
17%
28% 22%Covered BondsMortgage
securi za on
Subordinated debt non-NVCC (CDI)1%
BY CURRENCY1
1. Exchange rate used at the me of issuance of securi es.
30%
2%
Short term debt
Subordinated debt (NVCC)
Term debt
31%USD
EUR
13%
2%GBP
54%CAD
Total of $44B
Total of $44B
20LIQUIDITY AND FUNDING
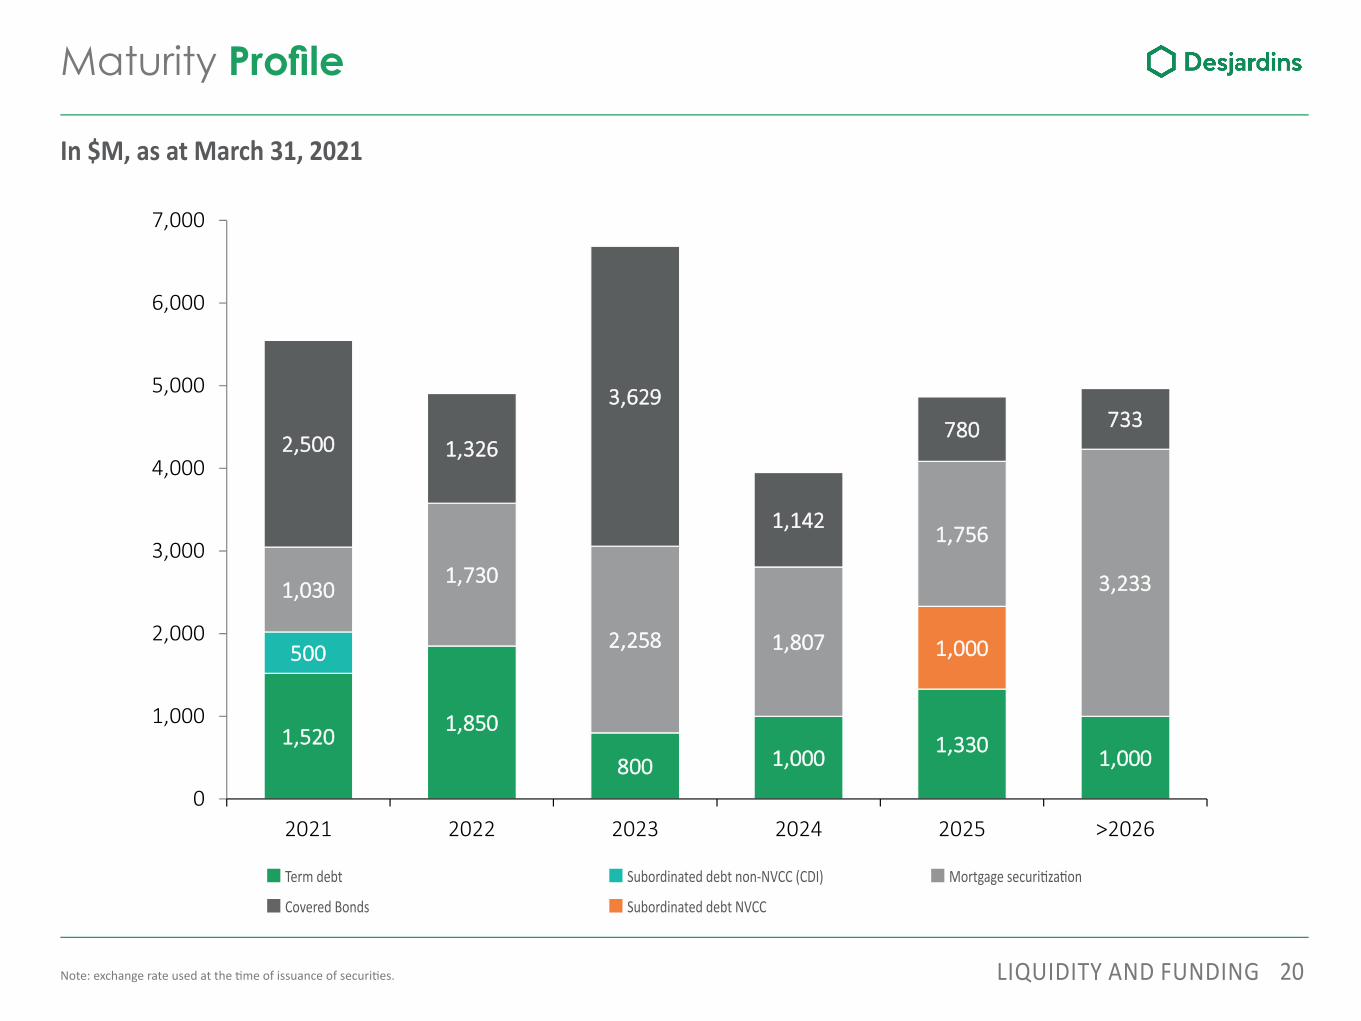
Maturity Profi le
In $M, as at March 31, 2021
Note: exchange rate used at the me of issuance of securi es.
Covered Bonds
Mortgage securi za onTerm debt
Subordinated debt NVCC
Subordinated debt non-NVCC (CDI)
1,5201,520 1,8501,850
800800 1,0001,000 1,3301,330 1,0001,000
500500 1,0001,000
1,0301,0301,7301,730
2,2582,258 1,8071,807
1,7561,756
3,2333,233
2,5002,500 1,3261,326
3,6293,629
1,1421,142
780780 733733
0
1,000
2,000
3,000
4,000
5,000
6,000
7,000
2021 2022 2023 2024 2025 >2026
21
CAPITAL and BAIL-IN
22CAPITAL AND BAIL IN
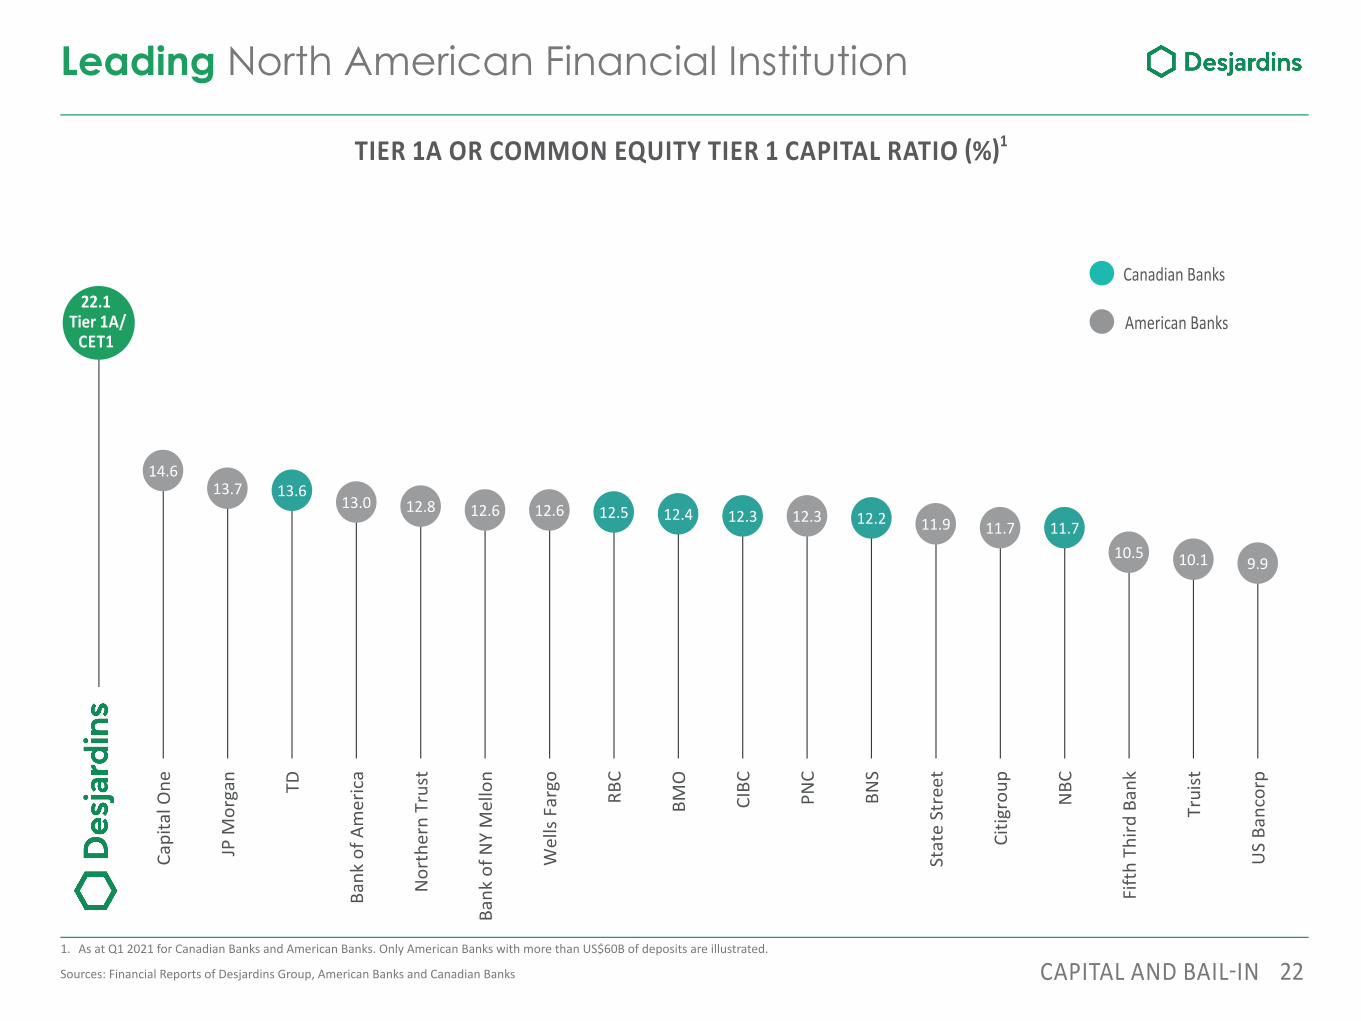
Leading North American Financial Institution
TIER 1A OR COMMON EQUITY TIER 1 CAPITAL RATIO % 1
14.613.7 13.6
13.0 12.8 12.6 12.6 12.5 12.4 12.3 12.3 12.2 11.9 11.7 11.710.5 10.1 9.9
Capi
tal O
ne
JP M
orga
n TD
Bank
of A
mer
ica
Nor
ther
n Tr
ust
Bank
of N
Y M
ello
n
Wel
ls Fa
rgo
RBC
BMO
CIBC PN
C
BNS
Stat
e St
reet
Citig
roup
NBC
Fifth
Thi
rd B
ank
Trui
st
US
Banc
orp
22.122.1Tier 1A/CET1
American Banks
Canadian Banks
Sources: Financial Reports of Desjardins Group, American Banks and Canadian Banks
1. As at Q1 2021 for Canadian Banks and American Banks. Only American Banks with more than US$60B of deposits are illustrated.
22.1Tier 1A/
CET1
23CAPITAL AND BAIL IN
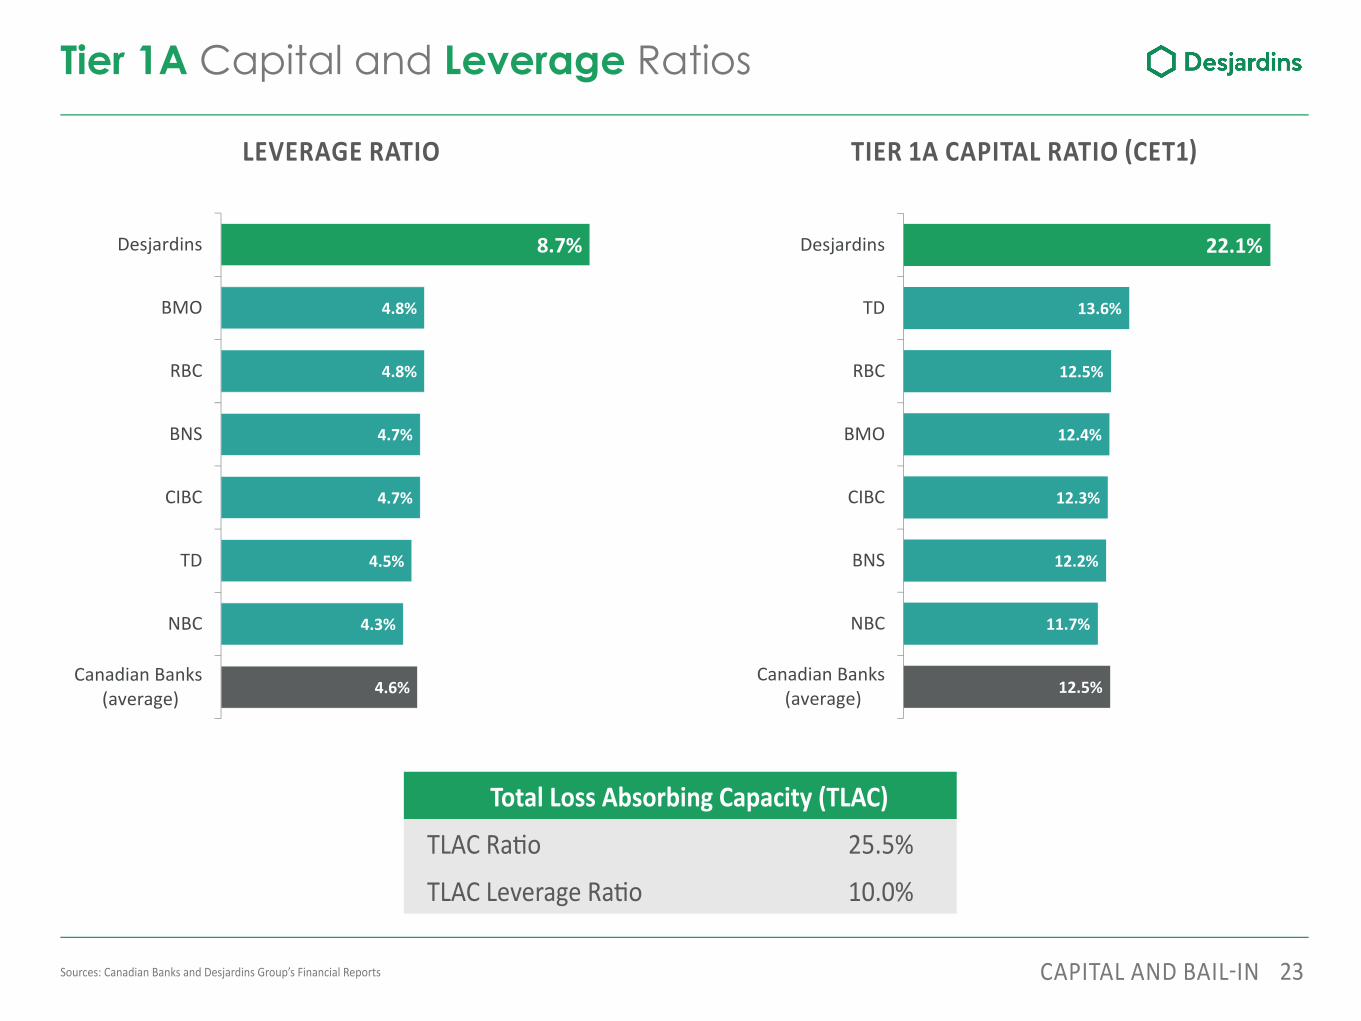
Tier 1A Capital and Leverage Ratios
LEVERAGE RATIO TIER 1A CAPITAL RATIO CET1
4.6%
4.3%
4.5%
4.7%
4.7%
4.8%
4.8%
8.7%
Canadian Banks (average)
NBC
TD
CIBC
BNS
RBC
BMO
Desjardins
12.5%
11.7%
12.2%
12.3%
12.4%
12.5%
13.6%
22.1%
Canadian Banks (average)
NBC
BNS
CIBC
BMO
RBC
TD
Desjardins
Sources: Canadian Banks and Desjardins Group’s Financial Reports
Total Loss Absorbing Capacity (TLAC) TLAC Ra o 25.5% TLAC Leverage Ra o 10.0%
24CAPITAL AND BAIL IN
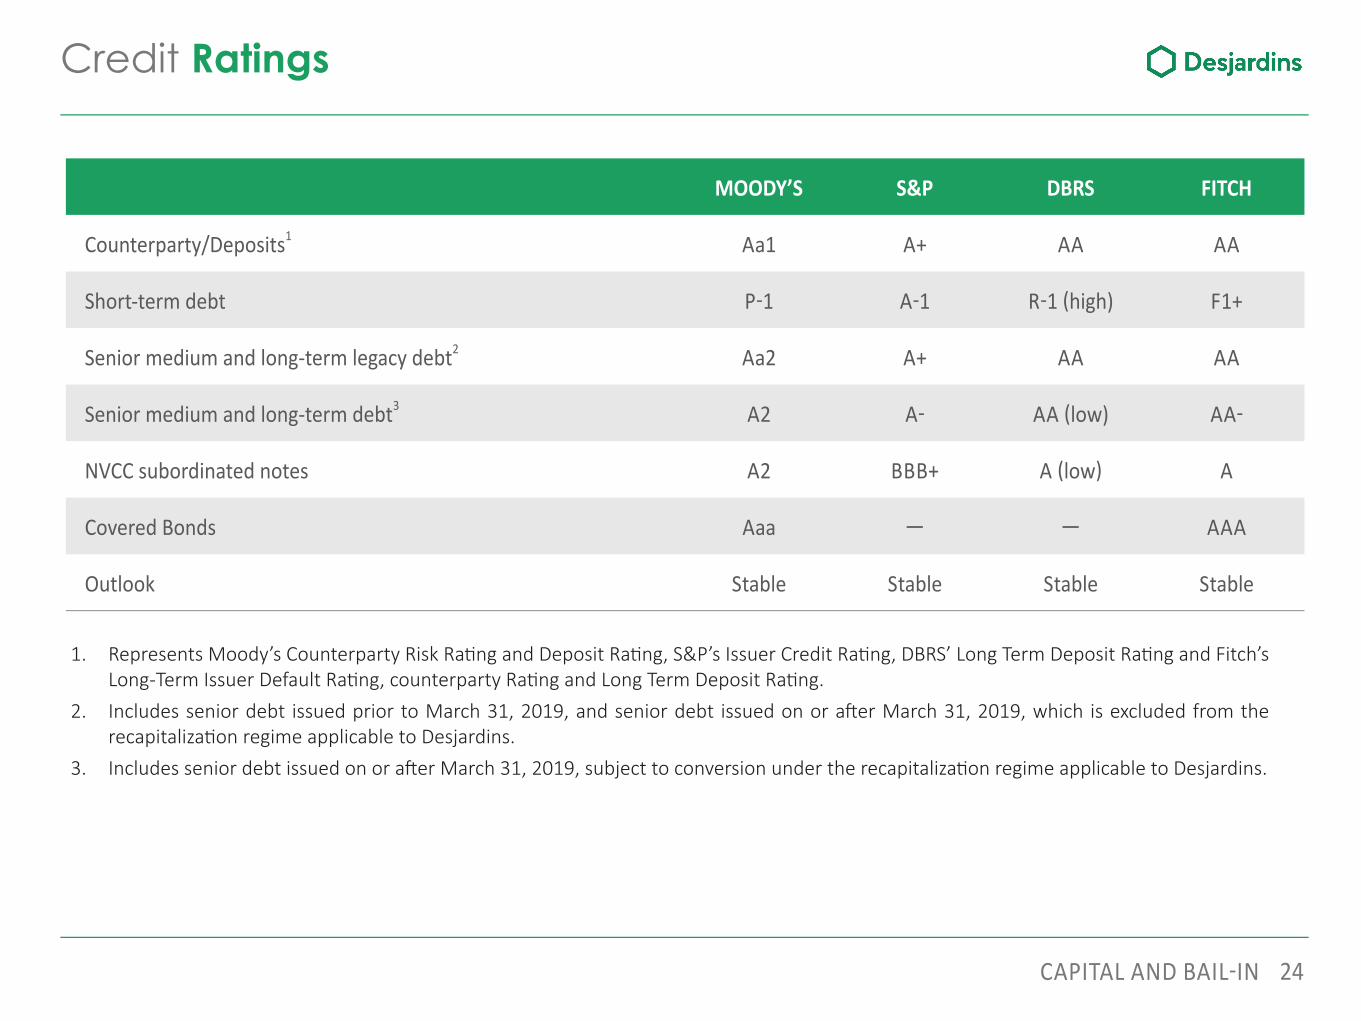
Credit Ratings
1. Represents Moody’s Counterparty Risk Ra ng and Deposit Ra ng, S&P’s Issuer Credit Ra ng, DBRS’ Long Term Deposit Ra ng and Fitch’s Long-Term Issuer Default Ra ng, counterparty Ra ng and Long Term Deposit Ra ng.
2. Includes senior debt issued prior to March 31, 2019, and senior debt issued on or a er March 31, 2019, which is excluded from the recapitaliza on regime applicable to Desjardins.
3. Includes senior debt issued on or a er March 31, 2019, subject to conversion under the recapitaliza on regime applicable to Desjardins.
MOODY’S S&P DBRS FITCH
Counterparty/Deposits1 Aa1 A+ AA AA
Short-term debt P 1 A 1 R 1 high) F1+
Senior medium and long-term legacy debt2 Aa2 A+ AA AA
Senior medium and long-term debt3 A2 A AA low) AA
NVCC subordinated notes A2 BBB+ A low A
Covered Bonds Aaa AAA
Outlook Stable Stable Stable Stable

25
Contact information
CONTACT INFORMATION
INVESTOR RELATIONSPATRICK NADEAUHead of Investor and Ra ng Agency Rela ons1-866-866-7000 ext. [email protected]
www.desjardins.com/ca/about-us/investor-rela ons
Complexe Desjardins, Montreal