Embed Size (px)
Citation preview
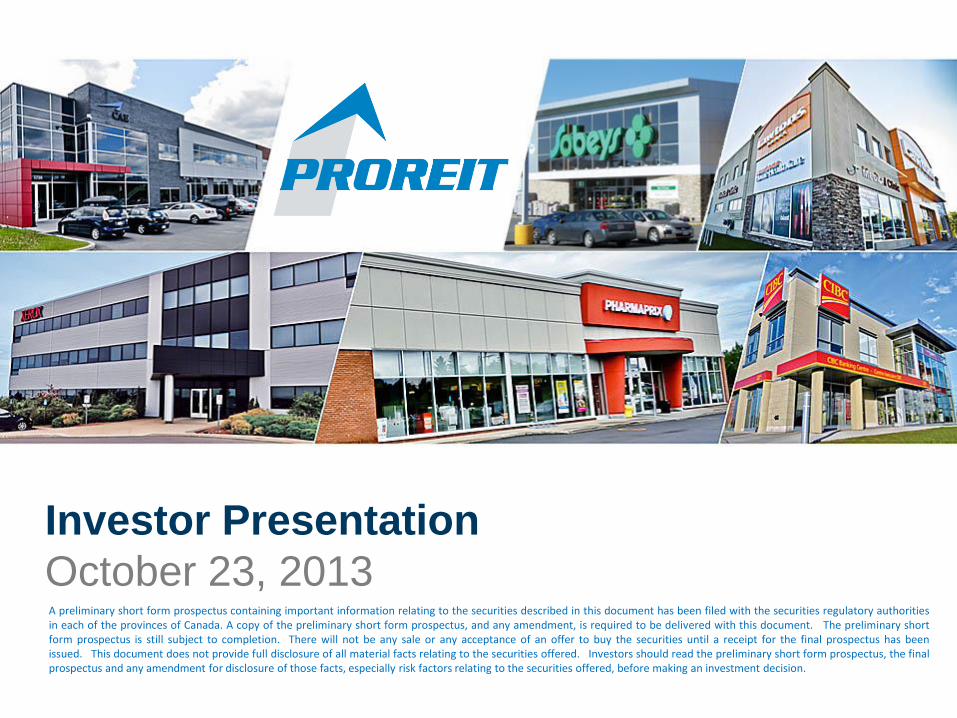
Investor Presentation
October 23, 2013
A preliminary short form prospectus containing important information relating to the securities described in this document has been filed with the securities regulatory authorities in each of the provinces of Canada. A copy of the preliminary short form prospectus, and any amendment, is required to be delivered with this document. The preliminary short form prospectus is still subject to completion. There will not be any sale or any acceptance of an offer to buy the securities until a receipt for the final prospectus has been issued. This document does not provide full disclosure of all material facts relating to the securities offered. Investors should read the preliminary short form prospectus, the final prospectus and any amendment for disclosure of those facts, especially risk factors relating to the securities offered, before making an investment decision.
Disclaimer
An investment in the securities described in this document is subject to a number of risks that should be considered by a prospective purchaser. Prospective purchasers
should carefully consider the risk factors described under “Risk Factors” and “Notice Regarding Forward‐Looking Statements” in the preliminary short form prospectus dated
October 22, 2013, as it may be amended, (the “preliminary prospectus”) of PRO Real Estate Investment Trust (“PROREIT” or the “REIT”) before purchasing units.
Prospective purchasers should rely only on the information contained in the preliminary prospectus. The REIT has not, and the underwriters have not, authorized anyone to
provide prospective purchasers with additional or different information. The REIT is not, and the underwriters are not, offering to sell the units in any jurisdictions where the
offer or sale of such units is not permitted. For investors outside Canada, none of the REIT or any of the underwriters has done anything that would permit the offering or
possession or distribution of this document and the preliminary prospectus in any jurisdiction where action for that purpose is required, other than in Canada. Prospective
purchasers are required to inform themselves about and to observe any restrictions relating to the offering and the possession or distribution of this document and the
preliminary prospectus. Prospective purchasers should not assume that the information contained in this document is accurate as of any date other than the date of the
preliminary prospectus, or where information is stated to be as of a date other than the date of the preliminary prospectus, such other applicable date. In this presentation, all
amounts are in Canadian dollars, unless otherwise indicated.
Certain statements contained in this presentation constitute forward-looking statements within the meaning of Canadian securities laws that reflect the current expectations of
management regarding our future growth, results of operations, performance and business prospects and opportunities. Forward-looking statements are only management’s
beliefs, expectations and intentions and are not guarantees of performance. Wherever possible, words such as “may”, “would”, “could”, “will”, “believe”, “expect”, “estimate”,
“intend” and similar expressions have been used to identify these forward-looking statements. Some of the specific forward-looking statements in this presentation include,
but are not limited to, statements that are described in further detail under “Notice Regarding Forward-Looking Statements” in the preliminary prospectus. These forward-
looking statements reflect management’s beliefs with respect to future events and are based on information currently available to management. Forward-looking statements
involve significant known and unknown risks, uncertainties and assumptions. Important assumptions relating to the forward-looking statements contained in this presentation
include the REIT’s future growth potential, expected capital expenditures, competitive conditions, results of operations, future prospects and opportunities, the acquisition of
each of the properties which are proposed to be acquired by the REIT, industry trends remaining unchanged, future levels of indebtedness, the ability to secure the new
mortgage and the revolving credit facility on terms acceptable to the REIT, the tax laws as currently in effect remaining unchanged, the current economic conditions remaining
unchanged and the assumptions set forth under “Financial Forecast” in the preliminary prospectus. Many factors could cause our actual results, performance or achievements
to be materially different from any future results, performance or achievements that may be expressed or implied by such forward-looking statements, including, without
limitation, risks and uncertainties relating to the initial portfolio, our expectations regarding future occupancy rates of our properties, and including those risks and uncertainties
discussed under the heading “Risk Factors” and elsewhere in the documents incorporated by reference in the preliminary prospectus. Although the forward-looking
statements contained in this presentation are based upon what management currently believes to be reasonable assumptions, we cannot assure prospective investors that
actual results, performance or achievements will be consistent with these forward-looking statements. The forward-looking statements made in this presentation relate only to
events or information as of the date of the preliminary prospectus or, in the case of documents incorporated by reference therein, as of the date of, or specified in, such
documents, and we do not intend, and do not assume any obligation, to update these forward-looking statements, except as required by law. We cannot assure you that such
statements will prove to be accurate as actual results and future events could differ materially from those anticipated in such statements. Investors are cautioned that forward-
looking statements are not guarantees of future performance and accordingly investors are cautioned not to put undue reliance on forward-looking statements due to the
inherent uncertainty therein.
2
© PROREIT 2013 3
Disclaimer
This presentation includes certain financial measures such as NOI, FFO and AFFO that have not been prepared in accordance with International Financial Reporting
Standards. See “Non-IFRS Financial Measures” in the preliminary prospectus.
The REIT is not a trust company and is not registered under applicable legislation governing trust companies as it does not carry on or intend to carry on the business of a
trust company. The REIT currently qualifies as a mutual fund trust for the purposes of the Income Tax Act (Canada) and offers and sells its units to the public. The units
are not “deposits” within the meaning of the Canada Deposit Insurance Corporation Act (Canada) and are not insured under the provisions of that act or any other
legislation. Investors who are not residents of Canada for tax purposes should consult their own tax advisors concerning the tax consequences to them of the offering.
There are limits on ownership of units by non-residents of Canada, as described in the REIT’s amended and restated declaration of trust made as of March 11, 2013.
The assumptions used in the preparation of the forecast, although considered reasonable at the time of preparation, may not materialize as forecasted and unanticipated
events and circumstances may occur subsequent to the date of the forecast. Accordingly, there is a significant risk that the actual results achieved for the period from
October 1, 2013 to September 30, 2014 will vary from the forecast results and the variations may be material.
An investment in units is subject to a number of risk factors that should be carefully considered by a prospective purchaser. Cash distributions by the REIT are not
guaranteed and will be based, in part, upon the financial performance of the REIT’s properties, which is susceptible to a number of risks. These risks, and other risks
associated with an investment in units, include but are not limited to those related to the real estate industry, the REIT and its business and the offering. See “Risk
Factors” in the preliminary short form prospectus and the other information included in the preliminary short form prospectus for a discussion of the risks that an investor
should carefully consider before deciding to invest in units.
No securities regulatory authority has expressed an opinion about these securities and it is an offence to claim otherwise. The preliminary prospectus constitutes a public
offering of units of the REIT only in those jurisdictions where they may be lawfully offered for sale and therein only by persons permitted to sell such units. The units have
not been, and will not be, registered under the United States Securities Act of 1933, as amended (the “1933 Act”), or any state securities laws and may not be offered or
sold in the United States or to, or for the account or benefit of, U.S. persons (as defined in Regulation S under the 1933 Act), except pursuant to an exemption from the
registration requirements of those laws. See “Plan of Distribution” in the preliminary prospectus.

MANAGEMENT

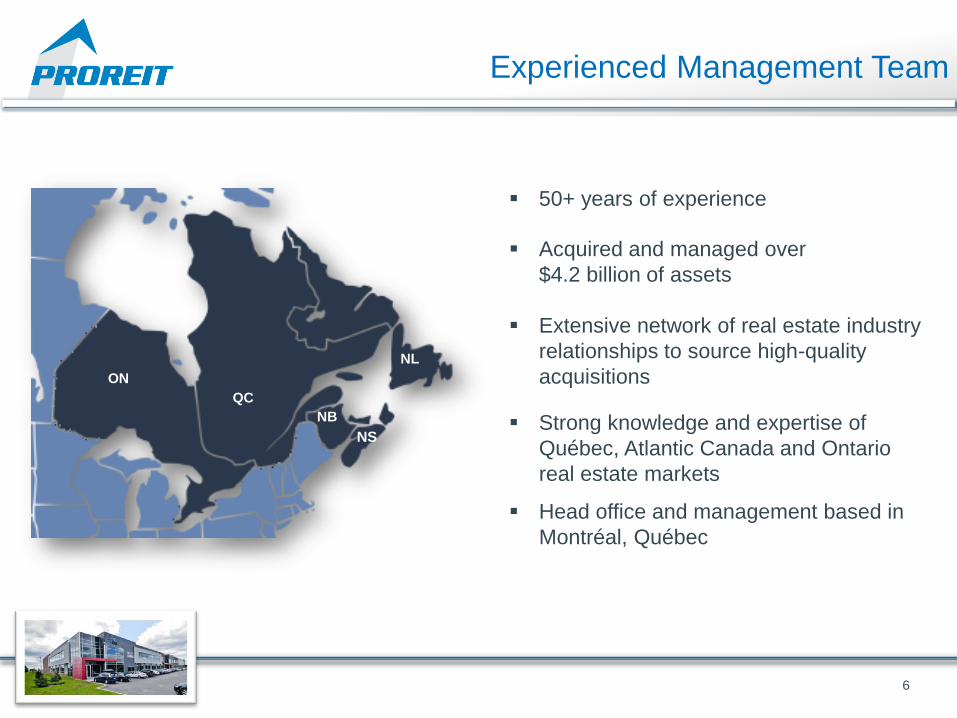
Experienced Management Team
5
Mark O’Brien, Director of Acquisitions
Alison Schafer, Director of Finance
James W. Beckerleg
Chief Executive Officer
Gordon G. Lawlor, CA
Chief Financial Officer
Experienced Management Team
6
50+ years of experience
Acquired and managed over
$4.2 billion of assets
Extensive network of real estate industry
relationships to source high-quality
acquisitions
Strong knowledge and expertise of
Québec, Atlantic Canada and Ontario
real estate markets
Head office and management based in
Montréal, Québec
ON
QC
NS
NL
NB
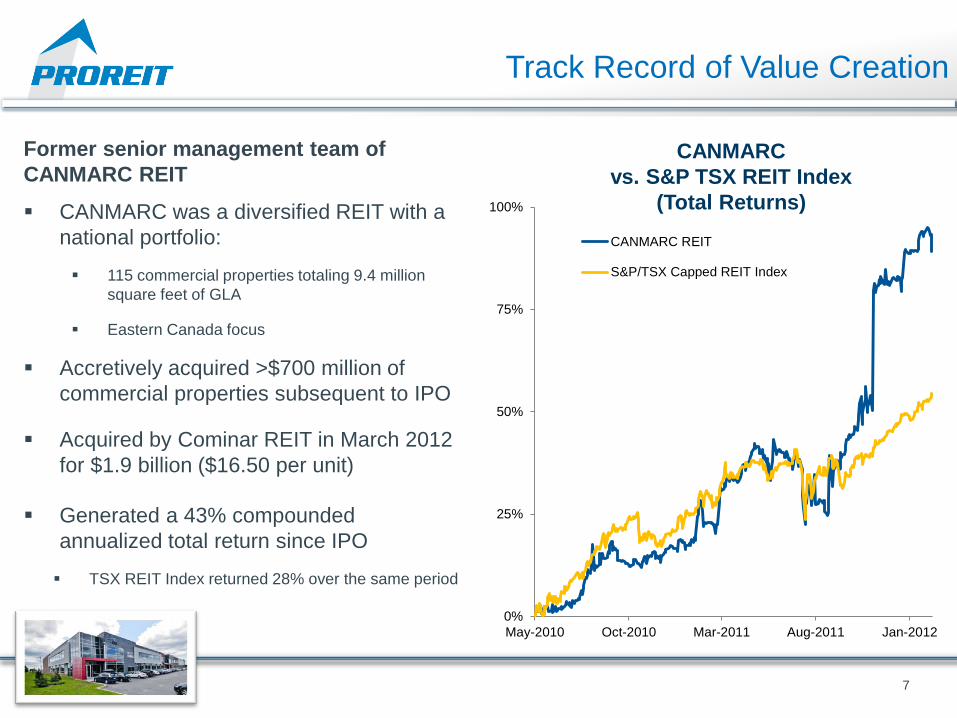
Track Record of Value Creation
7
CANMARC
vs. S&P TSX REIT Index
(Total Returns)
Former senior management team of
CANMARC REIT
CANMARC was a diversified REIT with a
national portfolio:
115 commercial properties totaling 9.4 million
square feet of GLA
Eastern Canada focus
Accretively acquired >$700 million of
commercial properties subsequent to IPO
Acquired by Cominar REIT in March 2012
for $1.9 billion ($16.50 per unit)
Generated a 43% compounded
annualized total return since IPO
TSX REIT Index returned 28% over the same period
0%
25%
50%
75%
100%
May-2010 Oct-2010 Mar-2011 Aug-2011 Jan-2012
CANMARC REIT
S&P/TSX Capped REIT Index
Investment Highlights
8
Experienced management team and board with a proven track record of value creation
Initial portfolio of high-quality commercial real estate
Geographic focus on stable Eastern Canadian markets
High-quality tenants with long term leases
Alignment of interests through an efficient management structure, strong corporate
governance and significant retained interest
Compelling investment metrics
Objectives & Strategy
9
Objectives Growth Strategies
Provide stable and growing cash
distributions from investments in real estate
properties in Canada
Expand asset base and enhance value of
assets
Increase the REIT’s net operating income
and AFFO per unit, through accretive
acquisitions and internal growth strategies
Focus on office, retail and industrial
properties in Eastern Canada
INTERNAL
Generate revenue growth opportunities
Implement operating improvements and preventative
maintenance programs
Identify expansion opportunities
EXTERNAL
Identify accretive acquisitions of income-producing
commercial properties
Minimize risk through portfolio diversification
Selectively develop and expand properties
Name Role Experience
John Levitt • Chairman and
Independent Trustee
• Partner at EDEV Real Estate Advisors • Former trustee of CANMARC REIT • Former senior management of O&Y Properties Corporation
Gérard Limoges • Independent Trustee • Former trustee of CANMARC REIT • Former deputy chairman of Ernst & Young Canada
Ronald Smith • Independent Trustee • Former member of the Canada Pension Plan Investment Board • Former senior VP and CFO of Emera Inc.
Vitale Santoro • Trustee and Corporate
Secretary • Partner at Osler, Hoskin & Harcourt LLP
James Beckerleg • Trustee, President and
Chief Executive Officer • Former president and CEO of CANMARC REIT
Gordon Lawlor • Chief Financial Officer • Former CFO of CANMARC REIT
Strong Governance and Board Independence
10
Over 100 years of combined experience operating,
acquiring and financing real estate in Canada

PORTFOLIO OVERVIEW
Canada Ontario Quebec Atlantic Canada
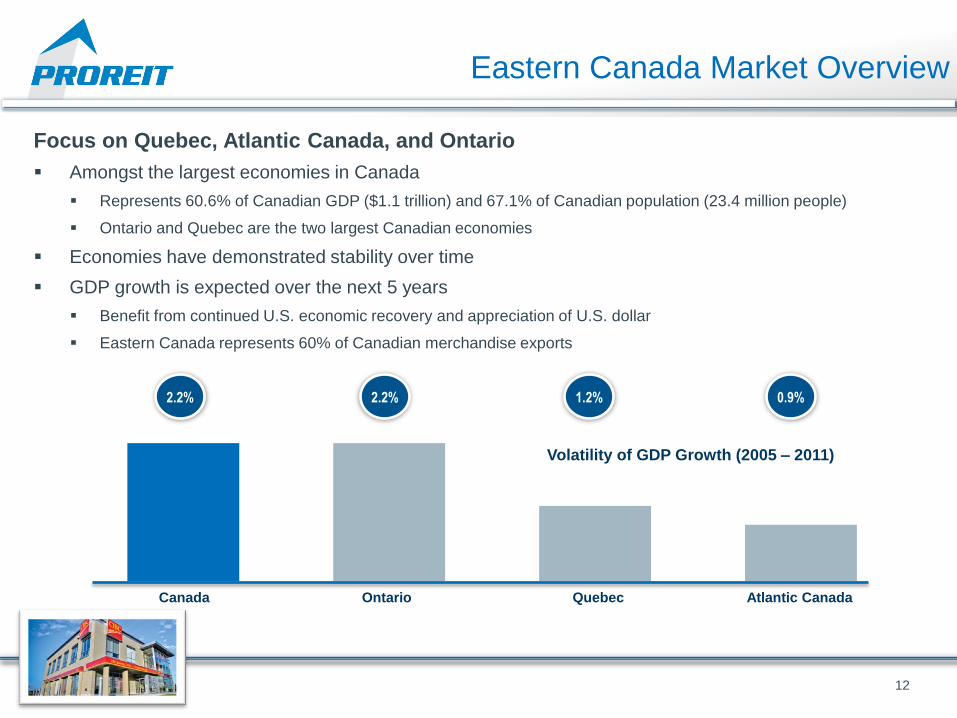
Eastern Canada Market Overview
12
Focus on Quebec, Atlantic Canada, and Ontario
Amongst the largest economies in Canada
Represents 60.6% of Canadian GDP ($1.1 trillion) and 67.1% of Canadian population (23.4 million people)
Ontario and Quebec are the two largest Canadian economies
Economies have demonstrated stability over time
GDP growth is expected over the next 5 years
Benefit from continued U.S. economic recovery and appreciation of U.S. dollar
Eastern Canada represents 60% of Canadian merchandise exports
Volatility of GDP Growth (2005 – 2011)
2.2% 2.2% 1.2% 0.9%
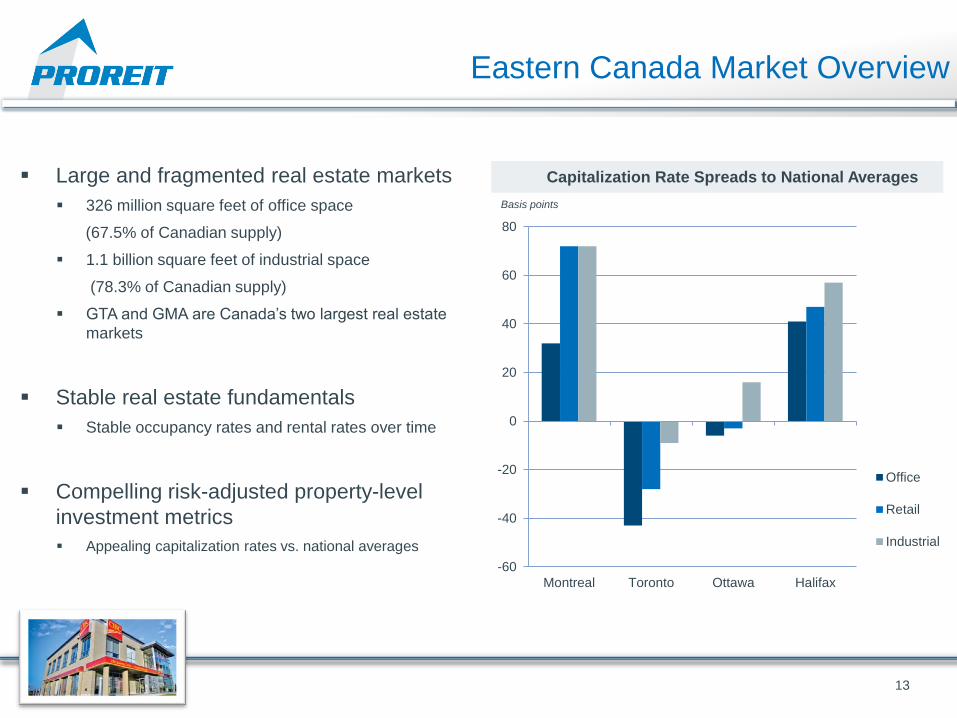
Eastern Canada Market Overview
13
Large and fragmented real estate markets
326 million square feet of office space
(67.5% of Canadian supply)
1.1 billion square feet of industrial space
(78.3% of Canadian supply)
GTA and GMA are Canada’s two largest real estate
markets
Stable real estate fundamentals
Stable occupancy rates and rental rates over time
Compelling risk-adjusted property-level
investment metrics
Appealing capitalization rates vs. national averages
Capitalization Rate Spreads to National Averages
-60
-40
-20
0
20
40
60
80
Montreal Toronto Ottawa Halifax
Office
Retail
Industrial
Basis points
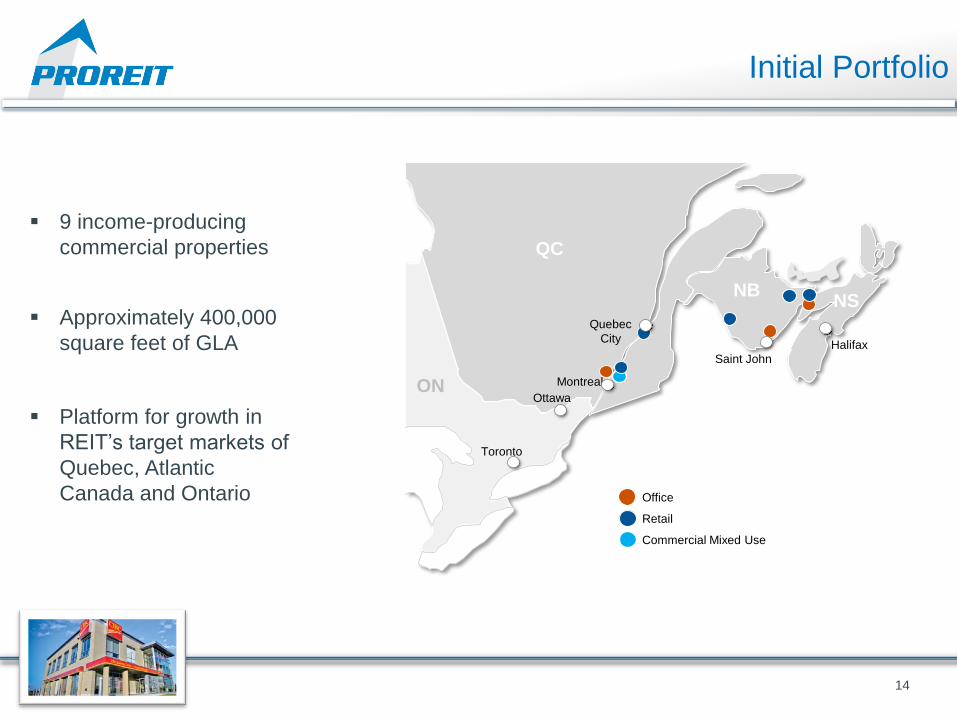
Initial Portfolio
14
9 income-producing
commercial properties
Approximately 400,000
square feet of GLA
Platform for growth in
REIT’s target markets of
Quebec, Atlantic
Canada and Ontario
Quebec
City
Saint John
Halifax
Ottawa
Office
Montreal
Retail
Commercial Mixed Use
Toronto
ON
QC
NB NS
15
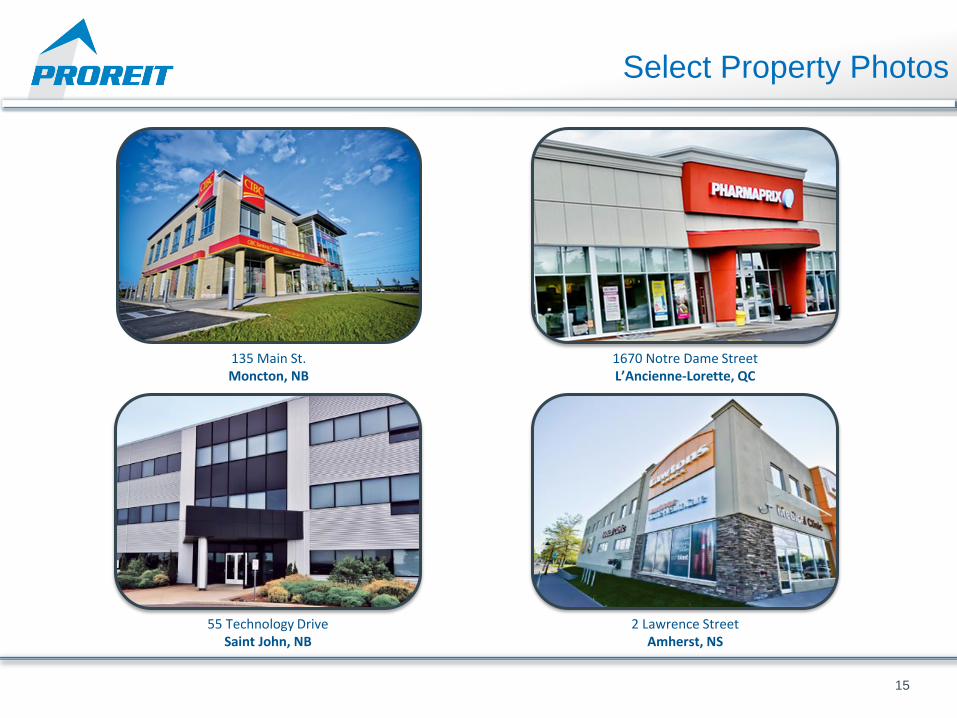
Select Property Photos
135 Main St. Moncton, NB
1670 Notre Dame Street L’Ancienne-Lorette, QC
55 Technology Drive Saint John, NB
2 Lawrence Street Amherst, NS

16
3200-3600 Guénette Street St. Laurent, QC
Select Property Photos (cont’d)

17
370 Connell Street Woodstock, NB
Select Property Photos (cont’d)
Retail50.0%
Commercial Mixed Use
23.1%
Office26.8%
Diversified Portfolio
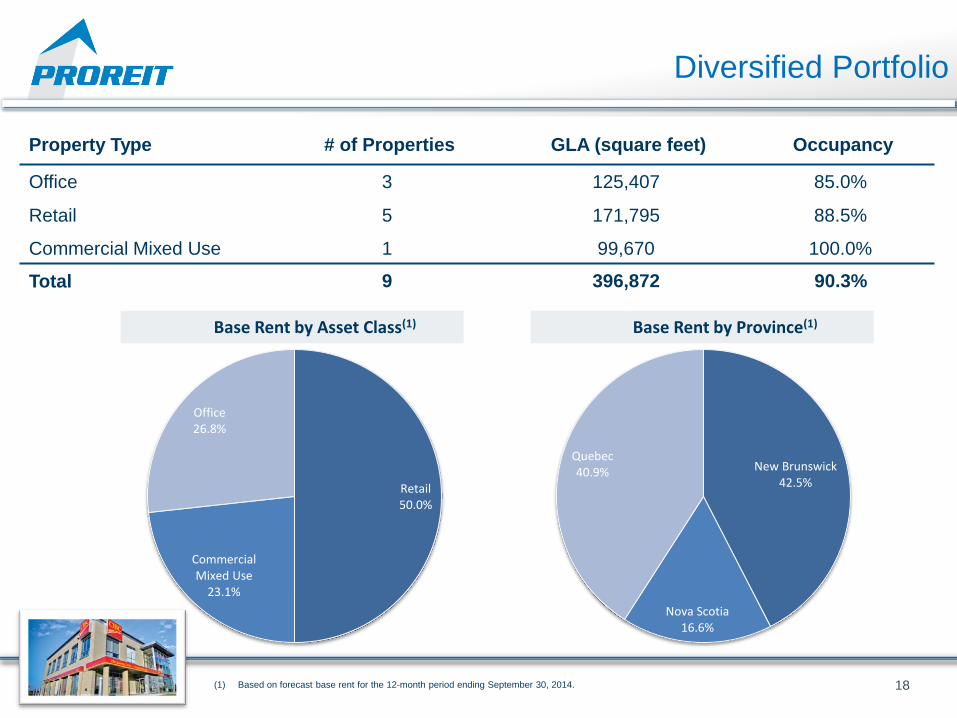
18
Property Type # of Properties GLA (square feet) Occupancy
Office 3 125,407 85.0%
Retail 5 171,795 88.5%
Commercial Mixed Use 1 99,670 100.0%
Total 9 396,872 90.3%
Base Rent by Asset Class(1) Base Rent by Province(1)
New Brunswick42.5%
Nova Scotia16.6%
Quebec40.9%
(1) Based on forecast base rent for the 12-month period ending September 30, 2014.

Government13.7%
National74.8%
Regional9.1%
Local2.4%
High-Quality Tenant Profile
19
24 credit-worthy tenants
Well diversified by industry sector
Government and national tenants represent 88.5% of base rent
Investment grade tenants represent 73.4% of base rent
(1) Based on forecast base rent for the 12-month period ending September 30, 2014.
(2) “Other” includes professional services (1.6%) and Vendor Leases (2.8%).
Base Rent by Tenant Profile(1) Base Rent by Tenant Industry(1)(2)
Consumer Staples35.8%
Industrials14.7%
Government13.7%
Technology12.0%
Consumer Discretionary
10.1%
Financial Services
9.2%
Other4.4%
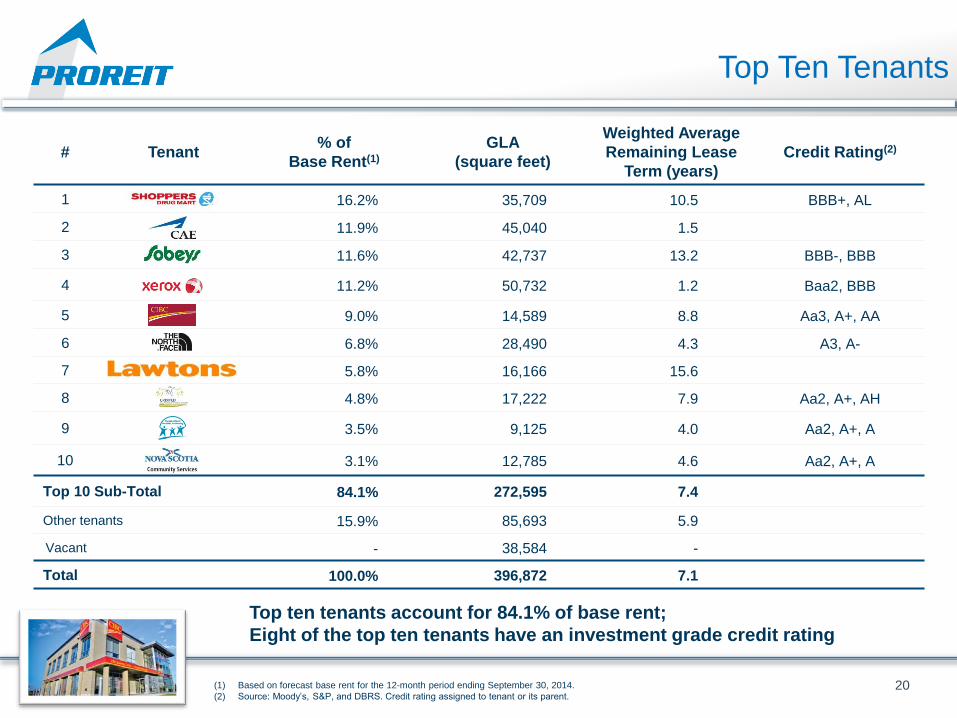
# Tenant % of
Base Rent(1)
GLA
(square feet)
Weighted Average
Remaining Lease
Term (years)
Credit Rating(2)
1 16.2% 35,709 10.5 BBB+, AL
2 11.9% 45,040 1.5
3 11.6% 42,737 13.2 BBB-, BBB
4 11.2% 50,732 1.2 Baa2, BBB
5 9.0% 14,589 8.8 Aa3, A+, AA
6 6.8% 28,490 4.3 A3, A-
7 5.8% 16,166 15.6
8 4.8% 17,222 7.9 Aa2, A+, AH
9 3.5% 9,125 4.0 Aa2, A+, A
10 3.1% 12,785 4.6 Aa2, A+, A
Top 10 Sub-Total 84.1% 272,595 7.4
Other tenants 15.9% 85,693 5.9
Vacant - 38,584 -
Total 100.0% 396,872 7.1
Top Ten Tenants
20
Top ten tenants account for 84.1% of base rent;
Eight of the top ten tenants have an investment grade credit rating
(1) Based on forecast base rent for the 12-month period ending September 30, 2014.
(2) Source: Moody’s, S&P, and DBRS. Credit rating assigned to tenant or its parent.
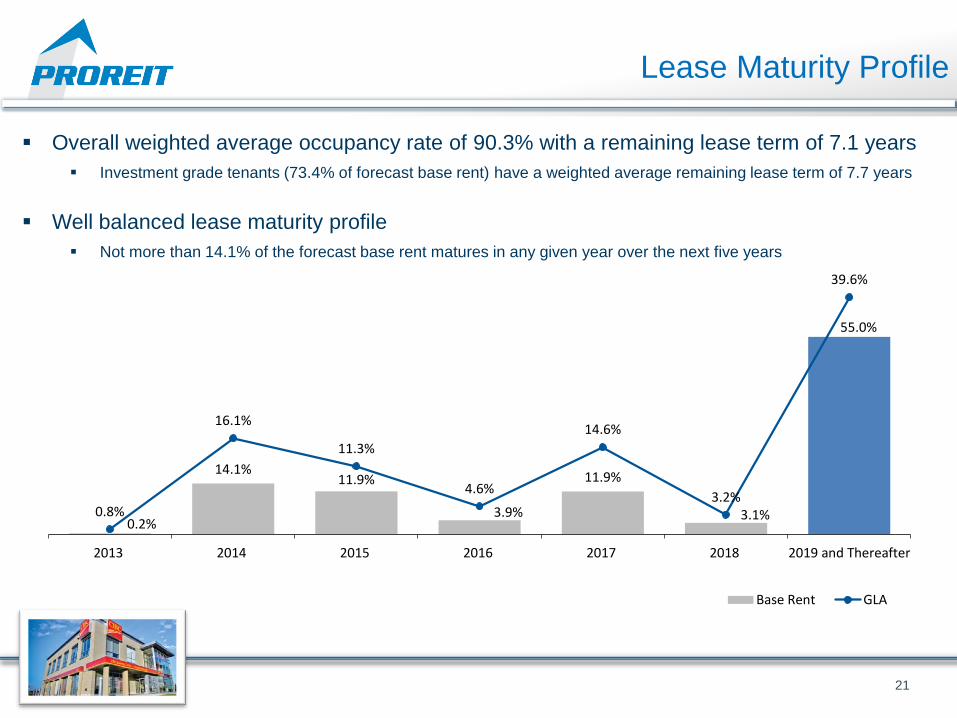
0.2%
14.1%11.9%
3.9%
11.9%
3.1%
55.0%
0.8%
16.1%
11.3%
4.6%
14.6%
3.2%
39.6%
2013 2014 2015 2016 2017 2018 2019 and Thereafter
Base Rent GLA
Lease Maturity Profile
21
Overall weighted average occupancy rate of 90.3% with a remaining lease term of 7.1 years
Investment grade tenants (73.4% of forecast base rent) have a weighted average remaining lease term of 7.7 years
Well balanced lease maturity profile
Not more than 14.1% of the forecast base rent matures in any given year over the next five years

FINANCIAL
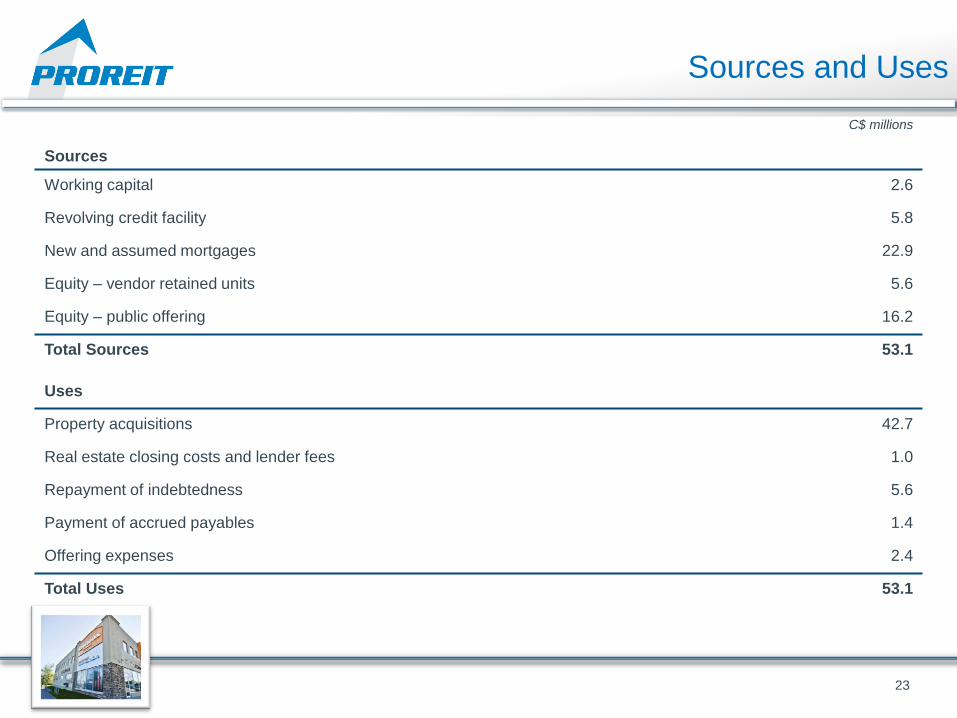
C$ millions
Sources
Working capital 2.6
Revolving credit facility 5.8
New and assumed mortgages 22.9
Equity – vendor retained units 5.6
Equity – public offering 16.2
Total Sources 53.1
Uses
Property acquisitions 42.7
Real estate closing costs and lender fees 1.0
Repayment of indebtedness 5.6
Payment of accrued payables 1.4
Offering expenses 2.4
Total Uses 53.1
23
Sources of Funds Sources and Uses
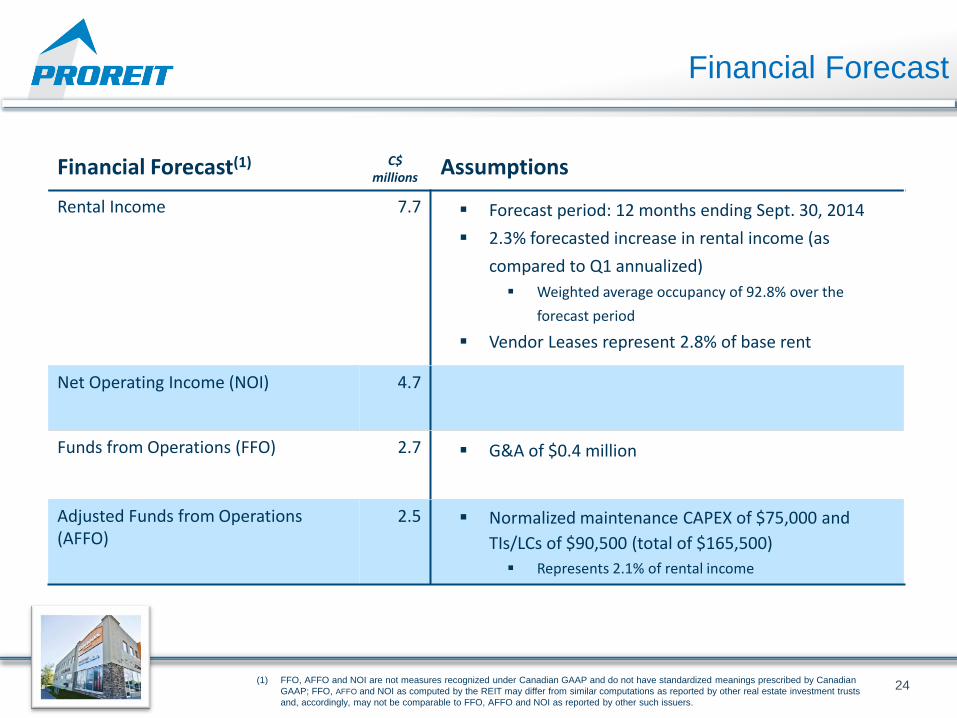
Financial Forecast(1) C$ millions
Assumptions
Rental Income 7.7 Forecast period: 12 months ending Sept. 30, 2014
2.3% forecasted increase in rental income (as
compared to Q1 annualized)
Weighted average occupancy of 92.8% over the
forecast period
Vendor Leases represent 2.8% of base rent
Net Operating Income (NOI) 4.7
Funds from Operations (FFO) 2.7
G&A of $0.4 million
Adjusted Funds from Operations (AFFO)
2.5
Normalized maintenance CAPEX of $75,000 and
TIs/LCs of $90,500 (total of $165,500)
Represents 2.1% of rental income
24 (1) FFO, AFFO and NOI are not measures recognized under Canadian GAAP and do not have standardized meanings prescribed by Canadian
GAAP; FFO, AFFO and NOI as computed by the REIT may differ from similar computations as reported by other real estate investment trusts
and, accordingly, may not be comparable to FFO, AFFO and NOI as reported by other such issuers.
Financial Forecast
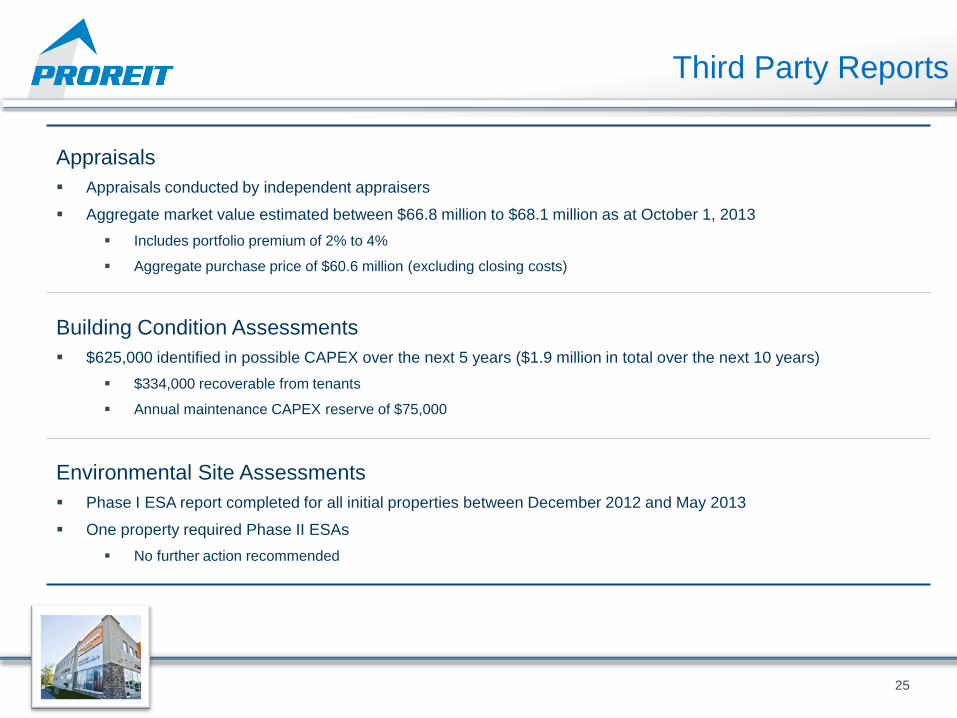
Third Party Reports
25
Appraisals
Appraisals conducted by independent appraisers
Aggregate market value estimated between $66.8 million to $68.1 million as at October 1, 2013
Includes portfolio premium of 2% to 4%
Aggregate purchase price of $60.6 million (excluding closing costs)
Building Condition Assessments
$625,000 identified in possible CAPEX over the next 5 years ($1.9 million in total over the next 10 years)
$334,000 recoverable from tenants
Annual maintenance CAPEX reserve of $75,000
Environmental Site Assessments
Phase I ESA report completed for all initial properties between December 2012 and May 2013
One property required Phase II ESAs
No further action recommended
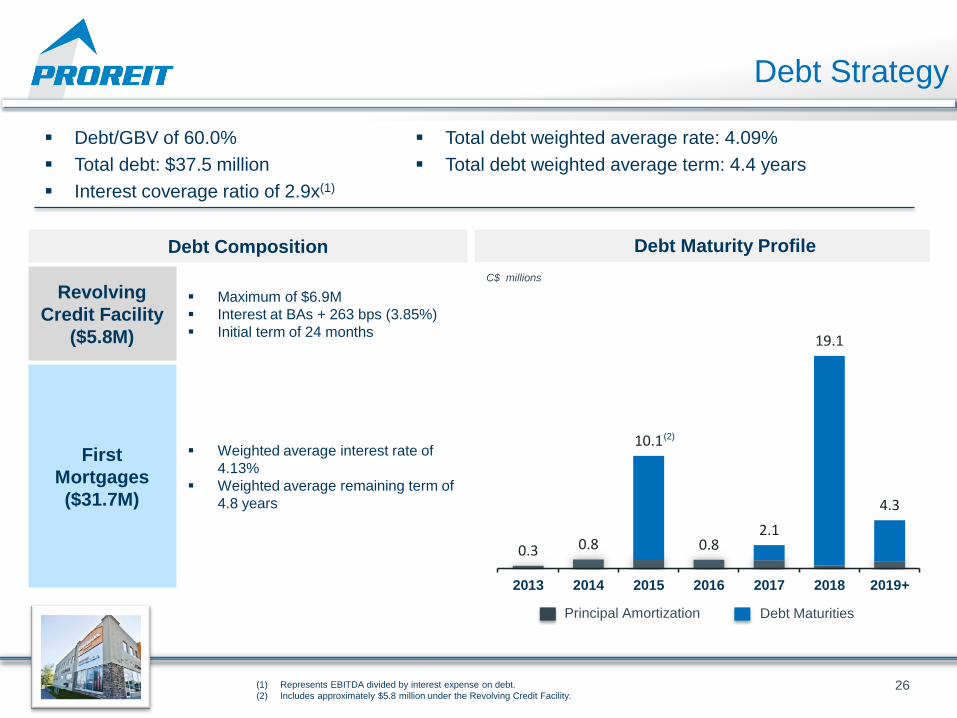
Debt Strategy
0.3 0.8
10.1
0.8 2.1
19.1
4.3
2013 2014 2015 2016 2017 2018 2019+
26
C$ millions
Debt Composition
Revolving
Credit Facility
($5.8M)
Maximum of $6.9M
Interest at BAs + 263 bps (3.85%)
Initial term of 24 months
First
Mortgages
($31.7M)
Weighted average interest rate of
4.13%
Weighted average remaining term of
4.8 years
Principal Amortization Debt Maturities
Debt/GBV of 60.0%
Total debt: $37.5 million
Interest coverage ratio of 2.9x(1)
Total debt weighted average rate: 4.09%
Total debt weighted average term: 4.4 years
(1) Represents EBITDA divided by interest expense on debt.
(2) Includes approximately $5.8 million under the Revolving Credit Facility.
Debt Maturity Profile
(2)

Management Agreement
Competitive and efficient asset management structure
No incentive, disposition, financing, leasing, construction, or development fees
Pre-determined internalization at $500 million of GBV
Non-compete
Significant retained interest (24.7%)
Management and Board: 5.4%
Vendors (Broccolini Construction, national publicly traded REIT): 19.3%
27
Manager Labec Realty Advisors Inc.
Annual Advisory Fee 0.25% of Adjusted Cost Base of REIT’s Assets
Acquisition Fee
1.00% on first $100,000,000
0.75% on next $100,000,000
0.50% on excess of $200,000,000
Term 5 years with 5 year renewals on mutual agreement
Internalization At $500 million of GBV
Termination fee equal to management fees in most recent fiscal year
Investment Highlights
28
Experienced management team and board with a proven track record of value creation
Initial portfolio of high-quality commercial real estate
Geographic focus on stable Eastern Canadian markets
High-quality tenants with long term leases
Alignment of interests through an efficient management structure, strong corporate
governance and significant retained interest
Compelling investment metrics

OFFERING SUMMARY
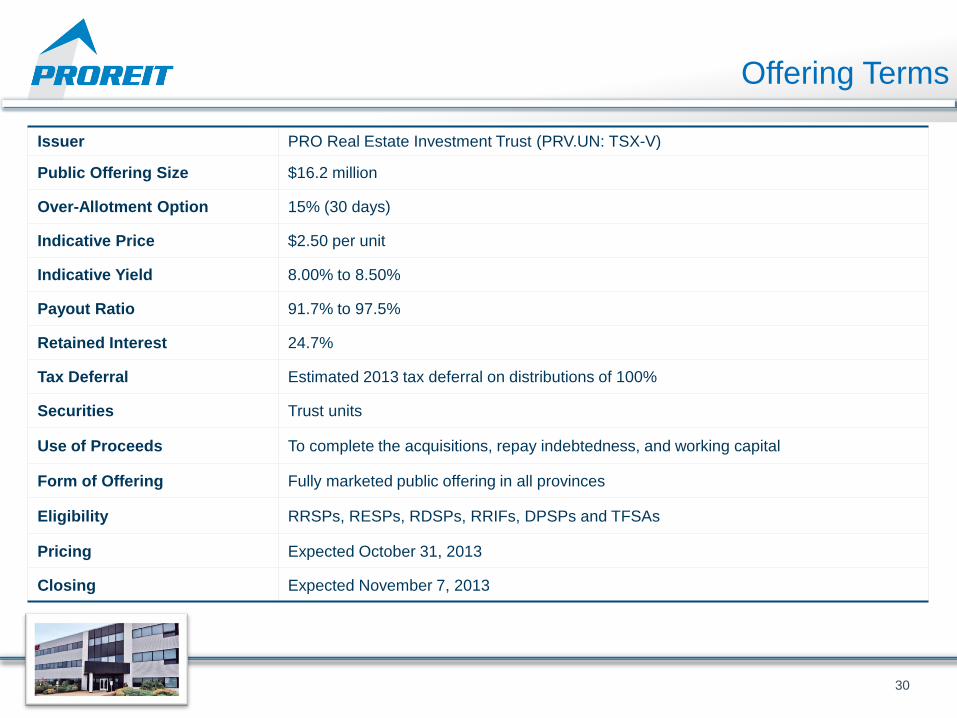
Offering Terms
30
Issuer PRO Real Estate Investment Trust (PRV.UN: TSX-V)
Public Offering Size $16.2 million
Over-Allotment Option 15% (30 days)
Indicative Price $2.50 per unit
Indicative Yield 8.00% to 8.50%
Payout Ratio 91.7% to 97.5%
Retained Interest 24.7%
Tax Deferral Estimated 2013 tax deferral on distributions of 100%
Securities Trust units
Use of Proceeds To complete the acquisitions, repay indebtedness, and working capital
Form of Offering Fully marketed public offering in all provinces
Eligibility RRSPs, RESPs, RDSPs, RRIFs, DPSPs and TFSAs
Pricing Expected October 31, 2013
Closing Expected November 7, 2013

COMPARABLES

© PROREIT 2013 32
Comparable REITs
In accordance with Section 13.7(4) of National Instrument 41-101 - General
Prospectus Requirements, all the information relating to PROREIT’s comparables
and any disclosure relating to the comparables, which is contained in the
presentation to be provided to potential investors, has been removed from this
template version for purposes of its filing on the System for Electronic Document
Analysis and Retrieval (SEDAR).

Thank you T 514-933-9552
www.proreit.com
© PROREIT 2013

APPENDIX
Property Location
Year Built/ Renovated # of Tenants
GLA (square feet) Occupancy
Office Properties
55 Technology Drive Saint John, NB 1999 1 50,732 100.0%
26-32 Prince Arthur/11-15 Princess Amherst, NS 1957/1974/2008 7 50,681 76.3%
325 Hymus Boulevard Pointe-Claire, QC 1977/2011 1 23,994 71.8%
Sub Total 9 125,407 85.0%
Retail Properties
370 Connell Street Woodstock, NB 1972/2001 9(2) 114,247 87.1%(2)
2 Lawrence Street(1) Amherst, NS 2009 1 21,212 76.2%
1670 Notre Dame Street(1) L’Ancienne-Lorette, QC 1980/2008 1 19,000 100.0%
135 Main Street(1) Moncton, NB 2012 1 10,574 100.0%
449 Principale Street(1) Daveluyville, QC 1987/2011 1 6,762 100.0%
Sub Total 13 171,795 88.5%
Commercial Mixed Use Properties
3200-3260 Guénette Street St. Laurent, QC 2007 4(2) 99,670 100.0%(2)
Sub Total 4 99,670 100.0%
Total 26(3) 396,872 90.3%
Property Overview
35 (1) Property currently owned by the REIT. The other properties are proposed to be acquired by the REIT pursuant to the Acquisition Agreements.
(2) Includes the applicable Vendor Lease.
(3) 24 separate and discreet tenants, after accounting for tenants that occupy space in more than one property.
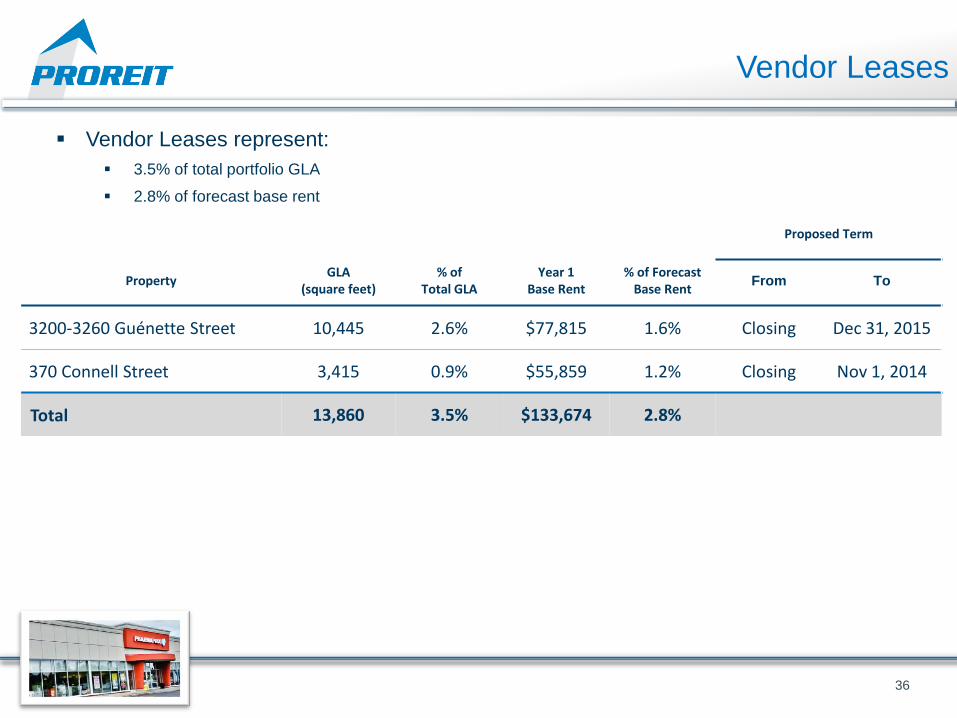
Vendor Leases
36
Vendor Leases represent:
3.5% of total portfolio GLA
2.8% of forecast base rent
Proposed Term
Property GLA
(square feet) % of
Total GLA
Year 1 Base Rent
% of Forecast Base Rent
From To
3200-3260 Guénette Street 10,445 2.6% $77,815 1.6% Closing Dec 31, 2015
370 Connell Street 3,415 0.9% $55,859 1.2% Closing Nov 1, 2014
Total 13,860 3.5% $133,674 2.8%
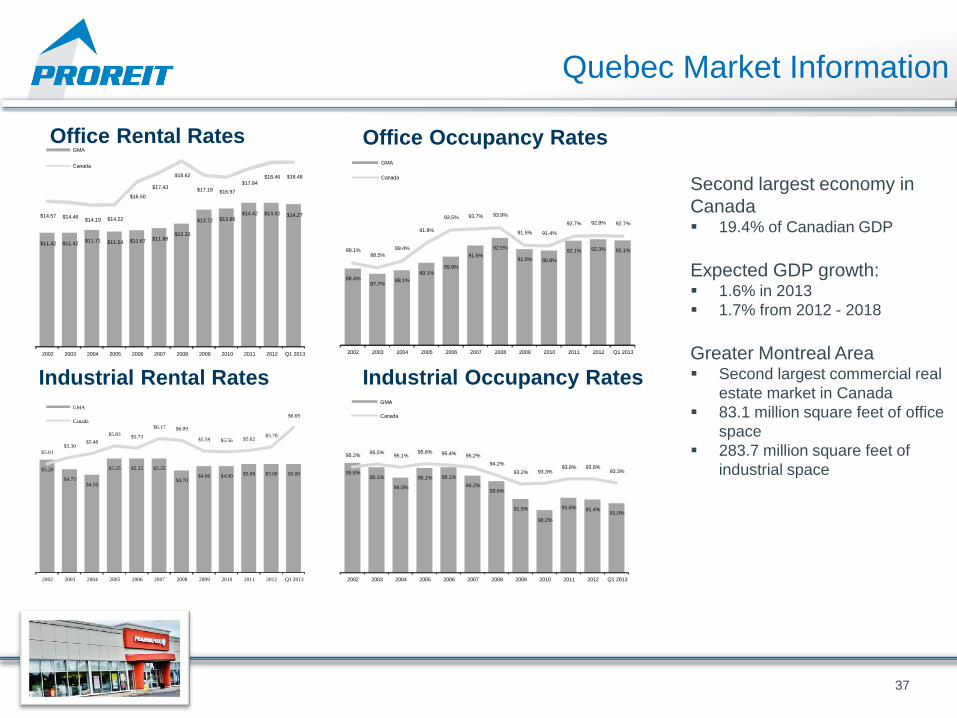
Quebec Market Information
37
Office Rental Rates Office Occupancy Rates
Industrial Rental Rates Industrial Occupancy Rates
Second largest economy in
Canada 19.4% of Canadian GDP
Expected GDP growth: 1.6% in 2013
1.7% from 2012 - 2018
Greater Montreal Area Second largest commercial real
estate market in Canada
83.1 million square feet of office
space
283.7 million square feet of
industrial space
$11.42 $11.42 $11.71 $11.54 $11.67 $11.88
$12.33
$13.72 $13.86 $14.42 $14.42 $14.27 $14.57 $14.46
$14.19 $14.22
$16.50
$17.43
$18.62
$17.18 $16.97
$17.84 $18.46 $18.48
2002 2003 2004 2005 2006 2007 2008 2009 2010 2011 2012 Q1 2013
GMA
Canada
88.4% 87.7%
88.1%
89.1% 89.9%
91.5%
92.5%
91.0% 90.8%
92.1% 92.3% 92.1% 89.1% 88.5%
89.4%
91.8%
93.5% 93.7% 93.9%
91.5% 91.4%
92.7% 92.8% 92.7%
2002 2003 2004 2005 2006 2007 2008 2009 2010 2011 2012 Q1 2013
GMA
Canada
95.6% 95.1%
94.0%
95.1% 95.1%
94.2% 93.6%
91.5%
90.2%
91.6% 91.4% 91.0%
95.2% 95.5%
95.1% 95.6% 95.4% 95.2%
94.2%
93.2% 93.3% 93.8% 93.8%
93.3%
2002 2003 2004 2005 2006 2007 2008 2009 2010 2011 2012 Q1 2013
GMA
Canada
$5.20
$4.75 $4.50
$5.25 $5.25 $5.25
$4.70 $4.90 $4.90 $5.00 $5.00 $5.00
$5.01
$5.30 $5.48
$5.83 $5.73
$6.17 $6.09
$5.59 $5.56 $5.62 $5.78
$6.69
2002 2003 2004 2005 2006 2007 2008 2009 2010 2011 2012 Q1 2013
GMA
Canada

Atlantic Canada Market Information
38
Office Rental Rates Office Occupancy Rates
Industrial Rental Rates Industrial Occupancy Rates
Fourth largest economy in
Canada: 4.2% of Canadian GDP
Expected GDP growth: 1.8% in 2013
1.3% from 2012 - 2018
Halifax: Largest commercial real estate
market in Altantic Canada
10.7 million square feet of office
space
7.4 million square feet of industrial
space
$13.02 $13.06 $13.01 $12.84
$13.69
$12.26
$15.60
$14.31 $13.89
$14.26 $14.59 $14.57
$14.57 $14.46 $14.19 $14.22
$16.50
$17.43
$18.62
$17.18 $16.97
$17.84 $18.46 $18.48
2002 2003 2004 2005 2006 2007 2008 2009 2010 2011 2012 Q1 2013
Halifax
Canada
91.1%
90.1%
88.0%
91.8% 91.4%
91.8% 91.1%
90.6%
91.6% 91.2%
90.0% 90.4%
89.1% 88.5%
89.4%
91.8%
93.5% 93.7% 93.9%
91.5% 91.4%
92.7% 92.8% 92.7%
2002 2003 2004 2005 2006 2007 2008 2009 2010 2011 2012 Q1 2013
Halifax
Canada
93.8%
95.1%
90.8%
93.8%
91.9%
90.8%
92.6% 91.9%
94.7%
92.6% 92.2%
91.9%
95.2% 95.5%
95.1% 95.6% 95.4% 95.2%
94.2%
93.2%
93.3%
93.8% 93.8% 93.3%
2002 2003 2004 2005 2006 2007 2008 2009 2010 2011 2012 Q1 2013
Halifax
Canada
$6.59 $6.00 $6.09
$6.92 $6.60
$5.97
$6.41 $6.31
$6.72 $6.98
$7.15 $7.25
$5.01
$5.30 $5.48
$5.83 $5.73
$6.17 $6.09
$5.59 $5.56 $5.62 $5.78
$6.69
2002 2003 2004 2005 2006 2007 2008 2009 2010 2011 2012 Q1 2013
Halifax
Canada
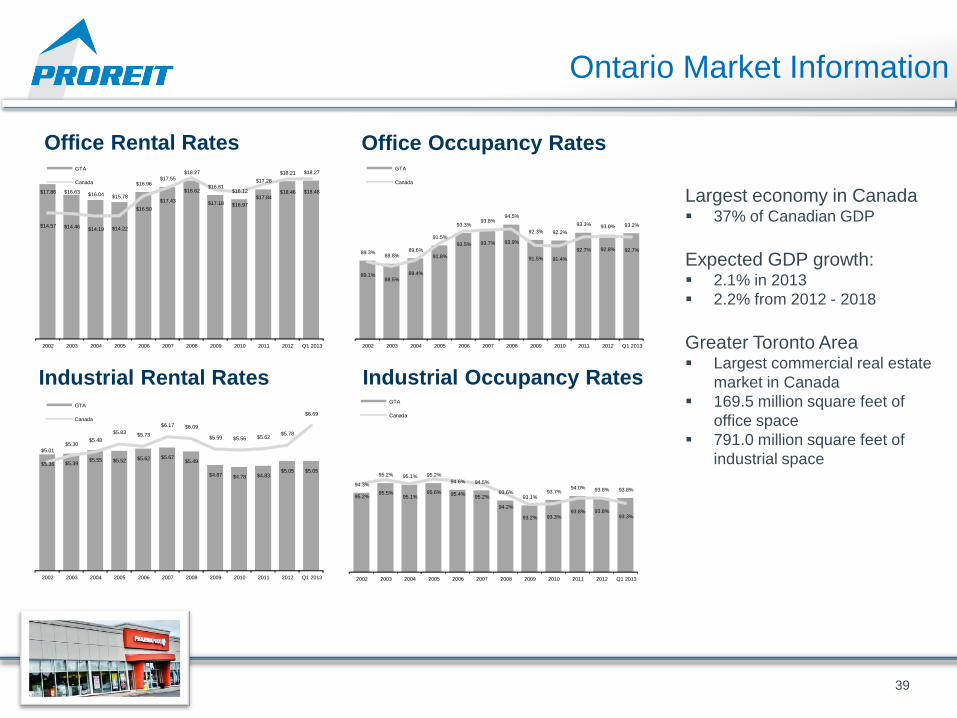
Ontario Market Information
39
Office Rental Rates Office Occupancy Rates
Industrial Rental Rates Industrial Occupancy Rates
Largest economy in Canada 37% of Canadian GDP
Expected GDP growth: 2.1% in 2013
2.2% from 2012 - 2018
Greater Toronto Area Largest commercial real estate
market in Canada
169.5 million square feet of
office space
791.0 million square feet of
industrial space
$17.86 $16.63 $16.04 $15.78
$16.96 $17.55
$18.27
$16.61 $16.12
$17.28
$18.21 $18.27
$14.57 $14.46 $14.19 $14.22
$16.50
$17.43
$18.62
$17.18 $16.97
$17.84 $18.46 $18.48
2002 2003 2004 2005 2006 2007 2008 2009 2010 2011 2012 Q1 2013
GTA
Canada
89.3% 88.8%
89.6%
91.5%
93.3% 93.8%
94.5%
92.3% 92.2%
93.3% 93.0% 93.2%
89.1% 88.5%
89.4%
91.8%
93.5% 93.7% 93.9%
91.5% 91.4%
92.7% 92.8% 92.7%
2002 2003 2004 2005 2006 2007 2008 2009 2010 2011 2012 Q1 2013
GTA
Canada
$5.36 $5.39 $5.55 $5.52 $5.62 $5.67
$5.49
$4.87 $4.78 $4.83 $5.05 $5.05
$5.01
$5.30 $5.48
$5.83 $5.73
$6.17 $6.09
$5.59 $5.56 $5.62 $5.78
$6.69
2002 2003 2004 2005 2006 2007 2008 2009 2010 2011 2012 Q1 2013
GTA
Canada
94.3%
95.2% 95.1% 95.2%
94.6% 94.5%
93.6% 93.1%
93.7% 94.0% 93.8% 93.8%
95.2% 95.5%
95.1% 95.6% 95.4%
95.2%
94.2%
93.2% 93.3% 93.8% 93.8%
93.3%
2002 2003 2004 2005 2006 2007 2008 2009 2010 2011 2012 Q1 2013
GTA
Canada