Embed Size (px)
Citation preview
Investor Presentation
3m 2016
Investor presentation
Investor Presentation
Nordecon overview
Investor Presentation
KEY FACTS
• Nordecon is a group of construction companies whose core business is construction project management and general contracting in the buildings and infrastructures segment
• Geographically the Group operates currently in Estonia, Ukraine, Finland and Sweden. The parent of the Group is Nordecon AS, a company registered and located in Tallinn, Estonia. In addition to the parent company, there are more than 10 subsidiaries in the Group
• Currently Nordecon employs over 650 people
• Since 18 May 2006, the company's shares have been quoted in the main list of the NASDAQ OMX Tallinn Stock Exchange
Nordecon in brief
Investor Presentation
Nordecon in brief
VISION: To be the preferred partner in the construction industry for customers, subcontractors and employees.
MISSION: To offer our customers building and infrastructure construction solutions that meet their needs and fit their budget and thus help them maintain and add value to their assets.
SHARED VALUES:
Professionalism
We are professional builders – we apply appropriate construction techniques and technologies and observe generally accepted quality standards. Our people are results-oriented and go-ahead; we successfully combine our extensive industry experience with the opportunities provided by innovation.
Reliability
We are reliable partners – we keep our promises and do not take risks at the expense of our customers. Together, we can overcome any construction challenge and achieve the best possible results.
Openness
We act openly and transparently. We observe best practice in the construction industry and uphold and promote it in society as a whole.
Employees
We inspire our people to grow through needs-based training and career opportunities consistent with their experience. We value our employees by providing them with a modern work environment that encourages creativity and a motivation system that fosters initiative.
Investor Presentation
Strategic agenda for 2016-2020
Business activities until 2020
• The Group will grow, mostly organically, with a focus on more efficient use of its existing resources.
• In Estonia, we will compete in both the building and the infrastructure construction segments.
• Our Estonian entities will be among their segments’ market leaders.
• In Sweden, we will focus on general contracting in Stockholm and the surrounding area.
• In Finland, we will focus on general contracting and concrete works in Helsinki and the surrounding area.
• In Ukraine, we will focus on general contracting primarily in Kiev and the surrounding area.
Investor Presentation
Strategic agenda for 2016-2020
Employees until 2020
• We expect the TRI*M Index, which reflects employee satisfaction and commitment, to improve across the Group by 3 percentage points per year on average.
• We value balanced teamwork where youthful energy and drive complement long-term experience.
• We will recognise employees that are dedicated and responsible and contribute to the Group’s success.
• We expect to raise operating profit per employee to at least 12 thousand euros.
Financial targets until 2020
• Revenue will grow at least 10% per year.
• The contribution of foreign markets will increase to 25% of revenue.
• Our own housing development revenue will account for at least 5% of our Estonian revenues.
• Operating margin per year will be consistently above 3%.
• On average, at least 30% of profit for the year will be distributed as dividends.
• Return on invested capital (ROIC) will average 13%.
Investor Presentation
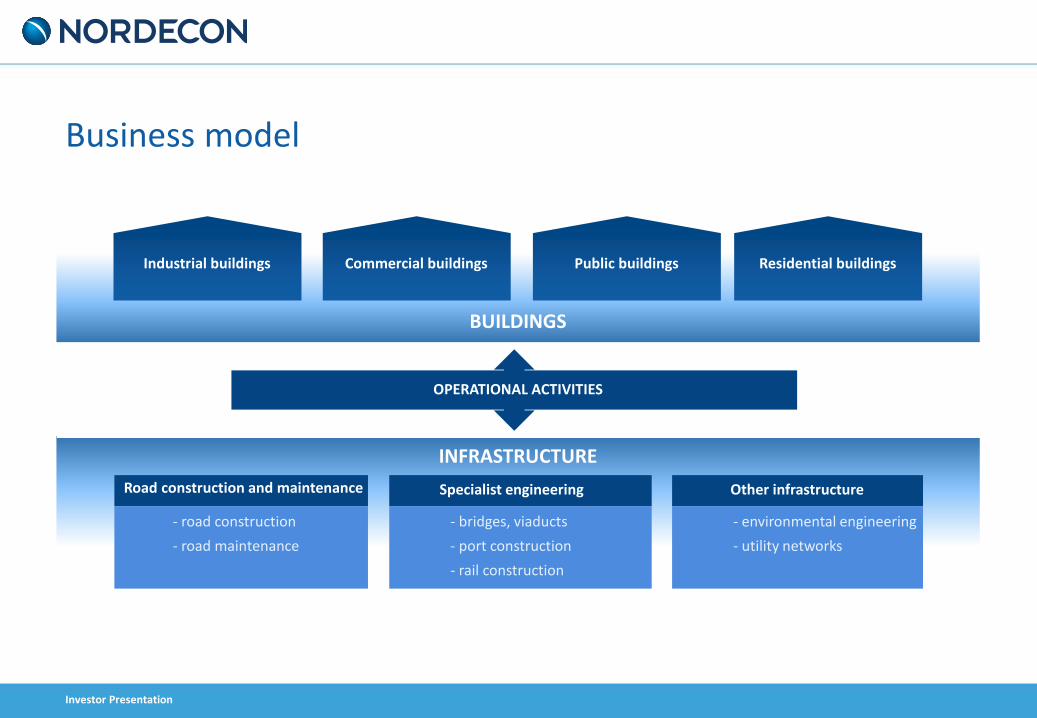
Business model
Industrial buildings Commercial buildings Public buildings Residential buildings
BUILDINGS
INFRASTRUCTURE
Road construction and maintenance
- road construction
- road maintenance
Specialist engineering
- bridges, viaducts
- port construction
- rail construction
Other infrastructure
- environmental engineering
- utility networks
OPERATIONAL ACTIVITIES
Investor Presentation
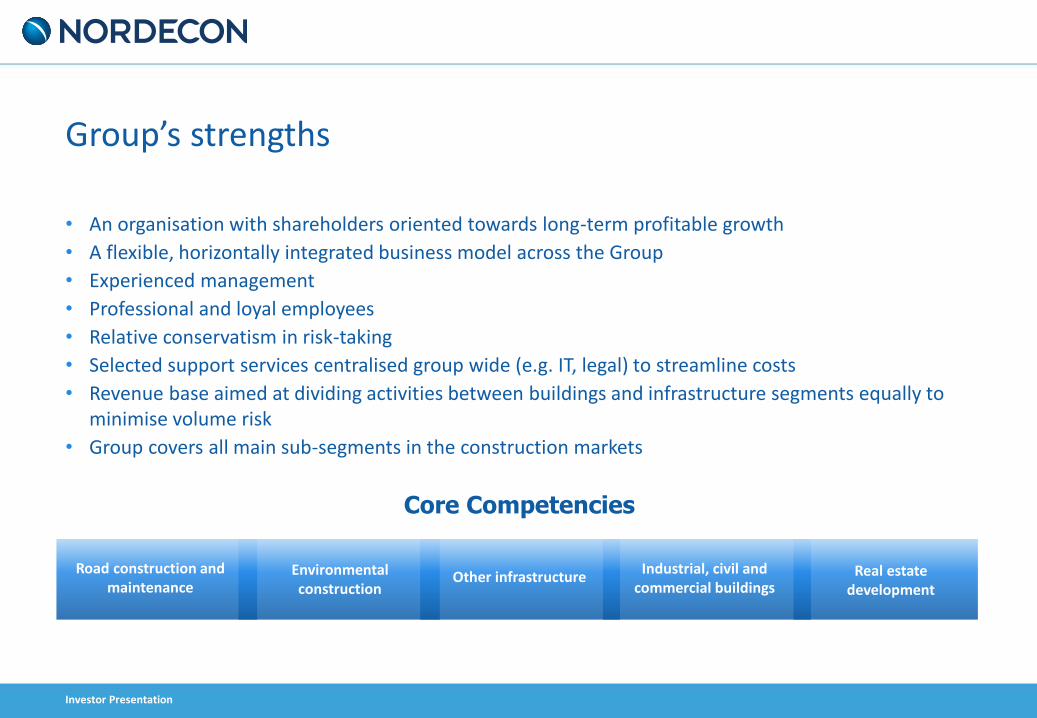
Road construction and maintenance
Environmental construction
Other infrastructure Industrial, civil and
commercial buildings Real estate
development
Core Competencies
• An organisation with shareholders oriented towards long-term profitable growth
• A flexible, horizontally integrated business model across the Group
• Experienced management
• Professional and loyal employees
• Relative conservatism in risk-taking
• Selected support services centralised group wide (e.g. IT, legal) to streamline costs
• Revenue base aimed at dividing activities between buildings and infrastructure segments equally to minimise volume risk
• Group covers all main sub-segments in the construction markets
Group’s strengths
Investor Presentation
Nordecon financial information
and key facts
3m 2016
Investor Presentation
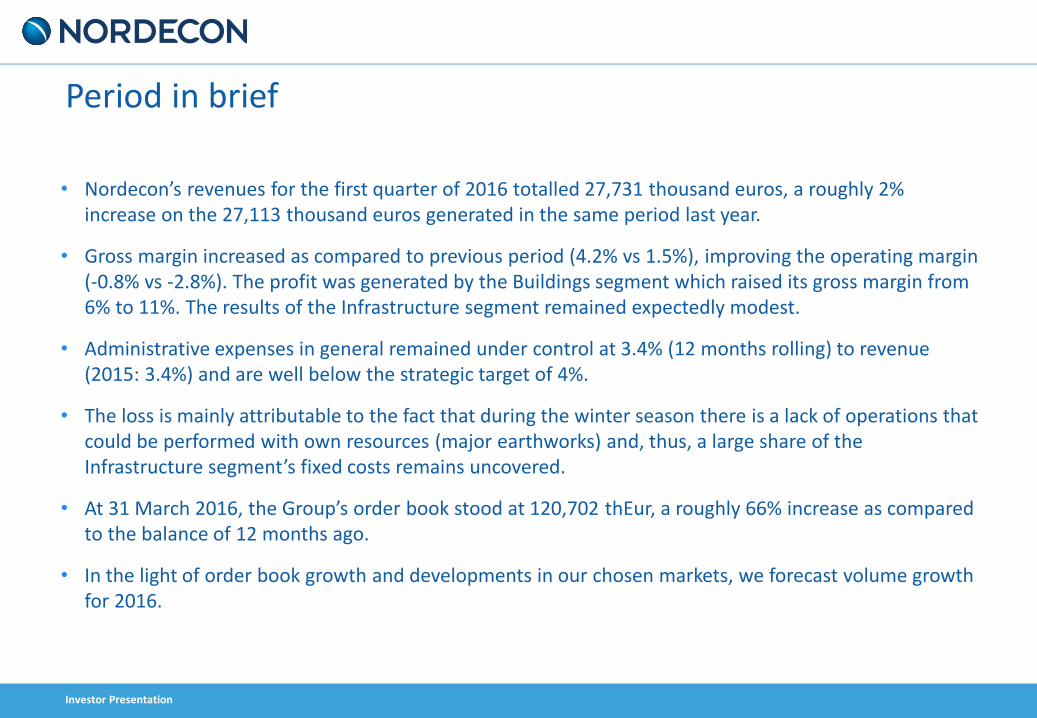
Period in brief
• Nordecon’s revenues for the first quarter of 2016 totalled 27,731 thousand euros, a roughly 2% increase on the 27,113 thousand euros generated in the same period last year.
• Gross margin increased as compared to previous period (4.2% vs 1.5%), improving the operating margin (-0.8% vs -2.8%). The profit was generated by the Buildings segment which raised its gross margin from 6% to 11%. The results of the Infrastructure segment remained expectedly modest.
• Administrative expenses in general remained under control at 3.4% (12 months rolling) to revenue (2015: 3.4%) and are well below the strategic target of 4%.
• The loss is mainly attributable to the fact that during the winter season there is a lack of operations that could be performed with own resources (major earthworks) and, thus, a large share of the Infrastructure segment’s fixed costs remains uncovered.
• At 31 March 2016, the Group’s order book stood at 120,702 thEur, a roughly 66% increase as compared to the balance of 12 months ago.
• In the light of order book growth and developments in our chosen markets, we forecast volume growth for 2016.
Investor Presentation
Key figures / ratios
Figure / Ratio 3m 2016 3m 2015
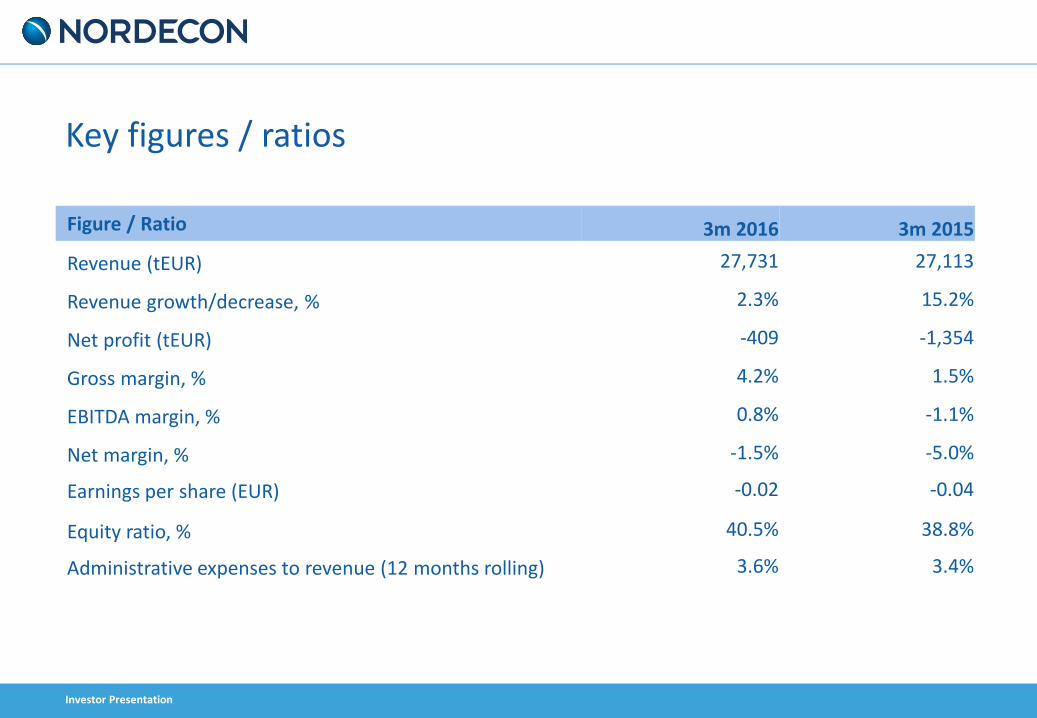
Revenue (tEUR) 27,731 27,113
Revenue growth/decrease, % 2.3% 15.2%
Net profit (tEUR) -409 -1,354
Gross margin, % 4.2% 1.5%
EBITDA margin, % 0.8% -1.1%
Net margin, % -1.5% -5.0%
Earnings per share (EUR) -0.02 -0.04
Equity ratio, % 40.5% 38.8%
Administrative expenses to revenue (12 months rolling) 3.6% 3.4%
Investor Presentation
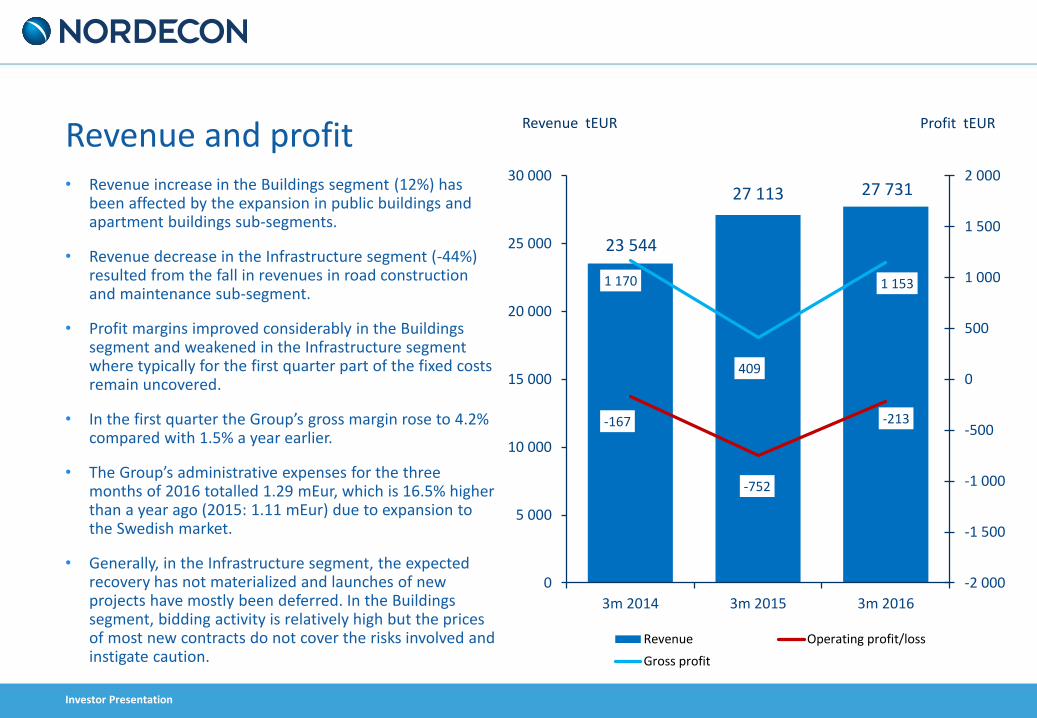
Revenue and profit • Revenue increase in the Buildings segment (12%) has
been affected by the expansion in public buildings and apartment buildings sub-segments.
• Revenue decrease in the Infrastructure segment (-44%) resulted from the fall in revenues in road construction and maintenance sub-segment.
• Profit margins improved considerably in the Buildings segment and weakened in the Infrastructure segment where typically for the first quarter part of the fixed costs remain uncovered.
• In the first quarter the Group’s gross margin rose to 4.2% compared with 1.5% a year earlier.
• The Group’s administrative expenses for the three months of 2016 totalled 1.29 mEur, which is 16.5% higher than a year ago (2015: 1.11 mEur) due to expansion to the Swedish market.
• Generally, in the Infrastructure segment, the expected recovery has not materialized and launches of new projects have mostly been deferred. In the Buildings segment, bidding activity is relatively high but the prices of most new contracts do not cover the risks involved and instigate caution.
23 544
27 113 27 731
-167
-752
-213
1 170
409
1 153
-2 000
-1 500
-1 000
-500
0
500
1 000
1 500
2 000
0
5 000
10 000
15 000
20 000
25 000
30 000
3m 2014 3m 2015 3m 2016
Profit tEUR Revenue tEUR
Revenue Operating profit/loss
Gross profit
Investor Presentation
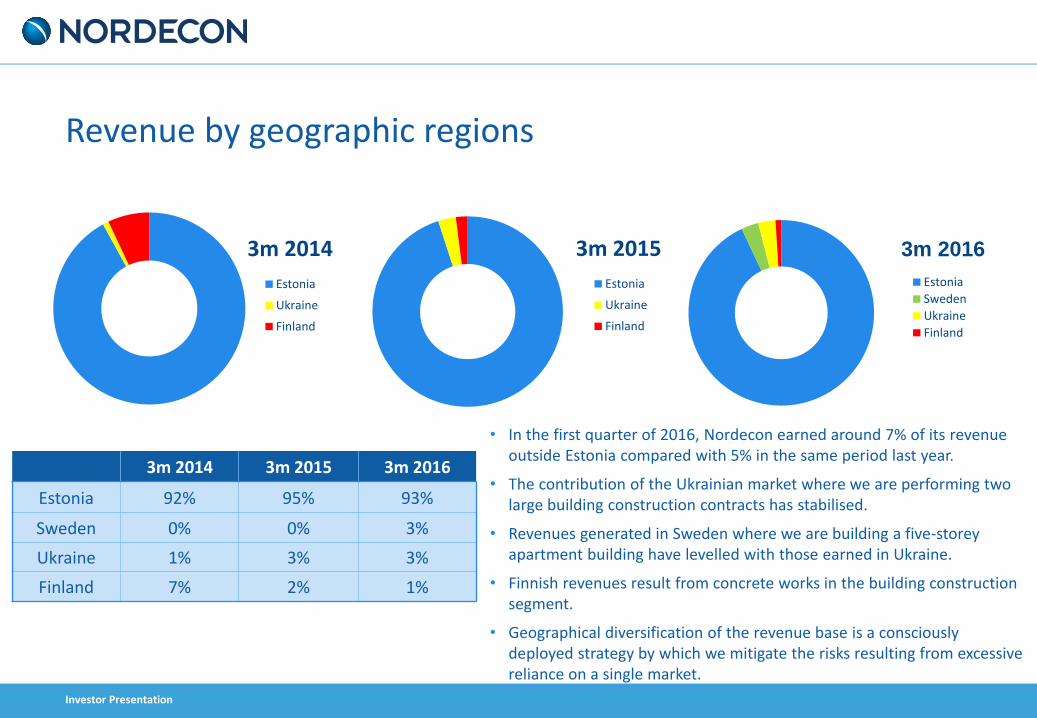
• In the first quarter of 2016, Nordecon earned around 7% of its revenue outside Estonia compared with 5% in the same period last year.
• The contribution of the Ukrainian market where we are performing two large building construction contracts has stabilised.
• Revenues generated in Sweden where we are building a five-storey apartment building have levelled with those earned in Ukraine.
• Finnish revenues result from concrete works in the building construction segment.
• Geographical diversification of the revenue base is a consciously deployed strategy by which we mitigate the risks resulting from excessive reliance on a single market.
3m 2014 3m 2015 3m 2016
Estonia 92% 95% 93%
Sweden 0% 0% 3%
Ukraine 1% 3% 3%
Finland 7% 2% 1%
Revenue by geographic regions
3m 2014
Estonia
Ukraine
Finland
3m 2015
Estonia
Ukraine
Finland
3m 2016
Estonia
Sweden
Ukraine
Finland
Investor Presentation
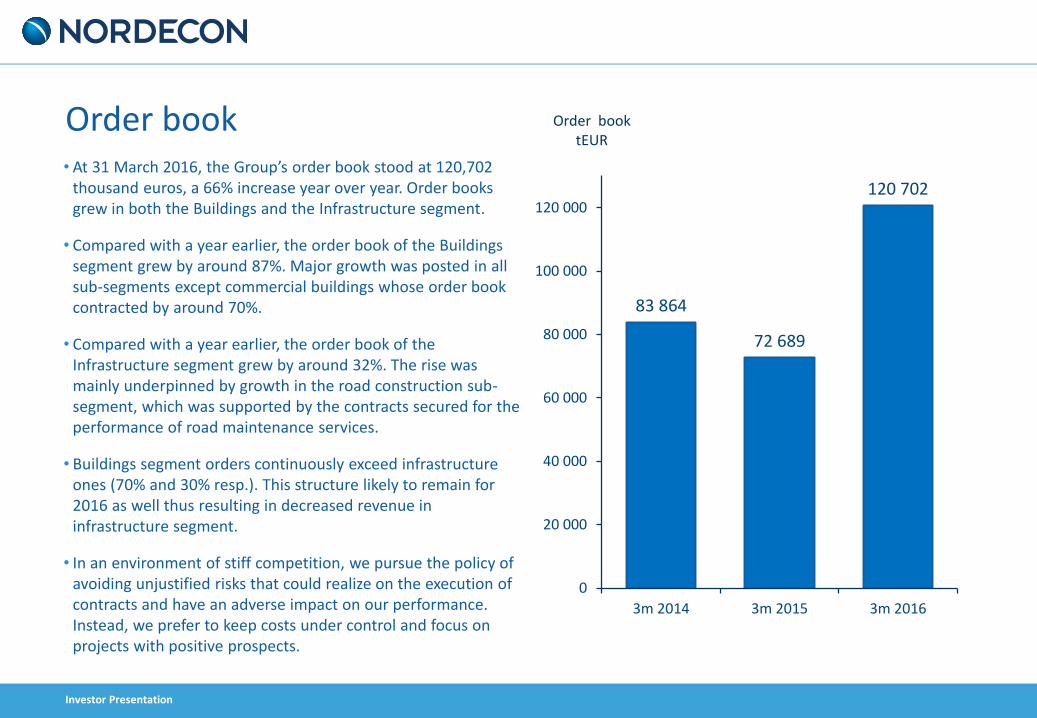
Order book • At 31 March 2016, the Group’s order book stood at 120,702
thousand euros, a 66% increase year over year. Order books grew in both the Buildings and the Infrastructure segment.
• Compared with a year earlier, the order book of the Buildings segment grew by around 87%. Major growth was posted in all sub-segments except commercial buildings whose order book contracted by around 70%.
• Compared with a year earlier, the order book of the Infrastructure segment grew by around 32%. The rise was mainly underpinned by growth in the road construction sub-segment, which was supported by the contracts secured for the performance of road maintenance services.
• Buildings segment orders continuously exceed infrastructure ones (70% and 30% resp.). This structure likely to remain for 2016 as well thus resulting in decreased revenue in infrastructure segment.
• In an environment of stiff competition, we pursue the policy of avoiding unjustified risks that could realize on the execution of contracts and have an adverse impact on our performance. Instead, we prefer to keep costs under control and focus on projects with positive prospects.
83 864
72 689
120 702
0
20 000
40 000
60 000
80 000
100 000
120 000
3m 2014 3m 2015 3m 2016
Order book tEUR
Investor Presentation
Revenue distribution by segments
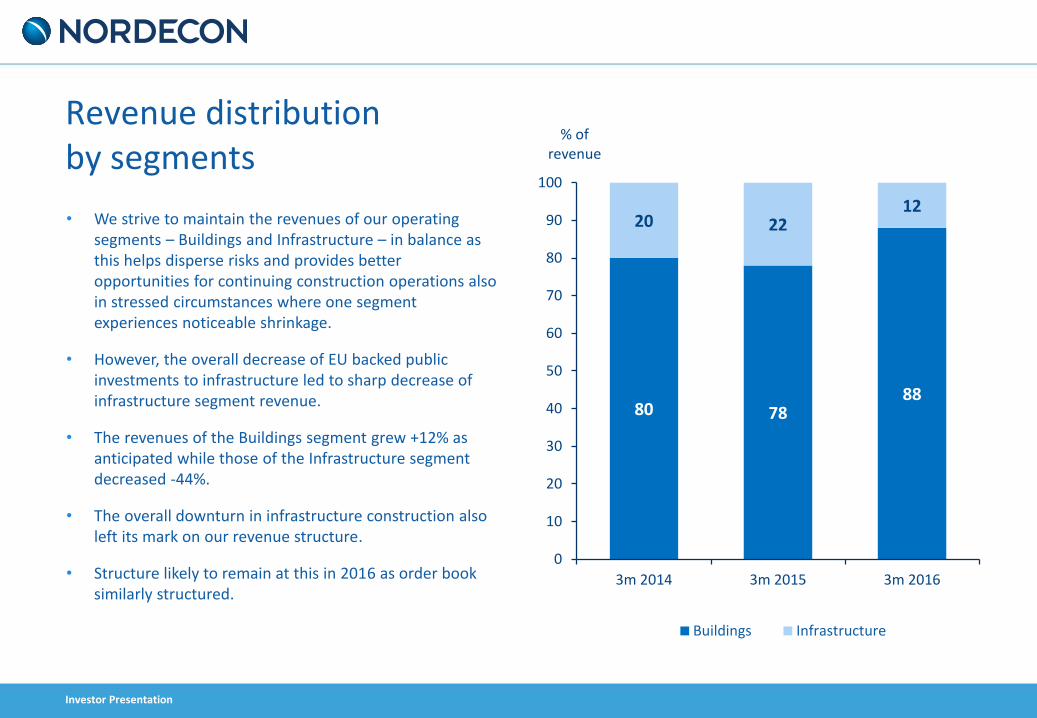
• We strive to maintain the revenues of our operating segments – Buildings and Infrastructure – in balance as this helps disperse risks and provides better opportunities for continuing construction operations also in stressed circumstances where one segment experiences noticeable shrinkage.
• However, the overall decrease of EU backed public investments to infrastructure led to sharp decrease of infrastructure segment revenue.
• The revenues of the Buildings segment grew +12% as anticipated while those of the Infrastructure segment decreased -44%.
• The overall downturn in infrastructure construction also left its mark on our revenue structure.
• Structure likely to remain at this in 2016 as order book similarly structured.
80 78 88
20 22 12
0
10
20
30
40
50
60
70
80
90
100
3m 2014 3m 2015 3m 2016
% of revenue
Buildings Infrastructure
Investor Presentation
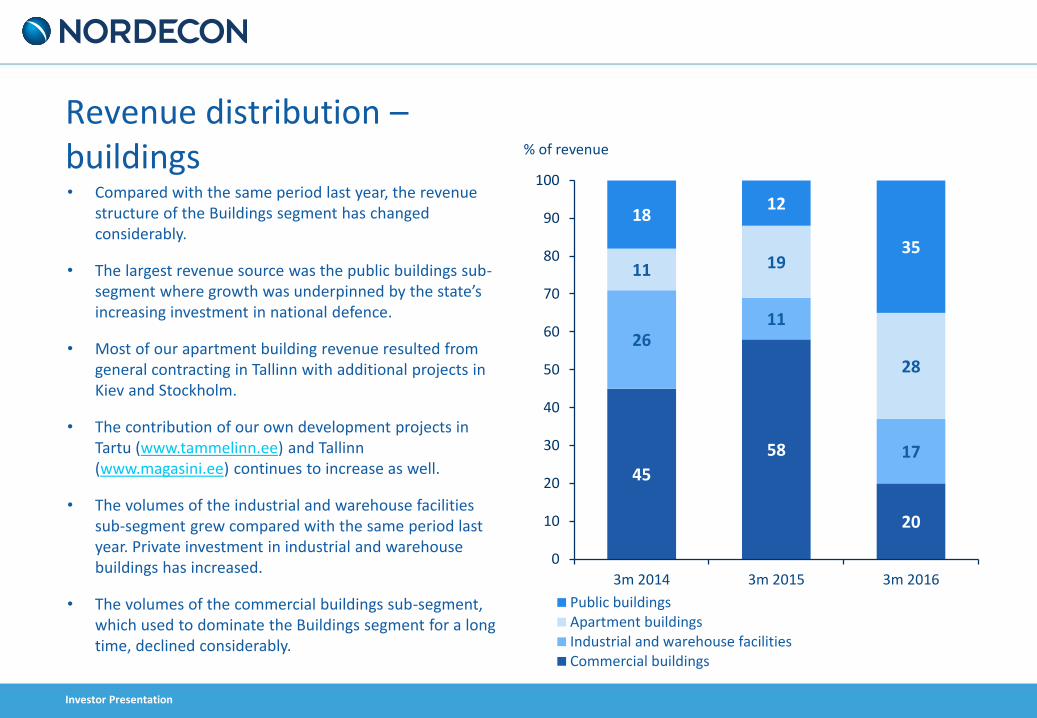
• Compared with the same period last year, the revenue structure of the Buildings segment has changed considerably.
• The largest revenue source was the public buildings sub-segment where growth was underpinned by the state’s increasing investment in national defence.
• Most of our apartment building revenue resulted from general contracting in Tallinn with additional projects in Kiev and Stockholm.
• The contribution of our own development projects in Tartu (www.tammelinn.ee) and Tallinn (www.magasini.ee) continues to increase as well.
• The volumes of the industrial and warehouse facilities sub-segment grew compared with the same period last year. Private investment in industrial and warehouse buildings has increased.
• The volumes of the commercial buildings sub-segment, which used to dominate the Buildings segment for a long time, declined considerably.
Revenue distribution – buildings
45
58
20
26 11
17
11 19
28
18 12
35
0
10
20
30
40
50
60
70
80
90
100
3m 2014 3m 2015 3m 2016
% of revenue
Public buildingsApartment buildingsIndustrial and warehouse facilitiesCommercial buildings
Investor Presentation
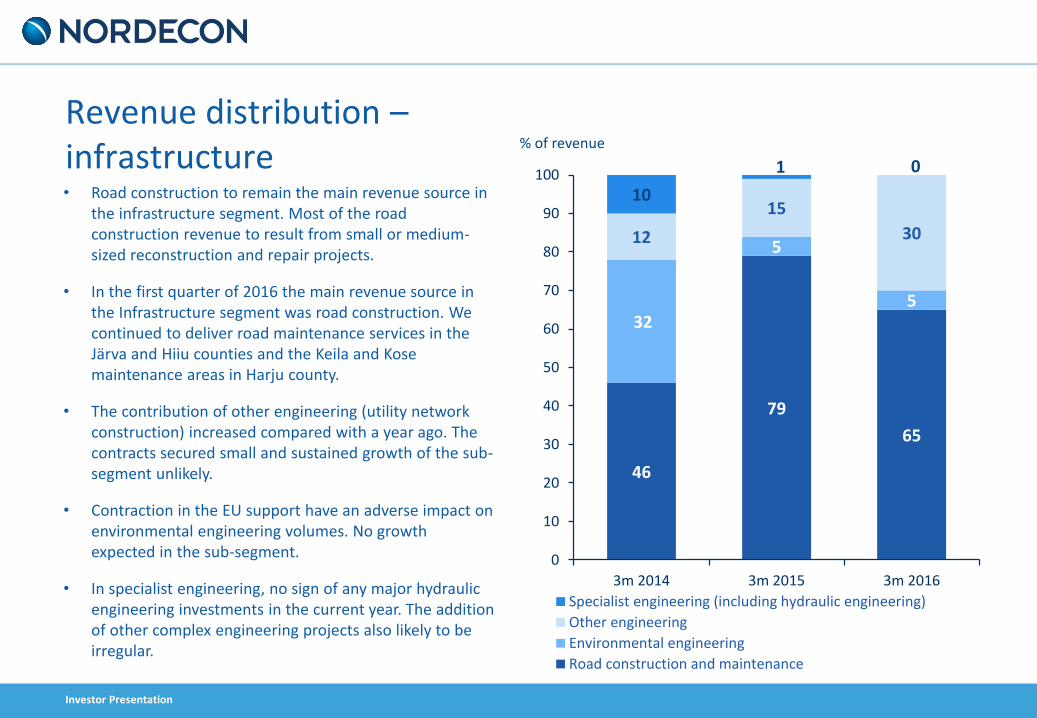
• Road construction to remain the main revenue source in the infrastructure segment. Most of the road construction revenue to result from small or medium-sized reconstruction and repair projects.
• In the first quarter of 2016 the main revenue source in the Infrastructure segment was road construction. We continued to deliver road maintenance services in the Järva and Hiiu counties and the Keila and Kose maintenance areas in Harju county.
• The contribution of other engineering (utility network construction) increased compared with a year ago. The contracts secured small and sustained growth of the sub-segment unlikely.
• Contraction in the EU support have an adverse impact on environmental engineering volumes. No growth expected in the sub-segment.
• In specialist engineering, no sign of any major hydraulic engineering investments in the current year. The addition of other complex engineering projects also likely to be irregular.
Revenue distribution – infrastructure
46
79
65
32
5
5
12
15
30
10
1 0
0
10
20
30
40
50
60
70
80
90
100
3m 2014 3m 2015 3m 2016
% of revenue
Specialist engineering (including hydraulic engineering)
Other engineering
Environmental engineering
Road construction and maintenance
Investor Presentation
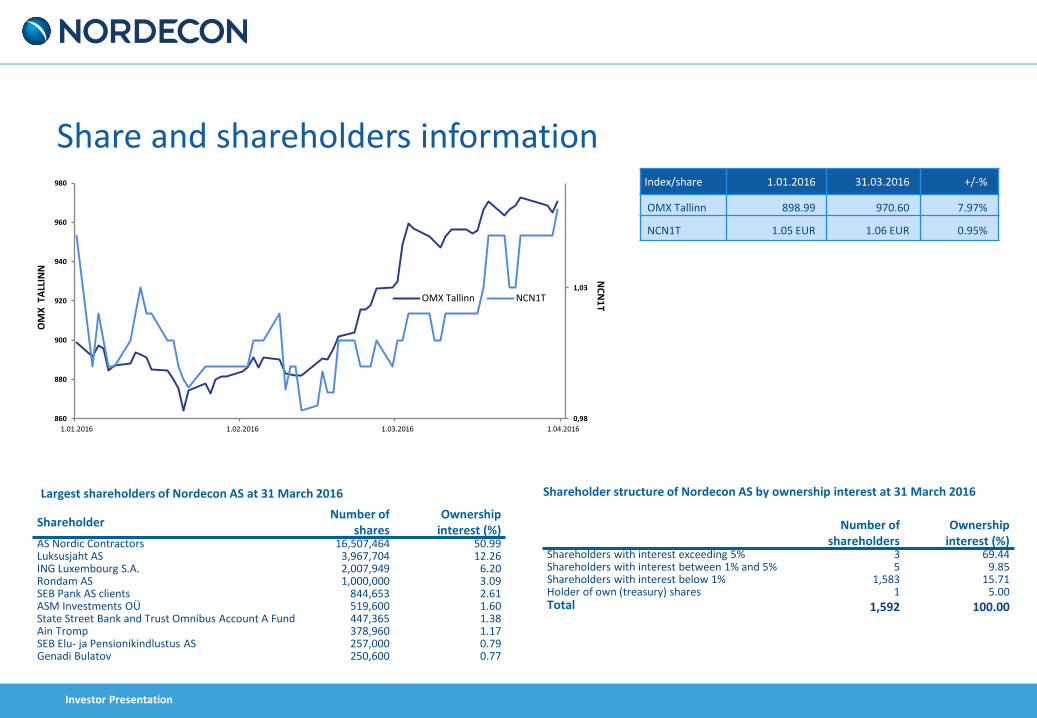
Share and shareholders information Index/share 1.01.2016 31.03.2016 +/-%
OMX Tallinn 898.99 970.60 7.97%
NCN1T 1.05 EUR 1.06 EUR 0.95%
Shareholder Number of
shares Ownership
interest (%) AS Nordic Contractors 16,507,464 50.99 Luksusjaht AS 3,967,704 12.26 ING Luxembourg S.A. 2,007,949 6.20 Rondam AS 1,000,000 3.09 SEB Pank AS clients 844,653 2.61 ASM Investments OÜ 519,600 1.60 State Street Bank and Trust Omnibus Account A Fund 447,365 1.38 Ain Tromp 378,960 1.17 SEB Elu- ja Pensionikindlustus AS 257,000 0.79 Genadi Bulatov 250,600 0.77
Largest shareholders of Nordecon AS at 31 March 2016
Number of shareholders
Ownership interest (%)
Shareholders with interest exceeding 5% 3 69.44 Shareholders with interest between 1% and 5% 5 9.85 Shareholders with interest below 1% 1,583 15.71 Holder of own (treasury) shares 1 5.00 Total 1,592 100.00
Shareholder structure of Nordecon AS by ownership interest at 31 March 2016
0,98
1,03
860
880
900
920
940
960
980
1.01.2016 1.02.2016 1.03.2016 1.04.2016
OMX Tallinn NCN1T
OM
X TA
LLIN
N
NC
N1
T
Investor Presentation
Nordecon AS Tel: +372 615 4400 www.nordecon.com Pärnu mnt 158/1 Tallinn 11317 Estonia Head of Investor Relations Andri Hõbemägi Tel: +372 615 4400 [email protected]
Contact Information


![Investor Presentation - Q1FY2012 v9 [Read-Only]cdn.fortishealthcare.com/pdf/Investor_Presentation_-_Q1FY2012.pdfInvestor Investor Presentation Presentation – Q1 FY2012Q1 FY2012](https://img.pdfslide.us/doc/110x75/5fabaee8d44e9131e03ccb8d/investor-presentation-q1fy2012-v9-read-onlycdn-investor-investor-presentation.jpg)