Embed Size (px)
Citation preview
Investor PresentationJanuary 2020
Disclaimer
The material in this presentation has been prepared by IMF Bentham Limited (IMF) and is general
background information about IMF's activities. The information is given in summary form and does not
purport to be complete.
A number of terms used in this presentation including; ROIC, EPV, success rate by $ weighted
average, success rate by number of investments, IRR, actual, budgeted and deployed committed
capital are categorised as non-IFRS information prepared in accordance with ASIC Regulatory
Guidance 230 – Disclosing non-IFRS financial information, issued in December 2011. This
information has not been audited or reviewed. For further commentary and analysis refer to IMF’s
2019 annual report.
This presentation is provided for general information purposes. Nothing in this document constitutes
an offer to sell, or a solicitation of an offer to by, any securities in the United Kingdom or any other
jurisdiction. This document provides information only and does not provide any form of financial
advice and does not constitute an invitation or inducement to engage in investment activity under
Section 21 of the Financial Services and Markets Act 2000 (FSMA).
To the maximum extent permitted by law, no representation or warranty is given, express or implied,
as to the accuracy of the information contained in the presentation.
The information in this presentation is not investment advice and has been prepared without taking
into account your investment objectives, financial situation or particular needs (including financial and
taxation issues). It is important that you read and consider the terms of any IMF securities in full
before deciding to invest in such securities and consider the risks that could affect the performance
of those securities.
If you have any questions, you should seek advice from your financial adviser or other professional
adviser before deciding to invest in IMF securities.
Save in respect of the specific commentary regarding the Brisbane floods class action on pages 13 -
14, by providing the material in this presentation IMF is not in any way making forecasts, predictions
or providing earnings guidance and nothing in this presentation should be relied on as doing so.
This presentation is for use of IMF’s public shareholders and is not an offering of any fund managed
or advised by IMF or any of its affiliates. Bentham Capital Management LLC (BCM) is registered as
an investment adviser with the U.S. Securities and Exchange Commission. The information provided
for the IMF funds herein is for informational purposes only. Past performance is not indicative of future
results. Any information contained herein is not, and should not be construed as, an offer to sell or
the solicitation of an offer to buy any securities (including, without limitation, interests or shares in the
funds).
This presentation is for the use of IMF Bentham’s public shareholders and is not an offering of any IMF Bentham private fund.
2
33
1 2 3 4 5 6
LEGAL FINANCIAL
SOLUTIONS
IMF BENTHAM OMNI BRIDGEWAY OUR COMBINED
BUSINESS
CURRENT YEAR
DEVELOPMENTS
Q&A
Agenda
4
1 2 3 4 5 6
LEGAL FINANCIAL
SOLUTIONS
IMF BENTHAM OMNI BRIDGEWAY OUR COMBINED
BUSINESS
CURRENT YEAR
DEVELOPMENTS
Q&A
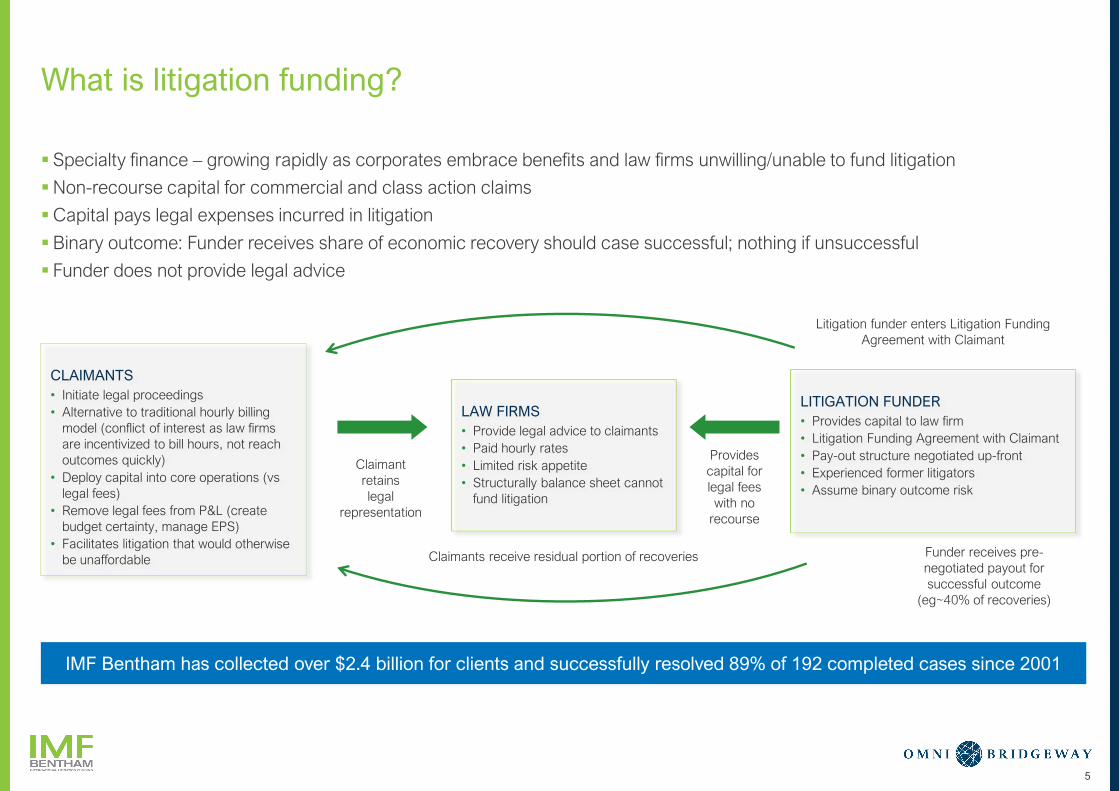
What is litigation funding?
▪ Specialty finance – growing rapidly as corporates embrace benefits and law firms unwilling/unable to fund litigation
▪Non-recourse capital for commercial and class action claims
▪Capital pays legal expenses incurred in litigation
▪Binary outcome: Funder receives share of economic recovery should case successful; nothing if unsuccessful
▪ Funder does not provide legal advice
IMF Bentham has collected over $2.4 billion for clients and successfully resolved 89% of 192 completed cases since 2001
CLAIMANTS
• Initiate legal proceedings
• Alternative to traditional hourly billing
model (conflict of interest as law firms
are incentivized to bill hours, not reach
outcomes quickly)
• Deploy capital into core operations (vs
legal fees)
• Remove legal fees from P&L (create
budget certainty, manage EPS)
• Facilitates litigation that would otherwise
be unaffordable
LAW FIRMS
• Provide legal advice to claimants
• Paid hourly rates
• Limited risk appetite
• Structurally balance sheet cannot
fund litigation
LITIGATION FUNDER
• Provides capital to law firm
• Litigation Funding Agreement with Claimant
• Pay-out structure negotiated up-front
• Experienced former litigators
• Assume binary outcome risk
Claimant
retains
legal
representation
Provides
capital for
legal fees
with no
recourse
Claimants receive residual portion of recoveries Funder receives pre-
negotiated payout for
successful outcome
(eg~40% of recoveries)
Litigation funder enters Litigation Funding
Agreement with Claimant
5
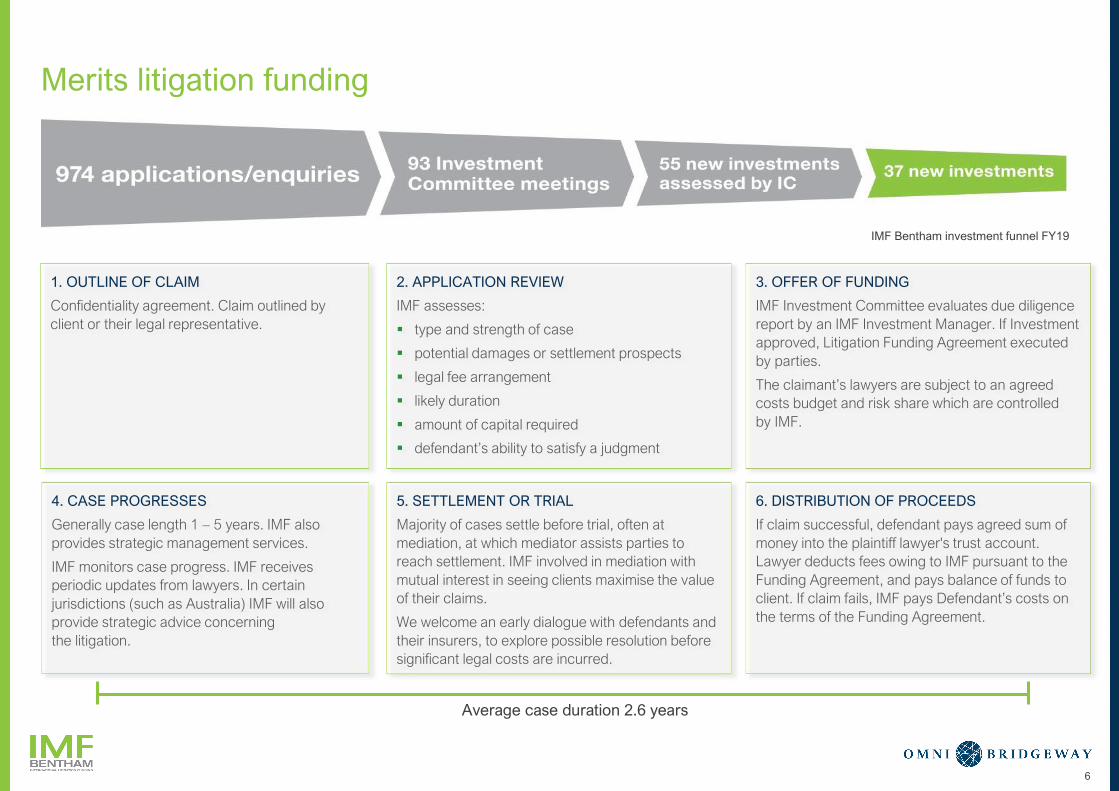
Merits litigation funding
6
4. CASE PROGRESSES
Generally case length 1 – 5 years. IMF also
provides strategic management services.
IMF monitors case progress. IMF receives
periodic updates from lawyers. In certain
jurisdictions (such as Australia) IMF will also
provide strategic advice concerning
the litigation.
1. OUTLINE OF CLAIM
Confidentiality agreement. Claim outlined by
client or their legal representative.
2. APPLICATION REVIEW
IMF assesses:
▪ type and strength of case
▪ potential damages or settlement prospects
▪ legal fee arrangement
▪ likely duration
▪ amount of capital required
▪ defendant’s ability to satisfy a judgment
5. SETTLEMENT OR TRIAL
Majority of cases settle before trial, often at
mediation, at which mediator assists parties to
reach settlement. IMF involved in mediation with
mutual interest in seeing clients maximise the value
of their claims.
We welcome an early dialogue with defendants and
their insurers, to explore possible resolution before
significant legal costs are incurred.
6. DISTRIBUTION OF PROCEEDS
If claim successful, defendant pays agreed sum of
money into the plaintiff lawyer's trust account.
Lawyer deducts fees owing to IMF pursuant to the
Funding Agreement, and pays balance of funds to
client. If claim fails, IMF pays Defendant’s costs on
the terms of the Funding Agreement.
3. OFFER OF FUNDING
IMF Investment Committee evaluates due diligence
report by an IMF Investment Manager. If Investment
approved, Litigation Funding Agreement executed
by parties.
The claimant’s lawyers are subject to an agreed
costs budget and risk share which are controlled
by IMF.
IMF Bentham investment funnel FY19
Average case duration 2.6 years
7
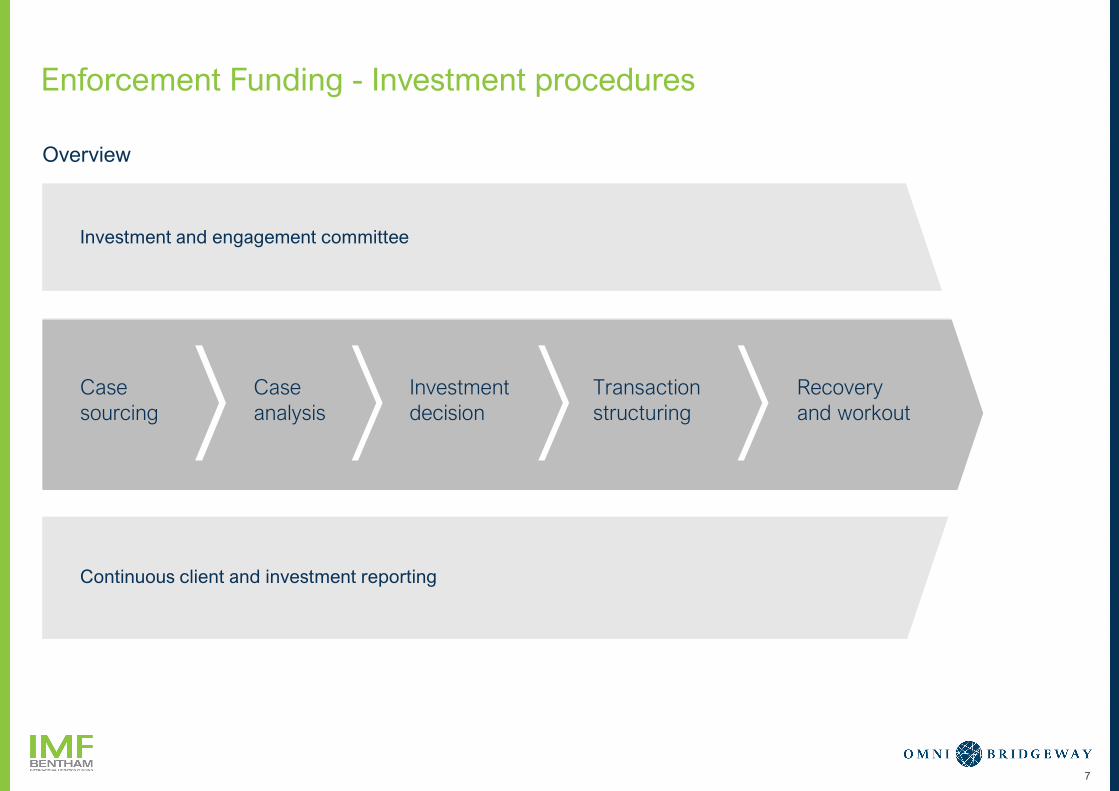
Enforcement Funding - Investment procedures
Investment and engagement committee
Continuous client and investment reporting
Case
sourcing
Case
analysis
Investment
decision
Transaction
structuring
Recovery
and workout
Overview
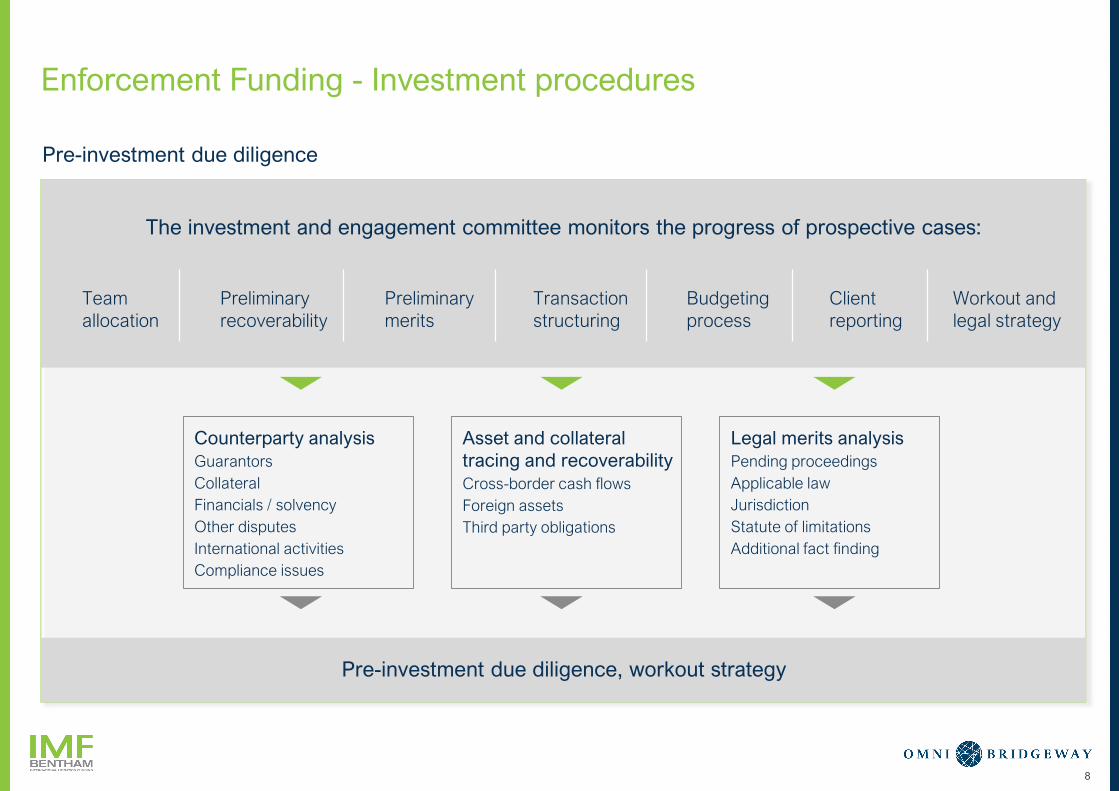
Enforcement Funding - Investment procedures
8
The investment and engagement committee monitors the progress of prospective cases:
Pre-investment due diligence, workout strategy
Team
allocation
Preliminary
recoverability
Preliminary
merits
Transaction
structuring
Budgeting
process
Client
reporting
Workout and
legal strategy
Counterparty analysis
Guarantors
Collateral
Financials / solvency
Other disputes
International activities
Compliance issues
Asset and collateral
tracing and recoverability
Cross-border cash flows
Foreign assets
Third party obligations
Legal merits analysis
Pending proceedings
Applicable law
Jurisdiction
Statute of limitations
Additional fact finding
Pre-investment due diligence
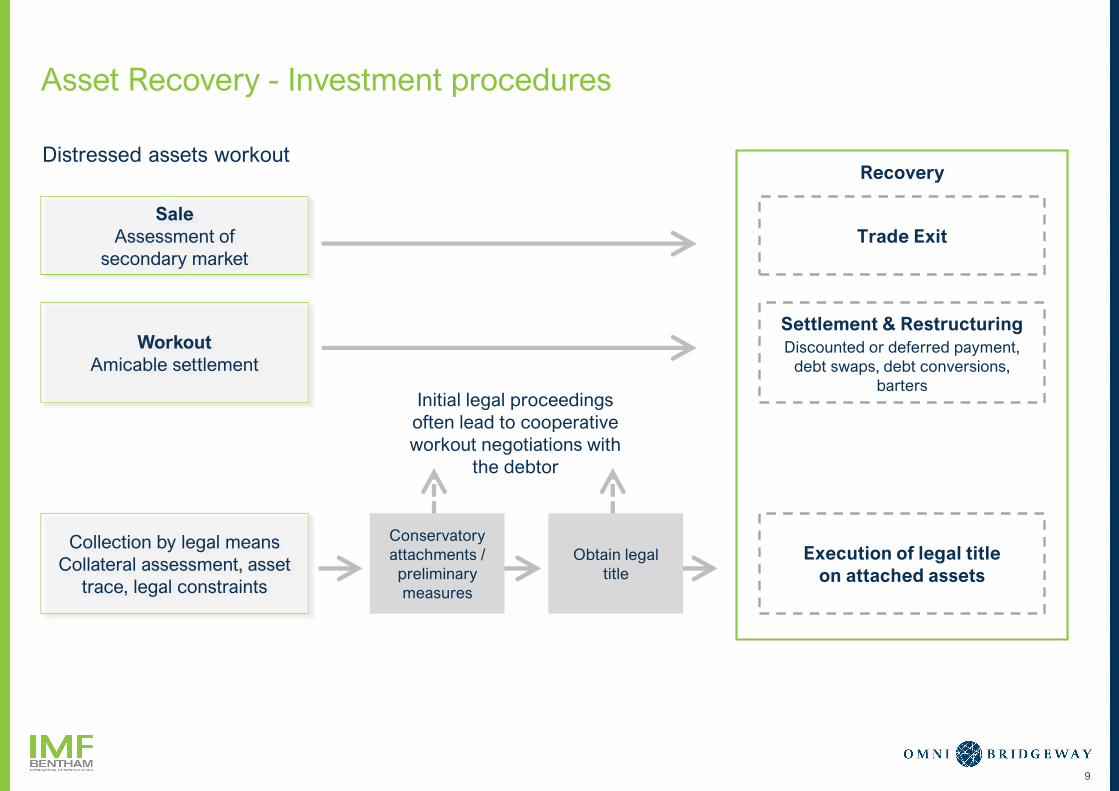
Asset Recovery - Investment procedures
9
Settlement & Restructuring
Discounted or deferred payment,
debt swaps, debt conversions,
barters
Trade Exit
Recovery
Execution of legal title
on attached assets
Conservatory
attachments /
preliminary
measures
Obtain legal
title
Initial legal proceedings
often lead to cooperative
workout negotiations with
the debtor
Distressed assets workout
Sale
Assessment of
secondary market
Workout
Amicable settlement
Collection by legal means
Collateral assessment, asset
trace, legal constraints
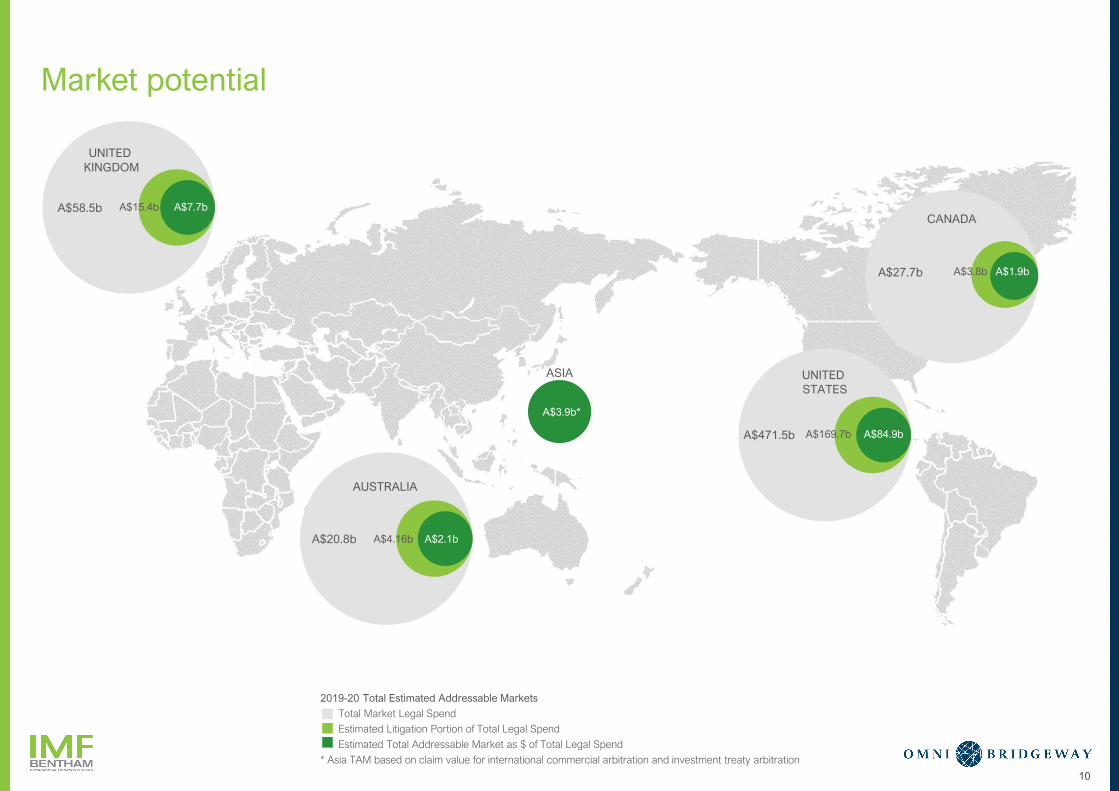
Market potential
10
A$58.5b A$7.7bA$15.4b
A$20.8b A$2.1bA$4.16b
A$27.7b A$1.9bA$3.8b
2019-20 Total Estimated Addressable Markets
Total Market Legal Spend
Estimated Litigation Portion of Total Legal Spend
Estimated Total Addressable Market as $ of Total Legal Spend
* Asia TAM based on claim value for international commercial arbitration and investment treaty arbitration
AUSTRALIA
UNITED
KINGDOM
CANADA
A$3.9b*
ASIA
A$471.5b A$169.7b A$84.9b
UNITED
STATES
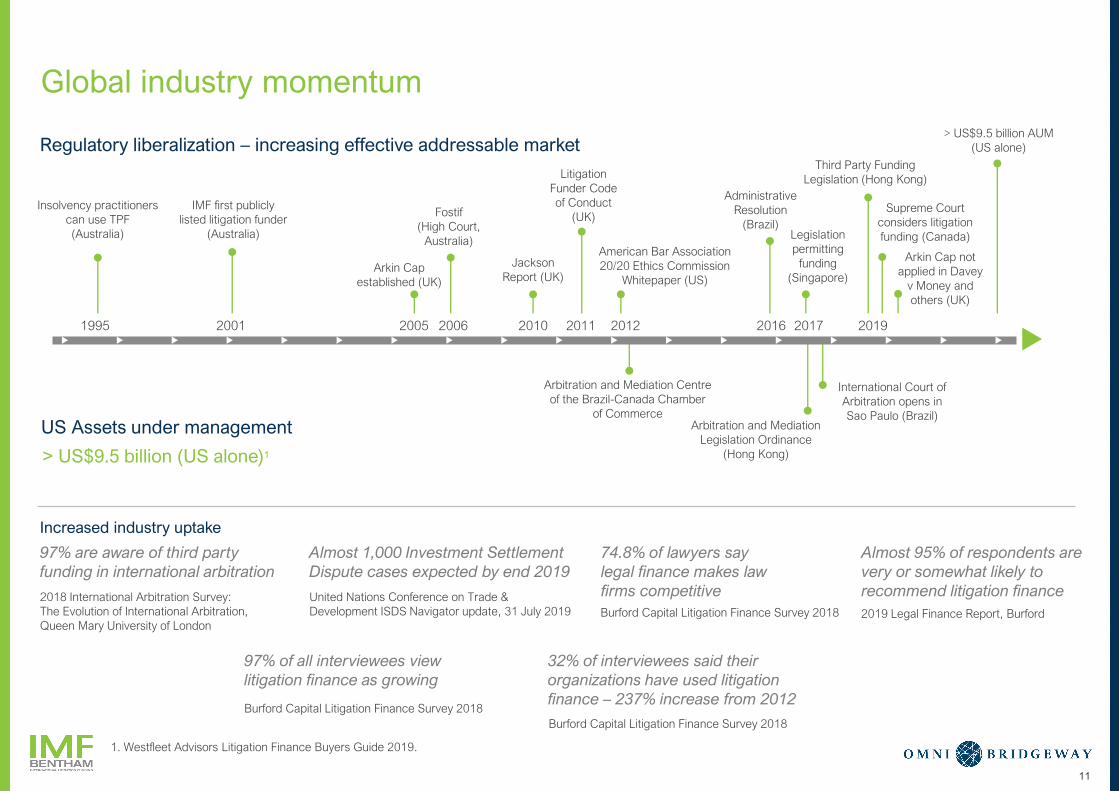
Global industry momentum
11
Insolvency practitioners
can use TPF
(Australia)
1995 20192001 2005 20102006 2011 2012 2016 2017
IMF first publicly
listed litigation funder
(Australia)
Arkin Cap
established (UK)
Fostif
(High Court,
Australia)
Jackson
Report (UK)
Litigation
Funder Code
of Conduct
(UK)
American Bar Association
20/20 Ethics Commission
Whitepaper (US)
Arbitration and Mediation Centre
of the Brazil-Canada Chamber
of Commerce
Administrative
Resolution
(Brazil)Legislation
permitting
funding
(Singapore)
Arbitration and Mediation
Legislation Ordinance
(Hong Kong)
International Court of
Arbitration opens in
Sao Paulo (Brazil)
Third Party Funding
Legislation (Hong Kong)
Supreme Court
considers litigation
funding (Canada)
Arkin Cap not
applied in Davey
v Money and
others (UK)
Regulatory liberalization – increasing effective addressable market
> US$9.5 billion (US alone)1
US Assets under management
Increased industry uptake
97% are aware of third party
funding in international arbitration
2018 International Arbitration Survey:
The Evolution of International Arbitration,
Queen Mary University of London
Almost 1,000 Investment Settlement
Dispute cases expected by end 2019
United Nations Conference on Trade &
Development ISDS Navigator update, 31 July 2019
74.8% of lawyers say
legal finance makes law
firms competitive
Almost 95% of respondents are
very or somewhat likely to
recommend litigation finance
2019 Legal Finance Report, Burford
97% of all interviewees view
litigation finance as growing
Burford Capital Litigation Finance Survey 2018
32% of interviewees said their
organizations have used litigation
finance – 237% increase from 2012
Burford Capital Litigation Finance Survey 2018
> US$9.5 billion AUM
(US alone)
Burford Capital Litigation Finance Survey 2018
1. Westfleet Advisors Litigation Finance Buyers Guide 2019.
1 2 3 4 5 6
LEGAL FINANCIAL
SOLUTIONS
IMF BENTHAM OMNI BRIDGEWAY OUR COMBINED
BUSINESS
CURRENT YEAR
DEVELOPMENTS
Q&A
12
The big “W”
▪Over the past several years we have managed two large investments in
Wivenhoe and Westgem which represented both a material opportunity and a
material risk given the size of the investments, the potential adverse cost
exposure and the impact on profitability if these matters were won or lost.
▪With respect to Wivenhoe, on 29 November 2019 Justice Beech-Jones handed
down his decision in a 1,600 page judgment in favour of our clients. The
decision identified that the defendants, the State of Queensland, the
Queensland Bulk Water Supply Authority, trading as Seqwater and Sunwater
Limited, were liable in negligence to group members.
▪The judgment makes findings in relation to issues that are common to the
approximately 6,800 group members. However, individual losses of group
members still need to be proved relying on these findings.
▪The events giving rise to the claim occurred in 2011, and the action
commenced as a closed class(1) in 2014. The trial commenced in 2017, and
ran for over a year. The total external costs paid were in excess of $50 million,
with several millions of dollars of expenditure deferred and carried by the
lawyers pending a successful outcome.
13
Notes: (1) on behalf of class members who had signed a funding agreement with IMF.
The big “W” (continued)
▪ IMF co-funded this investment with Innsworth on the basis that expenses and
returns are shared equally and that IMF is to be paid a fee, such that, in effect,
the commission is split 57.5% to IMF and 42.5% to Innsworth.
▪ In addition to external costs, given the length of time since these two
investments commenced, and the amount of internal work undertaken, the
carrying cost of the investments in IMF’s balance sheet includes substantial
capitalised interest and overheads.
▪The quantum of losses of all the group members is still to be determined. That
process will likely involve an individualistic assessment. Any estimate of total
loss and of IMF’s potential returns is subject to substantial uncertainties and
relies on assumptions. In that context, IMF estimates that, subject to appeals,
it is likely (on a conservative basis) to recognise income from this investment in
the range of $100 million and $130 million, inclusive of costs. The timing of
such recognition is uncertain.
▪Subject to completing as anticipated, this represents IMF’s most remunerative
investment to date.
▪As noted, there is a risk that the judgment will be appealed and two of the
defendants have given notice of an intention to do so. Income will depend on
the outcome of the various processes, including any appeals, any settlement
and any individual judgments in favour of group members.
14
The other “W”
▪The Westgem proceedings were issued in 2012. The trial on liability
commenced in early April 2018 and continued through to the end of June
2018. Judgment is expected momentarily.
▪ If IMF’s client succeeds at trial, there is a risk that the defendants will appeal a
decision. If IMF’s client fails at trial, IMF will recognise the loss and will consider
with the clients any grounds for appeal.
▪ IMF’s capitalised costs, inclusive of external costs and overheads are similar to
those in Wivenhoe. An ATE policy has been obtained to insure some of the
adverse costs in Westgem. Adverse costs of Westgem are covered to the
extent of $7.5 million. Our uninsured exposure is estimated to be about $7.5
million.
▪Based on the above, with the Wivenhoe outcome, the IMF position is materially
de-risked.
15
Common Fund Orders
▪The High Court handed down its decision on 4 December 2019 in what was
known as the Westpac and BMW CFO appeals. The High Court by majority
allowed the appeals, which effectively overruled the Appeals Court and the
Court of first instance decisions to allow CFOs.
▪The media reported that this was the “death” of class actions and a “major
setback” for funders. In the words of Mark Twain, “the reports of my death are
greatly exaggerated”.
▪The High Court decision takes litigation funding back to a time before CFO’s
were permitted (pre a decision in 2016 called “Money Max”), when IMF funded
class actions under an “opt in” model, requiring claimants to sign-up to a LFA
and agree to participate in the class action process.
▪The Money Max decision encouraged the “opt out” model, where a class
member was in an open class, sometimes unknowingly, until such time as they
opt out of the class. Funders were not required to build a book of interested
participants or enter funding arrangements with each group member, such that
the Court was required to intervene to set an appropriate commission rate
payable to the funder from the recoveries (this was the CFO).
16
Common Fund Orders (continued)
▪ IMF is uniquely positioned in the funding world with its internal infrastructure for
book-building, to undertake class actions under the “opt in” model following the
High Court decision.
▪ IMF will continue to explore class action opportunities on a closed class basis,
and may be in a position to take over class actions that have been commenced
on an open class basis where the funder lacks the capacity or interest in
undertaking a bookbuild process.
▪We expect this development will have a cooling effect on IMF’s competitors who
do not have bookbuilding capacity, and should enhance IMF’s position as the
pre-eminent class action funder in Australia.
17
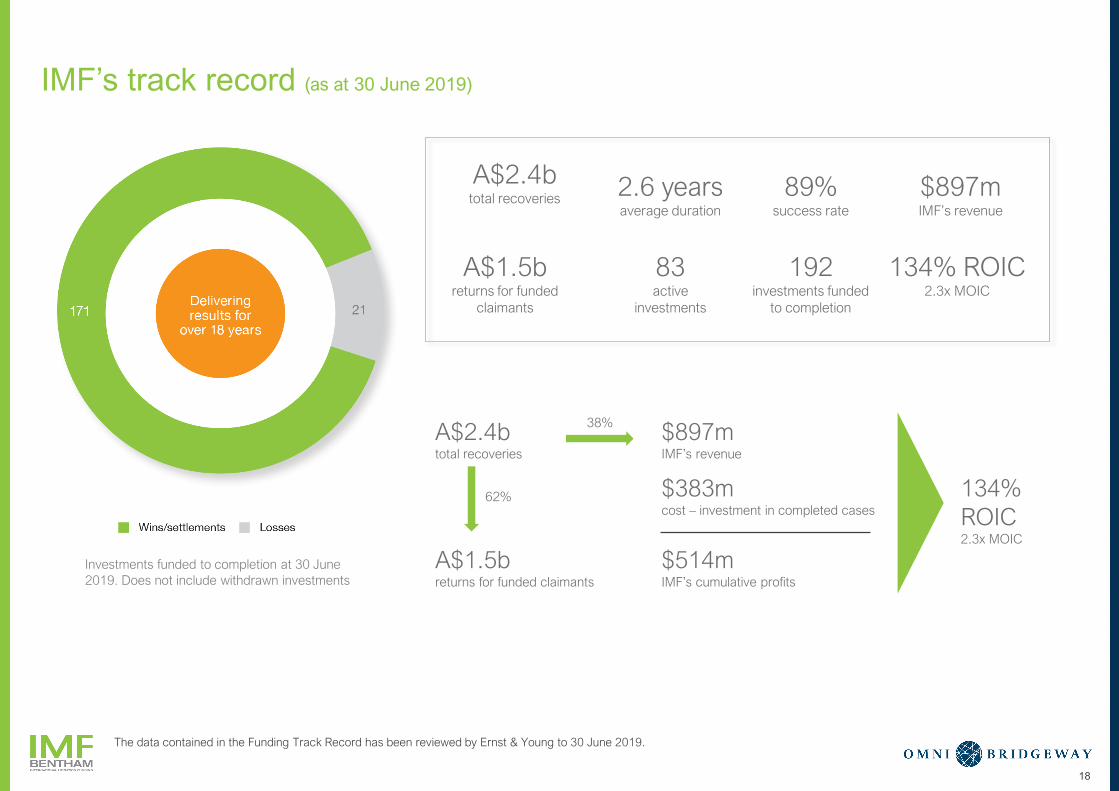
IMF’s track record (as at 30 June 2019)
Investments funded to completion at 30 June
2019. Does not include withdrawn investments
A$2.4btotal recoveries
A$1.5breturns for funded
claimants
192investments funded
to completion
2.6 yearsaverage duration
89%success rate
83active
investments
134% ROIC2.3x MOIC
$897mIMF’s revenue
A$2.4btotal recoveries
A$1.5breturns for funded claimants
$897mIMF’s revenue
$383mcost – investment in completed cases
$514mIMF’s cumulative profits
134%
ROIC2.3x MOIC
38%
62%
The data contained in the Funding Track Record has been reviewed by Ernst & Young to 30 June 2019.
18
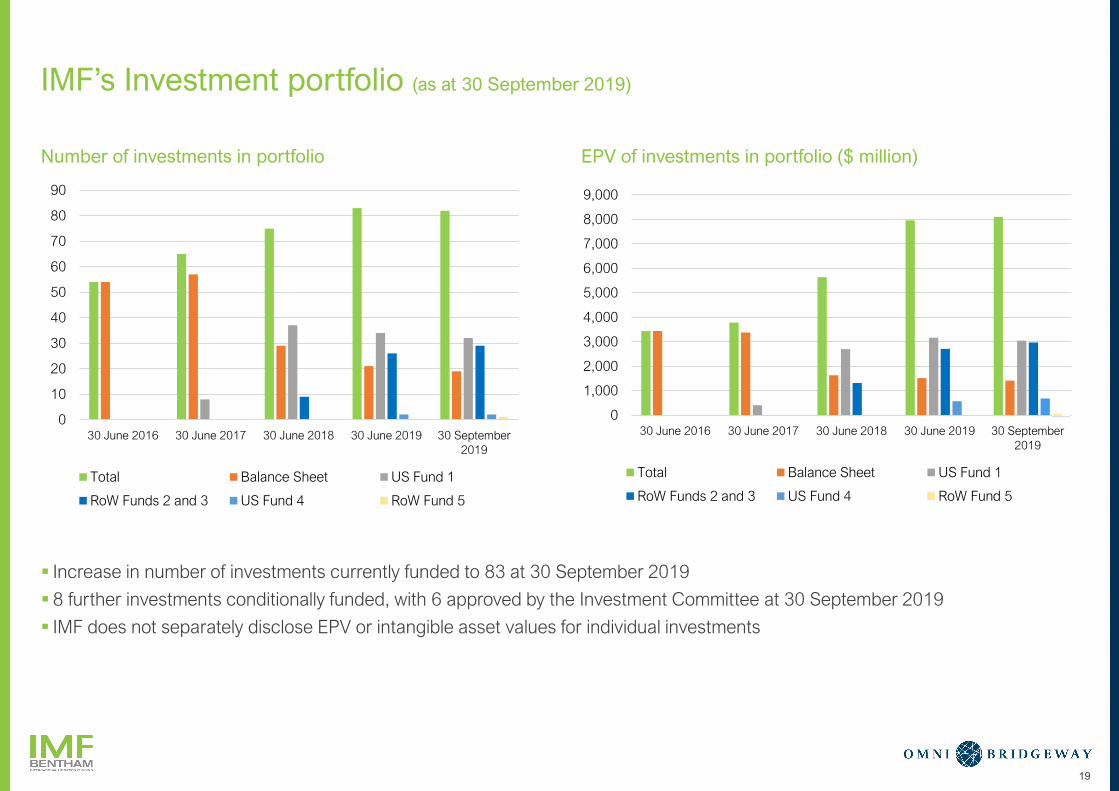
IMF’s Investment portfolio (as at 30 September 2019)
▪ Increase in number of investments currently funded to 83 at 30 September 2019
▪ 8 further investments conditionally funded, with 6 approved by the Investment Committee at 30 September 2019
▪ IMF does not separately disclose EPV or intangible asset values for individual investments
19
0
10
20
30
40
50
60
70
80
90
30 June 2016 30 June 2017 30 June 2018 30 June 2019 30 September
2019
Total Balance Sheet US Fund 1
RoW Funds 2 and 3 US Fund 4 RoW Fund 5
0
1,000
2,000
3,000
4,000
5,000
6,000
7,000
8,000
9,000
30 June 2016 30 June 2017 30 June 2018 30 June 2019 30 September
2019
Total Balance Sheet US Fund 1
RoW Funds 2 and 3 US Fund 4 RoW Fund 5
Number of investments in portfolio EPV of investments in portfolio ($ million)
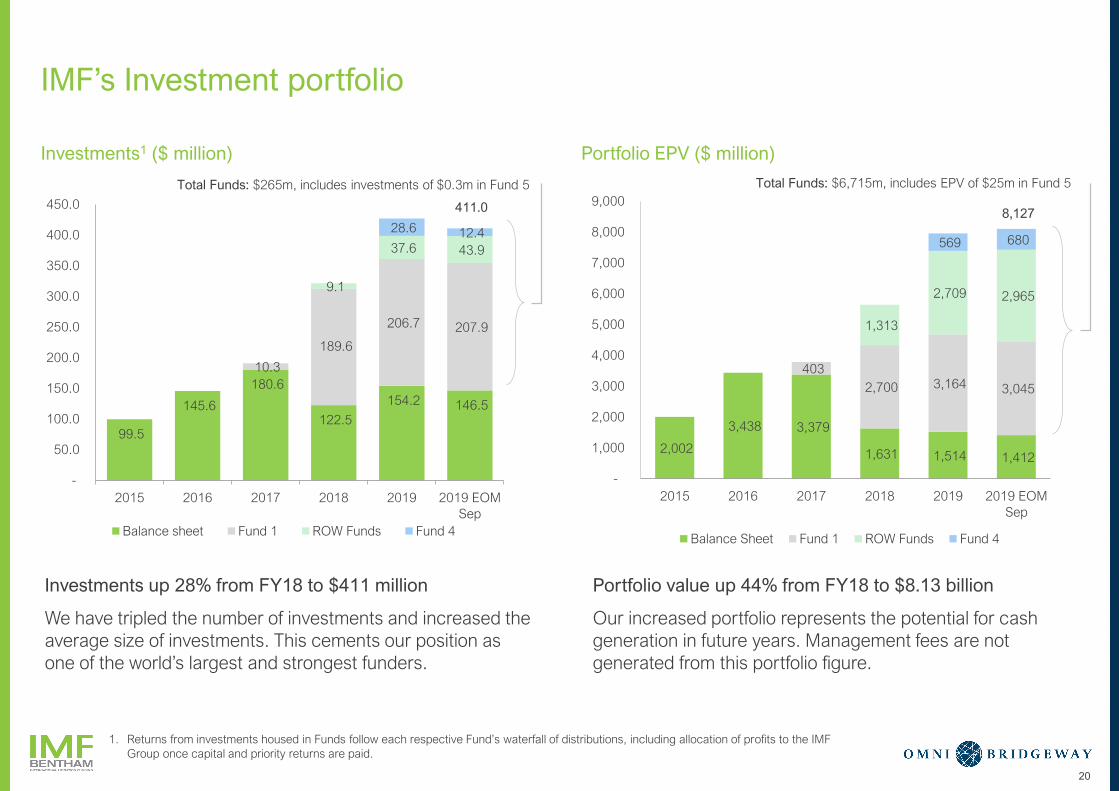
Investments up 28% from FY18 to $411 million
We have tripled the number of investments and increased the
average size of investments. This cements our position as
one of the world’s largest and strongest funders.
Portfolio value up 44% from FY18 to $8.13 billion
Our increased portfolio represents the potential for cash
generation in future years. Management fees are not
generated from this portfolio figure.
20
IMF’s Investment portfolio
1. Returns from investments housed in Funds follow each respective Fund’s waterfall of distributions, including allocation of profits to the IMF
Group once capital and priority returns are paid.
Total Funds: $265m, includes investments of $0.3m in Fund 5 Total Funds: $6,715m, includes EPV of $25m in Fund 5
Investments1 ($ million) Portfolio EPV ($ million)
99.5
145.6
180.6
122.5
154.2 146.5
10.3
189.6
206.7 207.9
9.1
37.6 43.9
28.6 12.4
411.0
-
50.0
100.0
150.0
200.0
250.0
300.0
350.0
400.0
450.0
2015 2016 2017 2018 2019 2019 EOM
Sep
Balance sheet Fund 1 ROW Funds Fund 4
2,002
3,438 3,379
1,631 1,514 1,412
403
2,700 3,164 3,045
1,313
2,709 2,965
569 680
-
1,000
2,000
3,000
4,000
5,000
6,000
7,000
8,000
9,000
2015 2016 2017 2018 2019 2019 EOM
Sep
Balance Sheet Fund 1 ROW Funds Fund 4
8,127
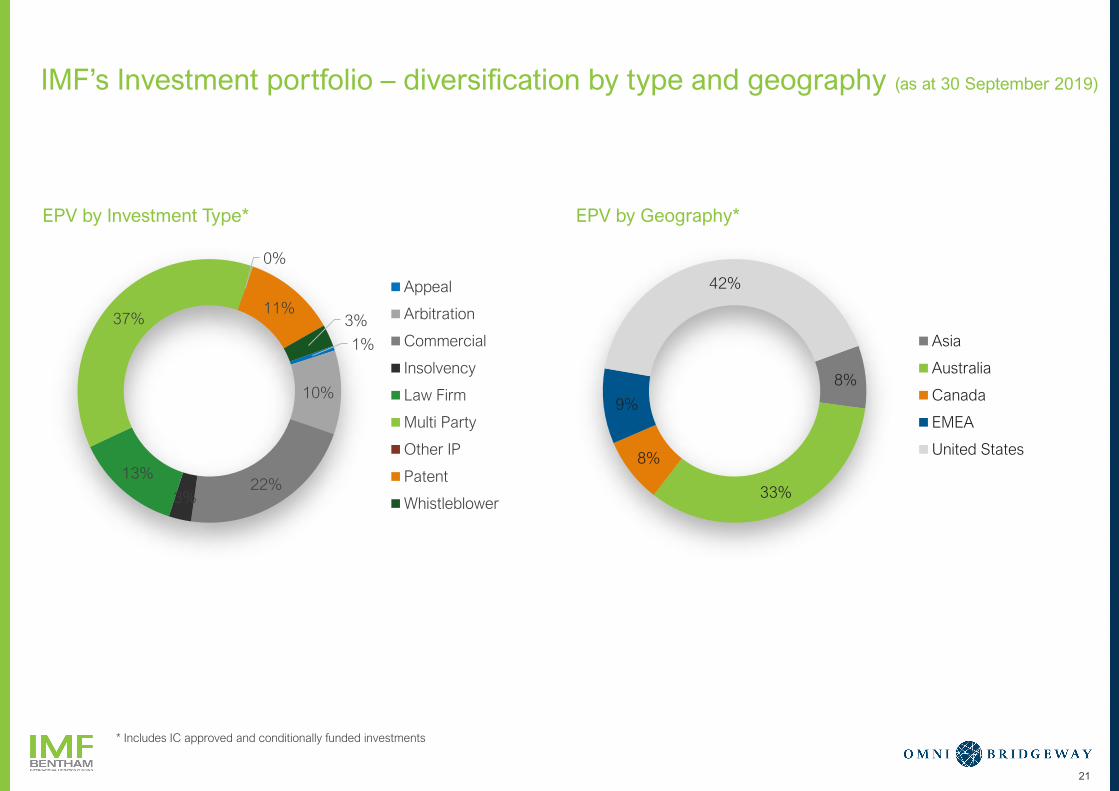
IMF’s Investment portfolio – diversification by type and geography (as at 30 September 2019)
21
1%
10%
22%3%
13%
37%
0%
11%3%
Appeal
Arbitration
Commercial
Insolvency
Law Firm
Multi Party
Other IP
Patent
Whistleblower
8%
33%
8%
9%
42%
Asia
Australia
Canada
EMEA
United States
EPV by Geography*EPV by Investment Type*
* Includes IC approved and conditionally funded investments
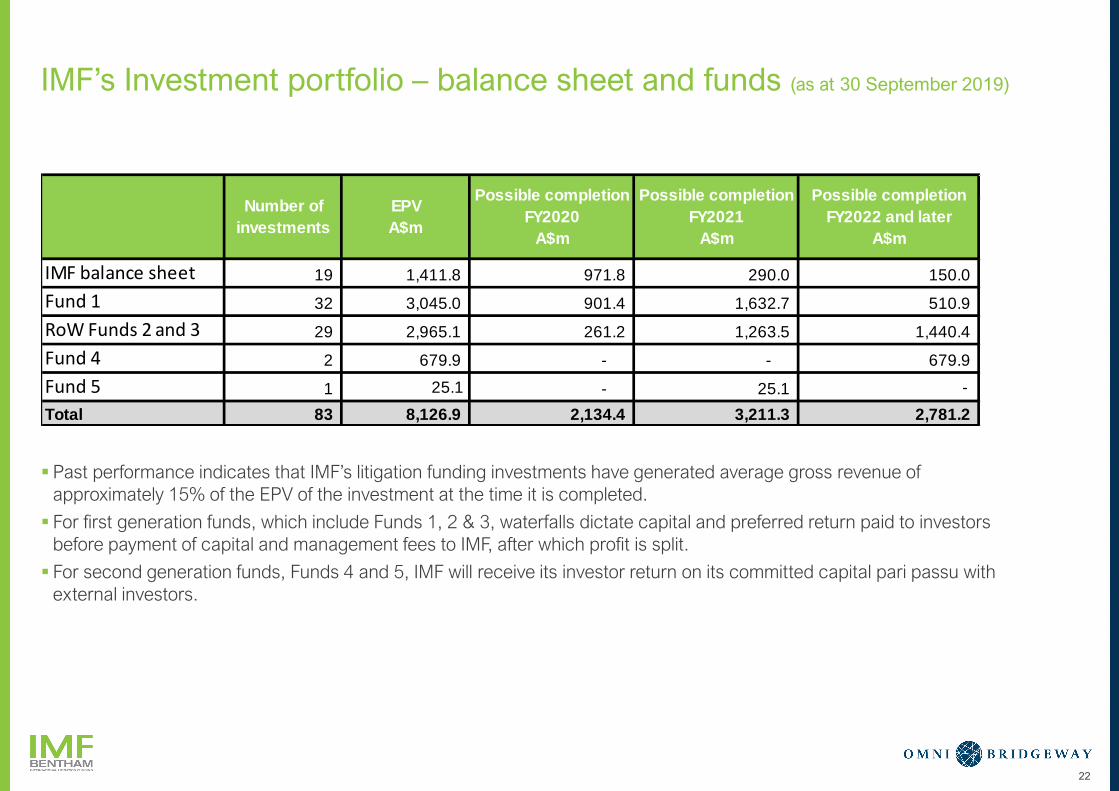
IMF’s Investment portfolio – balance sheet and funds (as at 30 September 2019)
▪ Past performance indicates that IMF’s litigation funding investments have generated average gross revenue of
approximately 15% of the EPV of the investment at the time it is completed.
▪ For first generation funds, which include Funds 1, 2 & 3, waterfalls dictate capital and preferred return paid to investors
before payment of capital and management fees to IMF, after which profit is split.
▪ For second generation funds, Funds 4 and 5, IMF will receive its investor return on its committed capital pari passu with
external investors.
22
IMF balance sheet 19 1,411.8 971.8 290.0 150.0
Fund 1 32 3,045.0 901.4 1,632.7 510.9
RoW Funds 2 and 3 29 2,965.1 261.2 1,263.5 1,440.4
Fund 4 2 679.9 - - 679.9
Fund 5 1 25.1 - 25.1 -
Total 83 8,126.9 2,134.4 3,211.3 2,781.2
Number of
investments
Possible completion
FY2020
A$m
Possible completion
FY2021
A$m
Possible completion
FY2022 and later
A$m
EPV
A$m

23
Non-correlated performance
Performance in a recession
▪ Litigation funding one of few asset classes
globally with returns independent of financial
markets and/or economic cycle
▪ Last global recession produced investment
opportunities
23
*FY19 ROIC includes disclosed binding conditional settlements and in principle agreed settlements which are awaiting court approval
Source: IMF’s Annual Financial Statements
IMF’s Realized ROIC by year of completion
Fund management model sensitive
to economic cycles?
▪ Capital for funds able to be raised during
recessionary periods
▪ Alternative assets with no correlation to markets
present an opportunity for fund flows
▪ IMF launched Fund 4 (2018) and Fund 5 (2019):
US$1 billion capital to deploy over the next 4 years
Limited debt
▪ At 30 June 2019, IMF had almost
zero net debt, with A$132 million
in cash (at the corporate level ex
capital in funds) and Debt of
A$148 million
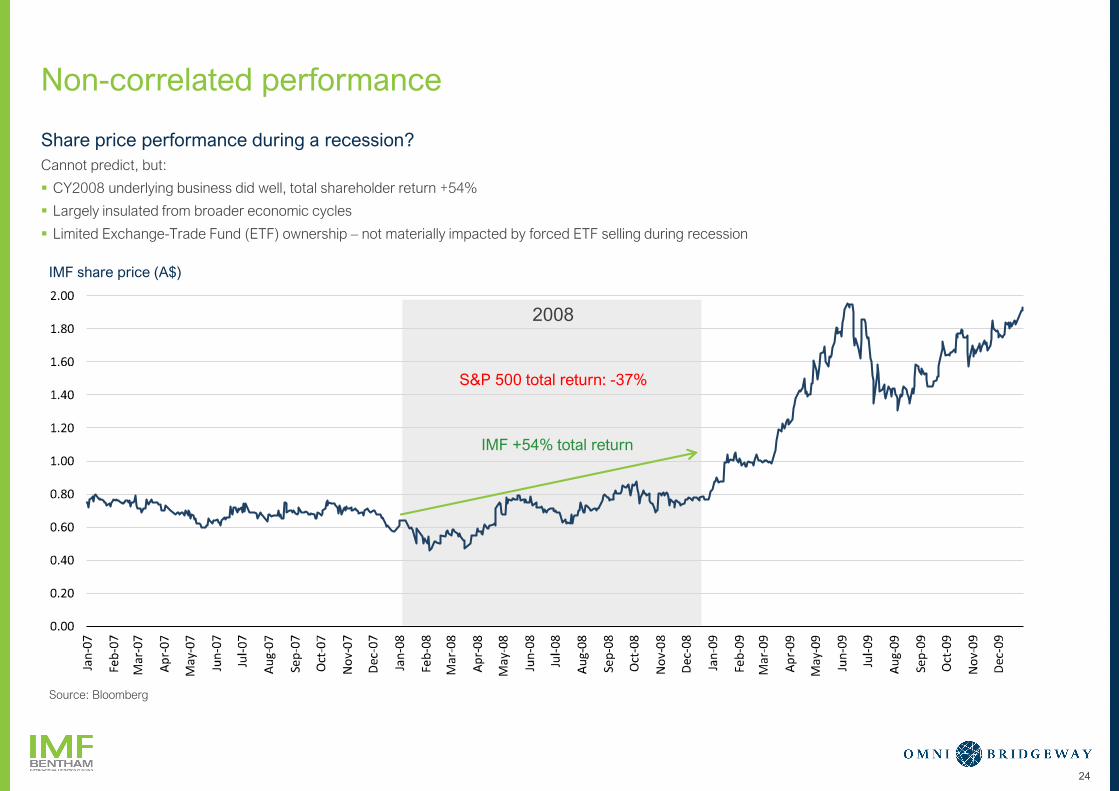
Non-correlated performance
Share price performance during a recession?
Cannot predict, but:
▪ CY2008 underlying business did well, total shareholder return +54%
▪ Largely insulated from broader economic cycles
▪ Limited Exchange-Trade Fund (ETF) ownership – not materially impacted by forced ETF selling during recession
24
Source: Bloomberg
IMF share price (A$)
S&P 500 total return: -37%
IMF +54% total return
2008
1 2 3 4 5 6
LEGAL FINANCIAL
SOLUTIONS
IMF BENTHAM OMNI BRIDGEWAY OUR COMBINED
BUSINESS
CURRENT YEAR
DEVELOPMENTS
Q&A
25
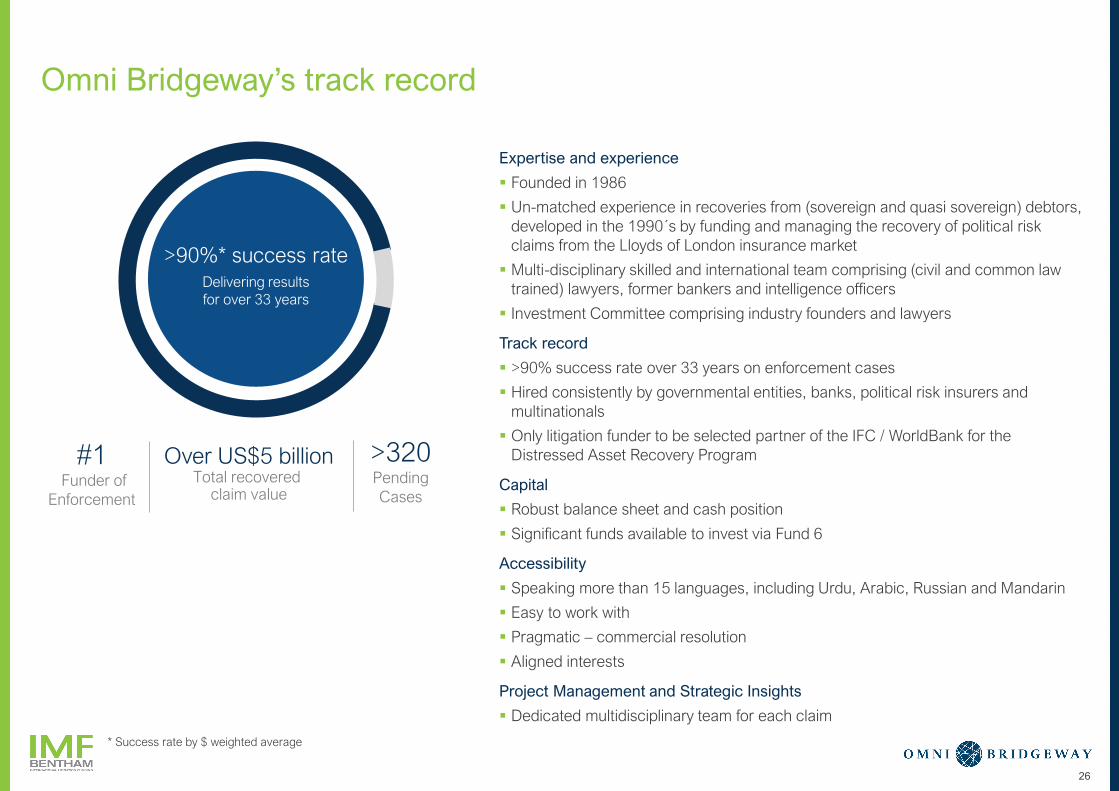
Omni Bridgeway’s track record
Expertise and experience
▪ Founded in 1986
▪ Un-matched experience in recoveries from (sovereign and quasi sovereign) debtors,
developed in the 1990´s by funding and managing the recovery of political risk
claims from the Lloyds of London insurance market
▪ Multi-disciplinary skilled and international team comprising (civil and common law
trained) lawyers, former bankers and intelligence officers
▪ Investment Committee comprising industry founders and lawyers
Track record
▪ >90% success rate over 33 years on enforcement cases
▪ Hired consistently by governmental entities, banks, political risk insurers and
multinationals
▪ Only litigation funder to be selected partner of the IFC / WorldBank for the
Distressed Asset Recovery Program
Capital
▪ Robust balance sheet and cash position
▪ Significant funds available to invest via Fund 6
Accessibility
▪ Speaking more than 15 languages, including Urdu, Arabic, Russian and Mandarin
▪ Easy to work with
▪ Pragmatic – commercial resolution
▪ Aligned interests
Project Management and Strategic Insights
▪ Dedicated multidisciplinary team for each claim
Over US$5 billionTotal recovered
claim value
>90%* success rateDelivering results
for over 33 years
>320 Pending
Cases
#1 Funder of
Enforcement
26
* Success rate by $ weighted average
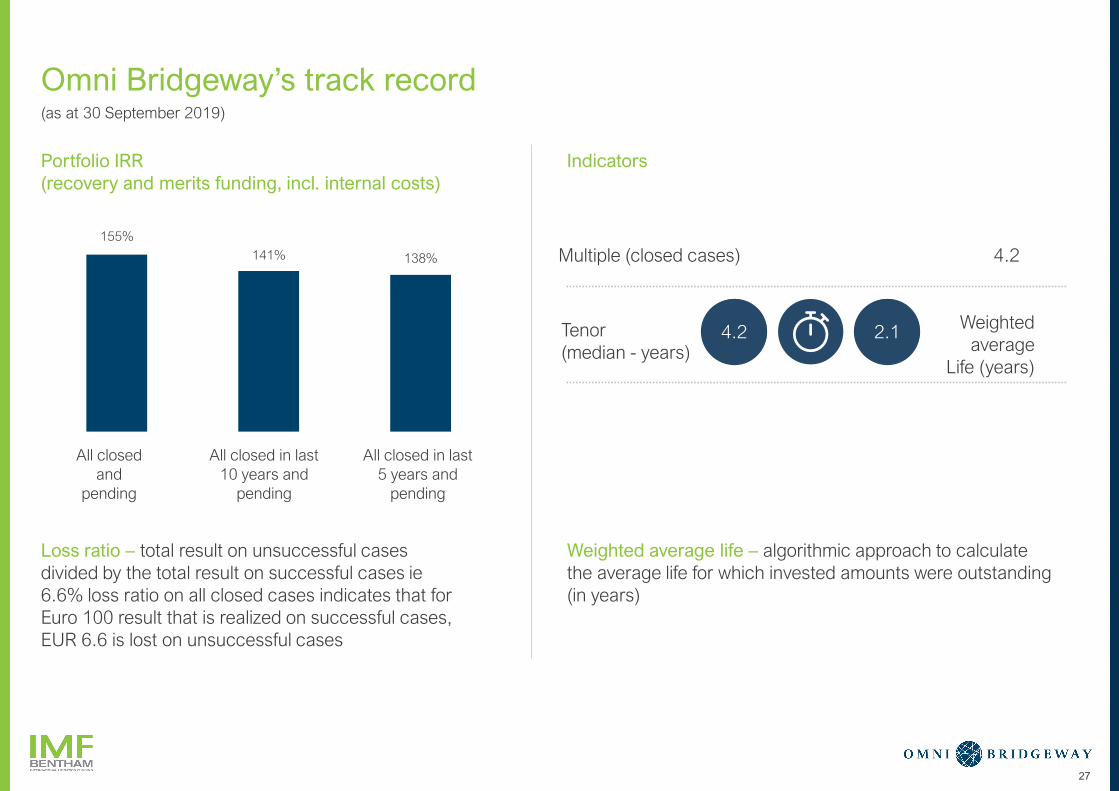
Loss ratio – total result on unsuccessful cases
divided by the total result on successful cases ie
6.6% loss ratio on all closed cases indicates that for
Euro 100 result that is realized on successful cases,
EUR 6.6 is lost on unsuccessful cases
Weighted average life – algorithmic approach to calculate
the average life for which invested amounts were outstanding
(in years)
27
Omni Bridgeway’s track record
Portfolio IRR
(recovery and merits funding, incl. internal costs)
Indicators
(as at 30 September 2019)
155%
141% 138% 4.2Multiple (closed cases)
Tenor
(median - years)
Weighted
average
Life (years)
4.2 2.1
All closed
and
pending
All closed in last
10 years and
pending
All closed in last
5 years and
pending
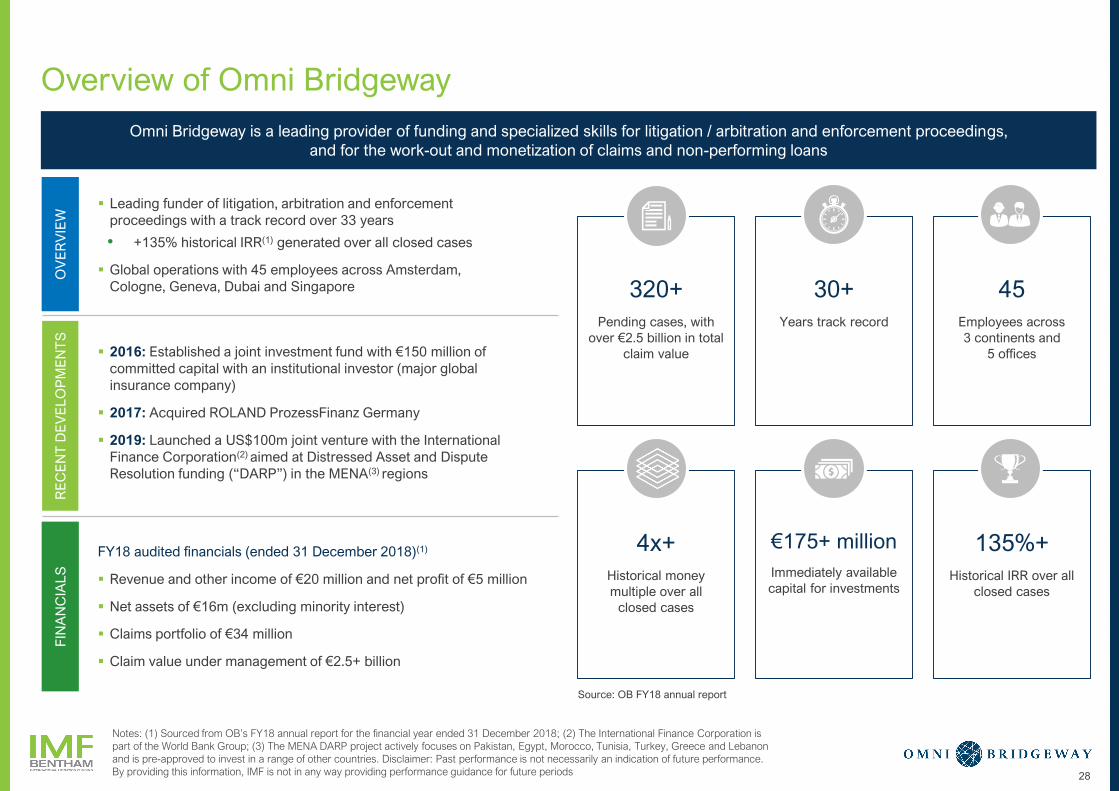
Overview of Omni Bridgeway
28
▪ 2016: Established a joint investment fund with €150 million of
committed capital with an institutional investor (major global
insurance company)
▪ 2017: Acquired ROLAND ProzessFinanz Germany
▪ 2019: Launched a US$100m joint venture with the International
Finance Corporation(2) aimed at Distressed Asset and Dispute
Resolution funding (“DARP”) in the MENA(3) regions
▪ Leading funder of litigation, arbitration and enforcement
proceedings with a track record over 33 years
• +135% historical IRR(1) generated over all closed cases
▪ Global operations with 45 employees across Amsterdam,
Cologne, Geneva, Dubai and Singapore
FY18 audited financials (ended 31 December 2018)(1)
▪ Revenue and other income of €20 million and net profit of €5 million
▪ Net assets of €16m (excluding minority interest)
▪ Claims portfolio of €34 million
▪ Claim value under management of €2.5+ billion
Omni Bridgeway is a leading provider of funding and specialized skills for litigation / arbitration and enforcement proceedings,
and for the work-out and monetization of claims and non-performing loans
OV
ER
VIE
WR
EC
EN
T D
EV
EL
OP
ME
NT
SF
INA
NC
IAL
S
Notes: (1) Sourced from OB’s FY18 annual report for the financial year ended 31 December 2018; (2) The International Finance Corporation is
part of the World Bank Group; (3) The MENA DARP project actively focuses on Pakistan, Egypt, Morocco, Tunisia, Turkey, Greece and Lebanon
and is pre-approved to invest in a range of other countries. Disclaimer: Past performance is not necessarily an indication of future performance.
By providing this information, IMF is not in any way providing performance guidance for future periods
320+
Pending cases, with
over €2.5 billion in total
claim value
30+
Years track record
45
Employees across
3 continents and
5 offices
4x+
Historical money
multiple over all
closed cases
€175+ million
Immediately available
capital for investments
135%+
Historical IRR over all
closed cases
Source: OB FY18 annual report
29
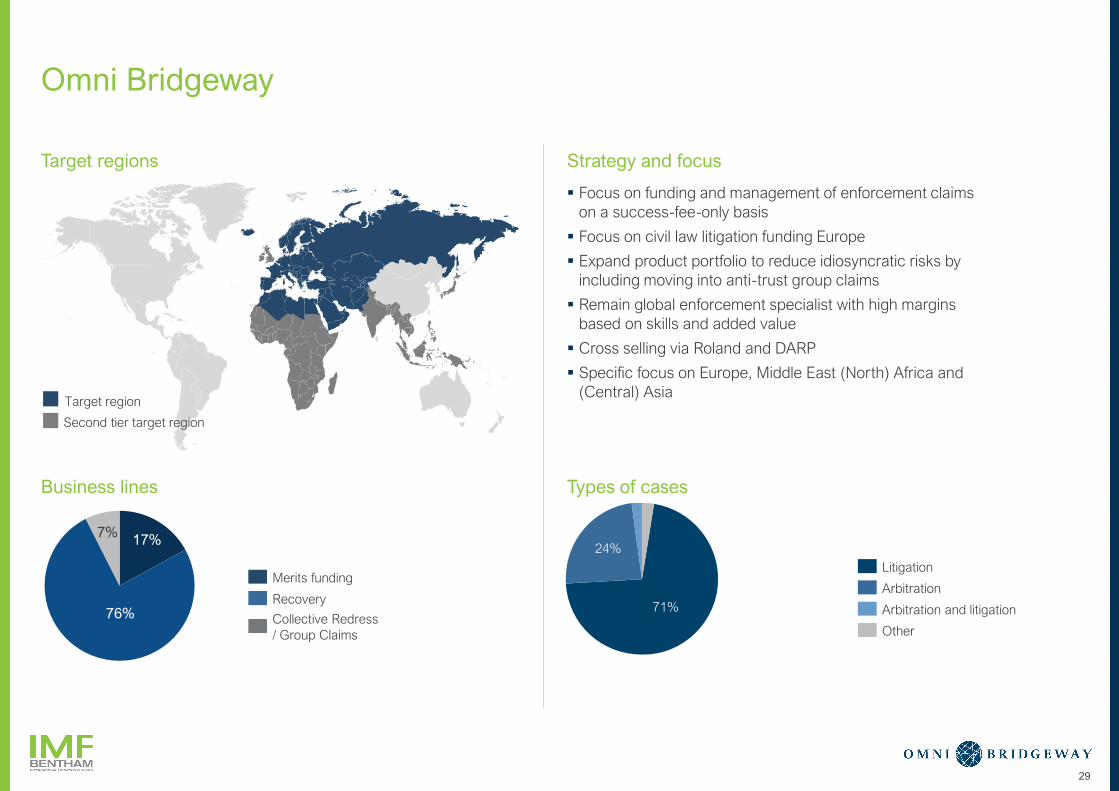
Omni Bridgeway
▪ Focus on funding and management of enforcement claims
on a success-fee-only basis
▪ Focus on civil law litigation funding Europe
▪ Expand product portfolio to reduce idiosyncratic risks by
including moving into anti-trust group claims
▪ Remain global enforcement specialist with high margins
based on skills and added value
▪ Cross selling via Roland and DARP
▪ Specific focus on Europe, Middle East (North) Africa and
(Central) Asia
Target regions Strategy and focus
Business lines Types of cases
Target region
Second tier target region
Merits funding
Collective Redress
/ Group Claims
Recovery
Other
Arbitration and litigation
Arbitration
Litigation
71%
24%17%
76%
7%
30
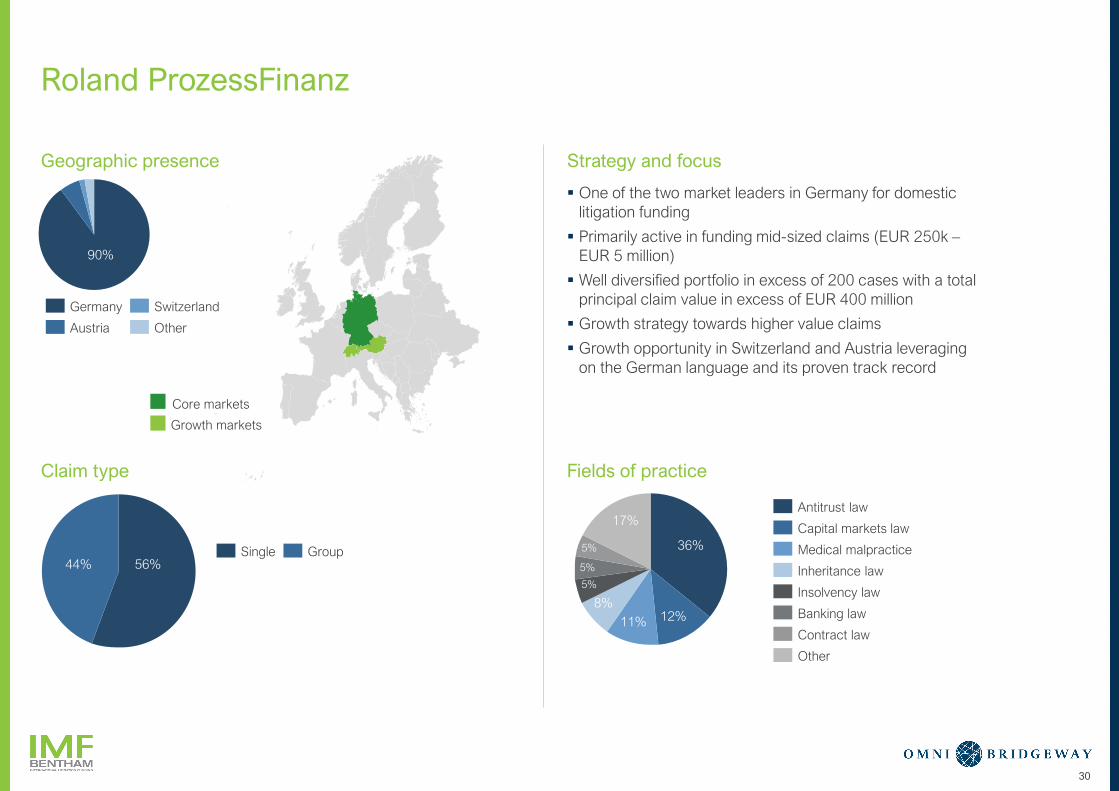
Roland ProzessFinanz
▪ One of the two market leaders in Germany for domestic
litigation funding
▪ Primarily active in funding mid-sized claims (EUR 250k –
EUR 5 million)
▪ Well diversified portfolio in excess of 200 cases with a total
principal claim value in excess of EUR 400 million
▪ Growth strategy towards higher value claims
▪ Growth opportunity in Switzerland and Austria leveraging
on the German language and its proven track record
Geographic presence Strategy and focus
Claim type Fields of practice
Core markets
Growth markets
Germany
Austria Other
Switzerland
Banking law
Contract law
Insolvency law
Antitrust law
Capital markets law
Inheritance law
Medical malpractice
Other
Single Group44% 56%
36%
12%11%
8%
17%
5%
5%
5%
90%
31
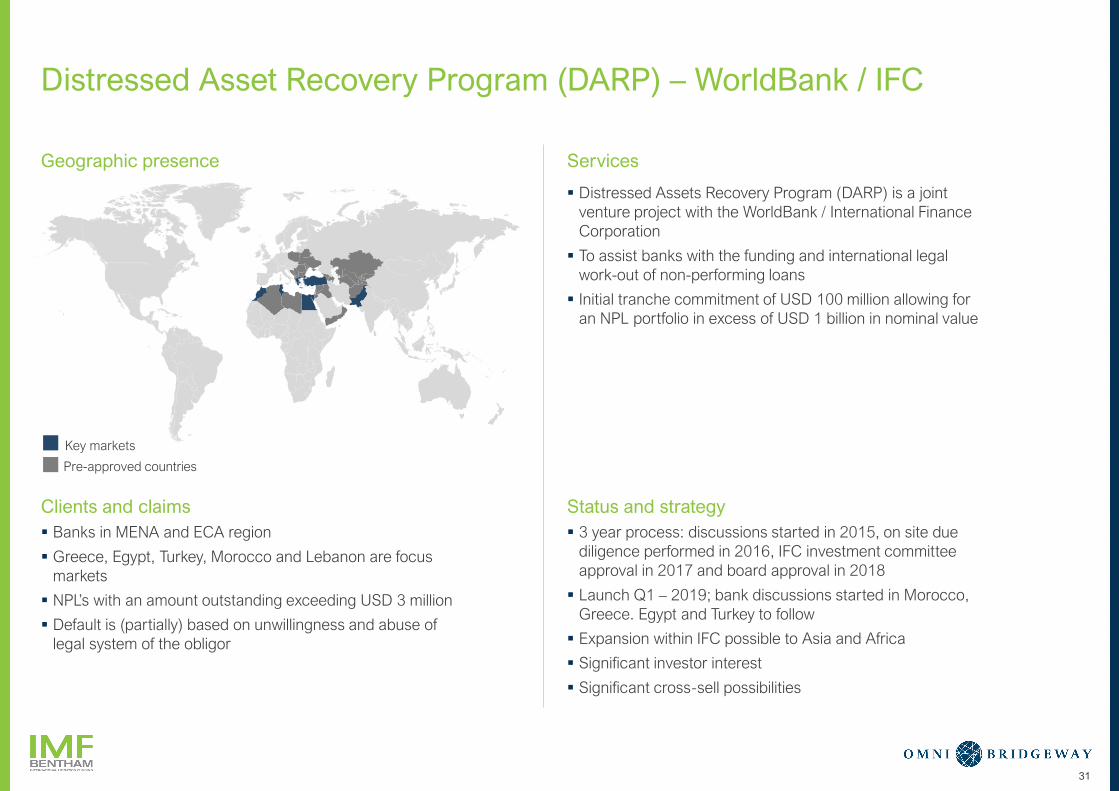
Distressed Asset Recovery Program (DARP) – WorldBank / IFC
▪ Distressed Assets Recovery Program (DARP) is a joint
venture project with the WorldBank / International Finance
Corporation
▪ To assist banks with the funding and international legal
work-out of non-performing loans
▪ Initial tranche commitment of USD 100 million allowing for
an NPL portfolio in excess of USD 1 billion in nominal value
Geographic presence Services
Clients and claims Status and strategy
▪ 3 year process: discussions started in 2015, on site due
diligence performed in 2016, IFC investment committee
approval in 2017 and board approval in 2018
▪ Launch Q1 – 2019; bank discussions started in Morocco,
Greece. Egypt and Turkey to follow
▪ Expansion within IFC possible to Asia and Africa
▪ Significant investor interest
▪ Significant cross-sell possibilities
▪ Banks in MENA and ECA region
▪ Greece, Egypt, Turkey, Morocco and Lebanon are focus
markets
▪ NPL’s with an amount outstanding exceeding USD 3 million
▪ Default is (partially) based on unwillingness and abuse of
legal system of the obligor
Key markets
Pre-approved countries

1 2 3 4 5 6
LEGAL FINANCIAL
SOLUTIONS
IMF BENTHAM OMNI BRIDGEWAY OUR COMBINED
BUSINESS
CURRENT YEAR
DEVELOPMENTS
Q&A
32
Global leader in dispute resolution finance, financing
disputes from inception through trial, appeal,
enforcement and recovery
▪ Funding and management of disputes, and
international enforcement of judgments and awards
(against sovereigns on all continents)
▪ Enforcement of non-performing loans of banks and
subrogation claims of insurance companies
▪Market leading After the Event cost protection cover in
relevant jurisdictions
Combined team of legal and recovery experts
▪Seasoned litigators, enforcement lawyers,
economists, financial experts, business
intelligence and asset-tracing professionals
▪ Experience funding commercial, antitrust,
intellectual property, arbitration, whistleblower,
bankruptcy, securities and multi-party claims
33
The combined IMF/Omni Bridgeway Group
Unrivalled 33-year track record of funded and recovered claims throughout the world
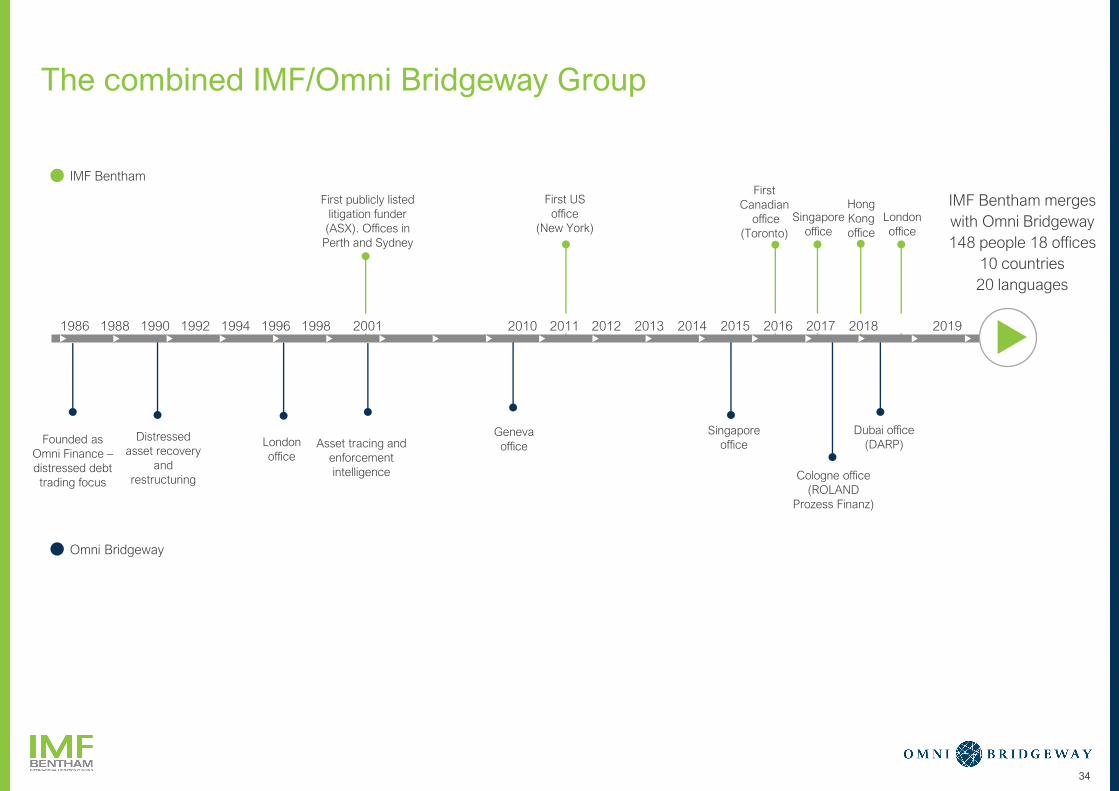
The combined IMF/Omni Bridgeway Group
34
First publicly listed
litigation funder
(ASX). Offices in
Perth and Sydney
First US
office
(New York)London
office
First
Canadian
office
(Toronto)
Singapore
office
Hong
Kong
office
Founded as
Omni Finance –
distressed debt
trading focus
Distressed
asset recovery
and
restructuring
London
office
Geneva
office Asset tracing and
enforcement
intelligence
Dubai office
(DARP)
Singapore
office
Cologne office
(ROLAND
Prozess Finanz)
IMF Bentham merges
with Omni Bridgeway
148 people 18 offices
10 countries
20 languages
1986 201920182014201220112001 20101990 1996 2015 2016 201720131992 1994 19981988
IMF Bentham
Omni Bridgeway
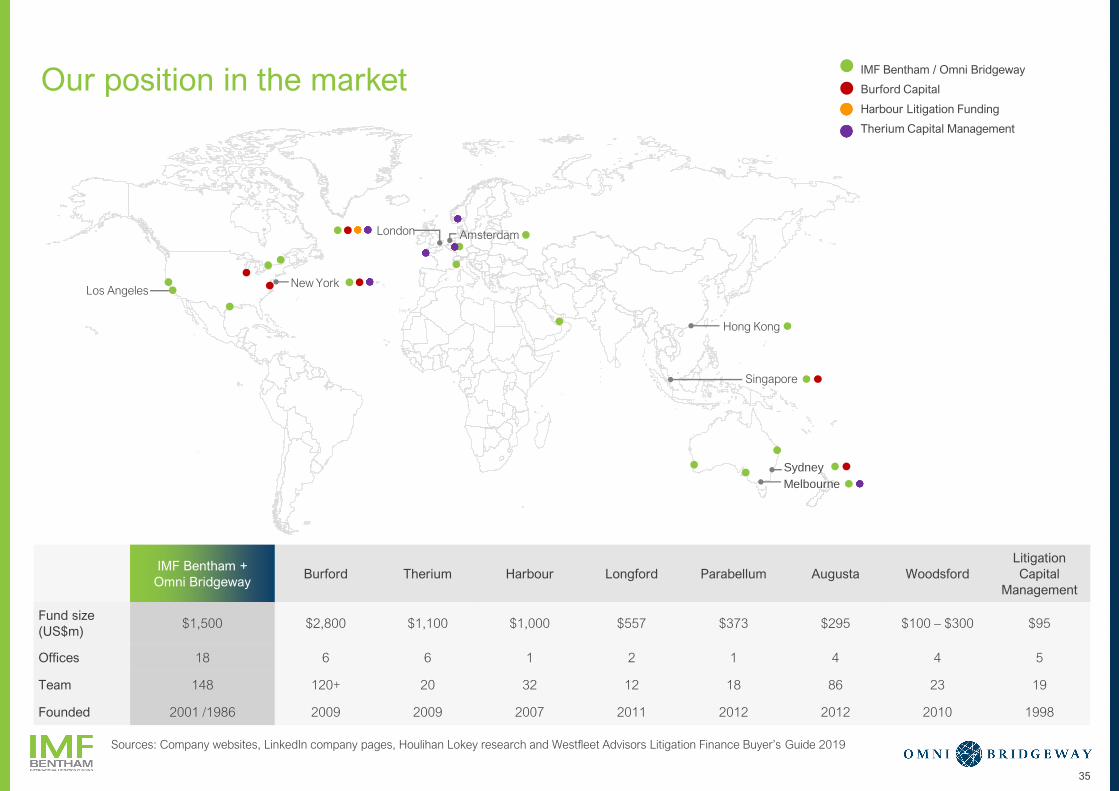
Our position in the market
35
IMF Bentham +
Omni BridgewayBurford Therium Harbour Longford Parabellum Augusta Woodsford
Litigation
Capital
Management
Fund size
(US$m)$1,500 $2,800 $1,100 $1,000 $557 $373 $295 $100 – $300 $95
Offices 18 6 6 1 2 1 4 4 5
Team 148 120+ 20 32 12 18 86 23 19
Founded 2001 /1986 2009 2009 2007 2011 2012 2012 2010 1998
IMF Bentham / Omni Bridgeway
Burford Capital
Harbour Litigation Funding
Therium Capital Management
New York
Singapore
London Amsterdam
Hong Kong
Los Angeles
Sydney
Melbourne
Sources: Company websites, LinkedIn company pages, Houlihan Lokey research and Westfleet Advisors Litigation Finance Buyer’s Guide 2019
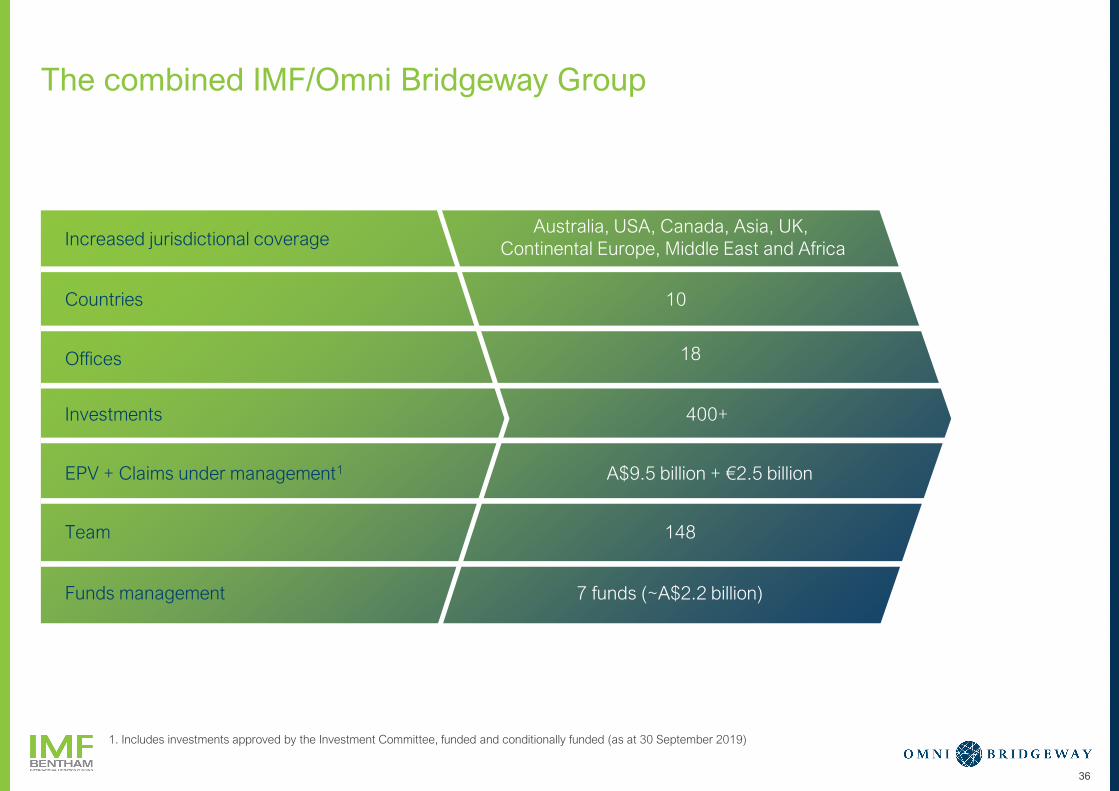
The combined IMF/Omni Bridgeway Group
1. Includes investments approved by the Investment Committee, funded and conditionally funded (as at 30 September 2019)
Increased jurisdictional coverageAustralia, USA, Canada, Asia, UK,
Continental Europe, Middle East and Africa
Investments 400+
EPV + Claims under management1 A$9.5 billion + €2.5 billion
Team 148
Funds management 7 funds (~A$2.2 billion)
Countries 10
Offices 18
36
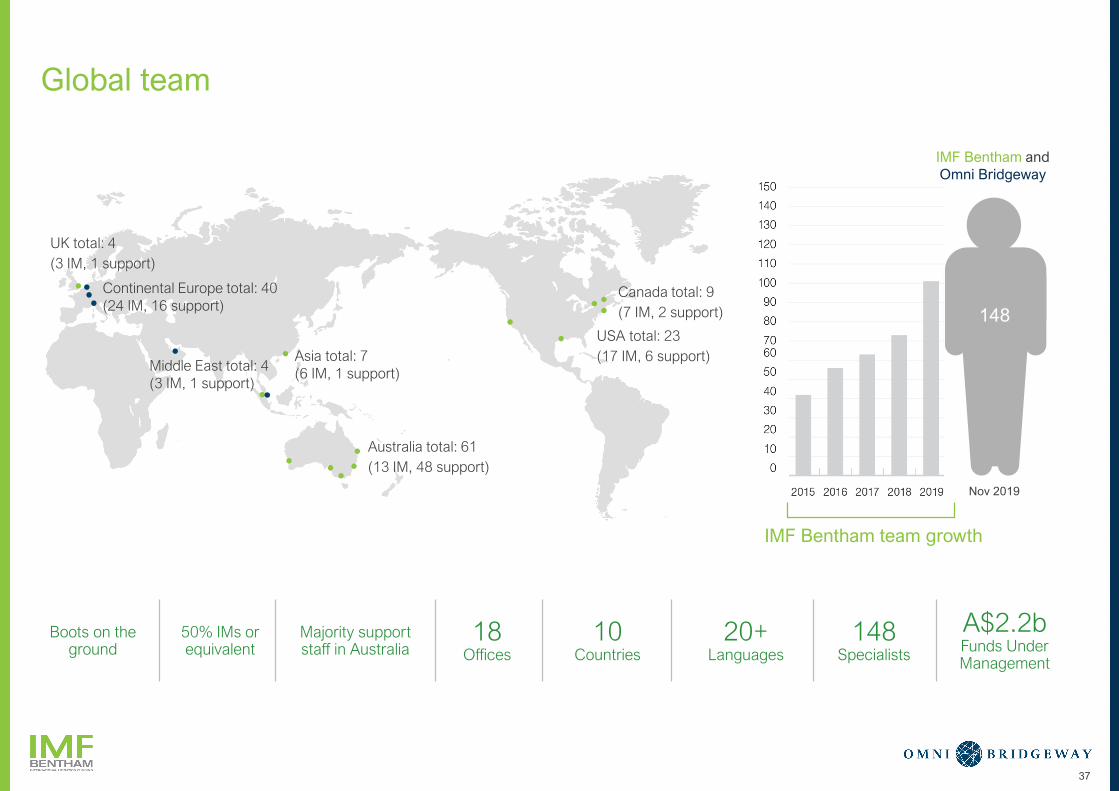
Global team
37
Australia total: 61
(13 IM, 48 support)
USA total: 23
(17 IM, 6 support)Asia total: 7
(6 IM, 1 support)
Canada total: 9
(7 IM, 2 support)
UK total: 4
(3 IM, 1 support)
Boots on the ground
50% IMs or equivalent
Majority support staff in Australia
IMF Bentham team growth
Middle East total: 4
(3 IM, 1 support)
Continental Europe total: 40
(24 IM, 16 support)
18Offices
10Countries
20+Languages
148Specialists
A$2.2bFunds Under Management
IMF Bentham and
Omni Bridgeway
Nov 2019
148
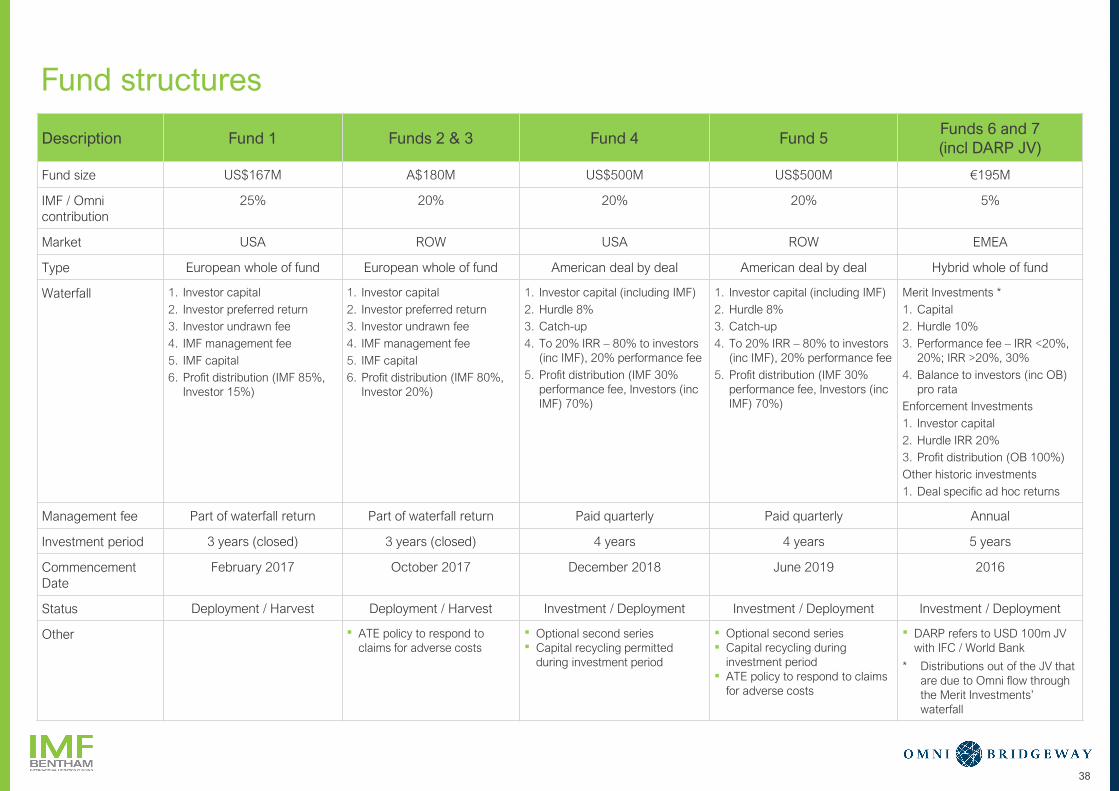
Fund structures
38
Description Fund 1 Funds 2 & 3 Fund 4 Fund 5Funds 6 and 7
(incl DARP JV)
Fund size US$167M A$180M US$500M US$500M €195M
IMF / Omni
contribution
25% 20% 20% 20% 5%
Market USA ROW USA ROW EMEA
Type European whole of fund European whole of fund American deal by deal American deal by deal Hybrid whole of fund
Waterfall 1. Investor capital
2. Investor preferred return
3. Investor undrawn fee
4. IMF management fee
5. IMF capital
6. Profit distribution (IMF 85%,
Investor 15%)
1. Investor capital
2. Investor preferred return
3. Investor undrawn fee
4. IMF management fee
5. IMF capital
6. Profit distribution (IMF 80%,
Investor 20%)
1. Investor capital (including IMF)
2. Hurdle 8%
3. Catch-up
4. To 20% IRR – 80% to investors
(inc IMF), 20% performance fee
5. Profit distribution (IMF 30%
performance fee, Investors (inc
IMF) 70%)
1. Investor capital (including IMF)
2. Hurdle 8%
3. Catch-up
4. To 20% IRR – 80% to investors
(inc IMF), 20% performance fee
5. Profit distribution (IMF 30%
performance fee, Investors (inc
IMF) 70%)
Merit Investments *
1. Capital
2. Hurdle 10%
3. Performance fee – IRR <20%,
20%; IRR >20%, 30%
4. Balance to investors (inc OB)
pro rata
Enforcement Investments
1. Investor capital
2. Hurdle IRR 20%
3. Profit distribution (OB 100%)
Other historic investments
1. Deal specific ad hoc returns
Management fee Part of waterfall return Part of waterfall return Paid quarterly Paid quarterly Annual
Investment period 3 years (closed) 3 years (closed) 4 years 4 years 5 years
Commencement
Date
February 2017 October 2017 December 2018 June 2019 2016
Status Deployment / Harvest Deployment / Harvest Investment / Deployment Investment / Deployment Investment / Deployment
Other ▪ ATE policy to respond to
claims for adverse costs
▪ Optional second series▪ Capital recycling permitted
during investment period
▪ Optional second series▪ Capital recycling during
investment period▪ ATE policy to respond to claims
for adverse costs
▪ DARP refers to USD 100m JV
with IFC / World Bank
* Distributions out of the JV that
are due to Omni flow through
the Merit Investments’
waterfall
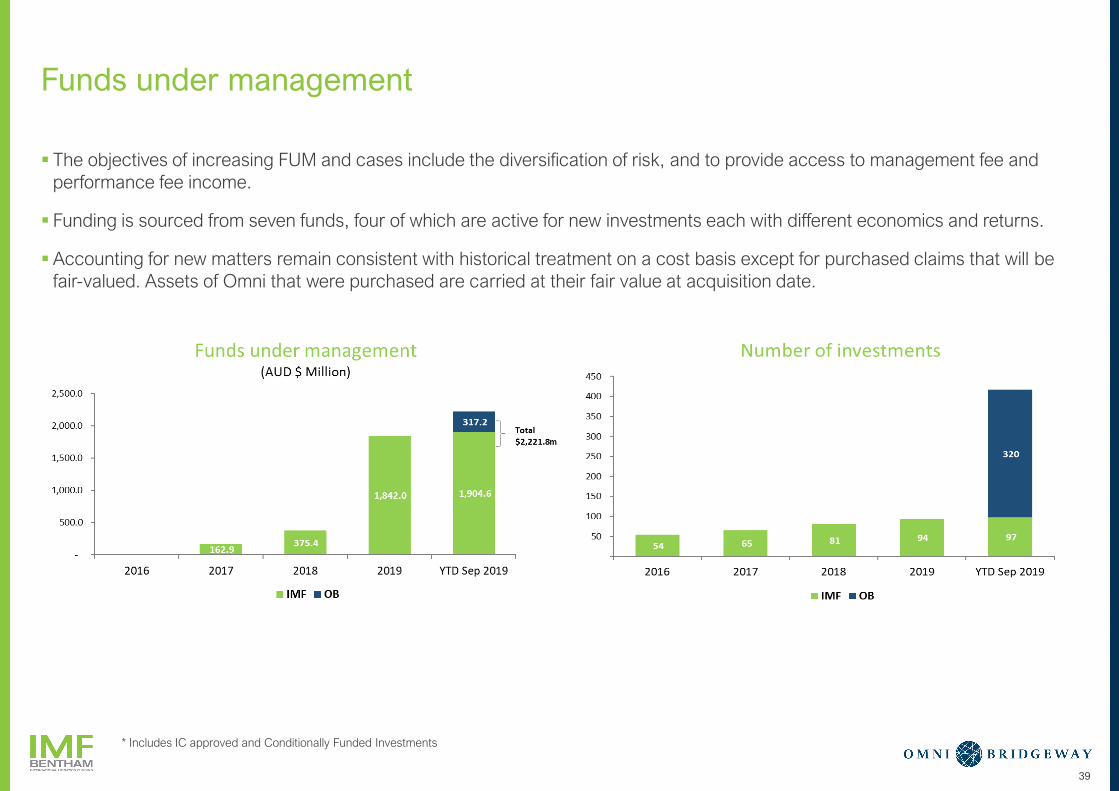
Funds under management
▪ The objectives of increasing FUM and cases include the diversification of risk, and to provide access to management fee and
performance fee income.
▪ Funding is sourced from seven funds, four of which are active for new investments each with different economics and returns.
▪Accounting for new matters remain consistent with historical treatment on a cost basis except for purchased claims that will be
fair-valued. Assets of Omni that were purchased are carried at their fair value at acquisition date.
39
* Includes IC approved and Conditionally Funded Investments
1 2 3 6
LEGAL FINANCIAL
SOLUTIONS
IMF BENTHAM OMNI BRIDGEWAY Q&A
40
5
CURRENT YEAR
DEVELOPMENTS
4
OUR COMBINED
BUSINESS
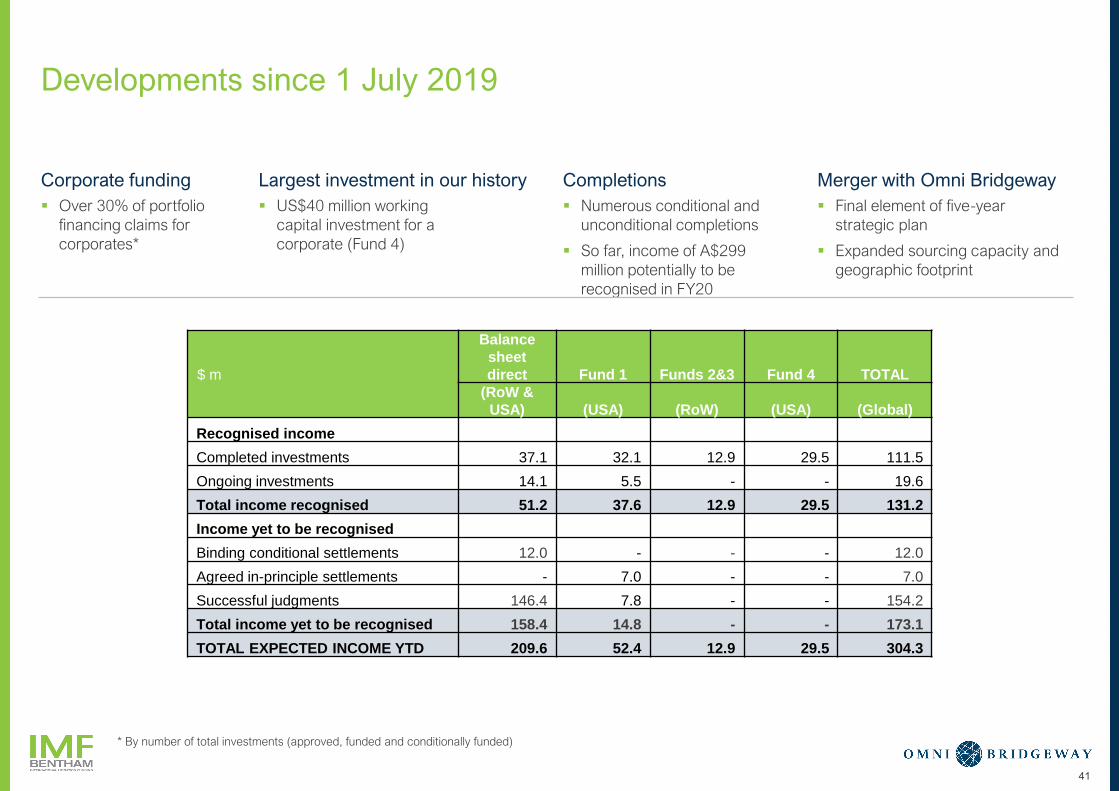
Developments since 1 July 2019
41
▪ Over 30% of portfolio
financing claims for
corporates*
Corporate funding
▪ US$40 million working
capital investment for a
corporate (Fund 4)
Largest investment in our history
▪ Numerous conditional and
unconditional completions
▪ So far, income of A$299
million potentially to be
recognised in FY20
Completions
▪ Final element of five-year
strategic plan
▪ Expanded sourcing capacity and
geographic footprint
Merger with Omni Bridgeway
* By number of total investments (approved, funded and conditionally funded)
$ m
Balance
sheet
direct Fund 1 Funds 2&3 Fund 4 TOTAL
(RoW &
USA) (USA) (RoW) (USA) (Global)
Recognised income
Completed investments 37.1 32.1 12.9 29.5 111.5
Ongoing investments 14.1 5.5 - - 19.6
Total income recognised 51.2 37.6 12.9 29.5 131.2
Income yet to be recognised
Binding conditional settlements 12.0 - - - 12.0
Agreed in-principle settlements - 7.0 - - 7.0
Successful judgments 146.4 7.8 - - 154.2
Total income yet to be recognised 158.4 14.8 - - 173.1
TOTAL EXPECTED INCOME YTD 209.6 52.4 12.9 29.5 304.3
Restructure of OTC Debt
▪ IMF has completed the process of restructuring of its OTC Debt. The original
maturity date for the OTC debt was 30 June 2020 and priced at 7.4%.
▪We completed a consent process to enable an early redemption of the OTC Debt
which was supported by 83% of noteholders.
▪We completed the restructuring of the OTC Debt on 20 December 2019.
Approximately 50% of previous holders exchanged into a new OTC note with the
balance of holders being cash redeemed and those cash redemptions being
funded by the issue of new OTC notes.
▪The new notes will mature in January 2026 and align the covenants to the IMF
listed bonds, including increasing the secured debt ceiling to $300 million. The
new notes are priced at 5.65%.
42
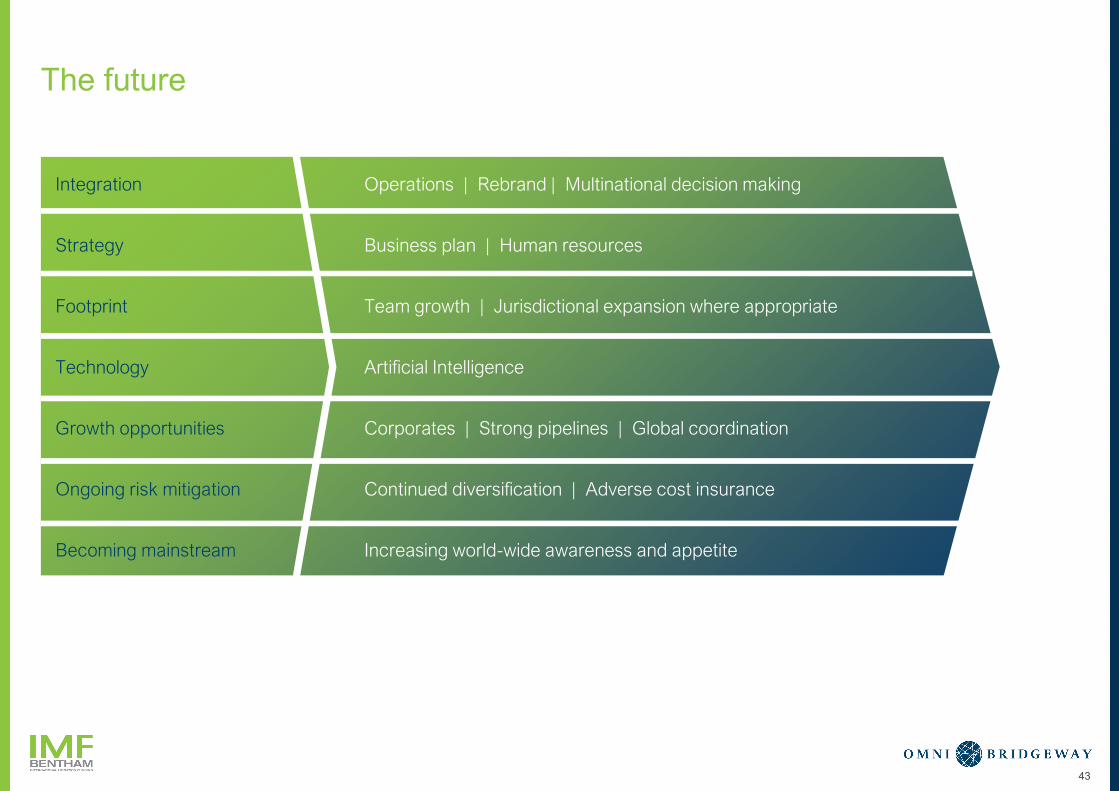
The future
Integration Operations | Rebrand | Multinational decision making
Strategy Business plan | Human resources
Footprint Team growth | Jurisdictional expansion where appropriate
Technology Artificial Intelligence
Growth opportunities Corporates | Strong pipelines | Global coordination
Ongoing risk mitigation Continued diversification | Adverse cost insurance
Becoming mainstream Increasing world-wide awareness and appetite
43
1 2 3 4 5 10
LEGAL FINANCIAL
SOLUTIONS
IMF BENTHAM OMNI BRIDGEWAY OUR COMBINED
BUSINESS
CURRENT YEAR
DEVELOPMENTS
Q&A
44
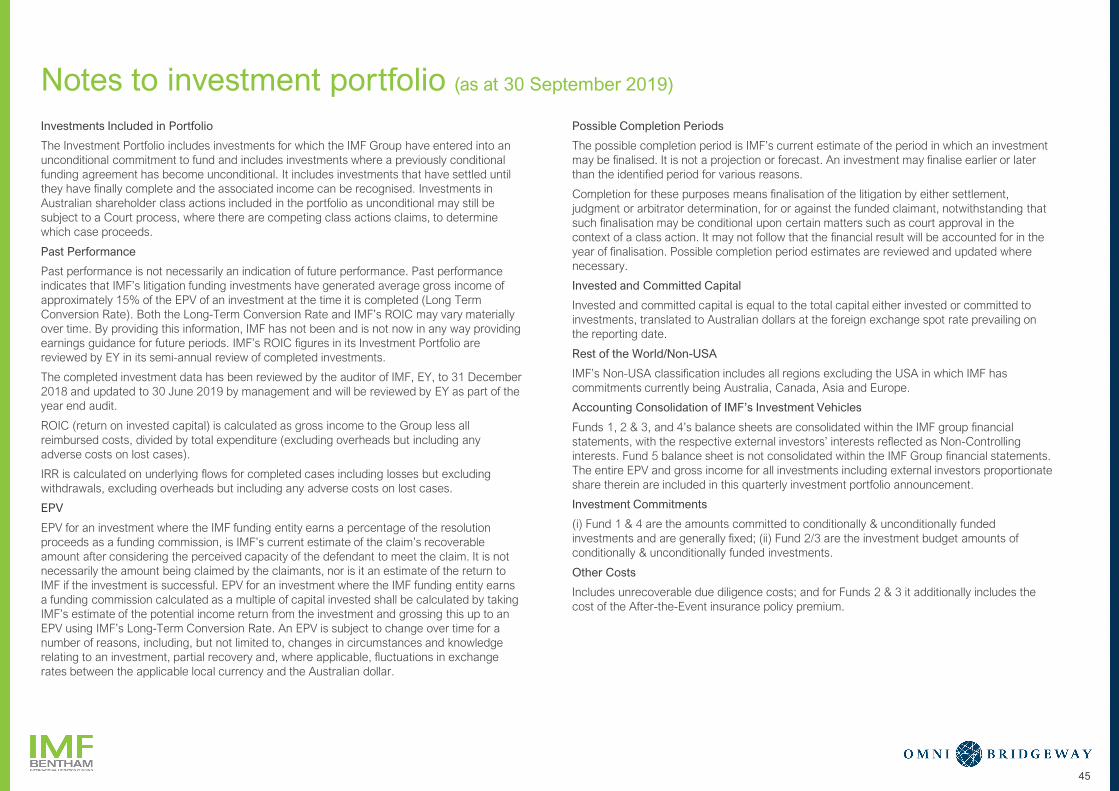
Notes to investment portfolio (as at 30 September 2019)
Investments Included in Portfolio
The Investment Portfolio includes investments for which the IMF Group have entered into an
unconditional commitment to fund and includes investments where a previously conditional
funding agreement has become unconditional. It includes investments that have settled until
they have finally complete and the associated income can be recognised. Investments in
Australian shareholder class actions included in the portfolio as unconditional may still be
subject to a Court process, where there are competing class actions claims, to determine
which case proceeds.
Past Performance
Past performance is not necessarily an indication of future performance. Past performance
indicates that IMF’s litigation funding investments have generated average gross income of
approximately 15% of the EPV of an investment at the time it is completed (Long Term
Conversion Rate). Both the Long-Term Conversion Rate and IMF’s ROIC may vary materially
over time. By providing this information, IMF has not been and is not now in any way providing
earnings guidance for future periods. IMF’s ROIC figures in its Investment Portfolio are
reviewed by EY in its semi-annual review of completed investments.
The completed investment data has been reviewed by the auditor of IMF, EY, to 31 December
2018 and updated to 30 June 2019 by management and will be reviewed by EY as part of the
year end audit.
ROIC (return on invested capital) is calculated as gross income to the Group less all
reimbursed costs, divided by total expenditure (excluding overheads but including any
adverse costs on lost cases).
IRR is calculated on underlying flows for completed cases including losses but excluding
withdrawals, excluding overheads but including any adverse costs on lost cases.
EPV
EPV for an investment where the IMF funding entity earns a percentage of the resolution
proceeds as a funding commission, is IMF’s current estimate of the claim’s recoverable
amount after considering the perceived capacity of the defendant to meet the claim. It is not
necessarily the amount being claimed by the claimants, nor is it an estimate of the return to
IMF if the investment is successful. EPV for an investment where the IMF funding entity earns
a funding commission calculated as a multiple of capital invested shall be calculated by taking
IMF’s estimate of the potential income return from the investment and grossing this up to an
EPV using IMF’s Long-Term Conversion Rate. An EPV is subject to change over time for a
number of reasons, including, but not limited to, changes in circumstances and knowledge
relating to an investment, partial recovery and, where applicable, fluctuations in exchange
rates between the applicable local currency and the Australian dollar.
Possible Completion Periods
The possible completion period is IMF’s current estimate of the period in which an investment
may be finalised. It is not a projection or forecast. An investment may finalise earlier or later
than the identified period for various reasons.
Completion for these purposes means finalisation of the litigation by either settlement,
judgment or arbitrator determination, for or against the funded claimant, notwithstanding that
such finalisation may be conditional upon certain matters such as court approval in the
context of a class action. It may not follow that the financial result will be accounted for in the
year of finalisation. Possible completion period estimates are reviewed and updated where
necessary.
Invested and Committed Capital
Invested and committed capital is equal to the total capital either invested or committed to
investments, translated to Australian dollars at the foreign exchange spot rate prevailing on
the reporting date.
Rest of the World/Non-USA
IMF’s Non-USA classification includes all regions excluding the USA in which IMF has
commitments currently being Australia, Canada, Asia and Europe.
Accounting Consolidation of IMF’s Investment Vehicles
Funds 1, 2 & 3, and 4’s balance sheets are consolidated within the IMF group financial
statements, with the respective external investors’ interests reflected as Non-Controlling
interests. Fund 5 balance sheet is not consolidated within the IMF Group financial statements.
The entire EPV and gross income for all investments including external investors proportionate
share therein are included in this quarterly investment portfolio announcement.
Investment Commitments
(i) Fund 1 & 4 are the amounts committed to conditionally & unconditionally funded
investments and are generally fixed; (ii) Fund 2/3 are the investment budget amounts of
conditionally & unconditionally funded investments.
Other Costs
Includes unrecoverable due diligence costs; and for Funds 2 & 3 it additionally includes the
cost of the After-the-Event insurance policy premium.
45
46
IMF.COM.AU IMF.SG BENTHAMIMF.COM BENTHAMIMF.CA
Disclaimer: The information contained within this document is intended to give a general understanding of how IMF Bentham finances disputes. Actual transactions and deal
terms may vary from any examples given based on the facts and circumstances of specific investments. Nothing in the document constitutes advice.
Sydney
+61 2 8223 3567
Level 18
68 Pitt Street
Sydney NSW 2000
GPO Box 5457
Sydney NSW 2001
Perth
+61 8 9225 2300
Level 6
37 St George’s Terrace
Perth WA 6000
PO Box 5106
Perth WA 6831
New York
+1 212 488 5331
437 Madison Avenue
19th Floor
New York NY
10022
Los Angeles
+1 213 550 2687
555 West Fifth Street
Suite 3310
Los Angeles CA
90013
Singapore
+65 6622 5396
#13-03
Six Battery Road
Singapore 049909
Hong Kong
+852 3978 2629
+852 3978 2300
Level 16, Man Yee
Building
60-68 Des Voeux
Road Central
Central, Hong Kong
London
+44 203 968 6061
81 Chancery Lane
London WC2A 1DD
Amsterdam
+31 (0) 70 338 4343
Schiphol Boulevard 121
1118 BG Schiphol
Amsterdam
The Netherlands
Brisbane
+61 7 3108 1311
Level 18
175 Eagle Street
Brisbane QLD 4000
Melbourne
+61 3 9913 3301
Level 3
Bourke Place
600 Bourke Street
Melbourne VIC 3000
Adelaide
+61 8 8122 1010
50 Gilbert Street
Adelaide SA 5000
EUROPE, MIDDLE EAST & AFRICAAUSTRALIA UNITED STATES OF AMERICAASIA CANADA
San Francisco
+1 415 231 0363
Two Rincon Center
121 Spear Street
Suite 405
San Francisco CA
94105
Houston
+1 713 965 7919
LyondellBasell Tower
1221 McKinney Street
Suite 2860
Houston TX
77010
Toronto
+1 416 583 5720
250 The Esplanade
Suite 127
Toronto ON M5A 1J2
Montreal
+1 514 257 691
60 Rue St Jacques
Bureau 401
Montreal QC H2Y 1L5
Geneva
+41 (0) 22 818 6300
Rue de la Rôtisserie 4
1204 Geneva
Switzerland
Cologne
+49 (0) 221 8277 3000
ROLAND
ProzessFinanz AG
Deutz-Kalker Str. 46
50679 Cologne
Germany
Dubai
+971 4321 0029
Unit 1905, Level 19,
Index Tower,
Dubai International
Financial Centre
507152 Dubai
United Arab Emirates


![OMNI-400 / OMNI-600 - bienbacsecurity.com.vnbienbacsecurity.com.vn/DownloadFolder/OMNi_400-600[1].pdf · OMNI-400 / OMNI-600 Unattended downloading 4 - 8 fully programmable zones](https://img.pdfslide.us/doc/110x75/5bb5f82709d3f250788ddad9/omni-400-omni-600-1pdf-omni-400-omni-600-unattended-downloading-4-.jpg)