Embed Size (px)
Citation preview
Investor PresentationNovember, 2014
Forward-Looking Statements
2
This report contains forward-looking statements within the meaning of the Private Securities Litigation Reform Act of 1995, including, without limitation, as well as statements as to the expectations, beliefs and future expected business, financial performance and prospects of the Company that are based on current expectations and are subject to certain risks, assumptions, trends and uncertainties that could cause actual results to differ materially from those projected by the Company. Among the factors that could cause actual results to differ materially include oil and natural gas prices, the level of offshore expenditures by energy companies, variations energy demand, changes in day rates, cancellation by our customers of drilling contracts, letter agreements or letters of intent or the exercise of early termination provisions, risks associated with fixed cost drilling operations, cost overruns or delays on shipyard repair, construction or transportation of drilling units, maintenance and repair costs, costs or delays for conversion or upgrade projects, operating hazards and equipment failure, risks of collision and damage, casualty losses and limitations on insurance coverage, customer credit and risk of customer bankruptcy, the general economy and energy industry, weather conditions in the Company’s operating areas, increasing complexity and costs of compliance with environmental and other laws and regulations, changes in tax laws and interpretations by taxing authorities, civil unrest and instability, terrorism and hostilities in our areas of operations that may result in loss or seizure of assets, the outcome of disputes and legal proceedings, effects of the change in our corporate structure, and other risks disclosed in the Company's filings with the U.S. Securities and Exchange Commission. Each forward-looking statement speaks only as of the date hereof, and the Company expressly disclaims any obligation to update or revise any forward-looking statements, except as required by law.
This report contains forward-looking statements within the meaning of the Private Securities Litigation Reform Act of 1995, including, without limitation, as well as statements as to the expectations, beliefs and future expected business, financial performance and prospects of the Company that are based on current expectations and are subject to certain risks, assumptions, trends and uncertainties that could cause actual results to differ materially from those projected by the Company. Among the factors that could cause actual results to differ materially include oil and natural gas prices, the level of offshore expenditures by energy companies, variations energy demand, changes in day rates, cancellation by our customers of drilling contracts, letter agreements or letters of intent or the exercise of early termination provisions, risks associated with fixed cost drilling operations, cost overruns or delays on shipyard repair, construction or transportation of drilling units, maintenance and repair costs, costs or delays for conversion or upgrade projects, operating hazards and equipment failure, risks of collision and damage, casualty losses and limitations on insurance coverage, customer credit and risk of customer bankruptcy, the general economy and energy industry, weather conditions in the Company’s operating areas, increasing complexity and costs of compliance with environmental and other laws and regulations, changes in tax laws and interpretations by taxing authorities, civil unrest and instability, terrorism and hostilities in our areas of operations that may result in loss or seizure of assets, the outcome of disputes and legal proceedings, effects of the change in our corporate structure, and other risks disclosed in the Company's filings with the U.S. Securities and Exchange Commission. Each forward-looking statement speaks only as of the date hereof, and the Company expressly disclaims any obligation to update or revise any forward-looking statements, except as required by law.
3
Company Overview & Investment Highlights
Market Dynamics
Delivering Shareholder Value
Conclusion
4
Company Overview & Investment Highlights
Market Dynamics
Delivering Shareholder Value
Conclusion
Rowan Overview & Investment Highlights
5
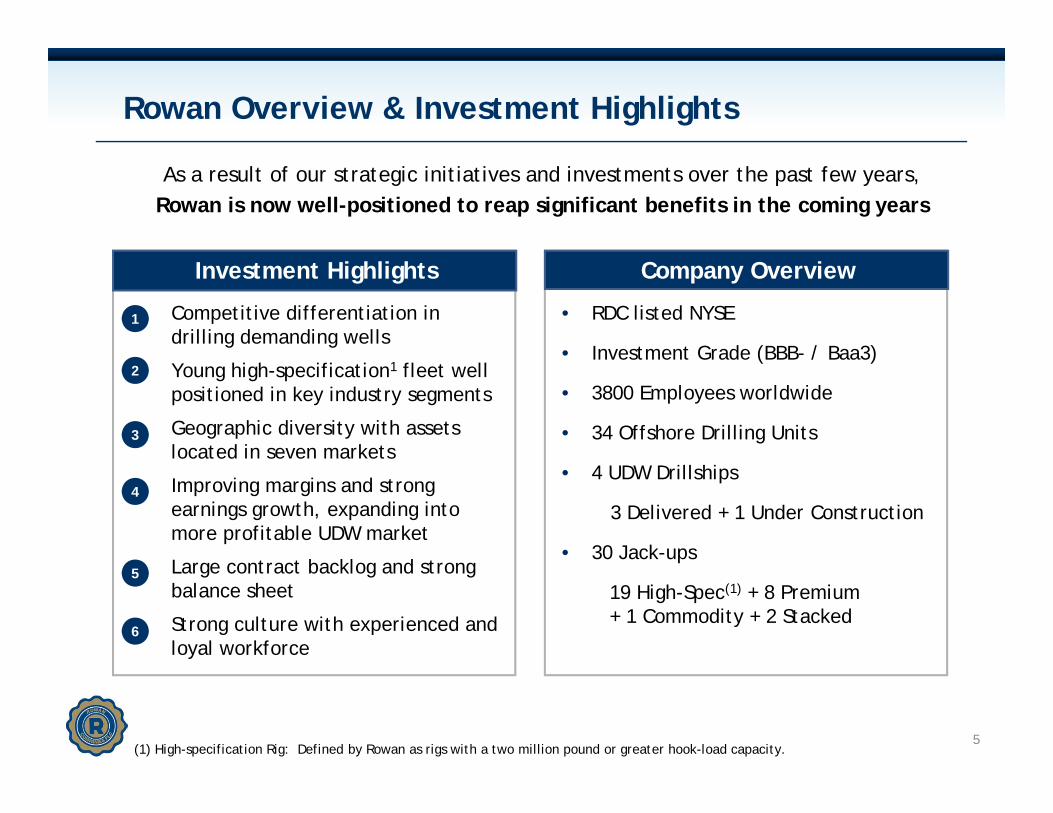
As a result of our strategic initiatives and investments over the past few years, Rowan is now well-positioned to reap significant benefits in the coming years
1. Competitive differentiation in drilling demanding wells
2. Young high-specification1 fleet well positioned in key industry segments
3. Geographic diversity with assets located in seven markets
4. Improving margins and strong earnings growth, expanding into more profitable UDW market
5. Large contract backlog and strong balance sheet
6. Strong culture with experienced and loyal workforce
Investment Highlights
• RDC listed NYSE
• Investment Grade (BBB- / Baa3)
• 3800 Employees worldwide
• 34 Offshore Drilling Units
• 4 UDW Drillships
3 Delivered + 1 Under Construction
• 30 Jack-ups
19 High-Spec(1) + 8 Premium + 1 Commodity + 2 Stacked
Company Overview
(1) High-specification Rig: Defined by Rowan as rigs with a two million pound or greater hook-load capacity.
1
2
3
4
5
6
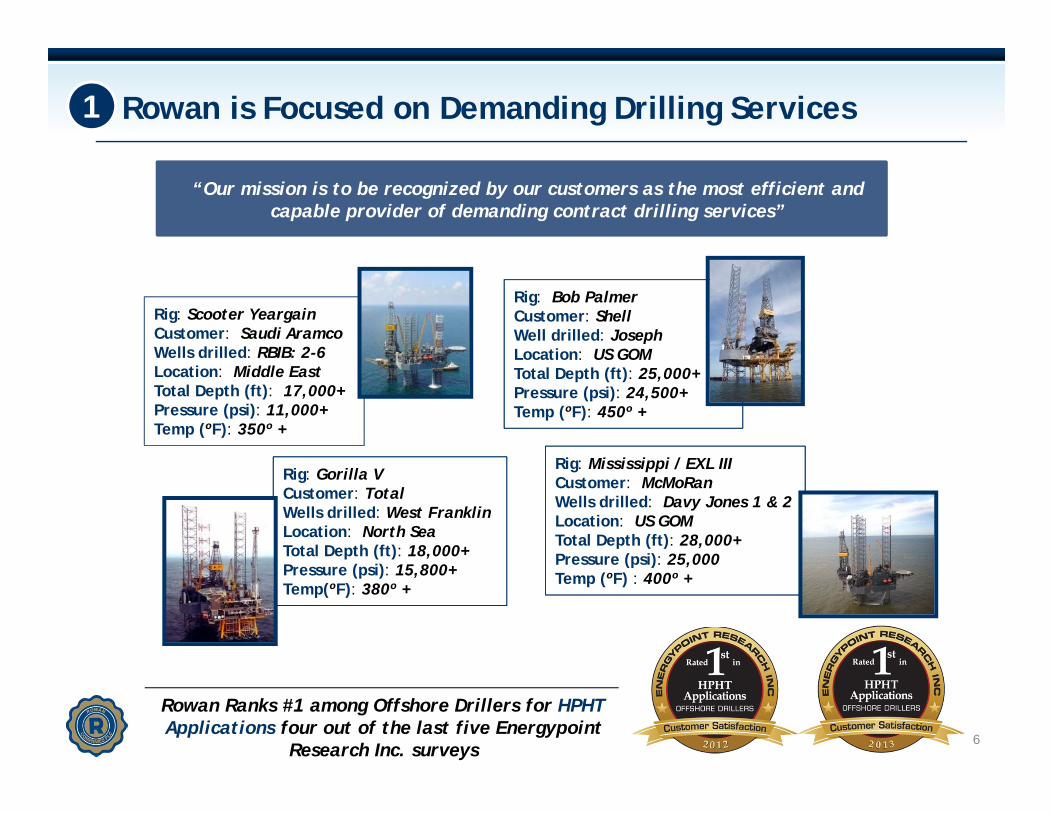
Rowan is Focused on Demanding Drilling Services
Rig: Scooter YeargainCustomer: Saudi AramcoWells drilled: RBIB: 2-6Location: Middle EastTotal Depth (ft): 17,000+Pressure (psi): 11,000+Temp (ºF): 350º +
Rig: Gorilla VCustomer: TotalWells drilled: West FranklinLocation: North SeaTotal Depth (ft): 18,000+Pressure (psi): 15,800+Temp(ºF): 380º +
Rig: Mississippi / EXL IIICustomer: McMoRanWells drilled: Davy Jones 1 & 2Location: US GOMTotal Depth (ft): 28,000+Pressure (psi): 25,000Temp (ºF) : 400º +
Rig: Bob PalmerCustomer: ShellWell drilled: JosephLocation: US GOM Total Depth (ft): 25,000+Pressure (psi): 24,500+Temp (ºF): 450º +
Rowan Ranks #1 among Offshore Drillers for HPHT Applications four out of the last five Energypoint
Research Inc. surveys
“Our mission is to be recognized by our customers as the most efficient and capable provider of demanding contract drilling services”
1
6
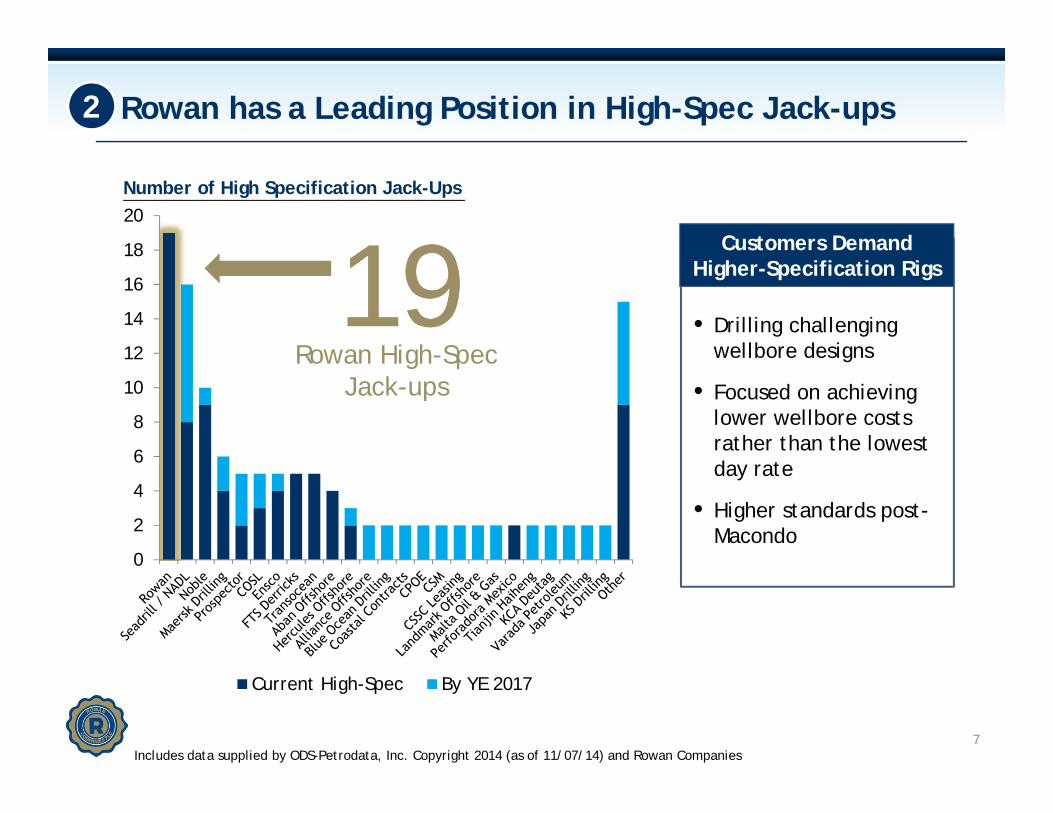
1919Rowan High-Spec
Jack-ups
Includes data supplied by ODS-Petrodata, Inc. Copyright 2014 (as of 11/07/14) and Rowan Companies7
Customers Demand Higher-Specification Rigs
• Drilling challenging wellbore designs
• Focused on achieving lower wellbore costs rather than the lowest day rate
• Higher standards post-Macondo
Rowan has a Leading Position in High-Spec Jack-ups
Number of High Specification Jack-Ups
2
0
2
4
6
8
10
12
14
16
18
20
Current High-Spec By YE 2017
0
2
4
6
8
10
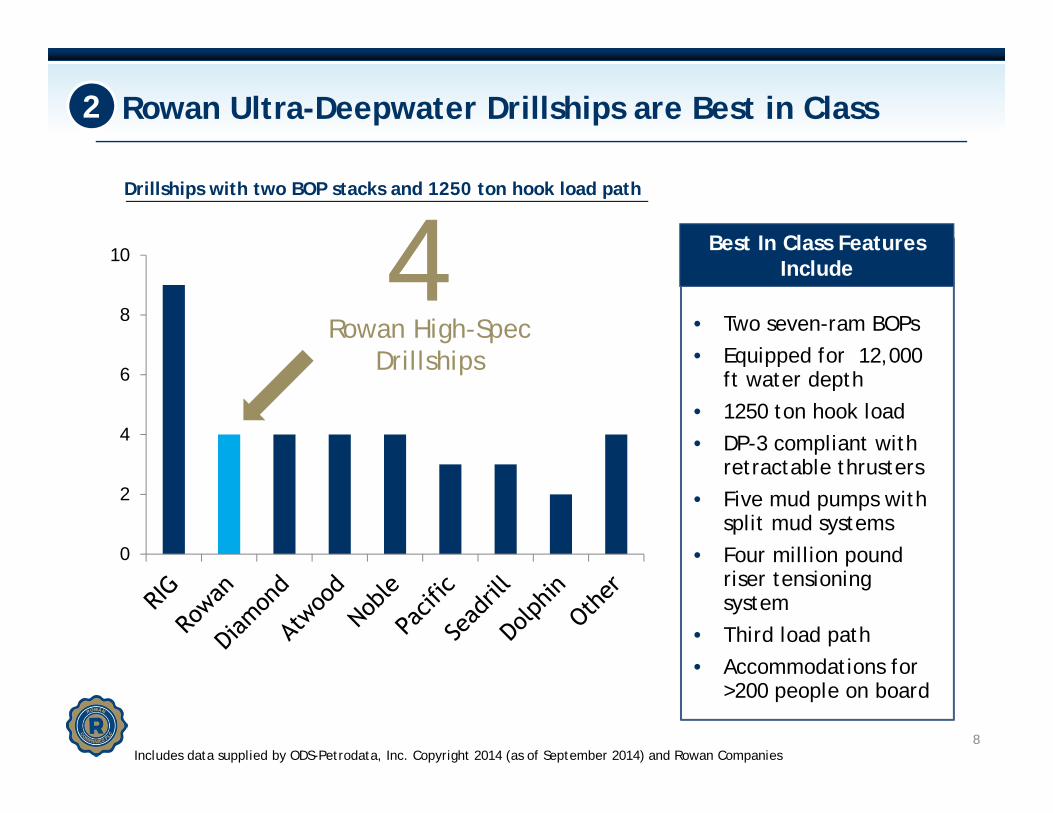
Includes data supplied by ODS-Petrodata, Inc. Copyright 2014 (as of September 2014) and Rowan Companies8
Best In Class Features Include
• Two seven-ram BOPs• Equipped for 12,000
ft water depth• 1250 ton hook load• DP-3 compliant with
retractable thrusters• Five mud pumps with
split mud systems• Four million pound
riser tensioning system
• Third load path• Accommodations for
>200 people on board
Rowan Ultra-Deepwater Drillships are Best in Class 2
Drillships with two BOP stacks and 1250 ton hook load path
44Rowan High-Spec
Drillships
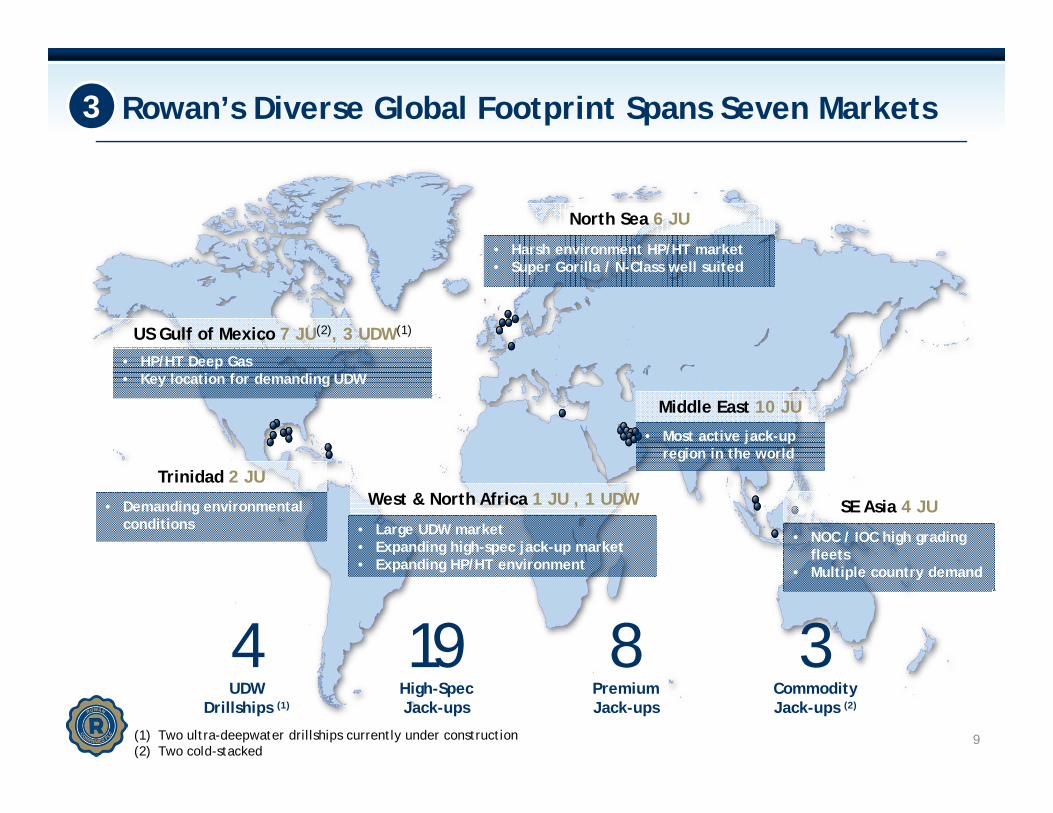
Rowan’s Diverse Global Footprint Spans Seven Markets
9
• HP/HT Deep Gas• Key location for demanding UDW
US Gulf of Mexico 7 JU(2), 3 UDW(1)
• Harsh environment HP/HT market• Super Gorilla / N-Class well suited
North Sea 6 JU
• Demanding environmental conditions
Trinidad 2 JU
• Most active jack-up region in the world
Middle East 10 JU
• NOC / IOC high grading fleets
• Multiple country demand
SE Asia 4 JU• Large UDW market• Expanding high-spec jack-up market• Expanding HP/HT environment
West & North Africa 1 JU , 1 UDW
4UDW
Drillships (1)
19High-Spec Jack-ups
8Premium Jack-ups
3Commodity Jack-ups (2)
(1) Two ultra-deepwater drillships currently under construction(2) Two cold-stacked
3
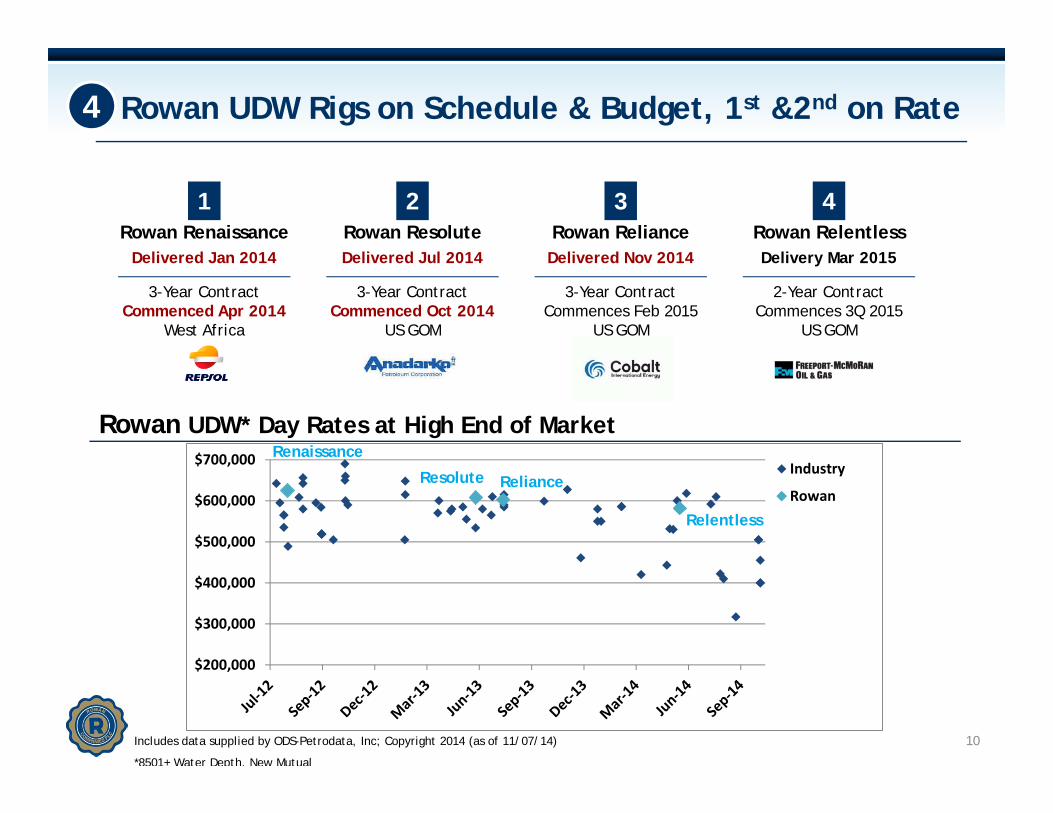
Rowan UDW Rigs on Schedule & Budget, 1st &2nd on Rate
10Includes data supplied by ODS-Petrodata, Inc; Copyright 2014 (as of 11/07/14)
*8501+ Water Depth, New Mutual
Rowan UDW* Day Rates at High End of Market
1Rowan Renaissance
Delivered Jan 2014
3-Year ContractCommenced Apr 2014
West Africa
2Rowan ResoluteDelivered Jul 2014
3-Year ContractCommenced Oct 2014
US GOM
3Rowan RelianceDelivered Nov 2014
3-Year ContractCommences Feb 2015
US GOM
4Rowan RelentlessDelivery Mar 2015
2-Year ContractCommences 3Q 2015
US GOM
4
$200,000
$300,000
$400,000
$500,000
$600,000
$700,000 Industry
Rowan
Renaissance
Resolute Reliance
Relentless
11
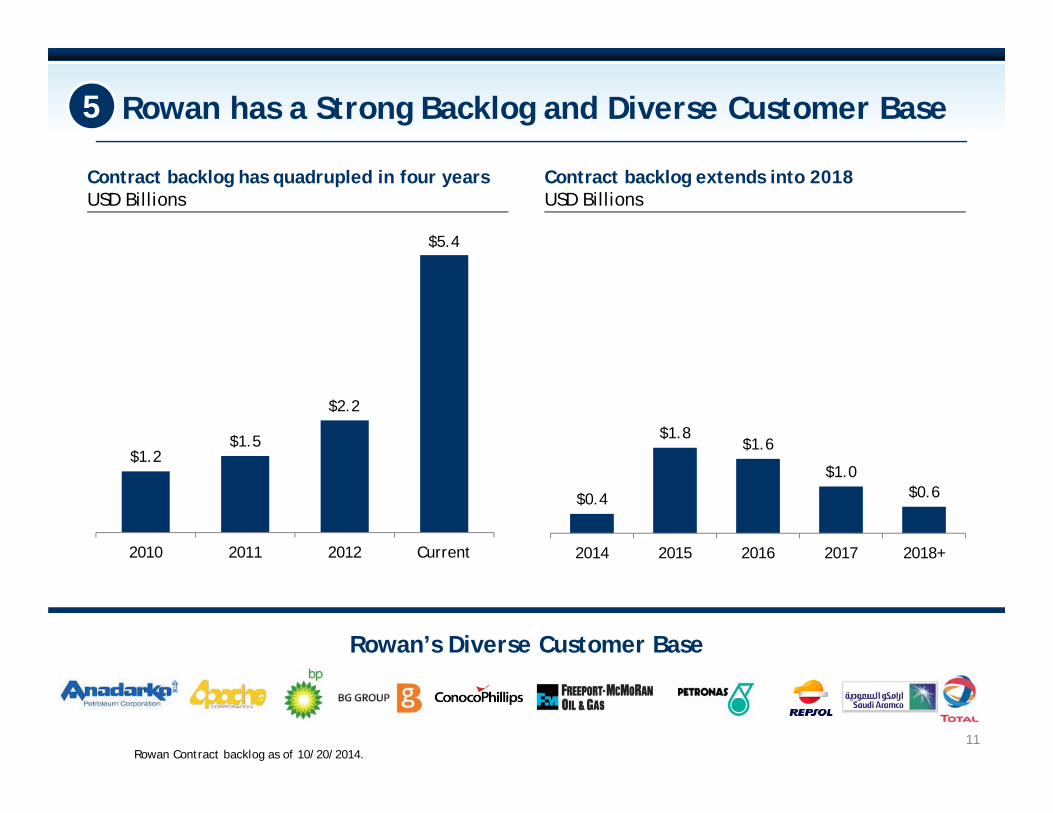
Rowan has a Strong Backlog and Diverse Customer Base
11
$1.2$1.5
2010 2011 2012 Current
$2.2
$5.4
Rowan’s Diverse Customer Base
Contract backlog has quadrupled in four years USD Billions
Contract backlog extends into 2018USD Billions
$0.4
$1.8$1.6
$1.0$0.6
2014 2015 2016 2017 2018+
Rowan Contract backlog as of 10/20/2014.
5
Strong Balance Sheet = Capital Allocation Options
12
Investment grade credit rating
Provides access to capital in strong and weak markets Provides stability and ability to seize opportunities in down markets
Undrawn $1 billion revolver and drillship construction fully financed
Capex expected to significantly decline after fourth UDW rig delivered in 2015 and substantial free cash flow expected to start second half 2015
Capital allocation options, starting second half 2015, include: Targeted growth investments if attractive opportunities arise Stable dividend growth through industry cycles Opportunistic share repurchases
5
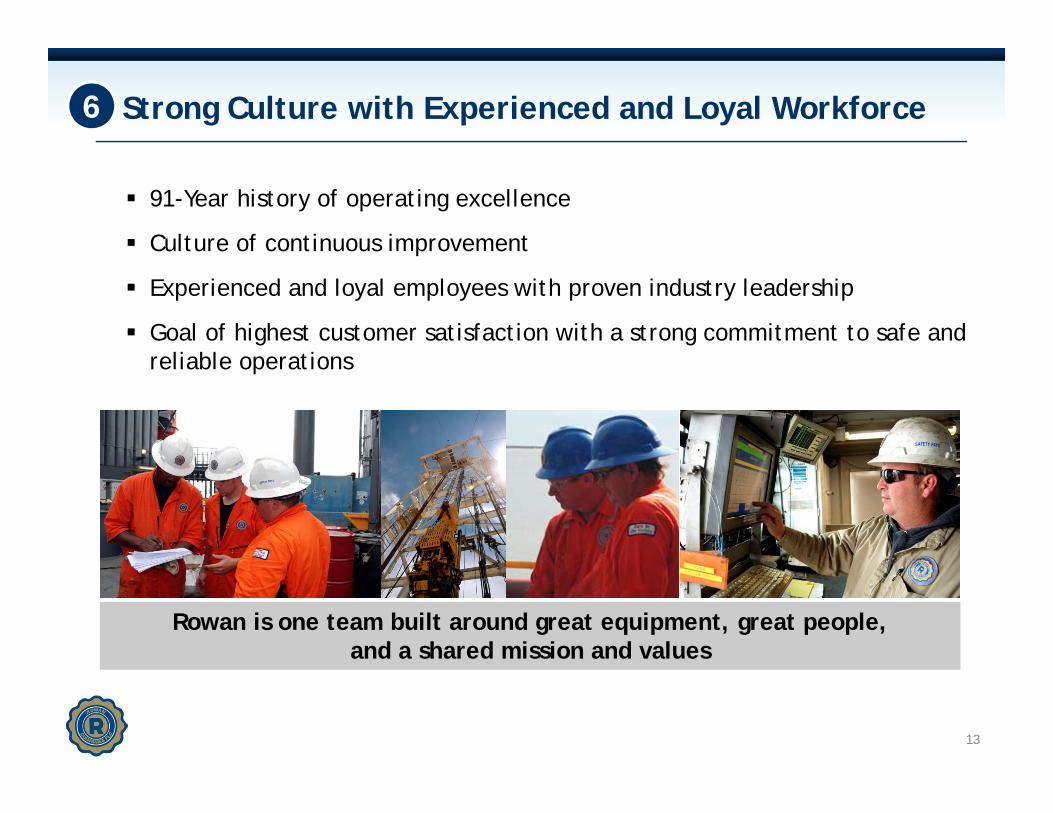
Strong Culture with Experienced and Loyal Workforce
91-Year history of operating excellence
Culture of continuous improvement
Experienced and loyal employees with proven industry leadership
Goal of highest customer satisfaction with a strong commitment to safe and reliable operations
13
Rowan is one team built around great equipment, great people, and a shared mission and values
6
14
Company Overview & Investment Highlights
Market Dynamics
Delivering Shareholder Value
Conclusion
-80
-60
-40
-20
0
20
40
60
80
1985198019751970 201520102005200019951990
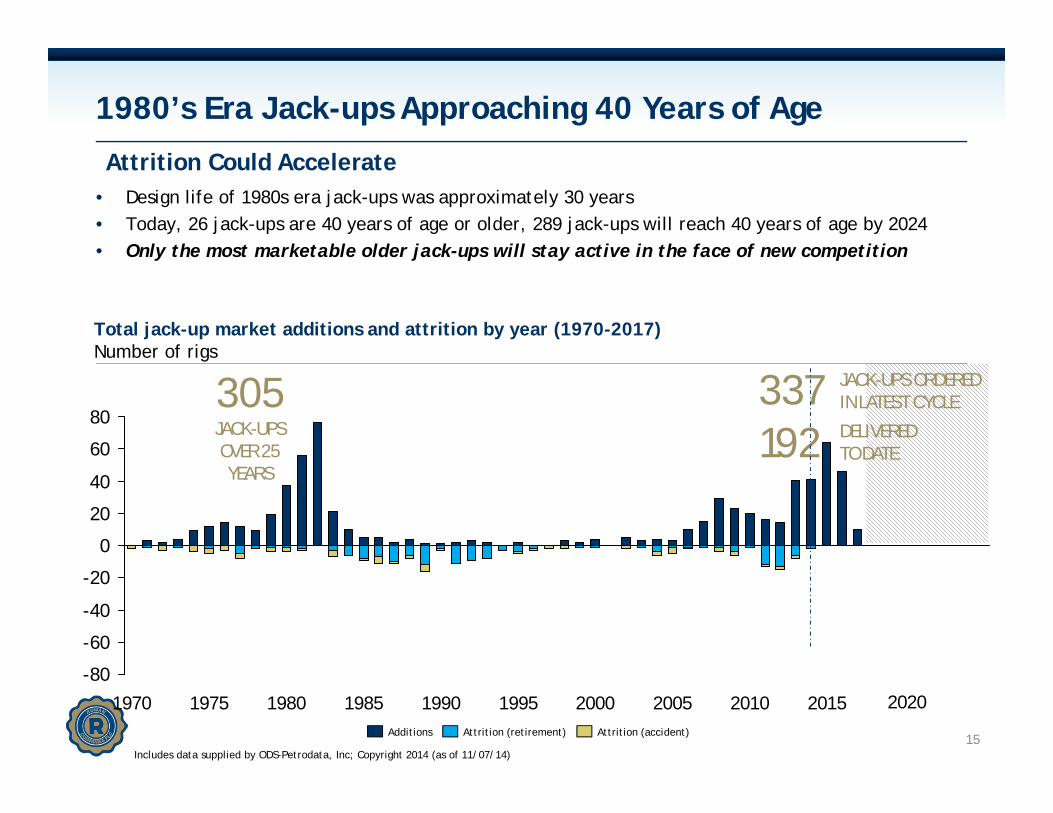
1980’s Era Jack-ups Approaching 40 Years of Age
• Design life of 1980s era jack-ups was approximately 30 years• Today, 26 jack-ups are 40 years of age or older, 289 jack-ups will reach 40 years of age by 2024• Only the most marketable older jack-ups will stay active in the face of new competition
15
Total jack-up market additions and attrition by year (1970-2017)Number of rigs
305JACK-UPSOVER 25
YEARS
337 JACK-UPS ORDERED IN LATEST CYCLE
Attrition Could Accelerate
192 DELIVEREDTO DATE
Includes data supplied by ODS-Petrodata, Inc; Copyright 2014 (as of 11/07/14)
Additions Attrition (accident)Attrition (retirement)
2020
-80
-60
-40
-20
0
20
40
60
80
201020052000199519901985 2015198019751970
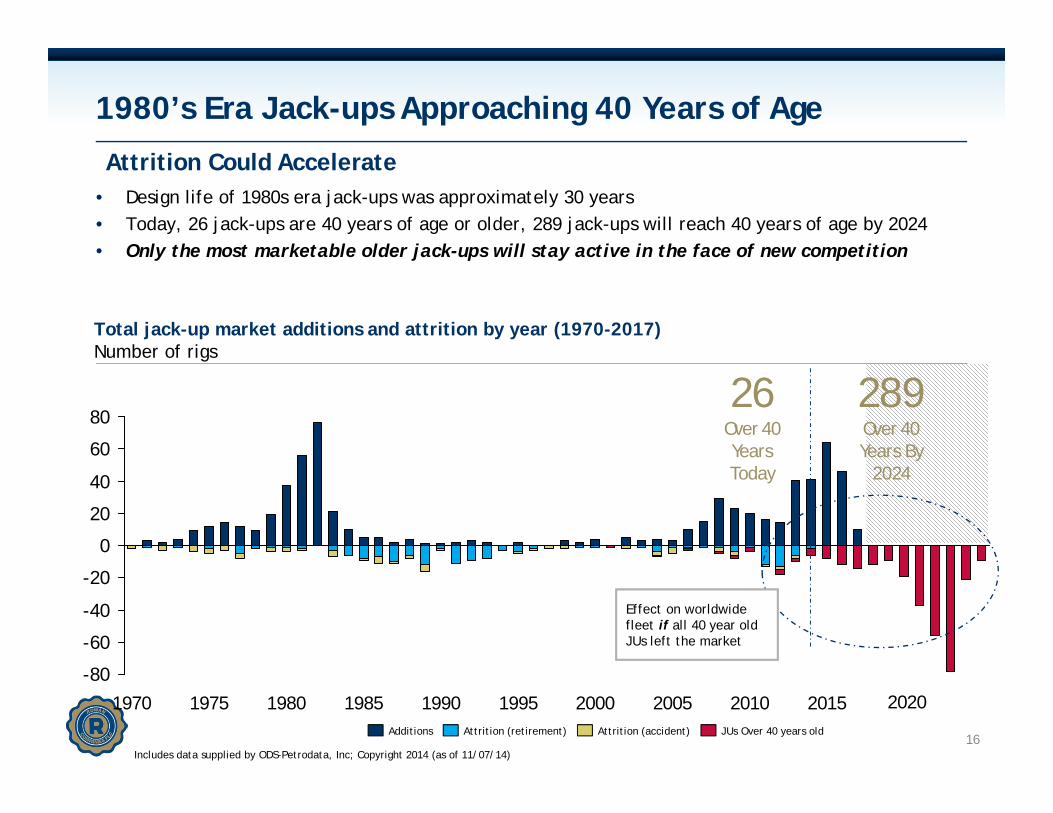
1980’s Era Jack-ups Approaching 40 Years of Age
16
26Over 40
Years Today
289Over 40
Years By 2024
• Design life of 1980s era jack-ups was approximately 30 years• Today, 26 jack-ups are 40 years of age or older, 289 jack-ups will reach 40 years of age by 2024• Only the most marketable older jack-ups will stay active in the face of new competition
Attrition Could Accelerate
Total jack-up market additions and attrition by year (1970-2017)Number of rigs
Includes data supplied by ODS-Petrodata, Inc; Copyright 2014 (as of 11/07/14)
2020
Effect on worldwide fleet if all 40 year old JUs left the market
JUs Over 40 years oldAttrition (retirement) Attrition (accident)Additions
Competitor Rigs
Rowan’s Older Jack-ups are Capable and Marketable
17
0
50
100
150
200
250
300
350
400
450
500
550
600
650
198019781976197419721970 1988198619841982
Rowan Rigs
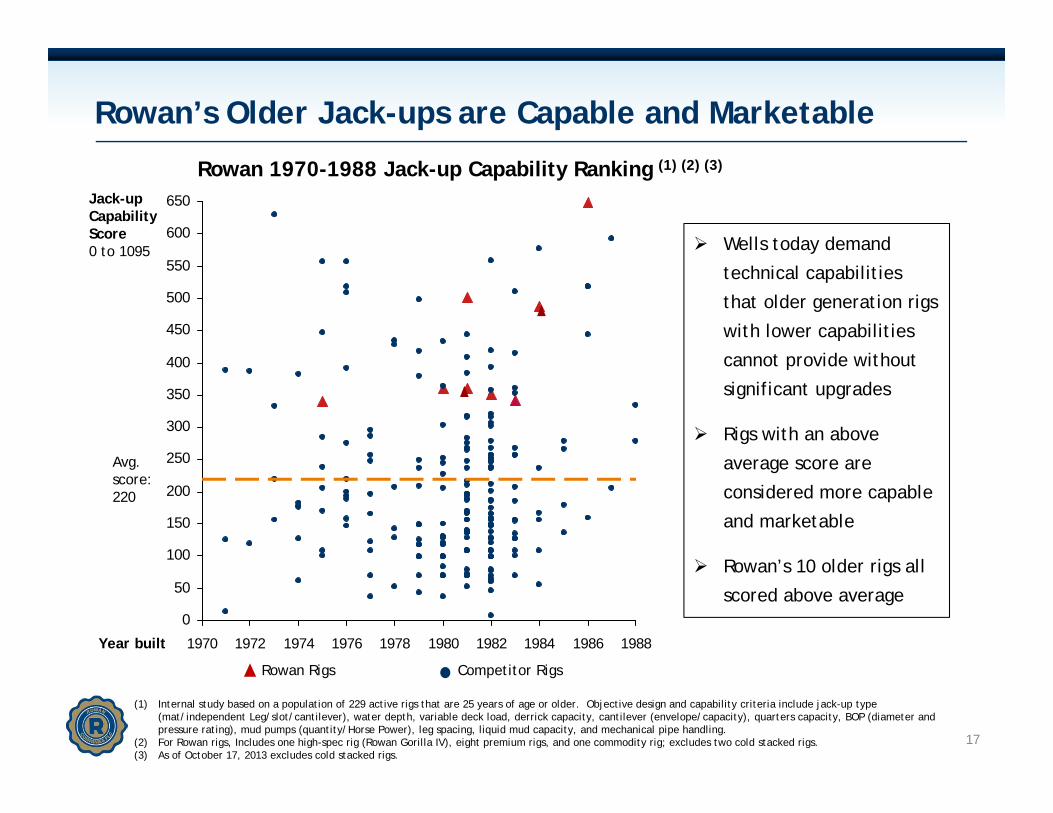
Jack-up Capability Score0 to 1095
Avg. score: 220
(1) Internal study based on a population of 229 active rigs that are 25 years of age or older. Objective design and capability criteria include jack-up type (mat/independent Leg/slot/cantilever), water depth, variable deck load, derrick capacity, cantilever (envelope/capacity), quarters capacity, BOP (diameter and pressure rating), mud pumps (quantity/Horse Power), leg spacing, liquid mud capacity, and mechanical pipe handling.
(2) For Rowan rigs, Includes one high-spec rig (Rowan Gorilla IV), eight premium rigs, and one commodity rig; excludes two cold stacked rigs. (3) As of October 17, 2013 excludes cold stacked rigs.
Year built
Rowan 1970-1988 Jack-up Capability Ranking (1) (2) (3)
Wells today demand
technical capabilities
that older generation rigs
with lower capabilities
cannot provide without
significant upgrades
Rigs with an above
average score are
considered more capable
and marketable
Rowan’s 10 older rigs all
scored above average
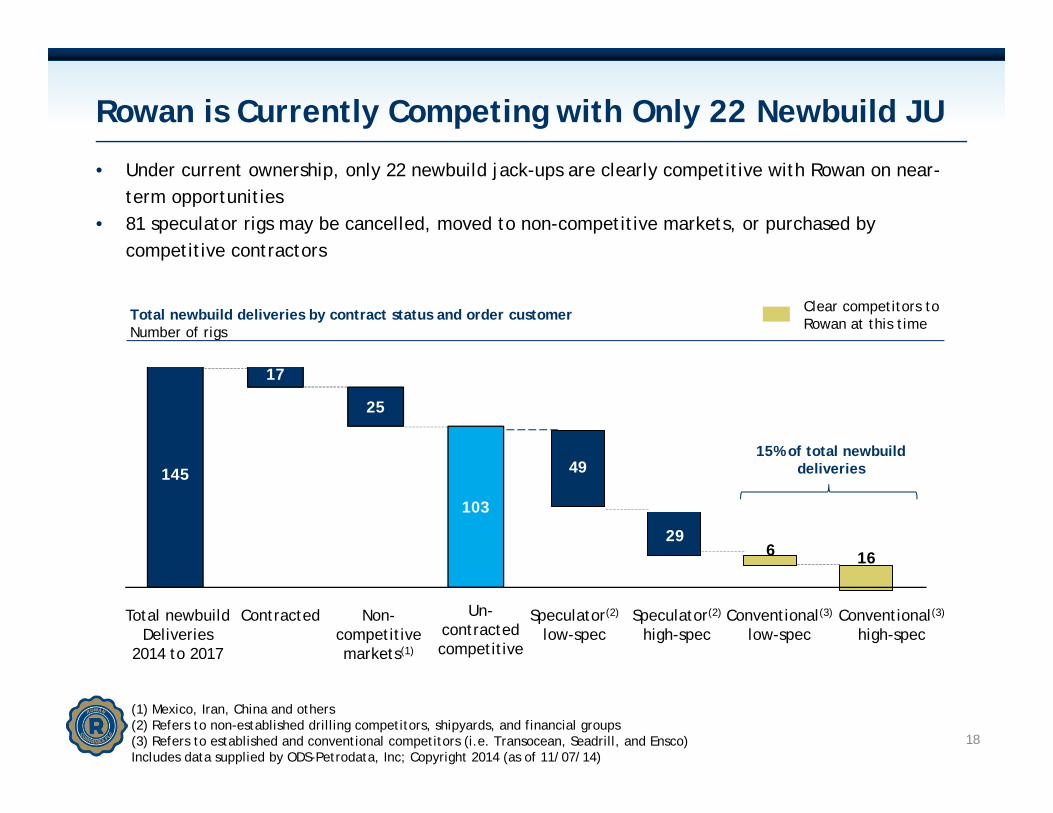
49
629
16
Rowan is Currently Competing with Only 22 Newbuild JU
Total newbuildDeliveries
2014 to 2017
Contracted Non-competitive markets(1)
Un-contractedcompetitive
Speculator(2)
low-specSpeculator(2)
high-specConventional(3)
low-specConventional(3)
high-spec
Total newbuild deliveries by contract status and order customerNumber of rigs
Clear competitors to Rowan at this time
15% of total newbuild deliveries
(1) Mexico, Iran, China and others(2) Refers to non-established drilling competitors, shipyards, and financial groups(3) Refers to established and conventional competitors (i.e. Transocean, Seadrill, and Ensco)Includes data supplied by ODS-Petrodata, Inc; Copyright 2014 (as of 11/07/14)
• Under current ownership, only 22 newbuild jack-ups are clearly competitive with Rowan on near-term opportunities
• 81 speculator rigs may be cancelled, moved to non-competitive markets, or purchased by competitive contractors
18
145
17
25
103
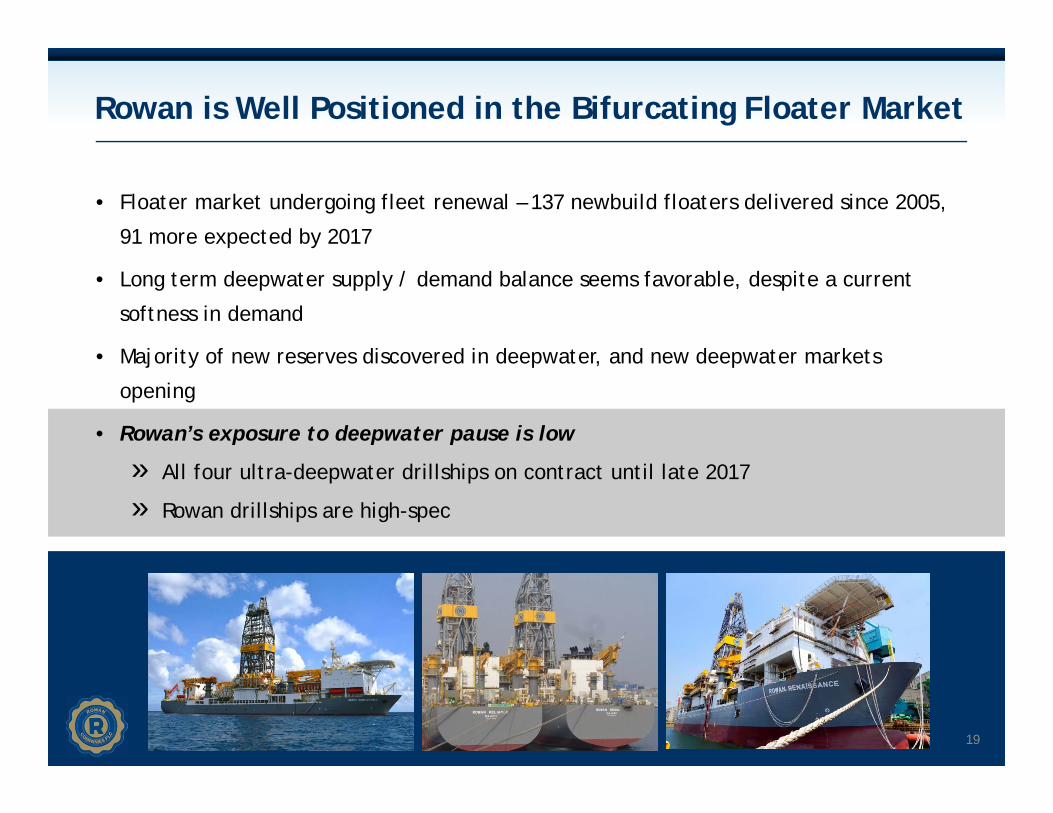
• Floater market undergoing fleet renewal – 137 newbuild floaters delivered since 2005,
91 more expected by 2017
• Long term deepwater supply / demand balance seems favorable, despite a current
softness in demand
• Majority of new reserves discovered in deepwater, and new deepwater markets
opening
• Rowan’s exposure to deepwater pause is low
» All four ultra-deepwater drillships on contract until late 2017
» Rowan drillships are high-spec
Rowan is Well Positioned in the Bifurcating Floater Market
19
20
Market Dynamics
Delivering Shareholder Value
Conclusion
Company Overview & Investment Highlights
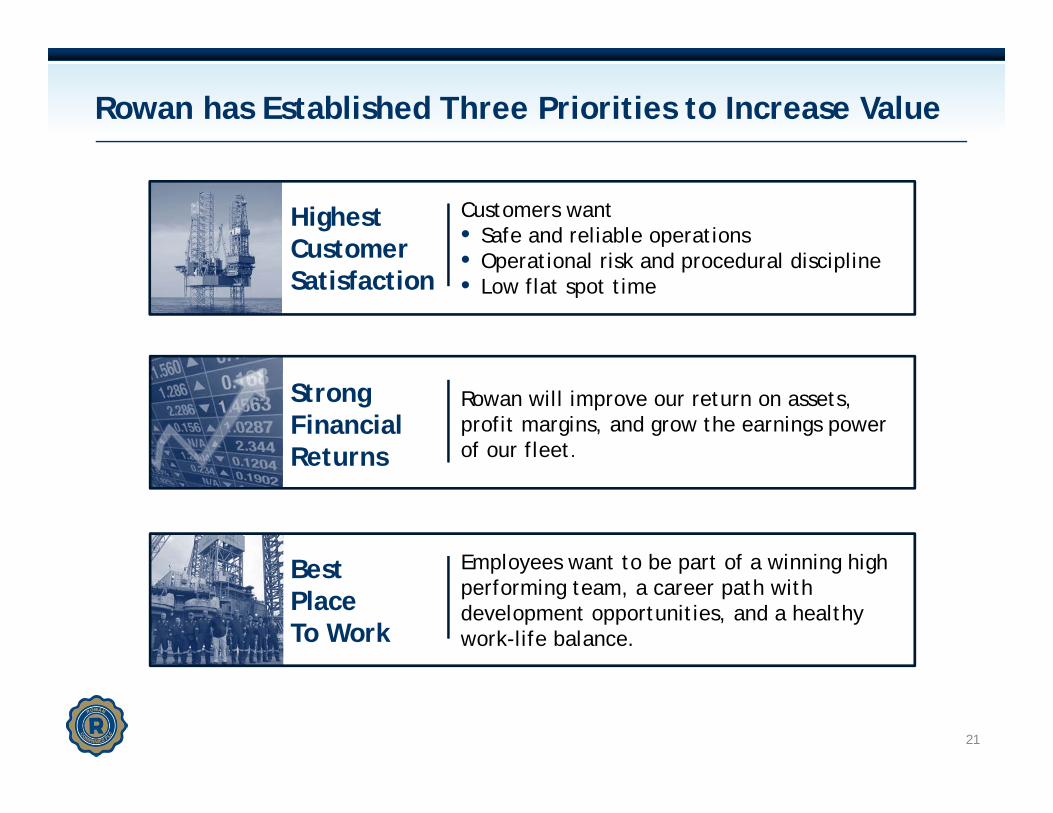
Rowan has Established Three Priorities to Increase Value
21
Rowan will improve our return on assets, profit margins, and grow the earnings power of our fleet.
StrongFinancialReturns
Employees want to be part of a winning high performing team, a career path with development opportunities, and a healthy work-life balance.
Best PlaceTo Work
Customers want • Safe and reliable operations• Operational risk and procedural discipline• Low flat spot time
HighestCustomer Satisfaction
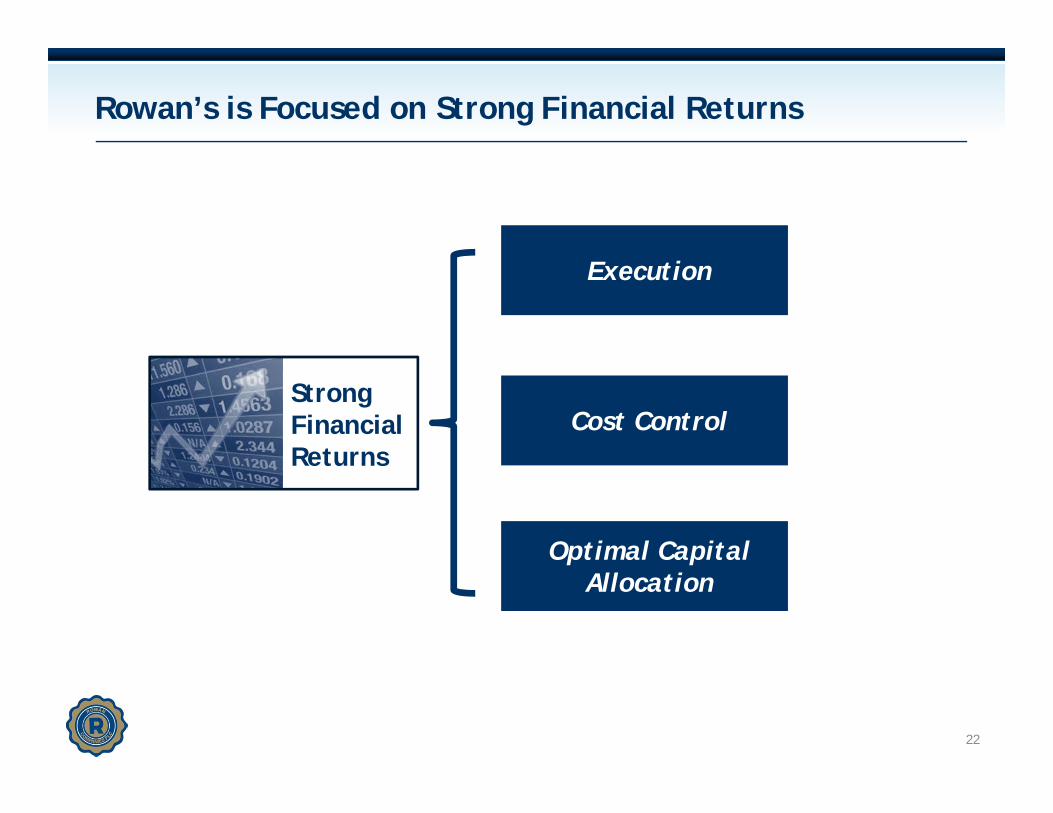
Rowan’s is Focused on Strong Financial Returns
22
Execution
Cost Control
Optimal Capital Allocation
StrongFinancialReturns
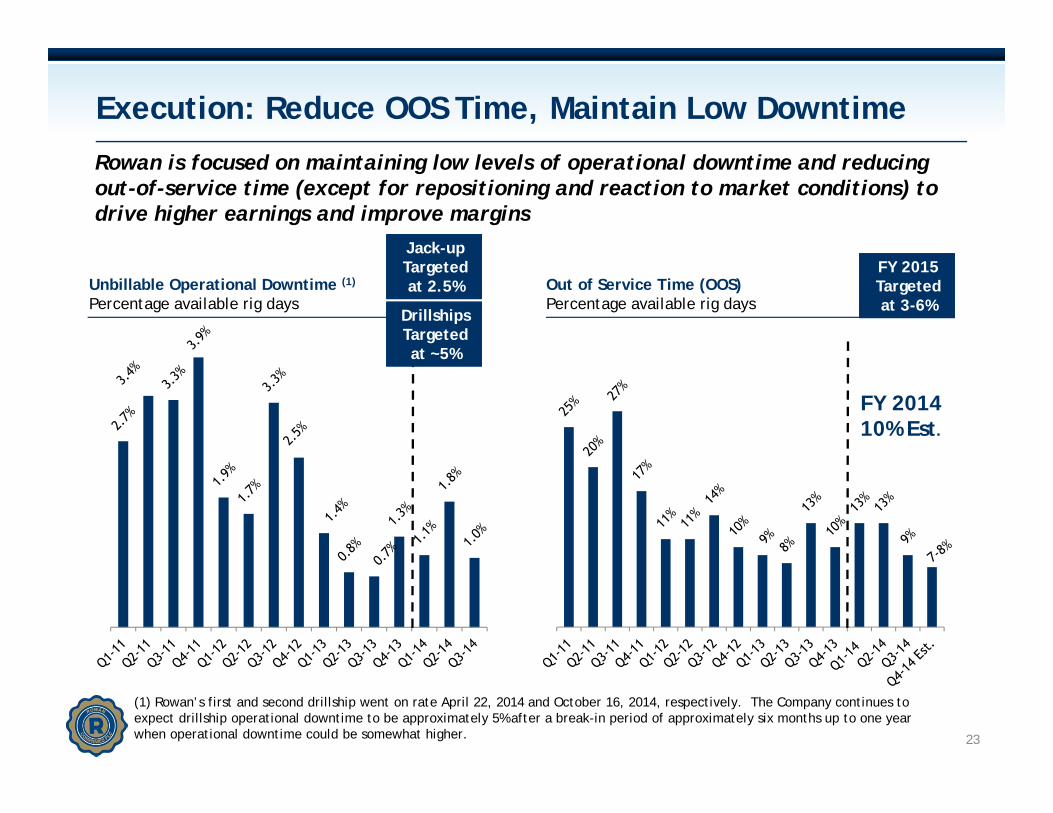
Execution: Reduce OOS Time, Maintain Low Downtime
FY 201410% Est.
23
Unbillable Operational Downtime (1)
Percentage available rig daysOut of Service Time (OOS) Percentage available rig days
Jack-up Targeted at 2.5%
Jack-up Targeted at 2.5%
FY 2015 Targeted at 3-6%
FY 2015 Targeted at 3-6%
(1) Rowan’s first and second drillship went on rate April 22, 2014 and October 16, 2014, respectively. The Company continues toexpect drillship operational downtime to be approximately 5% after a break-in period of approximately six months up to one year when operational downtime could be somewhat higher.
Rowan is focused on maintaining low levels of operational downtime and reducing out-of-service time (except for repositioning and reaction to market conditions) to drive higher earnings and improve margins
DrillshipsTargeted at ~5%
DrillshipsTargeted at ~5%
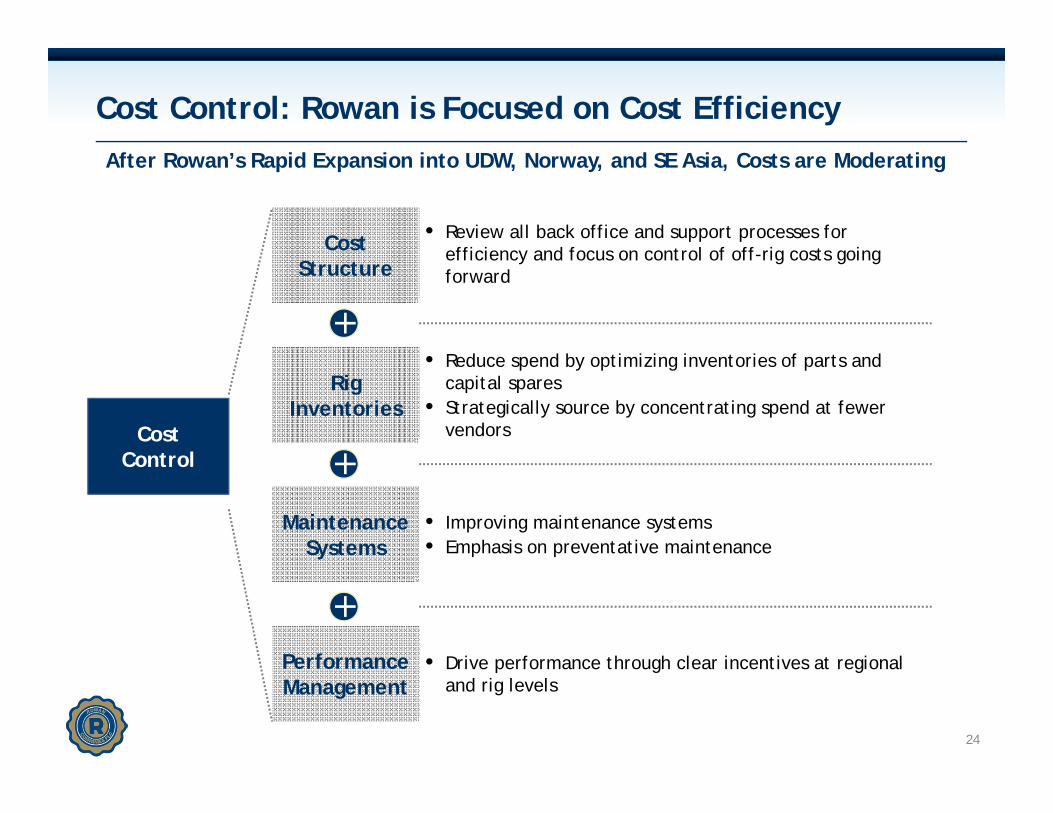
Cost Control: Rowan is Focused on Cost Efficiency
24
Cost Structure
• Review all back office and support processes for efficiency and focus on control of off-rig costs going forward
CostControl
• Improving maintenance systems• Emphasis on preventative maintenance
MaintenanceSystems
Rig Inventories
• Reduce spend by optimizing inventories of parts and capital spares
• Strategically source by concentrating spend at fewer vendors
Performance Management
• Drive performance through clear incentives at regional and rig levels
After Rowan’s Rapid Expansion into UDW, Norway, and SE Asia, Costs are Moderating
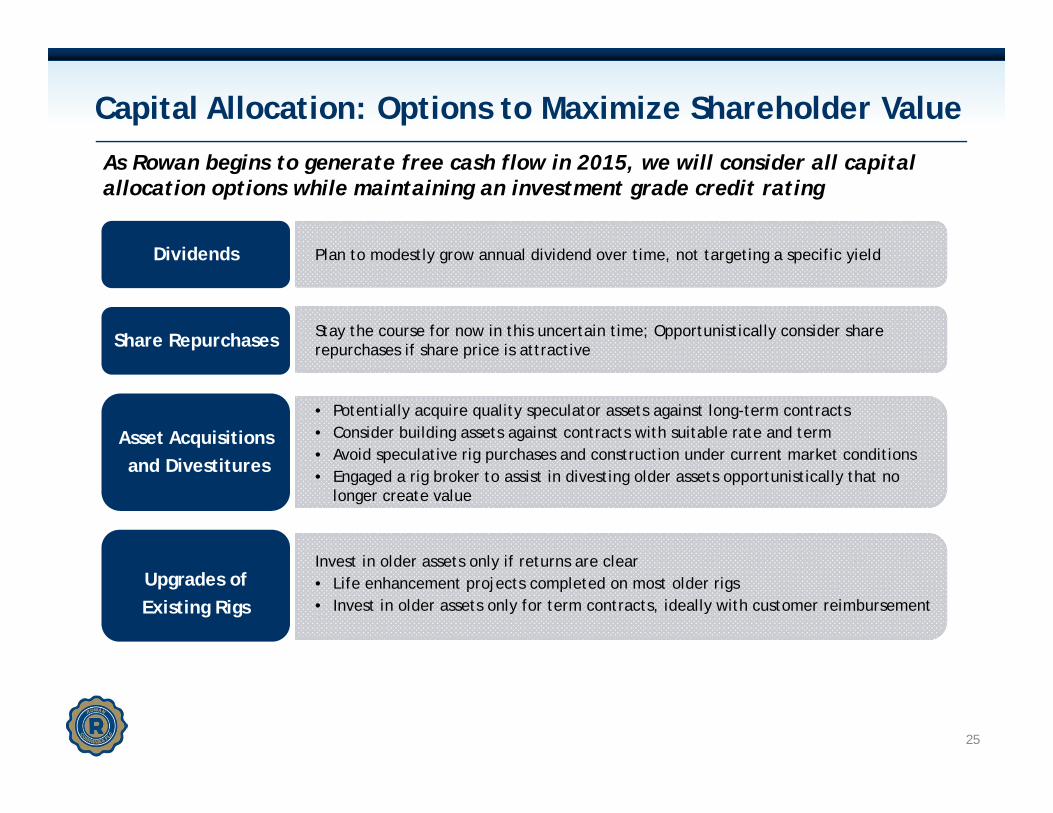
Capital Allocation: Options to Maximize Shareholder Value
25
As Rowan begins to generate free cash flow in 2015, we will consider all capital allocation options while maintaining an investment grade credit rating
Asset Acquisitions and Divestitures
• Potentially acquire quality speculator assets against long-term contracts• Consider building assets against contracts with suitable rate and term• Avoid speculative rig purchases and construction under current market conditions• Engaged a rig broker to assist in divesting older assets opportunistically that no
longer create value
Dividends Plan to modestly grow annual dividend over time, not targeting a specific yield
Share Repurchases Stay the course for now in this uncertain time; Opportunistically consider share repurchases if share price is attractive
Upgrades of Existing Rigs
Invest in older assets only if returns are clear• Life enhancement projects completed on most older rigs• Invest in older assets only for term contracts, ideally with customer reimbursement
26
Company Overview & Investment Highlights
Market dynamics (especially jack-up market)
Delivering shareholder value (especially through allocation of capital)
Conclusion
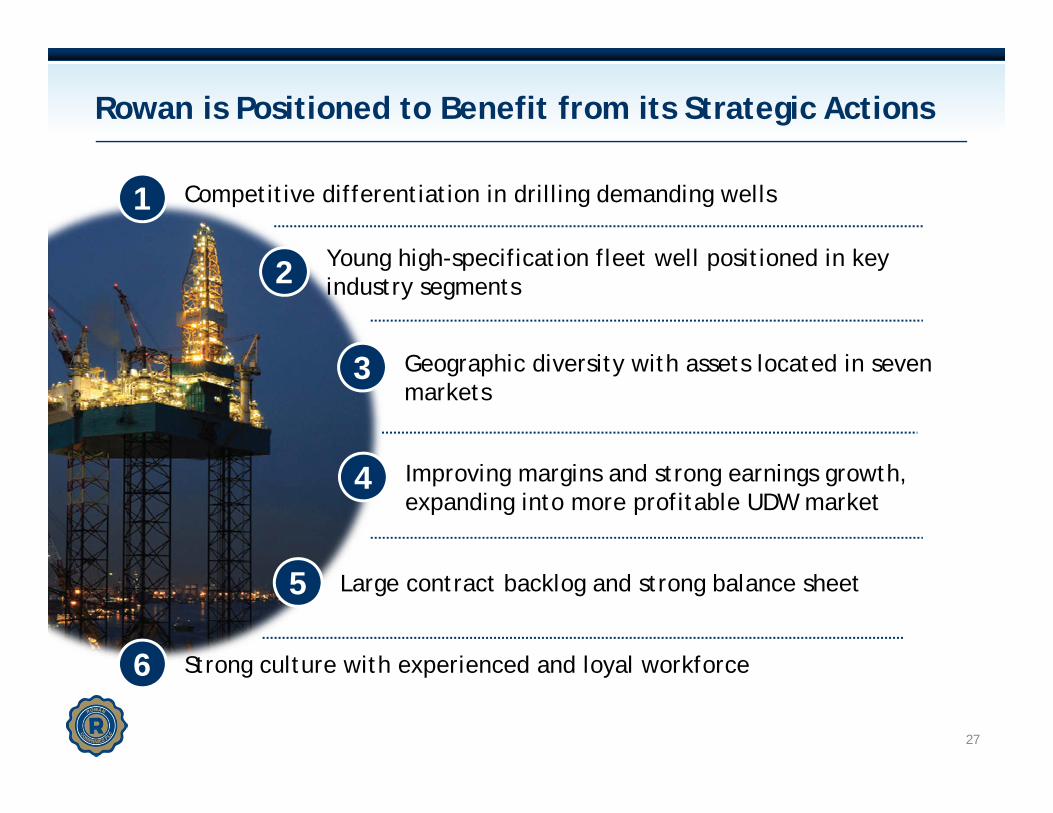
Rowan is Positioned to Benefit from its Strategic Actions
27
Competitive differentiation in drilling demanding wells 1
Young high-specification fleet well positioned in key industry segments2
Geographic diversity with assets located in seven markets
3
5 Large contract backlog and strong balance sheet
4 Improving margins and strong earnings growth, expanding into more profitable UDW market
6 Strong culture with experienced and loyal workforce
Appendix
28
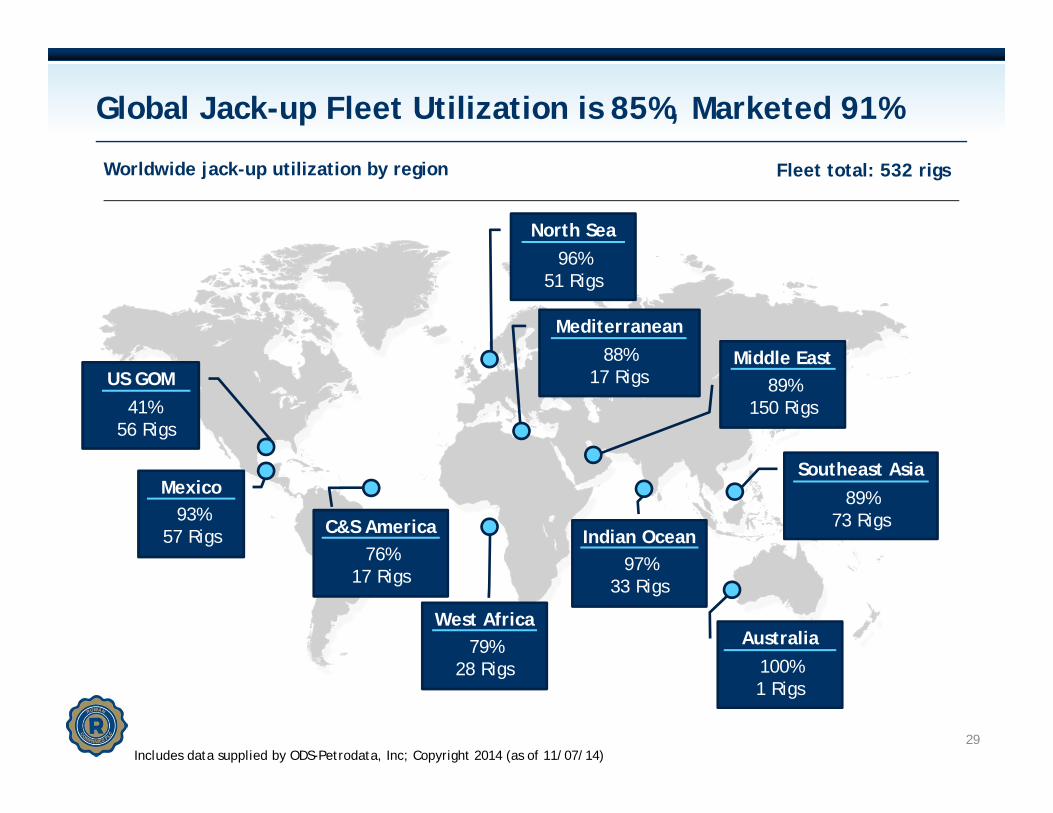
Global Jack-up Fleet Utilization is 85%, Marketed 91%
Includes data supplied by ODS-Petrodata, Inc; Copyright 2014 (as of 11/07/14)
US GOM
Indian Ocean
North Sea
Mediterranean
Middle East
Southeast AsiaMexico
C&S America
West AfricaAustralia
41% 56 Rigs
93%57 Rigs
76%17 Rigs
79%28 Rigs
97%33 Rigs
100%1 Rigs
89%73 Rigs
89%150 Rigs
88%17 Rigs
96%51 Rigs
Worldwide jack-up utilization by region Fleet total: 532 rigs
29
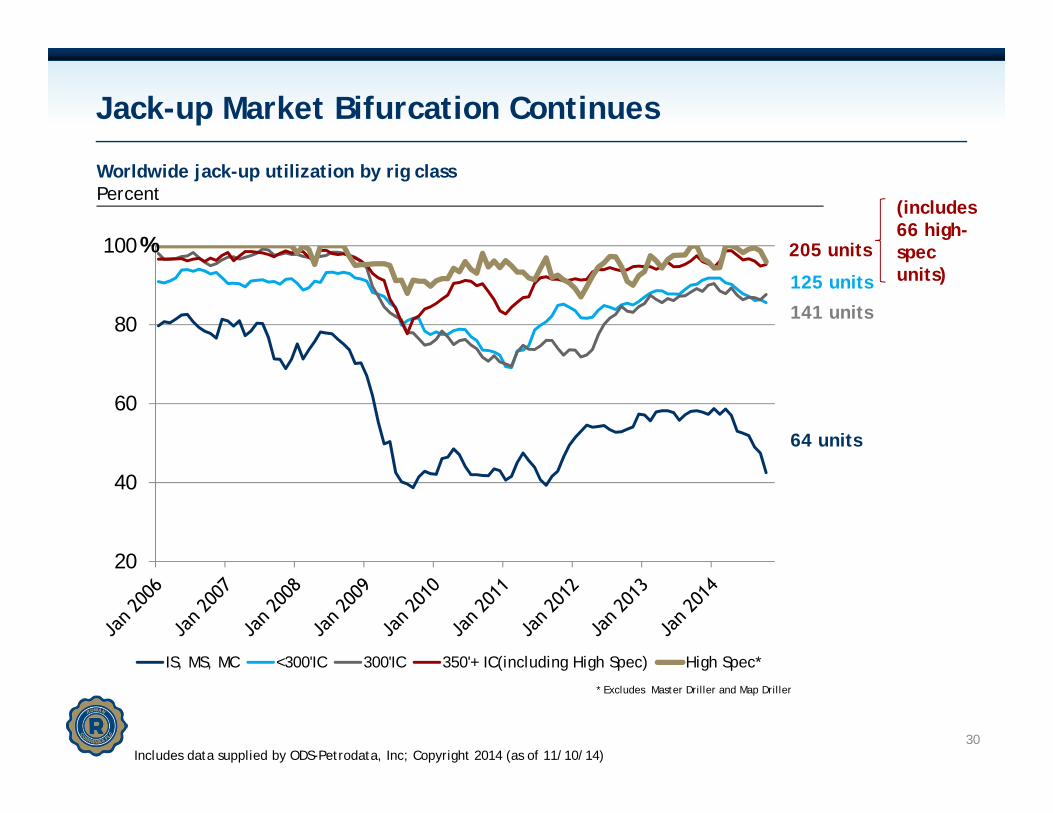
Jack-up Market Bifurcation Continues
20
40
60
80
100
IS, MS, MC <300'IC 300'IC 350'+ IC(including High Spec) High Spec*
%
* Excludes Master Driller and Map Driller
30Includes data supplied by ODS-Petrodata, Inc; Copyright 2014 (as of 11/10/14)
64 units
125 units
141 units
205 units
(includes 66 high-spec units)
Worldwide jack-up utilization by rig classPercent
31
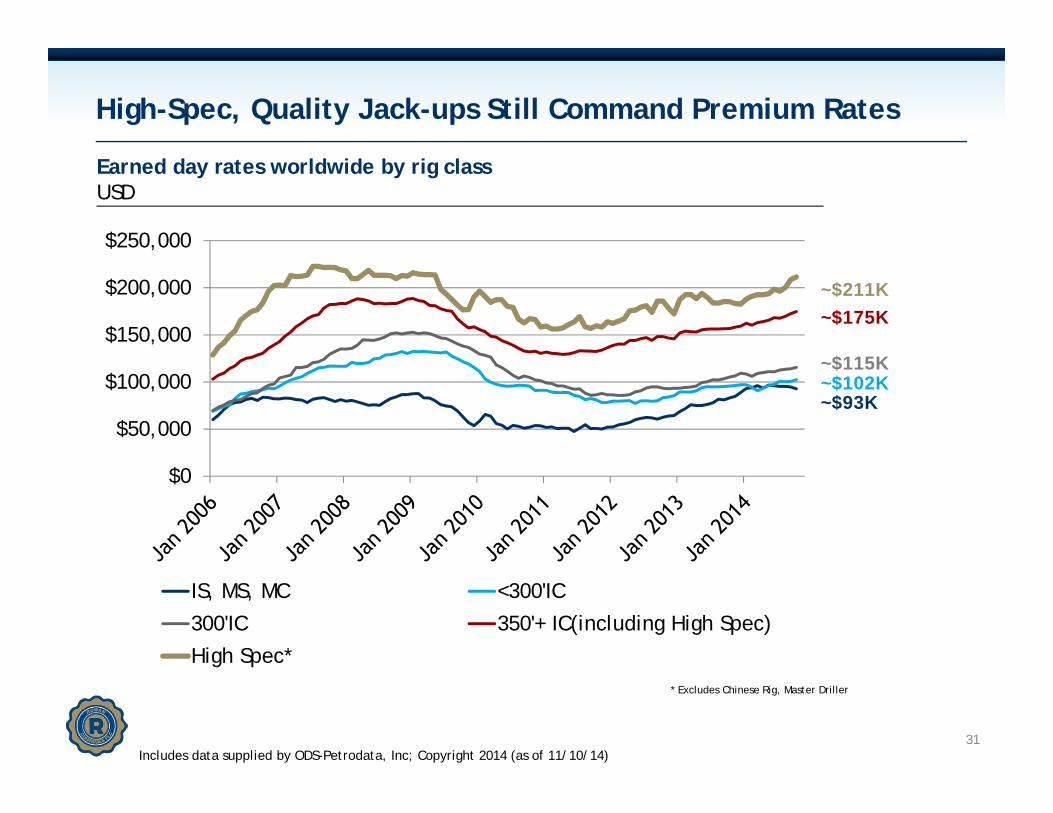
High-Spec, Quality Jack-ups Still Command Premium Rates
$0
$50,000
$100,000
$150,000
$200,000
$250,000
IS, MS, MC <300'IC
300'IC 350'+ IC(including High Spec)
High Spec** Excludes Chinese Rig, Master Driller
Includes data supplied by ODS-Petrodata, Inc; Copyright 2014 (as of 11/10/14)
~$211K
~$93K~$102K~$115K
~$175K
Earned day rates worldwide by rig classUSD
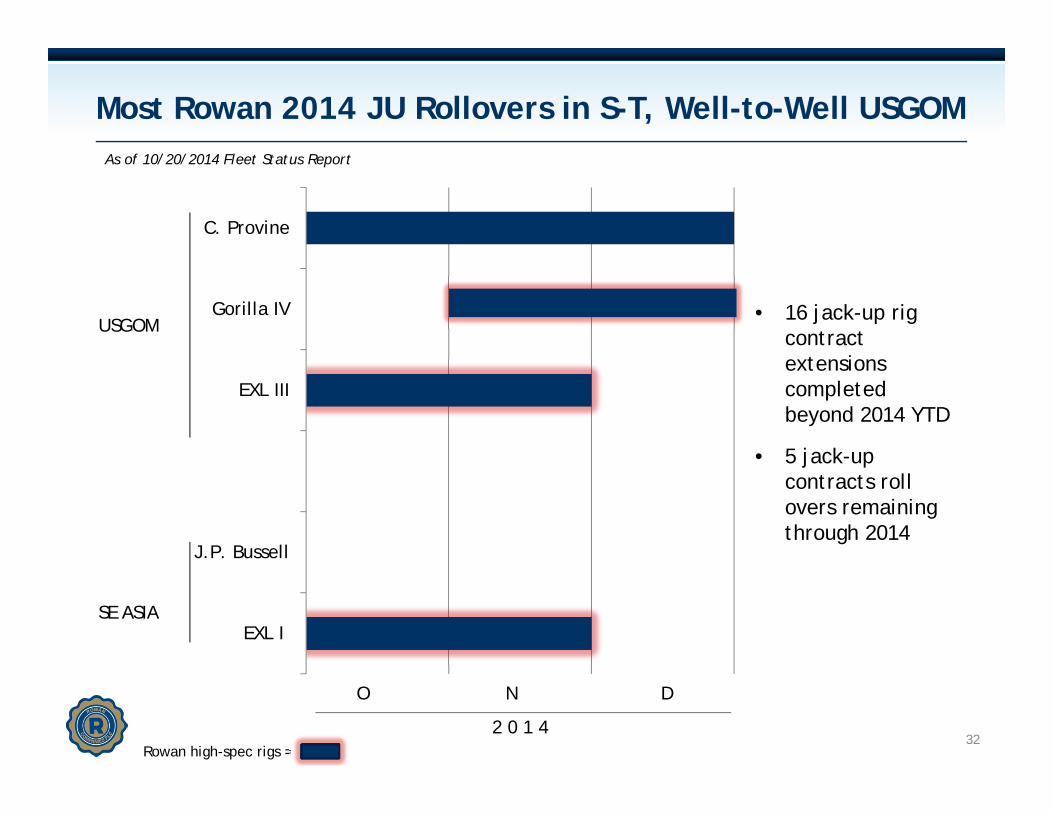
EXL I
J.P. Bussell
EXL III
Gorilla IV
C. Provine
Most Rowan 2014 JU Rollovers in S-T, Well-to-Well USGOM
32
O N D
2 0 1 4
As of 10/20/2014 Fleet Status Report
USGOM
SE ASIA
• 16 jack-up rig contract extensions completed beyond 2014 YTD
• 5 jack-up contracts roll overs remaining through 2014
Rowan high-spec rigs =
3333
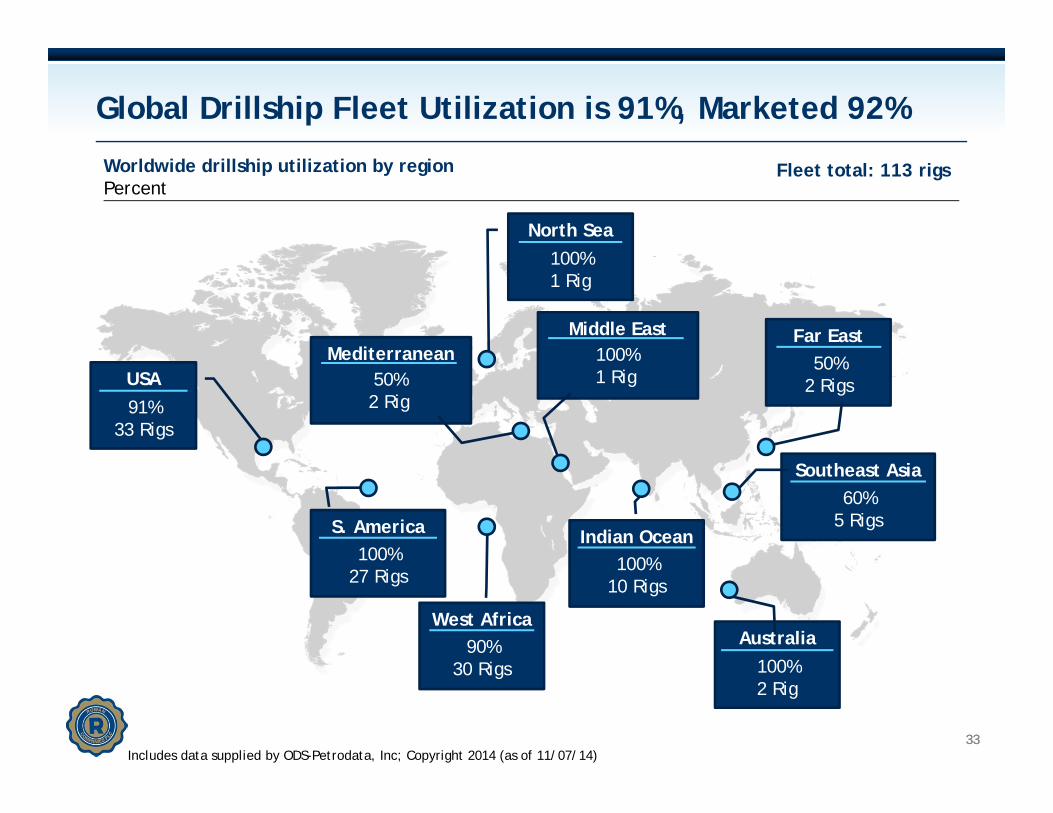
Global Drillship Fleet Utilization is 91%, Marketed 92%
USA
Indian Ocean
North Sea
Middle East Far East
Southeast Asia
S. America
West AfricaAustralia
91%33 Rigs
100%27 Rigs
90%30 Rigs
100%10 Rigs
100%2 Rig
60%5 Rigs
50%2 Rigs
100%1 Rig
100%1 Rig
Includes data supplied by ODS-Petrodata, Inc; Copyright 2014 (as of 11/07/14)
Mediterranean50%2 Rig
Fleet total: 113 rigsWorldwide drillship utilization by regionPercent
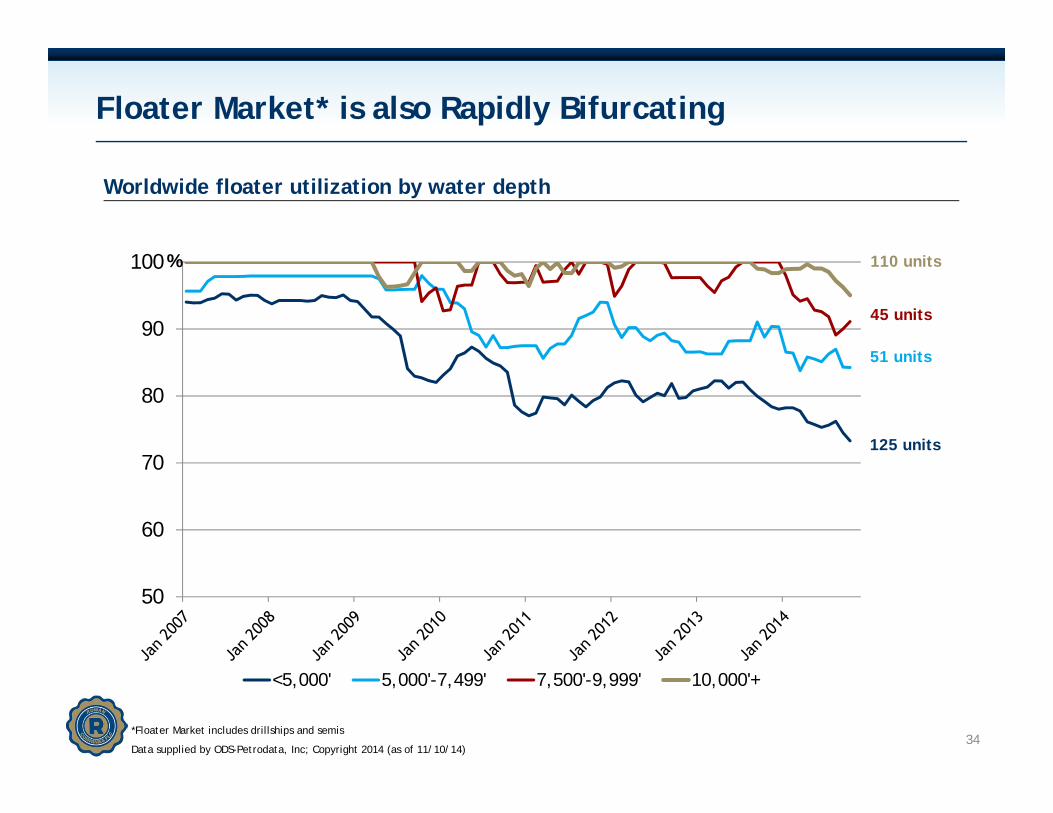
Floater Market* is also Rapidly Bifurcating
34
50
60
70
80
90
100
<5,000' 5,000'-7,499' 7,500'-9,999' 10,000'+
%
*Floater Market includes drillships and semis
Data supplied by ODS-Petrodata, Inc; Copyright 2014 (as of 11/10/14)
110 units
45 units
51 units
125 units
Worldwide floater utilization by water depth
35
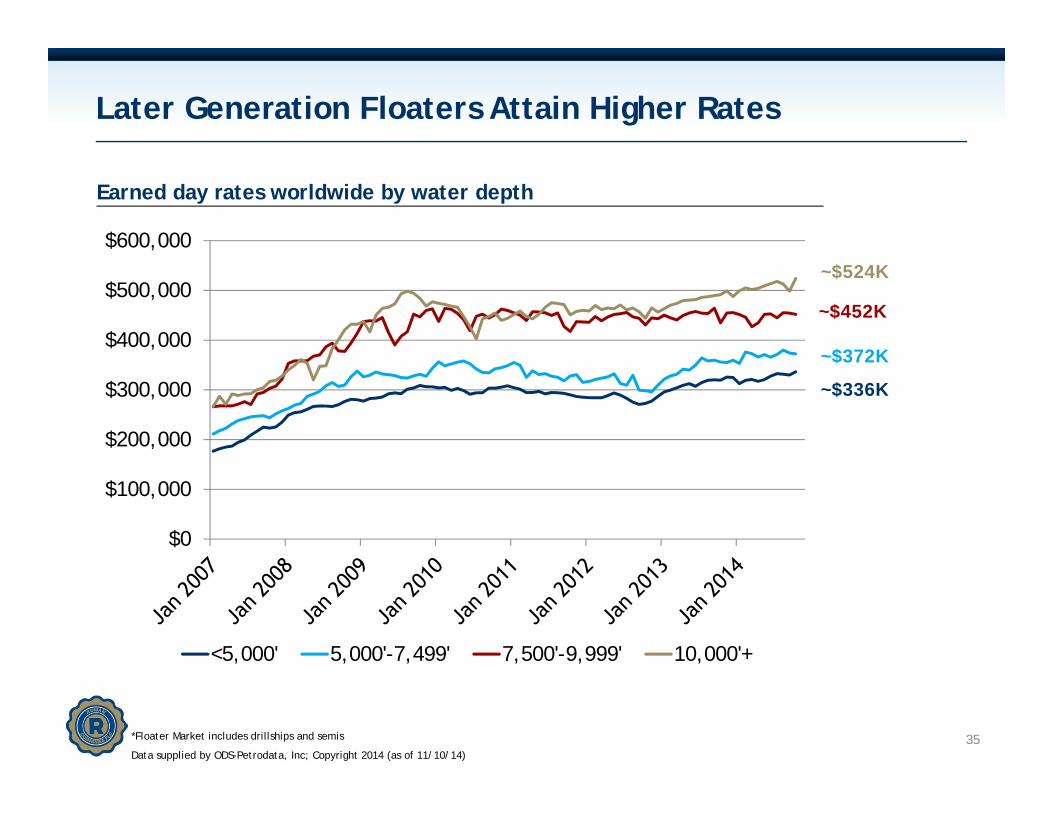
Later Generation Floaters Attain Higher Rates
$0
$100,000
$200,000
$300,000
$400,000
$500,000
$600,000
<5,000' 5,000'-7,499' 7,500'-9,999' 10,000'+
~$524K
~$336K
~$372K
~$452K
Earned day rates worldwide by water depth
*Floater Market includes drillships and semis
Data supplied by ODS-Petrodata, Inc; Copyright 2014 (as of 11/10/14)
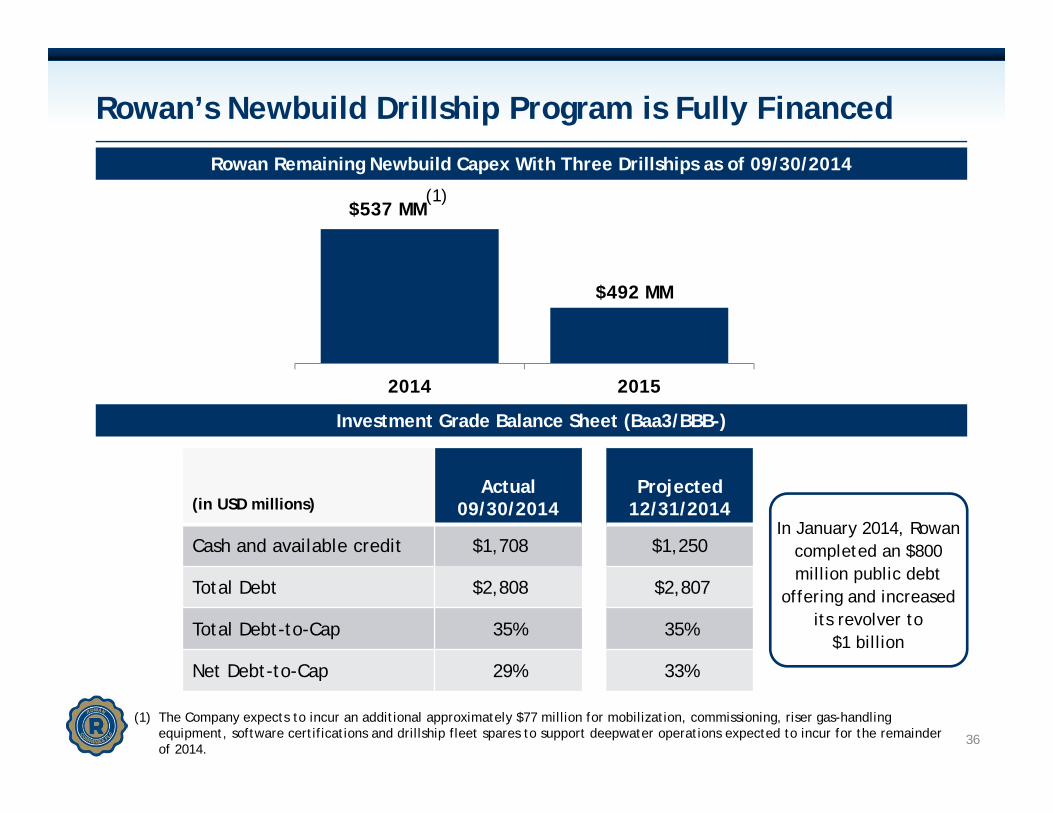
Rowan’s Newbuild Drillship Program is Fully Financed
(in USD millions)Actual
09/30/2014Projected
12/31/2014
Cash and available credit $1,708 $1,250
Total Debt $2,808 $2,807
Total Debt-to-Cap 35% 35%
Net Debt-to-Cap 29% 33%
36
Investment Grade Balance Sheet (Baa3/BBB-)
Rowan Remaining Newbuild Capex With Three Drillships as of 09/30/2014
$492 MM
2014 2015
$537 MM
In January 2014, Rowan completed an $800 million public debt
offering and increased its revolver to
$1 billion
(1) The Company expects to incur an additional approximately $77 million for mobilization, commissioning, riser gas-handling equipment, software certifications and drillship fleet spares to support deepwater operations expected to incur for the remainder of 2014.
(1)
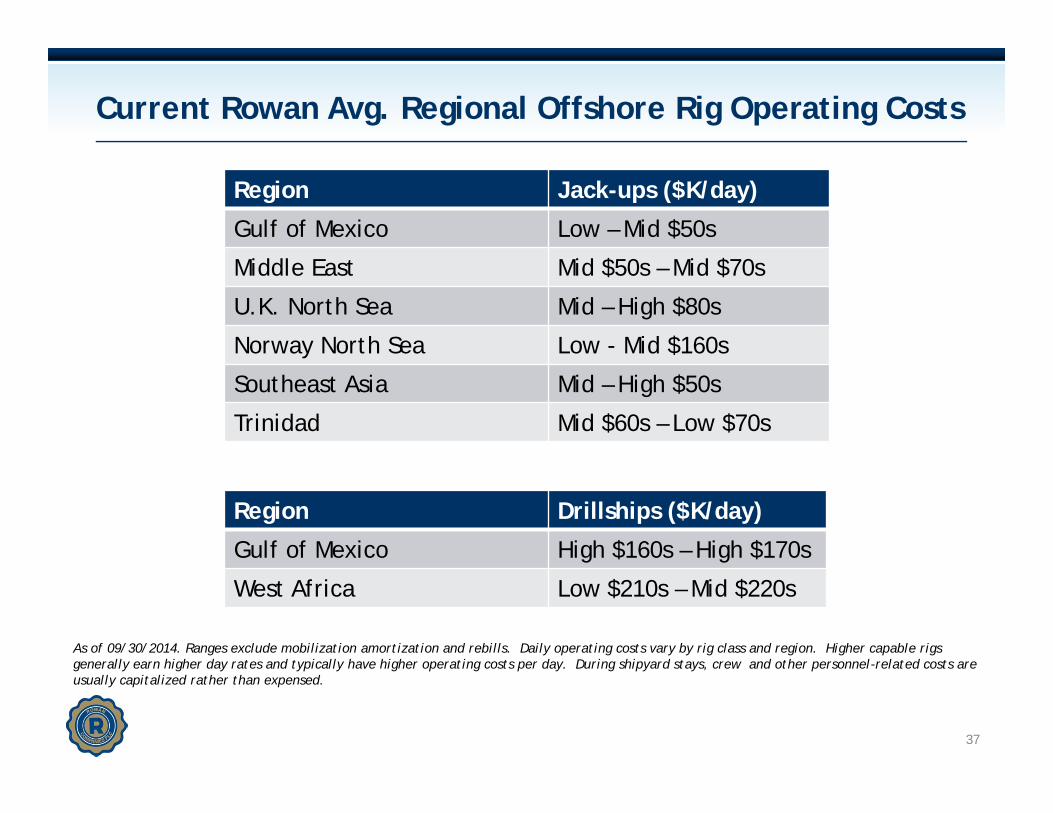
Current Rowan Avg. Regional Offshore Rig Operating Costs
37
Region Jack-ups ($K/day)
Gulf of Mexico Low – Mid $50s
Middle East Mid $50s – Mid $70s
U.K. North Sea Mid – High $80s
Norway North Sea Low - Mid $160s
Southeast Asia Mid – High $50s
Trinidad Mid $60s – Low $70s
As of 09/30/2014. Ranges exclude mobilization amortization and rebills. Daily operating costs vary by rig class and region. Higher capable rigs generally earn higher day rates and typically have higher operating costs per day. During shipyard stays, crew and other personnel-related costs are usually capitalized rather than expensed.
Region Drillships ($K/day)
Gulf of Mexico High $160s – High $170s
West Africa Low $210s – Mid $220s
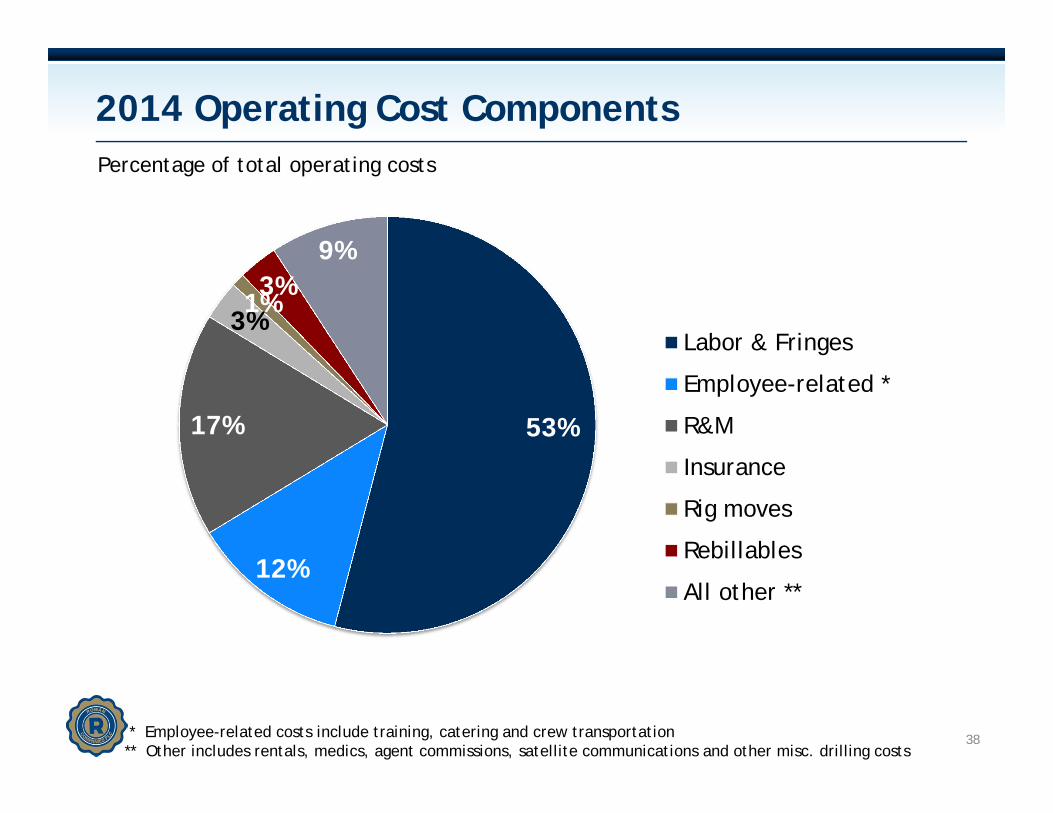
2014 Operating Cost Components
38
53%
12%
17%
3%1%3%
9%
Labor & Fringes
Employee-related *
R&M
Insurance
Rig moves
Rebillables
All other **
* Employee-related costs include training, catering and crew transportation** Other includes rentals, medics, agent commissions, satellite communications and other misc. drilling costs
Percentage of total operating costs
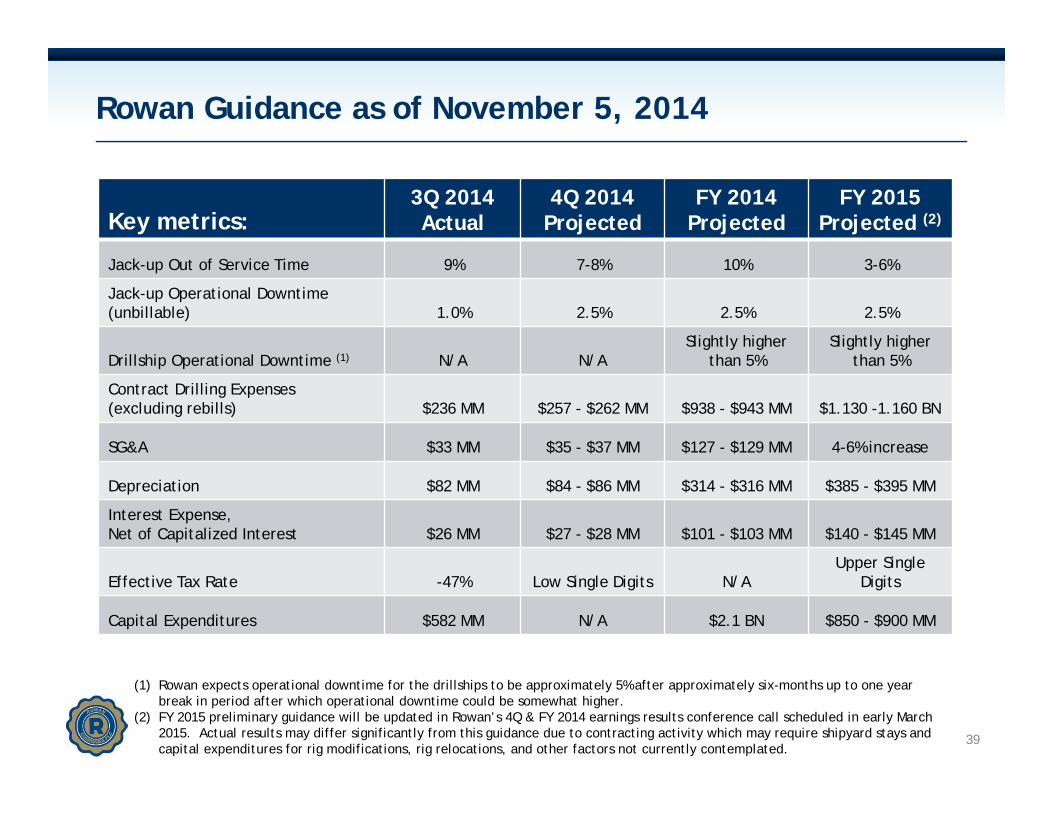
Rowan Guidance as of November 5, 2014
Key metrics:3Q 2014Actual
4Q 2014Projected
FY 2014Projected
FY 2015Projected (2)
Jack-up Out of Service Time 9% 7-8% 10% 3-6%
Jack-up Operational Downtime (unbillable) 1.0% 2.5% 2.5% 2.5%
Drillship Operational Downtime (1) N/A N/ASlightly higher
than 5%Slightly higher
than 5%
Contract Drilling Expenses (excluding rebills) $236 MM $257 - $262 MM $938 - $943 MM $1.130 -1.160 BN
SG&A $33 MM $35 - $37 MM $127 - $129 MM 4-6% increase
Depreciation $82 MM $84 - $86 MM $314 - $316 MM $385 - $395 MM
Interest Expense,Net of Capitalized Interest $26 MM $27 - $28 MM $101 - $103 MM $140 - $145 MM
Effective Tax Rate -47% Low Single Digits N/AUpper Single
Digits
Capital Expenditures $582 MM N/A $2.1 BN $850 - $900 MM
39
(1) Rowan expects operational downtime for the drillships to be approximately 5% after approximately six-months up to one year break in period after which operational downtime could be somewhat higher.
(2) FY 2015 preliminary guidance will be updated in Rowan’s 4Q & FY 2014 earnings results conference call scheduled in early March 2015. Actual results may differ significantly from this guidance due to contracting activity which may require shipyard stays and capital expenditures for rig modifications, rig relocations, and other factors not currently contemplated.
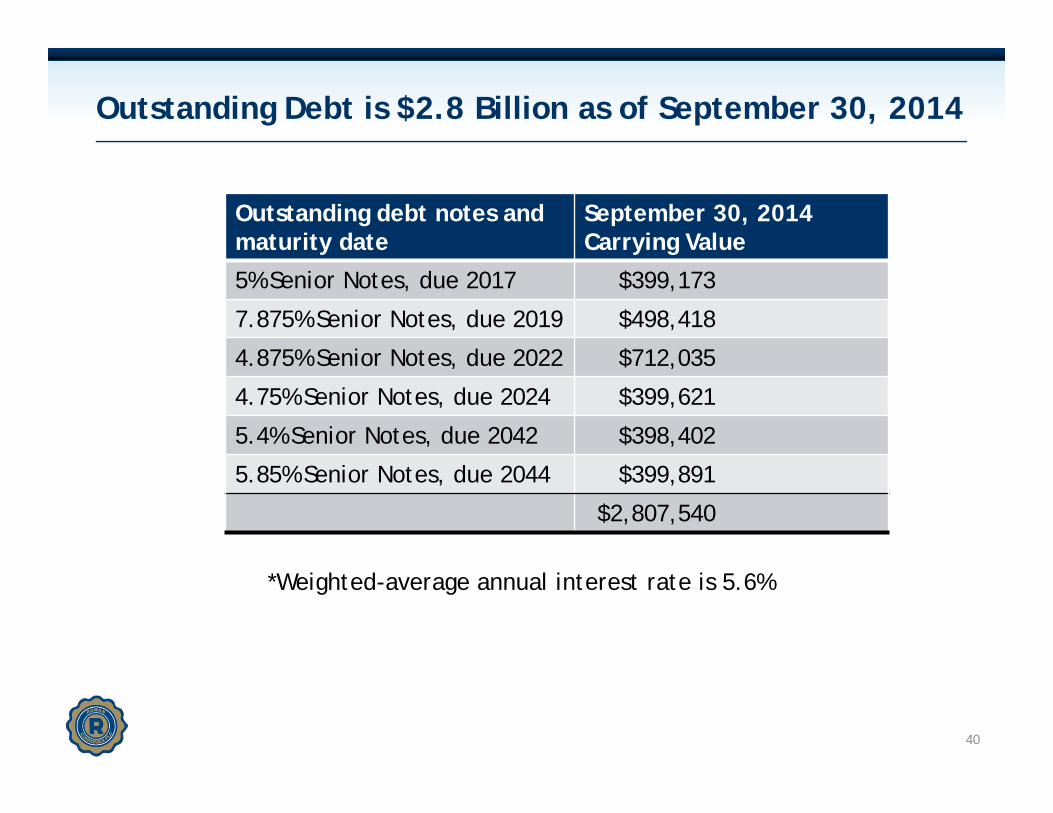
Outstanding Debt is $2.8 Billion as of September 30, 2014
Outstanding debt notes and maturity date
September 30, 2014Carrying Value
5% Senior Notes, due 2017 $399,173
7.875% Senior Notes, due 2019 $498,418
4.875% Senior Notes, due 2022 $712,035
4.75% Senior Notes, due 2024 $399,621
5.4% Senior Notes, due 2042 $398,402
5.85% Senior Notes, due 2044 $399,891
$2,807,540
40
*Weighted-average annual interest rate is 5.6%
Glossary of Terms and Acronyms
Blowout Preventer (BOP): An emergency shut-off device comprised of a series, or “stack”, of valves that shut the wellbore in the event that hydrocarbons enter the wellbore and pressure containment is compromised. The BOP is intended to serve as a pressure control system of last resort.
Cold-stacked Rig: An offshore rig that is not actively marketed and is completely down-manned. Cold stacked rigs generally require significant time and capital expenditures to reactivate.
Day rate Contract: A contractual agreement where a drilling contractor is paid a daily rate. Customer carries majority of the operating risk so long as the drilling contractor meets the basic standards of equipment and personnel specified by the contract.
Estimated Planned Off Rate Time: Defined by Rowan as those days where a rig will not be available to earn any revenue due to shipyard, transit, inspection periods, or suspension of operations.
High-specification Rig: Defined by Rowan as rigs with a two million pound or greater hook-load capacity.
Hook-load: A commonly used metric to define the lifting capacity of a rigs derrick system.
Operational Downtime: When a rig is under contract and unable to conduct planned operations due to equipment breakdowns or procedural failures. Operational downtime will result in a related revenue reduction. The company expects operational downtime to account for approximately 2.5% of in-service days.
Out-of-Service Days (OOS): Include days for which no revenues are recognized other than operational downtime and stacked days (cold-stacked days or off rate between contracts). The company may be compensated for certain out-of service days, such as for shipyard stays or for transit periods preceding a contract; however recognition of any such compensation received is deferred and recognized over the period of drilling operations.
Utilization: A rate that specifies the percentage of time that a rig (or fleet of rigs) earned day rate in a specified period.
41
Investor Contact:Suzanne M. SperaDirector, Investor [email protected]
Rowan Companies
2800 Post Oak Blvd.Suite 5450Houston, TX 77056713.621.7800www.rowancompanies.com