Embed Size (px)
Citation preview

InvestorpresentationMay 2015

Table of contents
(2)
Cautionary noteCertain statements included within this announcement contain forward-looking information, including, without limitation, those relating to (a) forecasts, projections and estimates, (b) statements of management’s plans, objectives and strategies for Hydro, such as planned expansions, investments or other projects, (c) targeted production volumes and costs, capacities or rates, start-up costs, cost reductions and profit objectives, (d) various expectations about future developments in Hydro’s markets, particularly prices, supply and demand and competition, (e) results of operations, (f) margins, (g) growth rates, (h) risk management, as well as (i) statements preceded by “expected”, “scheduled”, “targeted”, “planned”, “proposed”, “intended” or similar statements.
Although we believe that the expectations reflected in such forward-looking statements are reasonable, these forward-looking statements are based on a number of assumptions and forecasts that, by their nature, involve risk and uncertainty. Various factors could cause our actual results to differ materially from those projected in a forward-looking statement or affect the extent to which a particular projection is realized. Factors that could cause these differences include, but are not limited to: our continued ability to reposition and restructure our upstream and downstream aluminium business; changes in availability and cost of energy and raw materials; global supply and demand for aluminium and aluminium products; world economic growth, including rates of inflation and industrial production; changes in the relative value of currencies and the value of commodity contracts; trends in Hydro’s key markets and competition; and legislative, regulatory and political factors.
No assurance can be given that such expectations will prove to have been correct. Hydro disclaims any obligation to update or revise any forward-looking statements, whether as a result of new information, future events or otherwise.
First quarter results 2015 3
Market 34
Business overview 45
> Hydro - Group 46
> Bauxite & Alumina 57
> Primary Metal 66
> Metal Markets 72
> Rolled Products 76
> Sapa joint venture 82
> Energy 85
Additional information 90

(3)
Q1 2015
(4)
• Record-high quarterly underlying EBIT of NOK 3 208 million• Higher sales throughout the value chain• Positive currency developments• Acquisition of advanced sorting technology in Germany• Reduced market tightness due to Chinese semis exports
Q1 highlights

(2 000)
(1 000)
0
1 000
2 000
3 000
4 000
Jan-09 Apr-10 Jul-11 Oct-12 Jan-1415 000
20 000
25 000
30 000
Jan-08 May-09 Sep-10 Jan-12 May-13 Sep-14
Demand Production
Source: CRU/Hydro* Yearly rolling average of quarterly annualized production less demand
• YTD aluminium demand growth of 1.5 % − North America ~5%− Europe ~0%− Asia ~5%− Central and South America (~5%)
Aluminium demand continues to exceed production
(5)
Demand and production (quarterly annualized)1 000 mt primary aluminium
World ex-China
Production less demand*1 000 mt primary aluminium
Mar-15 Mar-15
• Expect ~3% demand growth 2015• Production deficit around 1 million tonnes

0
20
40
60
80
100
120
0
1 000
2 000
3 000
4 000
5 000
6 000
7 000
8 000
Q1 05 Q3 07 Q1 10 Q3 12 Q1 15
IAI Other LME World ex. China inventory days
Reported inventories world ex-China decline further
(6)
Source: CRU/Hydro
Reported primary aluminium inventories1 000 mt Days
Warehouse rules in effect as of 1st of February 2015
Stock levels Detroit and VlissingenMillion tonnes Queue days
Vlissingen Detroit
400
450
500
550
600
650
700
750
800
0.6
0.8
1.0
1.2
1.4
1.6
1.8
2.0
2.2
2.4
May
-14
Jun-
14
Jul-1
4
Aug-
14
Sep-
14
Oct
-14
Nov
-14
Dec
-14
Jan-
15
Feb-
15
Mar
-15
Apr
-15

Global primary aluminium market slightly oversupplied
(7)
Demand and production (quarterly annualized)1 000 mt primary aluminium
15 000
20 000
25 000
30 000
35 000
40 000
45 000
50 000
55 000
60 000
Jan-08 May-09 Sep-10 Jan-12 May-13 Sep-14
Demand Production
Chinese overproduction exceeds World ex-China deficit
(2 000)
(1 000)
0
1 000
2 000
3 000
4 000
5 000
Jan-09 Apr-10 Jul-11 Oct-12 Jan-14
Production less demand*1 000 mt primary aluminium
• Expect ~6% demand growth 2015• Production surplus around 0.5 million tonnesMar-15
Source: CRU/Hydro* Yearly rolling average of quarterly annualized production less demand
Mar-15

Chinese exports decline from high levels in December amid reduced metal advantage
0
50
100
150
200
250
300
350
400
450
500
Jan-07 Oct-07 Jul-08 Apr-09 Jan-10 Oct-10 Jul-11 Apr-12 Jan-13 Oct-13 Jul-14 Apr-15( 400)
( 200)
0
200
400
600
800
1 000
Semis exports (Left axis) Chinese competitive adv. downstream* (Right axis)
Comp. adv. (USD/mt)
Semis exports(monthly, kmt)
* Est. metal cost China versus EuropeEurope: LME cash + European duty-paid standard ingot premiumChina: SHFE cash + avg. local premium + freight – export rebates (~13 %)
Source: CRU/Ecowin
Impr
oved
com
p. a
dv. C
hina

Standard ingot premiums fall sharply
Source: Metal Bulletin, Platts
Regional standard ingot premiumsUSD per mt
0
100
200
300
400
500
600
Jan-08 Mar-09 May-10 Jul-11 Sep-12 Nov-13 Jan-15
US Mid West Japan Europe (duty-paid)
• US Mid-West and EU duty-paid ingot premium falling to currently ~320 and 220 USD/mt, respectively
• Japan premium at 425 USD/mt in Q1, negotiations for Q2 at ~380 USD/mt
• Current Japanese spot ingot premium at ~270 USD/mt
(9)
Apr-15

Value-added premiums come down with standard ingotHydro realizes premiums on 1-2 month time lag
(10)
0
100
200
300
400
500
600
700
800
900
Jan-08 Jul-09 Jan-11 Jul-12 Jan-14
EI over ingot Ingot DDP Premium Indicator Metal Bulletin Billet Premium Indicator
Source: Metal Bulletin, Hydro
USD per mt
Apr-15
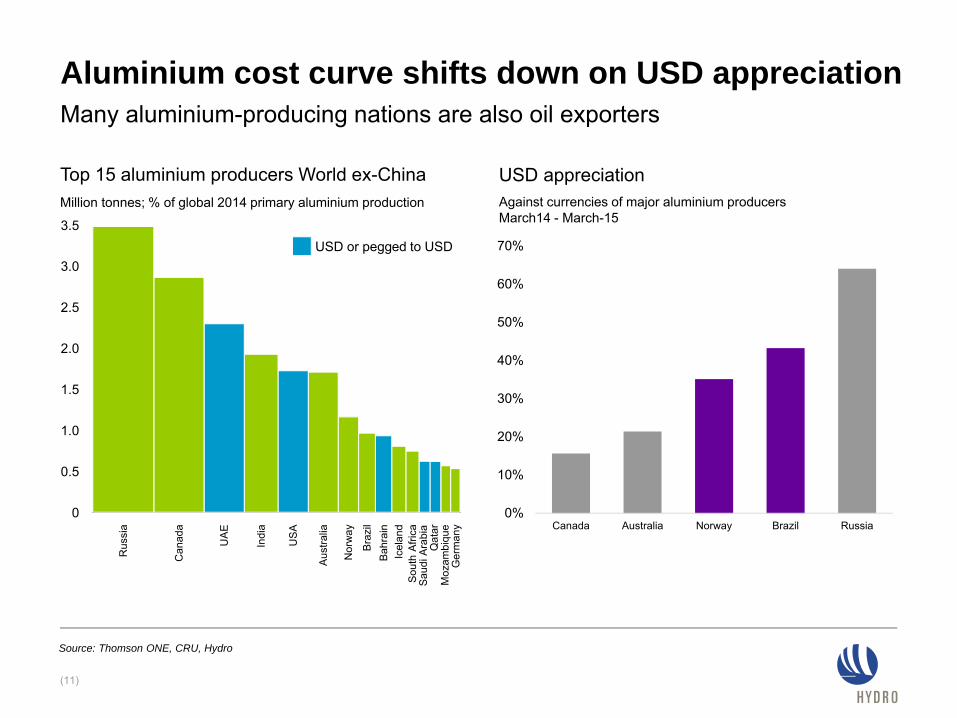
Aluminium cost curve shifts down on USD appreciationMany aluminium-producing nations are also oil exporters
(11)
Top 15 aluminium producers World ex-ChinaMillion tonnes; % of global 2014 primary aluminium production
USD appreciation Against currencies of major aluminium producers March14 - March-15
Source: Thomson ONE, CRU, Hydro
0
1.0
2.0
3.5
2.5
1.5
3.0
0.5
UA
E
Bra
zil
Nor
way
Indi
a
Aus
tralia
US
A
Icel
and
Moz
ambi
que
Sau
di A
rabi
a
Ger
man
y
Qat
ar
Bah
rain
Can
ada
Sou
th A
frica
Rus
sia
USD or pegged to USD
0%
10%
20%
30%
40%
50%
60%
70%
Canada Australia Norway Brazil Russia

Decline in all-in ingot price partly offset by weak NOK
(12)
USD/mt
Source: Metal Bulletin, MW/MJP: Platts, Reuters Ecowin* LME three month average
• 3-month LME price traded between 1 747 and 1 890 USD/mt during Q1
Primary aluminium LME* USD/mt NOK/mt
Q1 2015 averageQ1 2015 end
1 8131 790
14 06214 425
Q4 2014 averageQ4 2014 end
1 9741 859
13 56713 890
12 000
13 000
14 000
15 000
16 000
17 000
18 000
1 500
1 700
1 900
2 100
2 300
2 500
2 700
2 900
3 100
Jan 11 Jun 12 Nov 13 Apr 15
LME cashLME cash + Europe duty paidLME cash + Europe duty paid NOK (RHS)
NOK/mt

(13)
Resilient alumina prices, bauxite source diversification continues
Platts alumina index (PAX)PercentUSD/mt
12%
13%
14%
15%
16%
17%
18%
19%
20%
200
250
300
350
400
450
Aug 2010 Apr 2012 Nov 2013
PAX % of LME
Mar 2015
Source: Platts, Ecowin, China Customs,* Based on actual Q1 2015 annualized
Chinese bauxite imports by origin
0
10
20
30
40
50
60
70
80
2011 2012 2013 2014 2015e *
Indonesia Australia India Malaysia Other Pacific Atlantic
Million tonnes

15.3% 15.1% 16.1% LME%3)
269 303 300 Price2)
Lower implied alumina cost on currency developments
Q1 2014 Q4 2014 Q1 2015
Implied alumina cost and margin, USD/mt 1)• USD 4 per mt reduction in implied alumina cost from fourth quarter− BRL weakens 12% against USD from Q4
to Q1− Lower Paragominas production driven by
extended ball mill maintenance− Ball mill now back in operation
• “From B to A” improvement program progressing ahead of plan
• ICMS deferral for aluminium industry in Pará to be revisited in July 2015− Dialog ongoing
1) Realized alumina price minus underlying EBITDA for B&A, per mt alumina sales2) Realized alumina price3) Realized alumina price as % of three month LME price with one month lag
Implied EBITDA cost per mt
475
259
425
EBITDA margin per mt
10
229
74
225
75
(14)

2 174 2 574 2 510 All-in3)
1 749 1 997 1 897 LME4)
Q1 2014 Q4 2014 Q1 2015
Stable all-in implied primary aluminium cost
All-in implied primary cost and margin, USD/mt 1) • Developments Q1 vs Q4‒ Improvement efforts‒ Positive currency development‒ Increasing raw material costs
• USD 180 JV program on track, to be concluded by end-2016‒ USD 120 delivered by end-2014
1) Realized all-in aluminium price minus underlying EBITDA margin, including Qatalum, per mt aluminium sold. 2) Realized LME aluminium price minus underlying EBITDA margin, including Qatalum, per mt primary aluminium produced. 3) Realized LME plus realized premiums, including Qatalum4) Realized LME, including Qatalum
LME Implied EBITDA cost per mt
1 900
All-in EBITDA margin per mt
275
1 775
800
1 800
700
(15)
1 150 2)
1 400 2)
1 175 2)
All-in Implied EBITDA cost per mt

Strengthening recycling position towards carbon neutrality
(16)
• WMR Recycling acquired April 1‒ World’s most advanced sorting technology‒ 36 000 tonnes annual sorting capacity‒ To supply Hydro remelters‒ Located in Dormagen, Germany
• Technology to be used in Hydro’s recycling facility for used beverage cans
• Part of Hydro’s 2020 carbon neutrality ambition
Q1 2015 vs Q4 2014 Q1 2015 vs Q1 2014
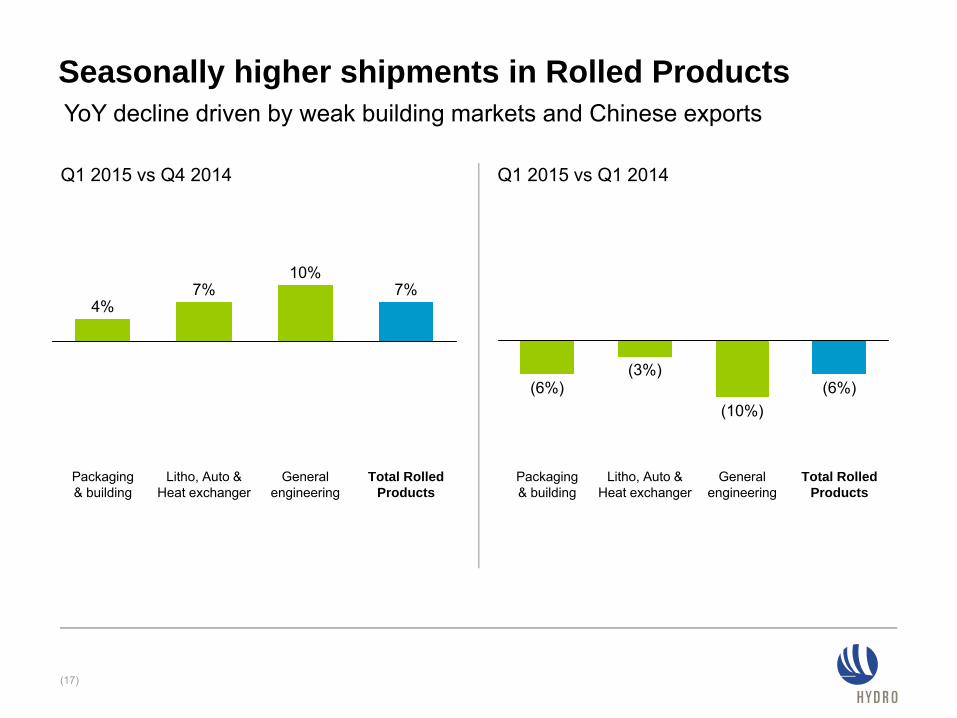
Seasonally higher shipments in Rolled Products
(17)
YoY decline driven by weak building markets and Chinese exports
Litho, Auto & Heat exchanger
General engineering
7%
Total Rolled Products
10%
Packaging & building
7%4%
(3%)(6%)
General engineering
(10%)
Packaging & building
Total Rolled Products
Litho, Auto & Heat exchanger
(6%)

(18)
• Seasonally stronger demand− 10% increase in North America− 9% increase in Europe
• Demand increased compared to same quarter last year− 11% in North America due to increased
building activity and strong automotive demand
− Stable in Europe, weak building activity continues
Seasonally stronger demand for extruded products

• Partnership to supply structural aluminium tubing− Also provide ongoing development support
for future extrusion applications
• Ford F 150 2015 Model− Aluminium-alloy body− ~700 pounds lighter than 2014 model
Sapa JV delivers solutions to Ford F-150
(19)
World’s most selling vehicle
Picture with courtesy of Ford Motors

0
100
200
300
400
500
600
1 4 7 10 13 16 19 22 25 28 31 34 37 40 43 46 49 52
201320142015
0
20
40
60
80
100
1 4 7 10 13 16 19 22 25 28 31 34 37 40 43 46 49 52
MIN NO2 (2002-2013)MAX NO2 (2002-2013)201320142015
(20)
Water reservoir levels Southwestern Norway (NO2)PercentNOK/MWh
Energy price NOK/MWh Q1 2015 Q4 2014 Reservoir levels Mar 31, 2015 Dec 30, 2014
Southwestern Norway (NO2)
System
238
246
248
264
Southwestern Norway (NO2)
Norway
42.7%
37.8%
77.6%
68.8%
Source: Nordpool and NVE
Market price Southwestern Norway (NO2)
Energy: High snow reservoirs, low power prices
Week Week
(20)

Record results on higher sales and currency tailwinds
(21)
NOK billion
3.2
0.9
2.9
Underlying EBIT Q1-2015
Volumes OtherUnderlying EBIT Q1-2014
Underlying EBIT Q4-2014
Net currency Cost
(0.3)
(0.3)(0.2)
0.2
0.8
Prices and margins
(22)
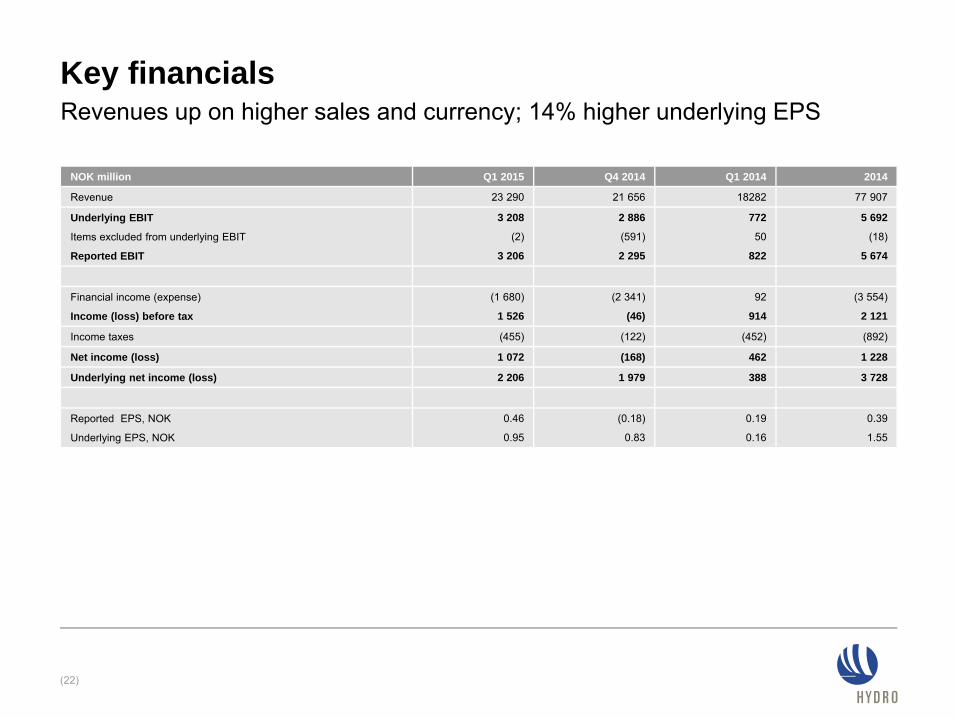
Key financials
NOK million Q1 2015 Q4 2014 Q1 2014 2014
Revenue 23 290 21 656 18282 77 907
Underlying EBIT
Items excluded from underlying EBIT
Reported EBIT
3 208
(2)
3 206
2 886
(591)
2 295
772
50
822
5 692
(18)
5 674
Financial income (expense)
Income (loss) before tax
(1 680)
1 526
(2 341)
(46)
92
914
(3 554)
2 121
Income taxes (455) (122) (452) (892)
Net income (loss) 1 072 (168) 462 1 228
Underlying net income (loss) 2 206 1 979 388 3 728
Reported EPS, NOK
Underlying EPS, NOK
0.46
0.95
(0.18)
0.83
0.19
0.16
0.39
1.55
Revenues up on higher sales and currency; 14% higher underlying EPS
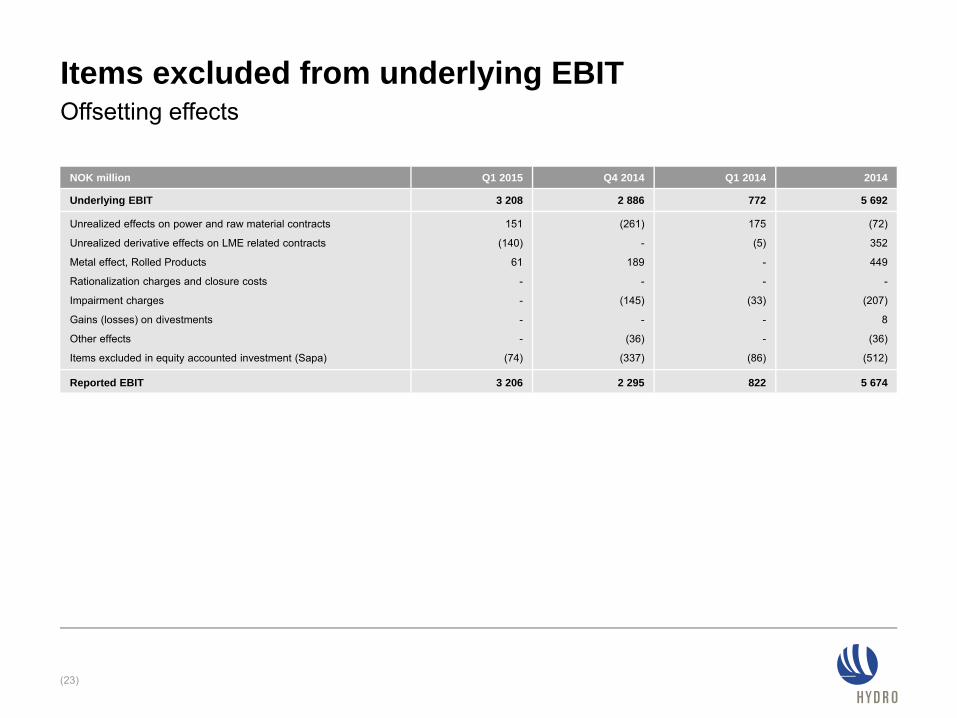
(23)
NOK million Q1 2015 Q4 2014 Q1 2014 2014
Underlying EBIT 3 208 2 886 772 5 692
Unrealized effects on power and raw material contracts
Unrealized derivative effects on LME related contracts
Metal effect, Rolled Products
Rationalization charges and closure costs
Impairment charges
Gains (losses) on divestments
Other effects
Items excluded in equity accounted investment (Sapa)
151
(140)
61
-
-
-
-
(74)
(261)
-
189
-
(145)
-
(36)
(337)
175
(5)
-
-
(33)
-
-
(86)
(72)
352
449
-
(207)
8
(36)
(512)
Reported EBIT 3 206 2 295 822 5 674
Items excluded from underlying EBITOffsetting effects

Bauxite & Alumina
(24)
780
(24)
Key figuresQ1
2015Q4
2014Q1
2014
Alumina production, kmt 1 451 1 501 1 428
Total alumina sales, kmt 2 136 2 043 1 906
Realized alumina price, USD/mt 300 303 269
Implied alumina cost, USD/mt 225 229 258
Bauxite production, kmt 2 136 2 582 2 242
Underlying EBITDA, NOK million 1 240 1 046 122
Underlying EBIT, NOK million 780 528 (288)
(55)
NOK millionUnderlying EBIT
• Higher alumina sales volumes and index exposure• Lower bauxite production due to extended maintenance• Positive contribution from currency developments
• Lower alumina sales volumes • Reduced index exposure • Lower contribution from Reintegra
Q1 results
Outlook
780
(288) (269)
(26)
528
2014 2015
Higher alumina sales on index and currency developments lift results

(25)
Primary Metal
Key figuresQ1
2015Q4
2014Q1
2014
Primary aluminium production, kmt 497 499 484
Total sales, kmt 534 527 593
Realized LME price, USD/mt 1 897 1 997 1 749
Realized LME price, NOK/mt 14 383 13 355 10 702
Realized premium, USD/mt 614 575 422
Implied all-in primary cost, USD/mt * 1 800 1 775 1 900
Underlying EBITDA, NOK million 2 522 2 489 753
Underlying EBIT, NOK million 2 012 1 989 312
3 937 2 012
NOK millionUnderlying EBIT • Higher realized all-in metal prices in NOK lifted results by
~MNOK 700 • Seasonally higher sales volumes added ~ MNOK 100 • Higher costs reduced results by ~MNOK 600
• About 50 % of primary production affecting Q2 2015 results priced at ~USD 1 800 per mt, ex. Qatalum
• About 50% of premiums affecting Q2 booked at ~USD 650 per mt, ex. Qatalum
Outlook
312 420
1 216
2015
1 989
2014
2 012
* Realized all-in aluminium price minus underlying EBITDA margin, including Qatalum, per mtaluminium sold. Figures for 2014 have been restated due to a change in definition.
Q1 results
Higher realized all-in price partly offset by higher raw material cost

(26)
Qatalum results down on lower sales
Key figures – Qatalum (50%)Q1
2015Q4
2014Q1
2014
Revenue, NOK million 1 492 1 510 1 087
Underlying EBITDA, NOK million 585 614 342
Underlying EBIT, NOK million 305 371 115
Underlying Net income (loss), NOK million 246 317 75
Primary aluminium production, kmt 76 77 76
Casthouse sales, kmt 77 85 83
• Underlying net income decreased by NOK 71 million from Q4 2014 driven mainly by lower sales volumes

(27)
Metal Markets
Key figuresQ1
2015Q4
2014Q1
2014
Remelt production, kmt 145 130 139
Metal products sales, kmt 1) 626 654 776
Underlying EBITDA, NOK million 47 243 157
Underlying EBIT excl currency and inventory valuation effects, NOK million 2) 60 130 156
Underlying EBIT, NOK million 24 221 141
634 24
NOK millionUnderlying EBIT
• Seasonally higher volumes and improved margins at remelters• Negative result from sourcing and trading activities due to
falling standard ingot premiums• NOK 36 million in negative currency and ingot inventory
valuation effects vs NOK 92 million positive in Q4
• Higher sales volumes at remelters • Volatile trading and currency effects
24
141
100
171
221
2014 2015
Outlook
1) Includes external and internal sales from primary casthouse operations, remelters and third party metal sources. Sales volumes for 2014 have been restated.2) Currency effects for 2014 have been restated
Q1 results
Weak sourcing and trading performance hides strong results at remelters

(28)
Rolled Products
(28)
Key figuresQ1
2015Q4
2014Q1
2014
External sales volumes, kmt 227 213 243
Underlying EBITDA, NOK million 465 280 351
Underlying EBIT, NOK million 292 96 181
698 292
NOK millionUnderlying EBIT
• Seasonally higher shipments• Improved operating margins• Positive currency effect on USD sales
• Seasonally higher sales • Lower margins• Rheinwerk result determined by the LME and premium
development
Outlook
292
181 177
243
96
2014 2015
Q1 results
Higher shipments, margins and currency gains lift results

(29)
Energy
Key figuresQ1
2015Q4
2014Q1
2014
Power production, GWh 3 071 2 823 2 964
Net spot sales, GWh 1 610 1 339 1 581
Southwest Norway spot price (NO2), NOK/MWh 238 248 249
Underlying EBITDA, NOK million 429 402 474
Underlying EBIT, NOK million 382 360 435
• Seasonal high power production supported by high snow levels• Increased production costs• Lower spot prices
• Continuously high snow levels • Lower production costs
1 197 382
NOK millionUnderlying EBIT
Outlook 382
435
169234
360
2014 2015
Q1 results
High production partly offset by lower market prices

(30)
Improvement in Sapa JV results beyond seasonality
Key figures – Sapa (50%)Q1
2015Q4
2014Q1
2014
Revenue, NOK million 7 067 5 945 5 673
Underlying EBITDA, NOK million 353 171 220
Underlying EBIT, NOK million 196 (27) 78
Underlying Net income (loss), NOK million 119 (22) 35
Sales volumes (kmt) 177 161 180
• Results improved compared to the previous quarter as well as same quarter last year driven by:− Strong North-American market developments− Improvement and restructuring activities
• Quarter-on-quarter results also affected by:− Stronger seasonal demand
• Year-on-year results also supported by: − Positive currency developments
• Restructuring agenda continues ahead of plan

Other and Eliminations
(31)
Other and EliminationsQ1
2015Q4
2014Q1
2014
Sapa JV 119 (22) 35
Other (117) (118) (127)
Eliminations (284) (168) 84
Other and Eliminations (281) (308) (8)
Increased eliminations of internal inventories

Net cash(debt) development
(32)
4.4
(0.7)
End Q1-2015Operating capital
(2.9)
Investments
(0.1)
End Q4-2014
(0.9)
Currency and other
Underlying EBITDA
Taxes*
(0.1)
NOK billion Net cash flow from operationsNOK 1.4 billion
* Includes 600 MNOK reimbursement of VAT in Brazil for the earlier periods
Above seasonal build-up in operating capital
(0.3)
(33)
Priorities• Deliver on improvement efforts• ICMS dialog• Strengthen competitiveness
in uncertain markets

(34)
Market

Aluminium is the metal of the future
(35)
Properties leadto increasedmarket share
• Aluminium intensive urbanization and infrastructure• Climate challenge – aluminium as part of the solution• Recyclability more important with high energy prices
• Lightweight− 1/3 density of steel
• Recyclability− 5% of original energy
consumption− 75% of all aluminium
produced still in use
• Corrosion resistant− Oxide layer
• Formability− Extrusion, rolling, casting− Low melting point vs. steel
• Excellent conductivity− Thermal – electrical
• Alloying technology− Gives wide range of physical
properties

Aluminium demand accelerating in response to global needs
(36)
Strong demand drivers in key aluminium segments
UrbanizationSubstitution from copper
UrbanizationHousing market recovery in mature regionsEnergy neutral buildings
Improving industrial sentiment in mature regionsManufacturing activity and industrial growth in emerging countries
UrbanizationEnvironmental friendly solutions
Transport
Construction
Electrical
Machinery & equipment
Packaging
Source: CRU, Hydro Analysis
Growth in automotive vehicle productionAluminium content in cars increasingGrowth in other transport modes, e.g. railway
Primary aluminium demand growth
2020E2010200019901980

Broad-based aluminium demand growth across segments and regionsGlobal semis 2014 demand ~75 million tonnes
(37)
Global aluminium semis demand, per segmentMillion tonnes (2014)
Global aluminium semis demand, per regionMillion tonnes (2014)
Source: CRU, Hydro AnalysisCAGR = Compound annual growth rate
CAGR per segment (%), 2004-2014
8%
8%
25%
5%
9%
13%
27%
5%
4 %5 %
3 %6 %
6 %8 %
8 %5 %
0 1 2 3 4 5 6 7 8
Electrical
PackagingConsumer durables
Foil stockMachinery & Equipment
TransportConstruction
Other
12%1%
15%
4%
45%
19%
3%
8 %8 %
6 %0 %0 %
4 %17 %
0 2 4 6 8 10 12 14 16 18
Western Europe
Eastern Europe
AfricaCentral & South America
North America
ChinaOther Asia & Oceania
CAGR per region (%), 2004-2014

Infinite ideas in aluminiumMore and more sectors “discover” new areas for aluminium applications
(38)
Lightweight, non-corrosiveoffshore applications
Zero-emission electrical car ferry in 100% aluminium for light-weighting. In operation from 2015
Lightweight, non-corrosive subsea applications Electrical busbars – in aluminium
Floating aluminium bridge with a submerged floating tunnel at mid span. Under planning
Middle and high voltage cables, wireand cables for electrical applications

Transport drives global flat rolled product growth of 5%
CAGR 2014-2019, %
Source: CRU FRP quarterly February 2015, Rolled Products analysisFRP - Flat rolled productsCAGR – Compound annual growth rate
Global FRP consumption by end-use 2014
Total FRP 2014 consumption ~ 23 million tonnes
14%
4%
51%
12%
9%
10%
12%
5%
5%
5%
5%
5%
4%
Transport
Electrical
Construction
Total consumption
Machinery & Equipment
Consumer durables and other
Packaging

0
100
200
300
400
500
600
1975 1980 1985 1990 1995 2000 2005 2010 2015 2020 2025
Automotive demand growth outperforms all other segments
Aluminium vehicle penetration, North AmericaPounds per light vehicle
(40)
Source: Ducker Worldwide, ‘2015 North American Light Vehicle Aluminum Content Study, Hydro
40 years of uninterrupted growth – accelerating from 2015 to 2025
DUCKER WORLDWIDE
In 2015, aluminium penetration will reach the critical mass for
an explosive period of growth from 2015 to 2025In 2025, light vehicles willbe the most important
global market for aluminium.
2014 2018 2022
Global Body-in-White demand – ‘000 mt
CAGR20%
500
1 400
2 100

Aluminium – a perfect fit for next-generation automotive
Source: International Aluminium Institute
• Tightening fuel economy regulations• 10% reduction in vehicle weight gives car
manufacturers a 5-7% fuel saving• 1 kg of aluminium replacing mild steel, cast
iron or high strength steel in cars saves between 15-20 kg GHG emissions
(41)
Land Rover Sport 2010
3,100 kgLand Rover Sport 2014
2,600 kg
• Higher specific energy absorption• More ductile - better crash performance
and safety • Lightweight• Better formability, alloying and extrusion
techniques - more advanced components• Recyclable, cost-effective, corrosion-
resistant
Aluminium vs. high-strength steel
Lighter weight translates to lower fuel emissions
C02 emissions327 g/100 km
C02 emissions194 g/100 km
Brittle materialDuctile material
Energy absorption

Higher raw material imports and semis exports in 2014
( 10)
( 5)
0
5
10
15
20
Fabricated SemisScrapBauxite Alumina Primary aluminium
Annualized aluminium equivalents*, million mt
Impo
rtto
Chi
naE
xpor
t fro
m C
hina
2006 2007 2008 2009 2010 2011 2012 2013
Net aluminium imports
2014
Source: CRU/Antaike/Hydro* Bauxite/alumina to aluminium conversion factor: 5.0/1.925** Jan/Feb 2015 figures annualized, March not yet available
2015**

Large and concentrated bauxite resources
(43)
1) Official reported resources in China (Not CM estimates)*) Mine site resources are known bauxite resources that do not currently qualify as reserves for various reasons**) Undeveloped resources might or might not became feasible for new mines (quality, size, access, etc.)***) Potential reserves = current reserves (economically extractible) + 70% of mine site resources. Undeveloped resources are excluded.Source: Roskill and Hydro analysis
Big-league (Top- 3)
Mid-league (Top- 10; each > 2% of world total)
Total bauxite, billion tonnes: reserves, mine site resources*, and undeveloped resources**
Potential reserves, billion tonnes: associated with currently operating mines***
41.0
6.2
Guinea
Atlantic Pacific
Billion mt
Australia9.5
5.6
China4.1 2.9
Vietnam4.7
0.5
India
3.01.0
Brazil8.7
2.5
Venezuela1.8
0.3
Jamaica
1.1 0.5
Bauxite suppliers short/medium term
But many challenges for future developments
1.00.2
Malaysia
4.0 1.5
Indonesia

(44)
Emirates Global (4.5)
Alba
Vedanta
0.4
Hydro 1.8
BHP Billiton
1.9Rio Tinto Alcan*
3.0
Alcoa/AWAC 8.3
(1.8)
UC Rusal
(0.7)
China (5.3)
Glencore/Century
2014
Alumina market is consolidating
Rusal
Dubal
Alba
Hydro
VAW
Sual
Alcan
Kaiser
BHP Billiton
Glencore
Vale
Alcoa
Pechiney
Rio Tinto
China
3.0
2.4
1.9
1.0
0.8
0.7
0.5
0.4
(0.5)
(0.6)
(0.9)
(1.0)
(1.2)
2000
Net long equity alumina position based on 2014 production, million tonnes
Source: CRU, Hydro
Hindalco
0.3
(0.4)
4.3
(1.9)

(45)
Business overview

(46)
Hydro - Group

5 6921 297 2 7255 9823 551
Hydro: a resource rich global aluminium company
(47)
Hydro underlying EBIT quarterly, NOK billion
Extruded Products classified as discontinued operations, and thereby excluded from revenues and underlying EBIT for 2011, 2012 and 2013. Figures for 2012 are adjusted reflecting IAS 19R. Figures for 2013 are adjusted reflecting IFRS 11
• Based in Norway, involved in activities in more than 50 countries
• 13 000 employees
• Operating revenues− 2013: NOK 65 billion− 2014: NOK 78 billion
• Current market capitalization− NOK 83 billion/ USD 11 billion
0
2.0
2.5
1.0
1.5
3.0
0.5
3.5
201420132010 2011 20152012
3208

Strong positions across aluminium value chain
(48)
Bauxite& Alumina
Rolled ProductsMetal Markets Sapa JV (50%)
• 2.1 million tonnes primary capacity
• High LME and USD sensitivity
• Improving cost position• Leading in technology
• 3.6 million tonnes (primary, remelt, recycling and cold metal)
• Expertise in materials• Flexible system• Strong marketing
organization• Risk management
• 1 million tonnes• Margin business• Regional business• Close to customers• Innovation• Market leading in litho
and foil
• 0.7 million tonnes (50%)• No. 1 position in North
America and Europe• Solid foothold in
emerging markets
Primary aluminium production,marketing and recycling
Energy Primary Metal
• Long-term power supply secured
• 10 TWh of renewable energy production in Norway
Raw materials processing and energy Aluminium in products
100% of volumes for assets that are fully consolidated and pro rata volumes for other assets.
• Bauxite capacity 10.8 million tonnes
• Expansion potential to 15.8 million tonnes
• Alumina capacity 6.3 million tonnes
• Expansion potential to 8.2 million tonnes first phase CAP
• Long-term sourcing contracts for bauxite and alumina

Hydro - a first tier aluminium company
Source: CRU, Hydro
Equity production in 2014 in aluminium equivalents ex-China, thousand mt
0
1 000
2 000
3 000
4 000
5 000
6 000
7 000
8 000
9 000
Alcoa/AWAC Rio Tinto Alcan* UC Rusal Norsk Hydro BHP Billiton Glencore/Century Hindalco Vedanta Emirates GlobalAluminium
Aluminium Bahrain
Alumina Aluminium
(49)
(50)
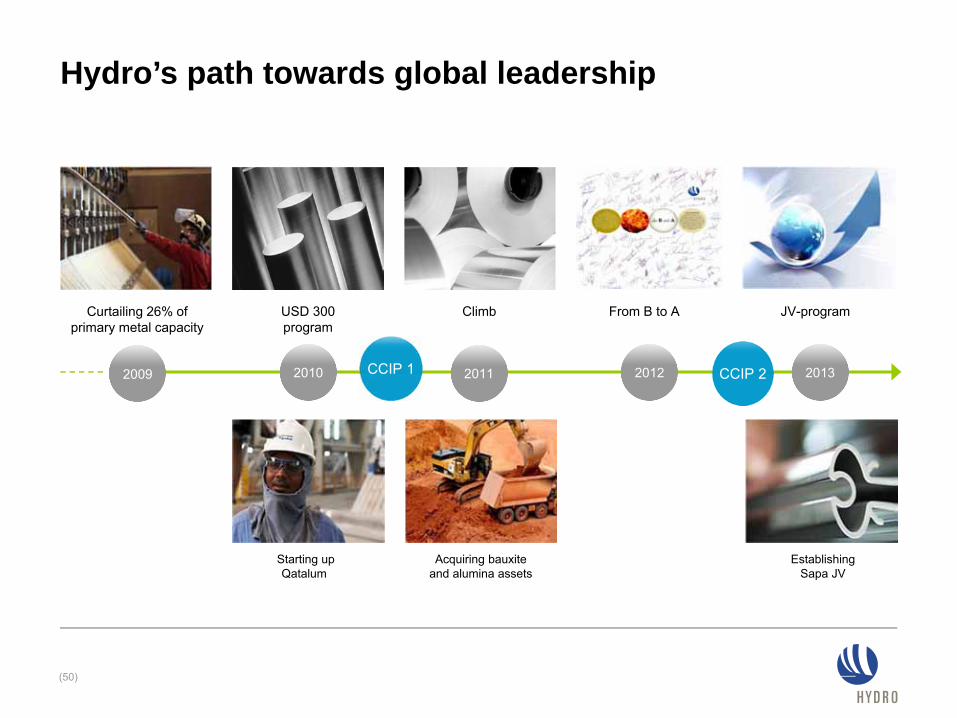
Curtailing 26% of primary metal capacity
USD 300 program
Climb From B to A
Starting up Qatalum
Acquiring bauxite and alumina assets
EstablishingSapa JV
JV-program
Hydro’s path towards global leadership
2010 20122009 2011 2013CCIP 1 CCIP 2

(51)
• Continue improvements drive
• Capture commercial opportunities
• Extend technology and innovation lead
• Turn leading HSE/CSR position into competitive advantage
• Deliver on fast-developing customer demands
• Capitalize on strong climate position over time
• Further strengthen relative industry position
• Enhance market positions and high-grade portfolio
• Mature selective growth projects for when time is right
Hydro’s aspiration for higher value creation

Sapa JV
Better: Hydro improvement drive continues at full pace
‘From B to A’
‘Energy Aspiration’
‘USD 300 program’
‘Climb’
‘JV program’2011*-2014
BNOK 3.7
Total contribution from Hydro’s improvement programs (excl. Sapa)
2015-2016** BNOK 1.5
CCIP II
* USD 300 from 2009 ** Real 2014 termsRealized improvement efforts is YTD Q314 annualized.

Bigger: A solid platform for building an even stronger Hydro
Bauxite & Alumina Primary AluminiumEnergy• Move beyond nameplate
capacity• Further improve bauxite
positions • Mature CAP project and
Paragominas expansion for when time is right
• Mature captive growth opportunities
• Raise income potential from market operations
• Leverage value from Nordic power surplus
• Enhance position inhigh-margin segments
• Realize 100,000 tonnes creep in fully-owned smelters
• Extend technology lead with Karmøy pilot plant
• Mature Qatalum 2 and Alouette expansion for when time is right
• Expand automotive capacity to 200,000 t/yrby end-2016
• Increase recycling of post-consumed scrap above 250,000 t/year*
• Build positions and lift margins through technology leadership and innovation
Rolled Products
* Includes recycling ambition in Primary Metal
(53)

Reduce emissions,increase efficiency
Maximize user-phase benefits
Increase recycling,back to the loop
Energy and primary production
Aluminium in use
‘End-of-life’
Meeting consumer needsDeveloping alloys for resource efficient cars, buildings and packaging that save energy and emissions in use
Electrolysis technology pilotDeveloping the world’s most energy efficient electrolysis cells with the most limited CO2 footprint
Circular economyRecycling R&D to improve resource efficiency and avoid export of scarce European energy. Automation technology key to sorting post consumer scrap
(54)
Greener: Hydro aims to be climate neutral by 2020

Safe and responsible operations is a top priority
(55)
10.3
7.0
6.05.4
4.0 4.1 3.9
2.9
3.7 3.83.4 3.4 3.2
2.7
2002 2004 2006 2008 2010 2012 2014
TRI Rate*
* TRI rate defined as cases per 1 million hours worked

(56)
HydroAttractive positions
throughout the value chain
Financial strength
Improvement culture and
technologicalleadership

(57)
Bauxite & Alumina

High-quality asset portfolio
(58)
Bauxite licenses
Refining and mining competencies
External supply contracts
Sales contract portfolio
Alunortealumina refinery
Paragominas bauxite mine
CAP alumina refinery project
• Full financial exposure, increase ownership to 100% by 2016
• One of the world’s largest bauxite mines
• 2014 production 9.5 million tonnes
• Nameplate capacity of 9.9 million tonnes
• Possible expansion to 15 million tonnes
• Long-life resource
• 81% ownership• Paragominas expansion to
be developed in parallel• Full utilization of the existing
bauxite pipeline
• 92% ownership• World’s largest alumina refinery• 2014 production
5.9 million tonnes• Nameplate capacity of 6.3 million
tonnes• Bauxite supplied from
Paragominas and MRN• World-class conversion cost
position
MRN bauxite mine
• 5% ownership• Volume off-take agreement for
Vale’s 40% stake• Capacity 18 million tonnes

(59)
Improvements in NOK million
0
100
200
300
400
500
600
700
800
900
1000
1100
Strengthening the competitiveness of Bauxite & AluminaFrom B to A
Improvement categories
2011 - 2014 Ambition 2015
• Increase productivity and rightsize organization• Stabilize performance at nameplate capacity• Improve logistics efficiency
• Increase productivity and rightsize organization• Support production at nameplate capacity• Improve product flow and minimize tailings
• Base bauxite and alumina pricing on fundamentals• Increase logistical flexibility and optimize
scheduling
Alunorte
Paragominas
Commercial
NOK 1 billion

(60)
Paragominas – One of the world’s largest bauxite mines
• 2014 production: 9.5 million mt• Target to deliver production
increases and stabilize• Possible expansion:
up to 15 million mt• Long-life resource base

26%
25%19%
20%
9%
Labor EnergySupport & infrastructure Maintenance/consumablesOther costs
Bauxite operational mining costs in Paragominas
(61)
• Energy cost - Power and fuel
• Labor cost− Influenced by Brazilian wage level− Productivity improvements
• Maintenance and consumables− Influenced by Brazilian inflation
• Large fixed cost base
Paragominas bauxite mining costs 2014
* Cost element definition restated in 2014

(62)
Alunorte – World’s largest alumina refinery
• 2014 production: 5.9 million mt• Targeting stable production
above 6 million tonnes• World-class conversion cost position• Modern technology• Bauxite supplied from
Paragominas and MRN

Favorable integrated alumina cost position
(63)
• Implied alumina cost position 2014− USD 250 per mt− Alunorte, Paragominas and sourced alumina
• Bauxite− Internal bauxite from Paragominas at cost, sourced
bauxite from MRN
• Energy− First-quartile energy consumption – 8 GJ/mt− Energy mix of heavy fuel oil, coal and electric power
• Caustic soda− Competitive caustic soda consumption due
to bauxite with low level of reactive silica
• Other costs− Maintenance, labor, services and other
• Sourced alumina− Alumina purchased for resale
31%
13%38%
12%
6%
Bauxite Caustic soda EnergyOther costs Sourced alumina
Implied alumina cost* position 2014USD 250 per mt
* Realized alumina price minus Underlying EBITDA for B&A, per mt alumina sales

External alumina sourcing
(64)
• ~ 2.0 million mt of external alumina sourcing in 2015
• Long term off-take agreement with Rio Tinto − 900 000 mt annually from Yarwun
• Short- and medium term contracts− To balance and optimize position
geographically− Various pricing mechanisms− Older contracts linked to LME− New contracts mostly index− Fixed USD per mt for short-term
contracts

Alumina pricing shifting from LME-link to market fundamentals
(65)
• Future pricing should reflect fundamentals of bauxite and alumina value chain
• New norm for the industry− Index pricing and short to medium-term contracts − Getting wider acceptance in the market
• Hydro’s commercial strategy− Move towards index pricing (PAX)− Focus on selling to end-users based on a
global portfolio− Establish a premium for Alunorte quality− Selling 2-3 million mt annually of MRN
bauxite externally
100%
2015 2017 2020
Internal demand LME linked sales Index exposure
Index spot price exposure
(66)
Primary Metal

World-wide production networkPrimary aluminium annual production capacity
(67)
Qatar, 300 000 tonnes• Qatalum (50%): 300 000 tonnes• Expansion potential
Germany, 235 000 tonnes• Rheinwerk* (100%): 235 000 tonnes
Canada, 120 000 tonnes• Alouette (20%): 120 000 tonnes• Expansion potential
Brazil , 235 000 tonnes• Albras: (51%): 235 000 tonnes
Australia, 70 000 tonnes• Tomago (12%): 70 000 tonnes
Norway, 1 015 000 tonnes• Sunndal (100%) : 390 000 tonnes• Årdal (100%): 190 000 tonnes• Karmøy (100%): 190 000 tonnes• Høyanger (100%): 65 000 tonnes• Husnes (100%): 180 000 tonnes
Attributable capacity: 2.1 million mt. Consolidated capacity: 2.4 million tonnes (Slovalco and Albras are consolidated). The smelters have an additional remelt capacity: 0.5 million tonnes. Consolidated casthouse capacity: 2.9 million tonnes. Qatalum is equity accounted in Hydro’s results.* Rheinwerk smelter is included in the Rolled Products division for logistical reasons
2.1million tonnes
11%
49%
15%
3%
6%
11%
Slovakia, 90 000 tonnes• Slovalco (55%): 90 000 tonnes
4%

(68)
Delivering on ambitious USD 300 improvement program
0
50
100
150
200
250
300
Total annual improvement effect of NOK ~1.5 billion
2009-2013
Improvements in USD per mt*Improvement categories
* Compared to 2009 cost level. USD 300 per mt real term target for fully owned smelters excluding Neuss with 2009 as baseline. Effect of exchange rates and raw materials cost changes are neutralized
Technology costs/spin-offs
Maintenance and relining
Investments
Procurement
Organization and manning
Casthouse product margin
Logistics
Operational improvements• Improved current efficiency • Reduced power consumption• Reduced anode consumption
Fixed cost reductionsand lean operations
Further operational improvements

(69)
Improvements in USD per mt*
0
20
40
60
80
100
120
140
160
180
* Compared to 2011 cost level. USD 180 per mt in real terms corresponds to USD 150 in nominal terms. Effect of exchange rates , LME and raw materials cost changes are neutralized. Casthouse margins and cost above plants are not included.
Primary Metal joint ventures improvement programUSD 180 per mt improvements by end-2016, corresponding to NOK 1.2billion
Fixed cost reductionsand lean operations
Operational improvements
Additional improvements
Improvement categories
2012 - 2014 Ambition 2015-16
USD 180per mt
• Improved current efficiency• Reduced power consumption• Reduced anode consumption

Improvement drive yields results in primary productionUnderlying EBITDA per mt in USD for respective primary aluminium divisions
All figures based on public accounting data, not verified by Hydro. Data not adjusted for different accounting principles and non-specified underlying items. Hydro makes no representation as to the accuracy or completeness of such information. The analyses are based on assumptions subject to uncertainty and therefore intended only for general comparisons across companies and should not be used to support any individual investment decision. All results are provided for informational purposes only. Hydro figures includes Primary Metal, Metal Markets and attributable share of EBITDA and production in Qatalum.
2H 2012 1H 20131H 2012
Hydro Peers
-100
100
300
500
700
-100
100
300
500
700
2H 2013
-100
100
300
500
700
1H 2014
-100
100
300
500
700
2H 2014
-100
100
300
500
700
-100
100
300
500
700

(71)
• Operating for several years in Sunndal and Qatar
• Operating at:− 13.5 kWh/kg− 312 kA− 1.5 mt CO2/mt aluminium
• Continuous technology upgrading based on knowledge derived from HAL4e and the R&D portfolio
• Aiming for further productivity improvement through amperage increase
HAL 300 HAL4e• Benchmark technology on process
parameters and environmental footprint
• Prototype cells in operation since 2008 at the R&D center in Årdal, Norway
• Ready for industrial verification in Karmøy Technology Pilot
• Currently operating at:− 12.5 kWh/kg− 450 kA − 1.4 mt CO2/mt aluminium
R&D portfolio• HAL 4e Ultra – future vision− Significantly lower kWh/kg− New materials and cell design− Reduced investment costs
• A low energy version of HAL4e Ultra for a section of the Karmøy Technology Pilot is under development
• Carbon program for developing anodes with higher efficiency and higher robustness wrt. variations in raw material quality
Develop technology to fulfill ambitions
(72)
Metal Markets
(73)
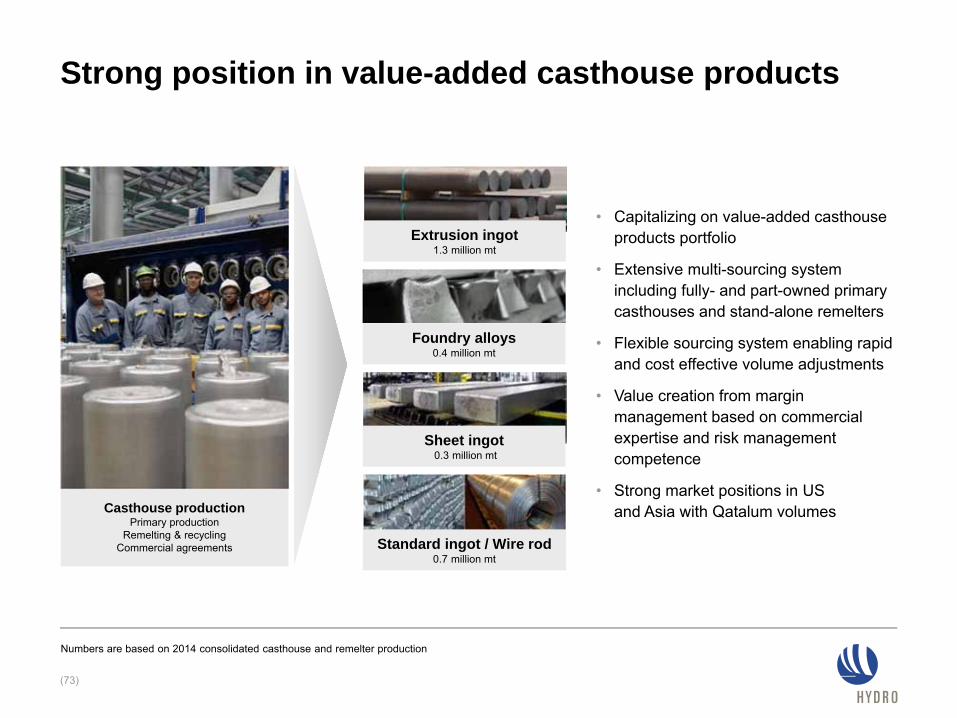
• Capitalizing on value-added casthouse products portfolio
• Extensive multi-sourcing system including fully- and part-owned primary casthouses and stand-alone remelters
• Flexible sourcing system enabling rapid and cost effective volume adjustments
• Value creation from margin management based on commercial expertise and risk management competence
• Strong market positions in US and Asia with Qatalum volumesCasthouse production
Primary productionRemelting & recycling
Commercial agreements
Strong position in value-added casthouse products
Numbers are based on 2014 consolidated casthouse and remelter production
Sheet ingot0.3 million mt
Extrusion ingot1.3 million mt
Foundry alloys0.4 million mt
Standard ingot / Wire rod0.7 million mt

Pricing of value-added products
(74)
Aluminium Standard ingot
Smelter Intermediate product Casthouse
Value added productsExtrusion ingot Foundry alloy Sheet ingot Wire rod
Traded on LME • US Midwest - 1020(in cent per pound)
• Duty paid IW Rotterdam• Duty unpaid IW Rotterdam
Traded on LME
Traded on LME & SHFE
• CIF Japan Premium (MJP)• Singapore In Warehouse• CIF South Korea
• Extrusion Ingot – Priced above standard ingot• Foundry Alloy – Priced above standard ingot• Sheet ingot – Priced above standard ingot• Wire rod - Priced above standard ingot
• Extrusion ingot – Priced above LME• Foundry Alloy – Priced partly above standard ingot and partly above LME• Sheet ingot – Priced above standard ingot• Wire rod - Priced partly above standard ingot and partly above LME
• Extrusion ingot – Priced partly above standard ingot and partly above LME• Foundry Alloy – Priced partly above standard ingot and partly above LME• Sheet ingot – Priced partly above standard ingot and partly above LME
US
Eur
ope
Asia
( 50)
0
50
100
150
200
Q1
Q2
Q3
Q4
Q1
Q2
Q3
Q4
Q1
Q2
Q3
Q4
Q1
Q2
Q3
Q4
Q1
Q2
Q3
Q4
Q1
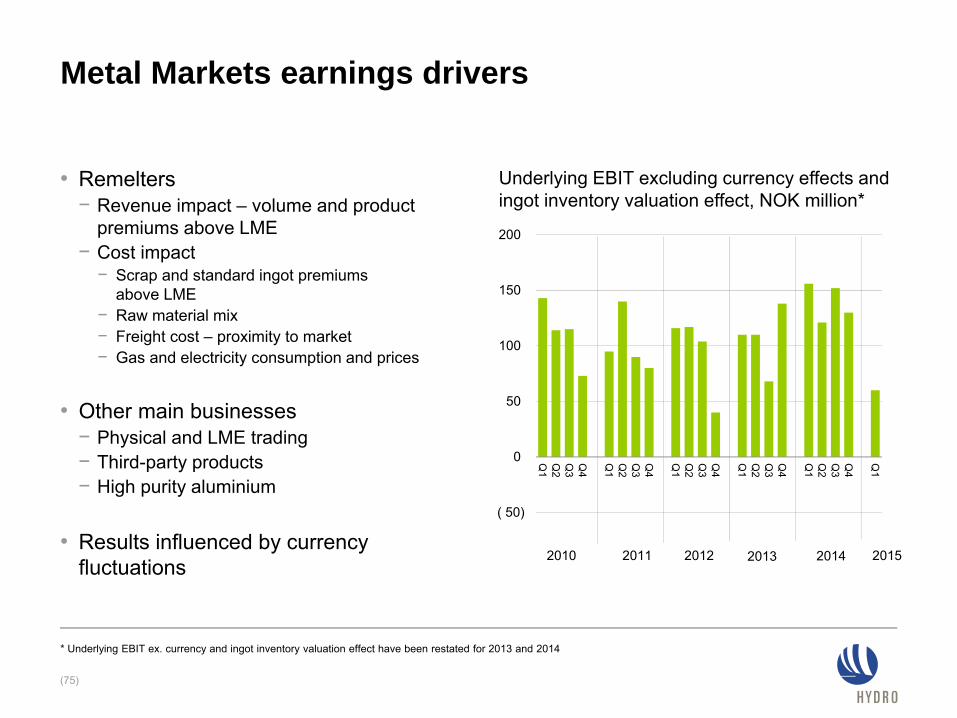
Metal Markets earnings drivers
(75)
• Remelters− Revenue impact – volume and product
premiums above LME− Cost impact − Scrap and standard ingot premiums
above LME− Raw material mix− Freight cost – proximity to market− Gas and electricity consumption and prices
• Other main businesses− Physical and LME trading− Third-party products− High purity aluminium
• Results influenced by currency fluctuations
Underlying EBIT excluding currency effects and ingot inventory valuation effect, NOK million*
2010 2011 2012 2013 2014 2015
* Underlying EBIT ex. currency and ingot inventory valuation effect have been restated for 2013 and 2014
(76)
Rolled Products

No. 1 flat rolled products producer in Europe
(77)
• World leader in high-end products foil and litho− Alunorf (JV 50%) – world’s largest rolling mill− Grevenbroich plant – world’s largest finishing mill
• High-grading product portfolio− Margin management and cash generation− Portfolio adjustment towards higher margins
• Capitalize on automotive market growth − Investment in new automotive capacity− Commissioning expected for 2nd half of 2016
• Extend recycling position − Installation of a Used Beverage Can (UBC)
recycling line beginning of 2016
12%
18%
8%
11%4%
28%
19%
Foil CanBuilding and other AutoHeat exchanger General engineeringLitho
External sales in tonnages 2014Total 946 kT
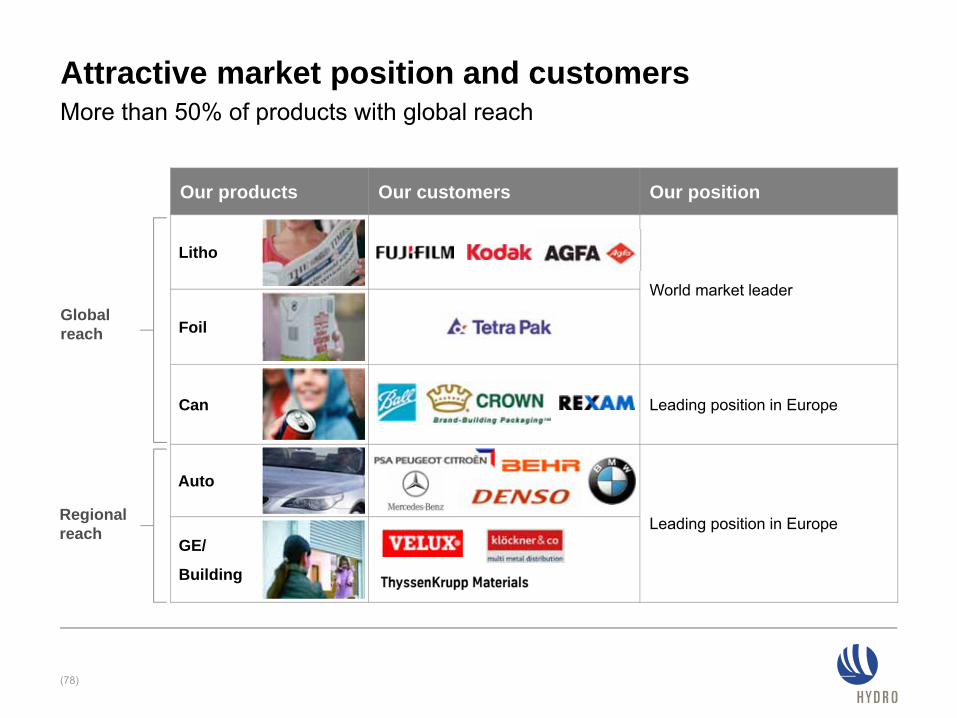
(78)
Our products Our customers Our position
Litho
World market leader
Foil
Can Leading position in Europe
Auto
Leading position in EuropeGE/
Building
Globalreach
Regionalreach
Attractive market position and customersMore than 50% of products with global reach

Hydro inside Hydro supplies premium European carmakers with aluminium
(79)
BMW 7 series
“Aluminium plays a major role in lightweight construction at the BMW Group”
“Audi believes aluminium still offers abundant potential, especially in the shape of the new,
higher-strength alloys”
“Lightweight construction is a core elementof Jaguar’s DNA and Jaguar is at the cutting-edge of aluminium technology
in the automotive industry”
New Mercedes C Class T
Peugeot 308
Audi Q7
Audi A6
Audi Q7
Porsche Macan
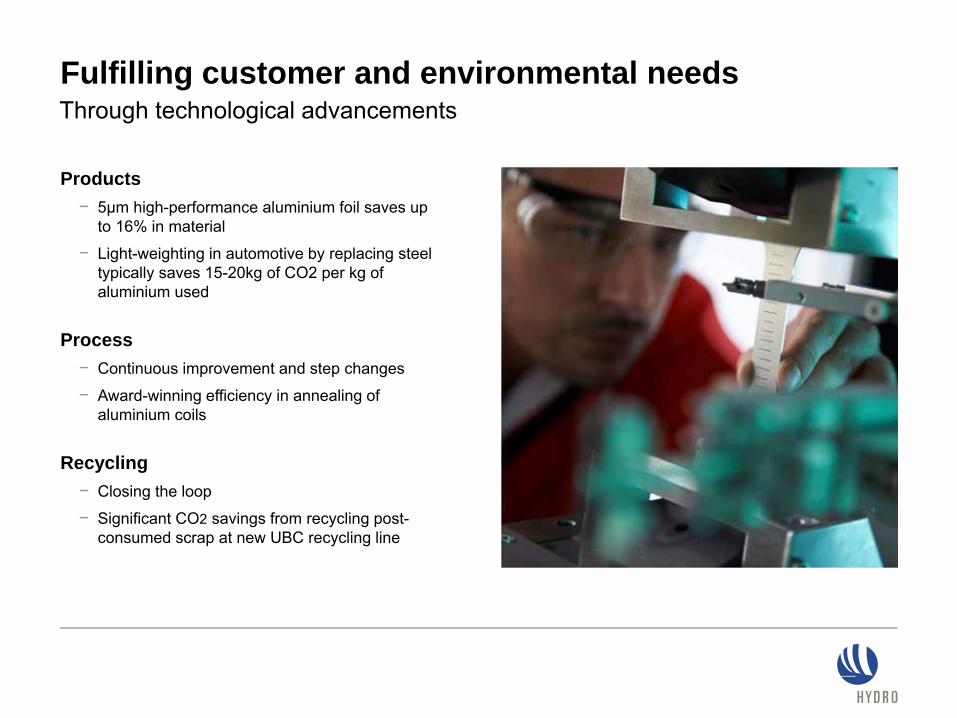
Fulfilling customer and environmental needsThrough technological advancements
Products− 5µm high-performance aluminium foil saves up
to 16% in material
− Light-weighting in automotive by replacing steel typically saves 15-20kg of CO2 per kg of aluminium used
Process− Continuous improvement and step changes
− Award-winning efficiency in annealing of aluminium coils
Recycling− Closing the loop
− Significant CO2 savings from recycling post-consumed scrap at new UBC recycling line

(400)
(200)
0
200
400
600
800
1 000
1 200
1 400
Rolled Products earnings drivers
(81)
• Contract structure− Margin business based on conversion price − LME element passed on to customers
− Range from spot contracts to multi-year contracts
• High share of fixed costs - volume sensitive
• Preferred supplier market position in high-end products
Underlying EBIT per tonne, NOK
2010 2011 2012 2013 2014 2015
2013 are adjusted to reflect IFRS11

(82)
Sapajoint venture

Sapa – global leader in extruded products
(83)
• 50/50 joint venture between Hydro and Orkla, established September 1, 2013, with 23,000 employees
• No. 1 position in North America and Europe
• Strong foothold in emerging markets
• Hydro supplies the new company with extrusion billets, ~400 000 tonnes per year at market prices
• Positioned for restructuring and value creation
Extrusions Europe
42%
Extrusions Americas
43%
Extrusions Asia2%
Building System
6%
Precision Tubing
7%
External sales of 1.4 million tonnes (2014)
Heavyweight company – lightweight material

• Partnership to supply structural aluminium tubing− Also provide ongoing development
support for future extrusion applications
• Ford F-150 2015 Model− Aluminium-alloy body− ~700 pounds lighter than 2014 model
Sapa JV delivers solutions to Ford F-150
(84)
World’s most selling vehicle
Picture with courtesy of Ford Motors

(85)
Energy

Power production increased to 10 TWh
(86)
• Power producing assets and ongoing projects− Maintain cost control in operations and projects− Holsbru and Vasstøl power plants into operation in
2012− Rjukan upgrade project ongoing – second outage
period during summer 2014− Vigeland acquisition completed, exemption from
concession requirement granted - no time limitations
• New growth projects− Mature new equity growth options− Growth potential around 0.5 TWh
• Framework conditions− Reversion regime secures full value of energy
assets− El-certificates support investments in new capacity
Power production capacity (TWh), per region and reversion year
0.2
3.2
3.1
3.0
0.52044-2049
2051-2057
No reversion
Telemark
Røldal-Suldal
Sogn
Normal production
10
Vigeland
2023
No reversion

Hydro’s energy map
(87)
North AmericaPower 1.7 TWh
Australia/AsiaPower 1.0 TWh
Middle EastPower 4.6 TWh
South AmericaPower 4.6 TWhCoal 5.3 TWhFuel oil 7.3 TWh
EuropePower 16.7 TWhNatural gas 3.3 TWh
Energy consumption in alumina refineries, smelters and rolling mills
Based on Hydro’s equity production end-2013
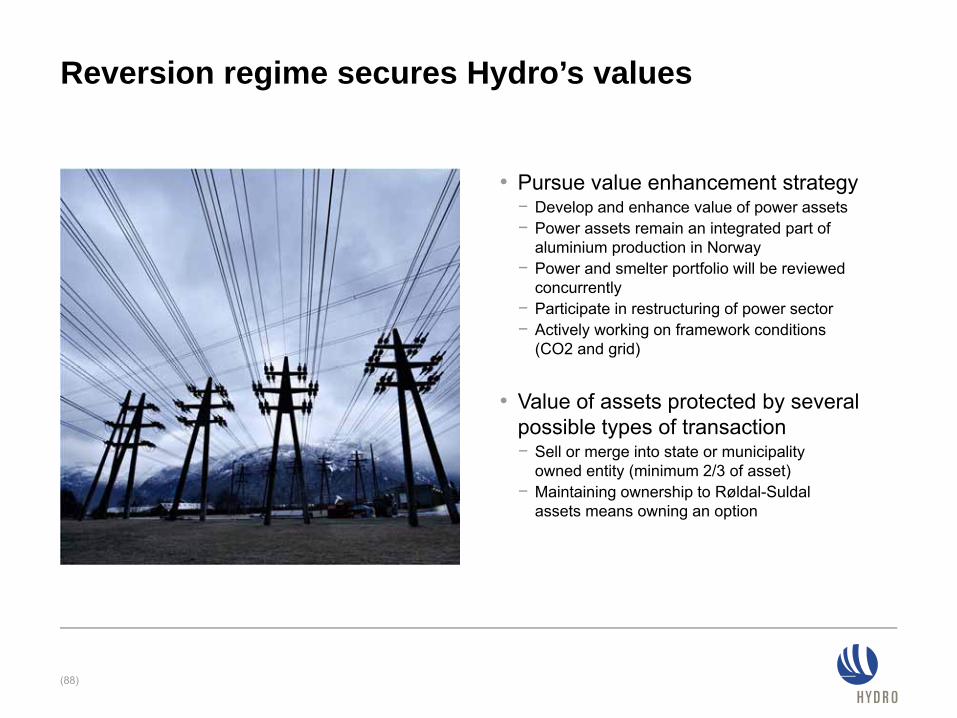
Reversion regime secures Hydro’s values
(88)
• Pursue value enhancement strategy− Develop and enhance value of power assets− Power assets remain an integrated part of
aluminium production in Norway− Power and smelter portfolio will be reviewed
concurrently− Participate in restructuring of power sector− Actively working on framework conditions
(CO2 and grid)
• Value of assets protected by several possible types of transaction− Sell or merge into state or municipality
owned entity (minimum 2/3 of asset)− Maintaining ownership to Røldal-Suldal
assets means owning an option

Energy earnings drivers
(89)
• Production and market prices strongly linked to hydrological conditions
• Stable annual EBIT contribution
• Seasonal market variations in demand and supply
• Occasional delink between area prices
• Power portfolio optimized versus market
• Stable cost base
Underlying EBIT* and spot price
Underlying EBIT and spot price
* Underlying EBIT 2003–2006 based on USGAAP
NOK million
NOK million
NOK/MWh
NOK/MWh
Underlying EBIT Spot price
0
100
200
300
400
500
600
0
200
400
600
800
2006 2007 2008 2009 2010 2011 2012 2013 2014 2015
0
100
200
300
400
500
0
500
1000
1500
2000
2003 2004 2005 2006 2007 2008 2009 2010 2011 2012 2013 2014

(90)
Hydro’s value proposition• Improve relative industry
position• Capitalize on raw material positions• Maintain financial strength
and flexibility • Ensure competitive
shareholder return

(91)
Additional information

Shareholder and financial policy
(92)
• Hydro aims to give its shareholders competitive returns compared to alternative investments in peers
• Maintained dividend policy− Ordinary dividend: 40% of net income over the cycle− Average ordinary pay-out ratio 2010-2014 is ~95%*− Share buybacks and extraordinary dividends as supplement in
periods with strong financials
• Maintain investment-grade rating− Currently: BBB (S&P) & Baa2 (Moody’s) stable outlook− Competitive access to capital and important for Hydro’s business
model (counterparty risk and partnerships)
• Financial ratios over the business cycle− Funds from operations to net adjusted debt > 40%− Net adjusted debt to equity < 0.55
• USD 1.7 billion in multi-currency revolving credit facility maturing in 2019− Potential to extend through one-year extension option
• NOK 1.5 billion bond maturing in 2019
* NOK 1 2014 dividend per share proposed by Board of Directors, dependent on approval from the Annual General Meeting May 6, 2015

Hedging policy
(93)
• Bauxite & Alumina, Primary Metal− Remain primarily exposed to LME prices− Operational LME hedging
− One-month forward sales
− Currency exposure, mainly USD, NOK and BRL− Policy of maintaining long-term debt in USD
• Metal Markets, Rolled Products− Operational LME and currency hedging to
secure margin
• Volatility mitigated by strong balance sheet
• Flexibility to hedge LME or currency in certain cases

Adjusted net debt development Q1 2015
NOK billionMar 31
2015Dec 31
2014Sep 30
2014
Cash and cash equivalentsShort-term investmentsShort-term debtLong-term debt
7.22.5
(4.2)(5.7)
9.31.8
(6.0)(5.1)
6.01.7
(5.0)(4.8)
Net cash/(debt) (0.3) (0.1) (2.1)
Net pension liability at fair value, net of expected tax benefit
Other adjustments1
(7.8)
(5.3)
(8.2)
(5.3)
(6.6)
(5.4)
Net adjusted cash/(debt) (13.4) (13.6) (14.1)
1) Operating lease commitments and other obligations
(94)

Capital allocation mainly upstream
(95)
NOK billion • Long-term sustaining capex NOK ~3.5 billion annually
• Sustaining projects for 2014-2016:- Red mud disposal area- Bauxite tailing dam- Smelter relining
• Some growth projects impacting 2015:- RP Automotive line- RP UBC recycling line
• The majority of sustaining capital allocated upstream
2009 2010 2011 2012 2013 2014 2015E Long-term
Debt-financed investments QatalumInvestments QatalumGrowth capexSustaining capex
3.4 (3)
6.2
10.2
4.6 (1)
4.1
2.9 (2)
1) Excluding Vale assets acquisition2) Excluding Extruded Products and non-cash elements relating to capitalized lease obligations and the Vigeland acquisition.3) Excluding non-cash effects
~3.5
~6.8

0
150
300
450
600
750
900
Caustic soda (USD/mt)
Commodity prices drive industry costs
(96)
Source: Reuters Ecowin, PACE, CMAI/Harriman, Platts Bolivar Index, ANP
0
150
300
450
600
750
Fuel oil A1 (USD/mt)
0
30
60
90
120
150
180
Steam coal (USD/mt)
0
100
200
300
400
500
600
Petroleum coke FOB USG (USD/mt)
2006 2007 2008 2009 2010 2011 2012 2013 2014 2015 2006 2007 2008 2009 2010 2011 2012 2013 2014 2015
2006 2007 2008 2009 2010 2011 2012 2013 2014 2015 2006 2007 2008 2009 2010 2011 2012 2013 2014 2015
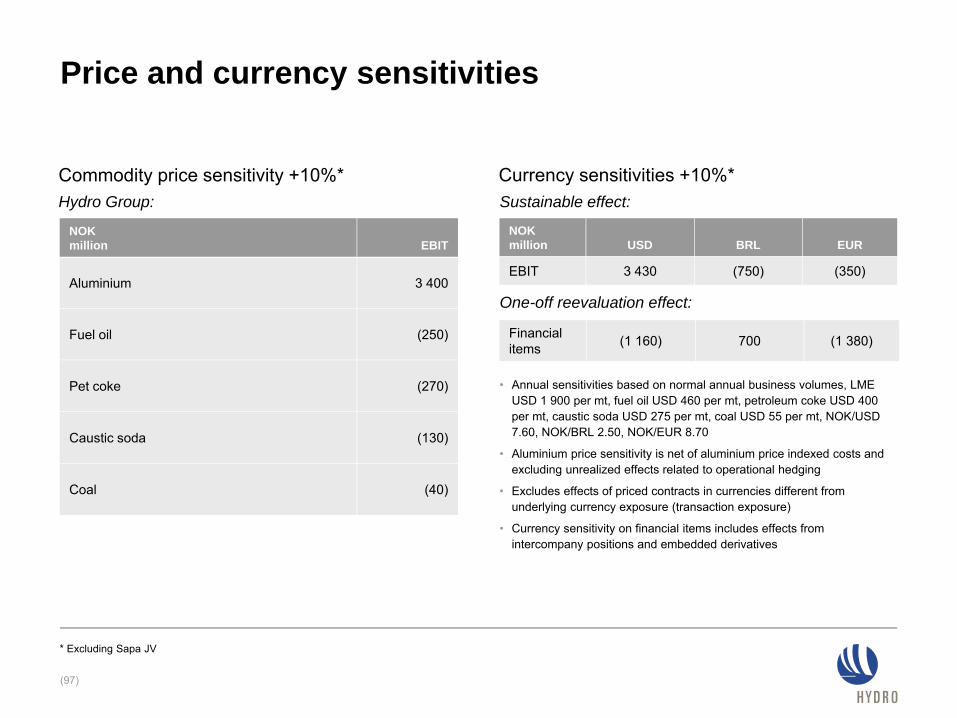
NOK million EBIT
Aluminium 3 400
Fuel oil (250)
Pet coke (270)
Caustic soda (130)
Coal (40)
NOK million USD BRL EUR
EBIT 3 430 (750) (350)
Currency sensitivities +10%*Commodity price sensitivity +10%*
• Annual sensitivities based on normal annual business volumes, LME USD 1 900 per mt, fuel oil USD 460 per mt, petroleum coke USD 400 per mt, caustic soda USD 275 per mt, coal USD 55 per mt, NOK/USD 7.60, NOK/BRL 2.50, NOK/EUR 8.70
• Aluminium price sensitivity is net of aluminium price indexed costs and excluding unrealized effects related to operational hedging
• Excludes effects of priced contracts in currencies different from underlying currency exposure (transaction exposure)
• Currency sensitivity on financial items includes effects from intercompany positions and embedded derivatives
* Excluding Sapa JV
(97)
Price and currency sensitivities
Sustainable effect:
One-off reevaluation effect:
Financial items (1 160) 700 (1 380)
Hydro Group:

Bauxite & Alumina sensitivities
(98)
Revenue impact• ~14.5% of 3-month LME price per tonne alumina
• ~One month lag• Realized alumina price lags PAX by one month
Cost impactBauxite• ~2.45 tonnes bauxite per tonne alumina• Pricing partly LME-linked for bauxite from MRN
Caustic soda• ~0.1 tonnes per tonne alumina• Prices based on IHS Chemical, pricing mainly monthly per
shipment
Energy• ~0.11 tonnes coal per tonne alumina, Platts prices, one year
volume contracts, weekly per shipment pricing• ~0.11 tonnes heavy fuel oil per tonne alumina, prices set by
ANP/Petrobras in Brazil, weekly pricing (ANP) or anytime (Petrobras)
• Increased use of coal as energy source in AlunorteUSD 1 900
per mtUSD 460
per mtUSD 275
per mtUSD 55per mt
USD 340 per mt
* 2015 Platts alumina index exposureCurrency rates used: NOK/USD 7.60, NOK/BRL 2.50, NOK/EUR 8.70
Sensitivities on underlying EBIT if +10% in priceNOK million
(40)(130)
(250)
525
835
Fuel oilPAX* CoalAluminium Caustic soda
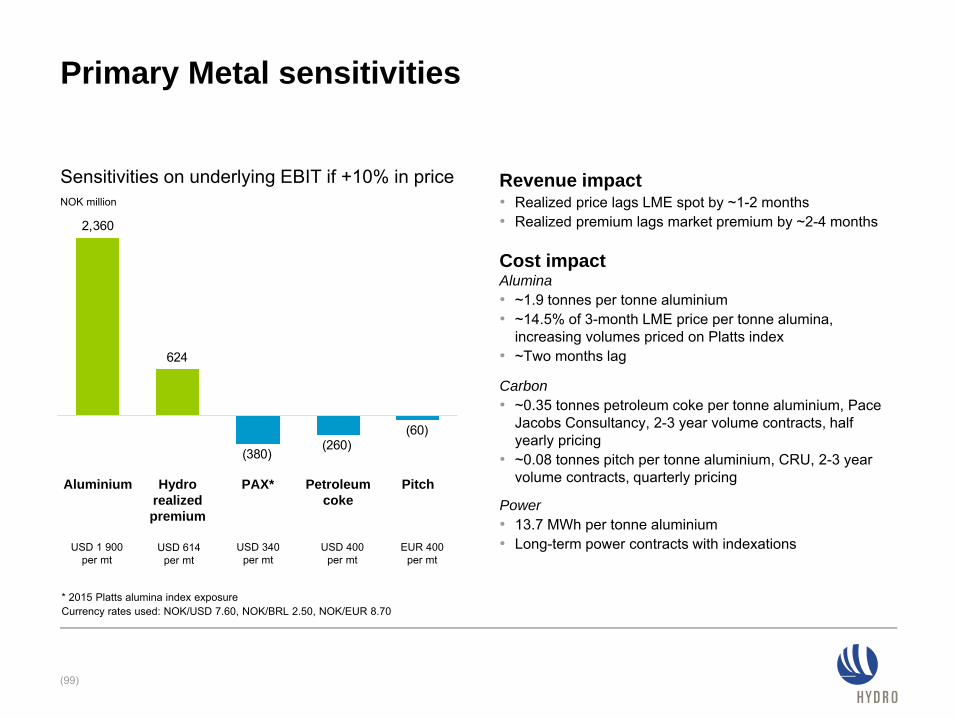
Primary Metal sensitivities
(99)
Revenue impact• Realized price lags LME spot by ~1-2 months• Realized premium lags market premium by ~2-4 months
Cost impactAlumina• ~1.9 tonnes per tonne aluminium• ~14.5% of 3-month LME price per tonne alumina,
increasing volumes priced on Platts index• ~Two months lag
Carbon• ~0.35 tonnes petroleum coke per tonne aluminium, Pace
Jacobs Consultancy, 2-3 year volume contracts, half yearly pricing
• ~0.08 tonnes pitch per tonne aluminium, CRU, 2-3 year volume contracts, quarterly pricing
Power• 13.7 MWh per tonne aluminium• Long-term power contracts with indexationsUSD 1 900
per mtUSD 400
per mtEUR 400
per mtUSD 614
per mtUSD 340
per mt
Sensitivities on underlying EBIT if +10% in priceNOK million
* 2015 Platts alumina index exposureCurrency rates used: NOK/USD 7.60, NOK/BRL 2.50, NOK/EUR 8.70
(60)(260)
(380)
624
2,360
PAX*Hydro realized premium
Aluminium Petroleum coke
Pitch

Percent USD EUR BRLNOK & Others
Bauxite & Alumina 100%
Primary Metal 25% 20% 55%
Metal Markets 25% 75%
Rolled Products 90% 10%
Energy 100%
Other & Eliminations 100%
(100)
Depreciation by currency and business area
Depreciation currency exposure by business area Depreciation by business area*
39%2%
39%
1%4%
15%
Metal Markets
Rolled Products
Other & Eliminations
Energy
Bauxite and alumina
Primary Metal
* Based on 2014 depreciation figures
Total 2014 depreciation 4.6 BNOK

(101)
NOK million (+=loss/()=gain) Q1 2015
Unrealized derivative effects on LME related contracts Bauxite & alumina 3
Total impact Bauxite & alumina 3
Unrealized derivative effects on LME related contracts Primary metal 54
Unrealized effects on power contracts Primary metal 2
Total impact Primary metal 56
Unrealized derivative effects on LME related contracts Metal markets 146
Total impact Metal markets 146
Unrealized derivative effects on LME related contracts Rolled products (80)
Metal effect Rolled products (61)
Total impact Rolled products (141)
Unrealized derivative effects on power contracts Energy 1
Total impact Energy 1
Unrealized derivative effects on power contracts Other and eliminations (154)
Unrealized derivative effects on LME related contracts Other and eliminations 17
Items excluded in equity accounted investment (Sapa) Other and eliminations 74
Total impact Other and eliminations (63)
Total EBIT Hydro 2
Net foreign exchange (gain)/loss Hydro 1 587
Income (loss) before tax Hydro 1 589
Calculated income tax effect Hydro (454)
Net income (loss) Hydro 1 134
Items excluded from underlying results - 2015

(102)
NOK million (+=loss/()=gain) Q1 2014 Q2 2014 Q3 2014 Q4 2014 2014
Unrealized derivative effects on LME related contracts Bauxite & Alumina (4) (1) (2) (10) (16)
Total impact Bauxite & Alumina (4) (1) (2) (10) (16)
Unrealized derivative effects on LME related contracts Primary metal (12) (38) (36) - (86)
Unrealized effects on power contracts Primary metal 43 (8) 1 27 63
Unrealized derivative effects on power contracts (Søral) Primary metal (33) 24 (64) 57 (16)
Unrealized derivative effects on raw material contracts Primary metal 10 9 9 10 37
Impairment charges (Qatalum) Primary metal - - 28 - 28
Insurance compensation (Qatalum) Primary metal - - - (55) (55)
Transaction effects Søral acquisition Primary metal - - - 38 38
Total impact Primary metal 8 (14) (62) 77 9
Unrealized derivative effects on LME related contracts Metal Markets 35 6 (94) (64) (117)
Impairment charges Metal Markets 33 - - - 33
Total impact Metal Markets 69 6 (94) (64) (83)
Unrealized derivative effects on LME related contracts Rolled Products (16) (101) (79) 76 (119)
Metal effect Rolled Products - (58) (202) (189) (449)
Impairment charges Rolled Products - - - 145 145
Total impact Rolled Products (16) (159) (281) 32 (423)
Unrealized derivative effects on power contracts Energy 3 4 (1) (2) 4
Total impact Energy 3 4 (1) (2) 4
Unrealized derivative effects on power contracts Other and Eliminations (198) 12 1 170 (16)
Unrealized derivative effects on LME related contracts Other and Eliminations 1 (2) (9) (3) (13)
(Gains)/Losses on divestments Other and Eliminations - (8) - - (8)
Items excluded in equity accounted investment (Sapa) Other and Eliminations 86 87 2 337 512
Other effects Other and Eliminations - - - 53 53
Total impact Other and Eliminations (111) 88 (7) 558 528
Total EBIT Hydro (50) (75) (447) 591 18
Net foreign exchange (gain)/loss Hydro (193) 101 1 001 2 252 3 161
Income (loss) before tax Hydro (244) 26 554 2 843 3 179
Calculated income tax effect Hydro 170 23 (176) (696) (680)
Net income (loss) Hydro (74) 49 378 2 147 2 499
Items excluded from underlying results - 2014

Underlying EBIT
Underlying EBITDA
2013 are adjusted to reflect IFRS11
(103)
NOK million Q1 2013 Q2 2013 Q3 2013 Q4 2013 Q1 2014 Q2 2014 Q3 2014 Q4 2014 Q1 2015 Year 2013 Year 2014
Bauxite & Alumina (63) (244) (370) (379) (288) (269) (26) 528 780 (1 057) (55)
Primary Metal 364 237 337 484 312 420 1 216 1 989 2 012 1 422 3 937
Metal Markets 146 147 111 190 141 100 171 221 24 594 634
Rolled Products 152 183 181 100 181 177 243 96 292 615 698
Energy 517 268 485 383 435 169 234 360 382 1 653 1 197
Other and Eliminations (38) (70) (87) (306) (8) (52) (349) (308) (281) (502) (717)
Total 1 076 520 658 471 772 544 1 490 2 886 3 208 2 725 5 692
NOK million Q1 2013 Q2 2013 Q3 2013 Q4 2013 Q1 2014 Q2 2014 Q3 2014 Q4 2014 Q1 2015 Year 2013 Year 2014
Bauxite & Alumina 366 203 47 45 122 162 417 1 046 1 240 662 1 747
Primary Metal 838 713 802 940 753 852 1 651 2 489 2 522 3 293 5 745
Metal Markets 163 165 149 214 157 120 192 243 47 691 712
Rolled Products 311 346 351 284 351 350 417 280 465 1 293 1 398
Energy 557 302 523 420 474 209 275 402 429 1 803 1 360
Other and Eliminations (24) (55) (72) (285) 4 (40) (336) (290) (267) (435) (662)
Total 2 212 1 674 1 801 1 619 1 861 1 653 2 615 4 170 4 437 7 306 10 299
Operating segment information

EBIT
EBITDA
(104)
2013 are adjusted to reflect IFRS11
NOK million Q1 2013 Q2 2013 Q3 2013 Q4 2013 Q1 2014 Q2 2014 Q3 2014 Q4 2014 Q1 2015 Year 2013 Year 2014
Bauxite & Alumina (76) (241) (370) (491) (284) (269) (23) 537 776 (1 178) (39)
Primary Metal 19 122 338 377 303 434 1 278 1 912 1 956 855 3 928
Metal Markets 228 121 116 202 73 93 265 285 (122) 666 717
Rolled Products 110 (19) 74 (83) 197 336 525 64 433 83 1 121
Energy 513 271 481 391 431 165 235 362 381 1 657 1 193
Other and Eliminations (89) 122 (43) (410) 102 (140) (342) (866) (218) (420) (1 245)
Total 704 376 596 (14) 822 620 1 937 2 295 3 206 1 663 5 674
NOK million Q1 2013 Q2 2013 Q3 2013 Q4 2013 Q1 2014 Q2 2014 Q3 2014 Q4 2014 Q1 2015 Year 2013 Year 2014
Bauxite & Alumina 353 207 47 (67) 125 163 419 1 056 1 237 540 1 763
Primary Metal 492 597 803 833 745 866 1 713 2 413 2 467 2 726 5 736
Metal Markets 245 139 153 226 122 114 286 307 (99) 764 829
Rolled Products 270 144 245 102 367 508 698 393 607 761 1 966
Energy 553 306 519 429 471 205 276 404 428 1 807 1 355
Other and Eliminations (74) 138 (28) (309) 115 (127) (329) (848) (204) (274) (1 190)
Total 1 839 1 531 1 739 1 214 1 944 1 728 3 062 3 725 4 436 6 323 10 460
Operating segment information

Total revenue
External revenue
(105)
2013 are adjusted to reflect IFRS 11
NOK million Q1 2013 Q2 2013 Q3 2013 Q4 2013 Q1 2014 Q2 2014 Q3 2014 Q4 2014 Q1 2015 Year 2013 Year 2014
Bauxite & Alumina 3 304 3 147 3 354 3 546 3 511 3 828 3 737 4 770 5 461 13 350 15 847
Primary Metal 5 945 5 896 5 884 5 554 6 618 6 384 6 986 8 075 9 096 23 279 28 064
Metal Markets 9 853 9 880 9 061 8 996 10 292 10 109 10 919 11 709 12 181 37 791 43 029
Rolled Products 5 015 5 205 5 005 4 868 5 238 5 275 5 618 5 324 6 170 20 092 21 455
Energy 1 762 1 246 1 674 1 596 1 539 1 381 1 492 1 891 1 553 6 279 6 303
Other and Eliminations (9 770) (9 322) (8 833) (7 990) (8 917) (8 706) (9 055) (10 112) (11 171) (35 914) (36 790)
Total 16 109 16 052 16 145 16 570 18 282 18 272 19 698 21 656 23 290 64 877 77 907
NOK million Q1 2013 Q2 2013 Q3 2013 Q4 2013 Q1 2014 Q2 2014 Q3 2014 Q4 2014 Q1 2015 Year 2013 Year 2014
Bauxite & Alumina 1 982 1 894 2 077 2 171 2 208 2 404 2 257 2 699 3 387 8 124 9 568
Primary Metal 813 1 040 1 025 988 1 227 1 337 1 590 2 242 1 789 3 866 6 397
Metal Markets 7 429 7 321 7 228 7 668 8 719 8 853 9 784 10 625 11 315 29 646 37 981
Rolled Products 5 032 5 284 5 002 4 968 5 290 5 212 5 498 5 345 6 079 20 286 21 345
Energy 826 489 779 737 807 436 540 710 698 2 830 2 492
Other and Eliminations 28 24 34 38 31 29 28 35 21 124 124
Total 16 109 16 052 16 145 16 570 18 282 18 272 19 698 21 656 23 290 64 877 77 907
Operating segment information
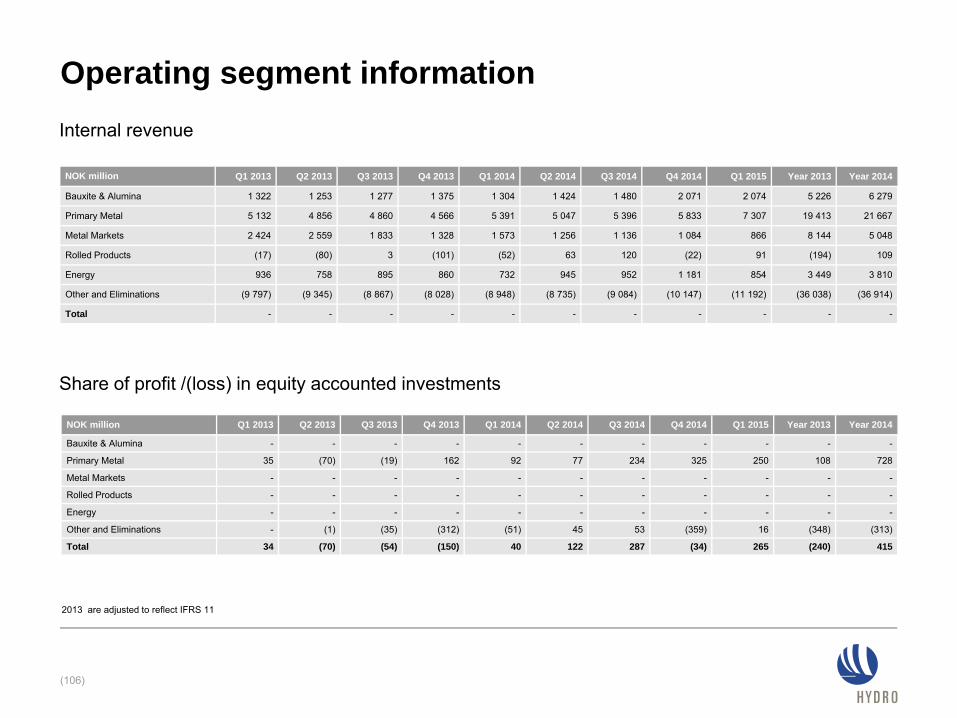
Internal revenue
Share of profit /(loss) in equity accounted investments
(106)
2013 are adjusted to reflect IFRS 11
NOK million Q1 2013 Q2 2013 Q3 2013 Q4 2013 Q1 2014 Q2 2014 Q3 2014 Q4 2014 Q1 2015 Year 2013 Year 2014
Bauxite & Alumina 1 322 1 253 1 277 1 375 1 304 1 424 1 480 2 071 2 074 5 226 6 279
Primary Metal 5 132 4 856 4 860 4 566 5 391 5 047 5 396 5 833 7 307 19 413 21 667
Metal Markets 2 424 2 559 1 833 1 328 1 573 1 256 1 136 1 084 866 8 144 5 048
Rolled Products (17) (80) 3 (101) (52) 63 120 (22) 91 (194) 109
Energy 936 758 895 860 732 945 952 1 181 854 3 449 3 810
Other and Eliminations (9 797) (9 345) (8 867) (8 028) (8 948) (8 735) (9 084) (10 147) (11 192) (36 038) (36 914)
Total - - - - - - - - - - -
NOK million Q1 2013 Q2 2013 Q3 2013 Q4 2013 Q1 2014 Q2 2014 Q3 2014 Q4 2014 Q1 2015 Year 2013 Year 2014
Bauxite & Alumina - - - - - - - - - - -
Primary Metal 35 (70) (19) 162 92 77 234 325 250 108 728
Metal Markets - - - - - - - - - - -
Rolled Products - - - - - - - - - - -
Energy - - - - - - - - - - -
Other and Eliminations - (1) (35) (312) (51) 45 53 (359) 16 (348) (313)
Total 34 (70) (54) (150) 40 122 287 (34) 265 (240) 415
Operating segment information

Graph excludes NOK 1 billion in capital employed in Other and Eliminations
Capital employed – upstream focus
(107)
Operating segment information
NOK million Mar 31, 2015
Bauxite & Alumina 32 636
Primary Metal 30 547
Metal Markets 3 539
Rolled Products 10 493
Energy 2 857
Other and Eliminations (992)
Total 79 079
Bauxite & Alumina 41%
Primary Metal 38%
Metal Markets 4%
Rolled Products 13%
Energy 4%
NOK million Q1 2013 Q2 2013 Q3 2013 Q4 2013 Q1 2014 Q2 2014 Q3 2014 Q4 2014 Q1 2015 Year 2013 Year 2014
Bauxite & Alumina 429 448 417 424 410 431 442 519 460 1 718 1 802
Primary Metal 470 472 461 452 437 427 431 499 511 1 855 1 794
Metal Markets 18 18 38 24 49 21 21 22 23 98 112
Rolled Products 160 163 170 184 170 172 174 329 173 677 845
Energy 40 35 37 37 39 40 41 42 47 150 162
Other and Eliminations 15 15 15 101 13 13 13 17 15 146 55
Total 1 131 1 150 1 139 1 223 1 117 1 104 1 121 1 428 1 229 4 644 4 771
Depreciation, amortization and impairment
2013 are adjusted to reflect IFRS 11

Income statements
(108)
NOK million Q1 2015 Q4 2014 Q1 2014 Year 2014
RevenueShare of the profit (loss) in equity accounted investmentsOther income, net
23 290265271
21 656(34)327
18 28240
132
77 907415751
Total revenue and income 23 827 21 948 18 454 79 073
Raw material and energy expenseEmployee benefit expenseDepreciation, amortization and impairmentOther expenses
14 6622 2951 2292 435
13 6972 1041 4282 424
12 2872 0331 1172 194
51 4808 0894 7719 059
Earnings before financial items and tax (EBIT) 3 206 2 295 822 5 674
Financial incomeFinancial expense
88(1 768)
115(2 456)
6329
347(3 900)
Income (loss) from continuing operations before taxIncome taxes
1 526(455)
(46)(122)
914(452)
2 121(892)
Net income (loss) 1 072 (168) 462 1 228
Net income (loss) attributable to minority interestNet income (loss) attributable to Hydro shareholders
124948
202(370)
69393
432797
Earnings per share attributable to Hydro shareholders 0.46 (0.18) 0.19 0.39
NOK million Q1 2013 Q2 2013 Q3 2013 Q4 2013 Q1 2014 Q2 2014 Q3 2014 Q4 2014 Q1 2015 Year2013 Year2014
Net income (loss) 263 (665) 321 (758) 462 269 665 (168) 1 072 (839) 1 228
Underlying net income (loss) 649 427 393 140 388 318 1 043 1 979 2 206 1 610 3 728
Earnings per share 0.14 (0.31) 0.11 (0.39) 0.19 0.09 0.29 (0.18) 0.46 (0.45) 0.39
Underlying earnings per share 0.30 0.19 0.14 0.02 0.16 0.13 0.43 0.83 0.95 0.65 1.55
2013 are adjusted to reflect IFRS 11

(109)
NOK million Mar 31 2015 Dec 31 2014 Sep 30 2014 Jun 30 2014 Mar 31 2014
Cash and cash equivalentsShort-term investmentsAccounts receivableInventoriesOther current assets
7 1722 456
15 12213 392
272
9 2531 786
11 70312 642
543
6 0451 745
11 28010 334
345
6 6171 765
10 83510 213
371
6 4763 081
11 1169 599
325
Property, plant and equipmentIntangible assetsInvestments accounted for using the equity methodPrepaid pensionOther non-current assets
50 9525 332
18 6793 7536 015
55 7195 947
18 0952 8817 703
51 6305 481
17 4422 8977 075
54 0415 828
16 7173 1787 082
52 5595 598
16 7753 8016 394
Total assets 123 145 126 273 114 275 116 647 115 724
Bank-loans and other interest-bearing short-term debtTrade and other payablesOther current liabilities
4 23910 5934 373
6 0399 6633 414
5 0078 5892 904
6 1418 9362 608
6 2559 0733 002
Long-term debtProvisionsPension liabilitiesDeferred tax liabilitiesOther non-current liabilities
5 7222 802
13 4071 3183 146
5 1283 993
12 7961 6763 622
4 8502 583
10 7722 4952 476
4 0932 857
10 2572 8942 599
3 9412 7149 7982 8332 133
Equity attributable to Hydro shareholdersMinority interest
72 0685 477
74 0305 911
69 1155 484
70 5425 720
70 5335 443
Total liabilities and equity 123 145 126 273 114 275 116 647 115 724
Balance sheets
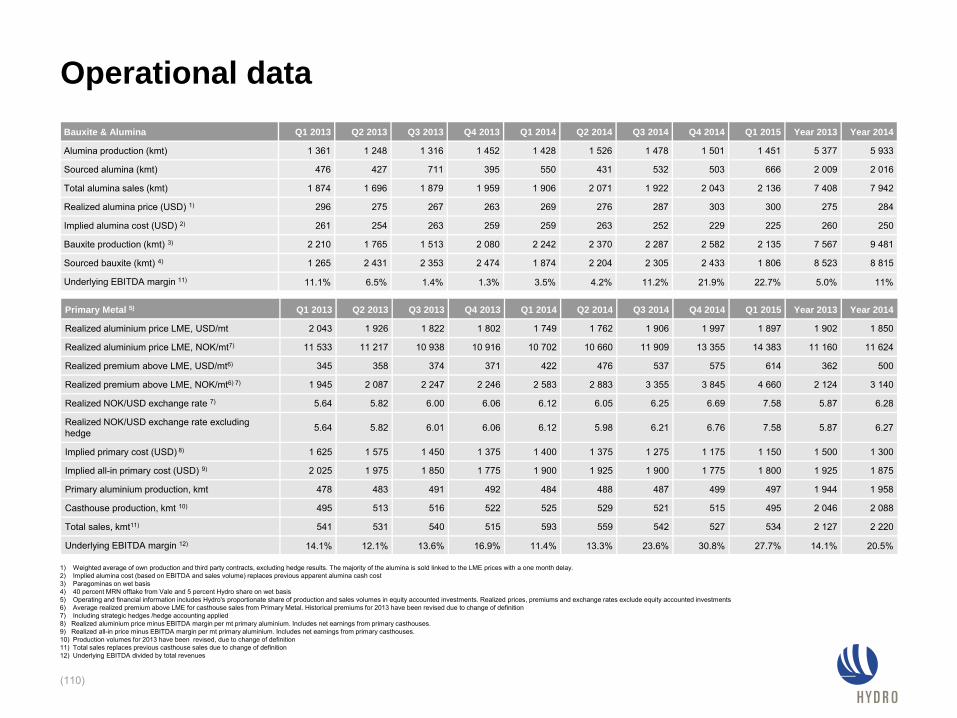
1) Weighted average of own production and third party contracts, excluding hedge results. The majority of the alumina is sold linked to the LME prices with a one month delay.2) Implied alumina cost (based on EBITDA and sales volume) replaces previous apparent alumina cash cost3) Paragominas on wet basis4) 40 percent MRN offtake from Vale and 5 percent Hydro share on wet basis5) Operating and financial information includes Hydro's proportionate share of production and sales volumes in equity accounted investments. Realized prices, premiums and exchange rates exclude equity accounted investments6) Average realized premium above LME for casthouse sales from Primary Metal. Historical premiums for 2013 have been revised due to change of definition7) Including strategic hedges /hedge accounting applied8) Realized aluminium price minus EBITDA margin per mt primary aluminium. Includes net earnings from primary casthouses.9) Realized all-in price minus EBITDA margin per mt primary aluminium. Includes net earnings from primary casthouses.10) Production volumes for 2013 have been revised, due to change of definition11) Total sales replaces previous casthouse sales due to change of definition12) Underlying EBITDA divided by total revenues
(110)
Bauxite & Alumina Q1 2013 Q2 2013 Q3 2013 Q4 2013 Q1 2014 Q2 2014 Q3 2014 Q4 2014 Q1 2015 Year 2013 Year 2014
Alumina production (kmt) 1 361 1 248 1 316 1 452 1 428 1 526 1 478 1 501 1 451 5 377 5 933
Sourced alumina (kmt) 476 427 711 395 550 431 532 503 666 2 009 2 016
Total alumina sales (kmt) 1 874 1 696 1 879 1 959 1 906 2 071 1 922 2 043 2 136 7 408 7 942
Realized alumina price (USD) 1) 296 275 267 263 269 276 287 303 300 275 284
Implied alumina cost (USD) 2) 261 254 263 259 259 263 252 229 225 260 250
Bauxite production (kmt) 3) 2 210 1 765 1 513 2 080 2 242 2 370 2 287 2 582 2 135 7 567 9 481
Sourced bauxite (kmt) 4) 1 265 2 431 2 353 2 474 1 874 2 204 2 305 2 433 1 806 8 523 8 815
Underlying EBITDA margin 11) 11.1% 6.5% 1.4% 1.3% 3.5% 4.2% 11.2% 21.9% 22.7% 5.0% 11%
Primary Metal 5) Q1 2013 Q2 2013 Q3 2013 Q4 2013 Q1 2014 Q2 2014 Q3 2014 Q4 2014 Q1 2015 Year 2013 Year 2014
Realized aluminium price LME, USD/mt 2 043 1 926 1 822 1 802 1 749 1 762 1 906 1 997 1 897 1 902 1 850
Realized aluminium price LME, NOK/mt7) 11 533 11 217 10 938 10 916 10 702 10 660 11 909 13 355 14 383 11 160 11 624
Realized premium above LME, USD/mt6) 345 358 374 371 422 476 537 575 614 362 500
Realized premium above LME, NOK/mt6) 7) 1 945 2 087 2 247 2 246 2 583 2 883 3 355 3 845 4 660 2 124 3 140
Realized NOK/USD exchange rate 7) 5.64 5.82 6.00 6.06 6.12 6.05 6.25 6.69 7.58 5.87 6.28
Realized NOK/USD exchange rate excluding hedge 5.64 5.82 6.01 6.06 6.12 5.98 6.21 6.76 7.58 5.87 6.27
Implied primary cost (USD) 8) 1 625 1 575 1 450 1 375 1 400 1 375 1 275 1 175 1 150 1 500 1 300
Implied all-in primary cost (USD) 9) 2 025 1 975 1 850 1 775 1 900 1 925 1 900 1 775 1 800 1 925 1 875
Primary aluminium production, kmt 478 483 491 492 484 488 487 499 497 1 944 1 958
Casthouse production, kmt 10) 495 513 516 522 525 529 521 515 495 2 046 2 088
Total sales, kmt11) 541 531 540 515 593 559 542 527 534 2 127 2 220
Underlying EBITDA margin 12) 14.1% 12.1% 13.6% 16.9% 11.4% 13.3% 23.6% 30.8% 27.7% 14.1% 20.5%
Operational data

1) Includes external and internal sales from primary casthouse operations, remelters and third party Metal sources2) Sales volumes for 2013 and 2014 have been restated due to change of definition3) Underlying EBIT used for calculations in 2013, are pro forma4) Underlying EBITDA divided by total revenues2013 are adjusted to reflect IFRS 11
(111)
Metal Markets Q1 2013 Q2 2013 Q3 2013 Q4 2013 Q1 2014 Q2 2014 Q3 2014 Q4 2014 Q1 2015 Year2013 Year2014
Remelt production (1 000 mt) 135 132 127 123 139 141 128 130 145 517 538
Third-party Metal Products sales (1 000 mt)2) 88 84 82 82 84 81 80 79 74 336 324
Metal Products sales excl. ingot trading (1 000 mt) 1)2) 733 722 693 669 776 726 696 654 626 2 816 2 852
Hereof external sales excl. ingot trading (1 000 mt) 2) 554 540 543 571 654 619 609 596 571 2 207 2 478
External revenue (NOK million) 7 429 7 321 7 228 7 668 8 719 8 853 9 784 10 625 11 315 29 646 37 981
Rolled Products Q1 2013 Q2 2013 Q3 2013 Q4 2013 Q1 2014 Q2 2014 Q3 2014 Q4 2014 Q1 2015 Year2013 Year2014
Rolled Products external shipments (1 000 mt) 236 245 234 226 243 245 244 213 227 941 946
Rolled Products – Underlying EBIT per mt, NOK 641 745 776 442 744 723 996 452 1 284 656 738
Underlying EBITDA margin 4)6.2% 6.6% 7.0% 5.8% 6.7% 6.6% 7.4% 5.3% 7.5% 6.4% 6.5%
Extruded Products – Discontinued operations Q1 2013 Q2 2013Jul/Aug
2013 Q4 2013 Q1 2014 Q2 2014 Q3 2014 Q4 2014 Q1 2015 Year2013 Year2014
Extruded external shipments (1 000 mt) 119 127 78 - - - - - - 324 -
Extruded – underlying EBIT per mt, NOK 3) (187) 392 115 - - - - - - 113 -
Energy Q1 2013 Q2 2013 Q3 2013 Q4 2013 Q1 2014 Q2 2014 Q3 2014 Q4 2014 Q1 2015 Year2013 Year2014
Power production, GWh 2 904 2 090 2 838 2 411 2 964 2 248 2 170 2 823 3 071 10 243 10 206
Net spot sales, GWh 1 518 829 1 673 1 089 1 581 1 028 873 1 339 1 610 5 110 4 820
Nordic spot electricity price, NOK/MWh 313.0 294.0 284.0 296.0 252.0 211.0 263.0 264.0 246.0 297.0 248.0
Southern Norway spot electricity price (NO2), NOK/MWh 311.0 296.0 267.0 287.0 249.0 168.0 247.0 248.0 238.0 290.0 228.0
Underlying EBITDA margin 4)31.6% 24.2% 31.2% 26.3% 30.8% 15.1% 18.4% 21.3% 27.6% 28.7% 21.6%
Operational data
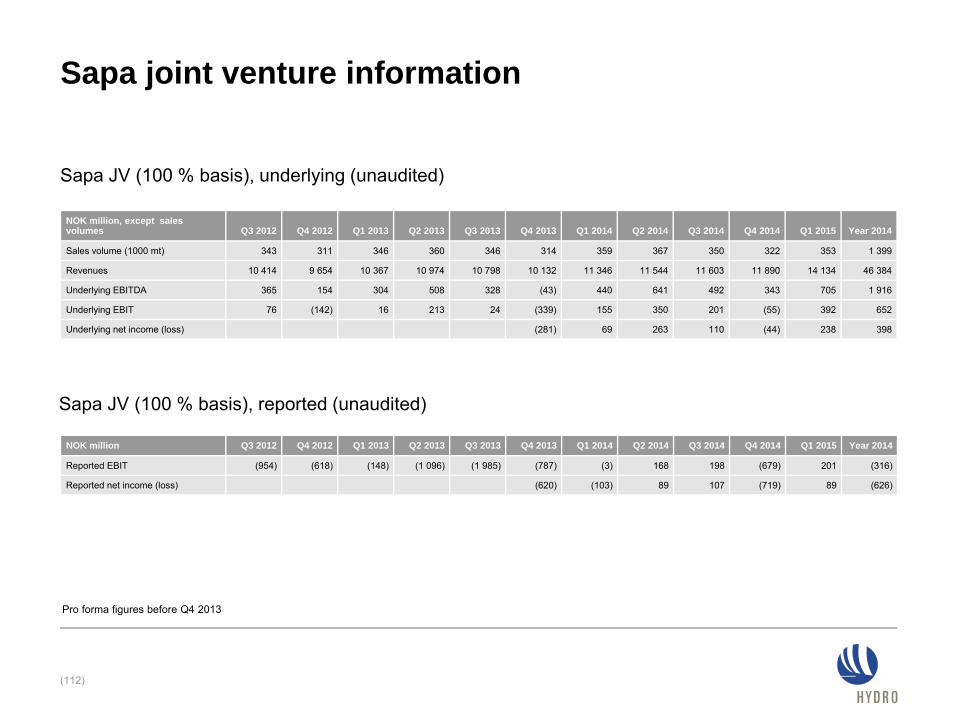
(112)
NOK million, except sales volumes Q3 2012 Q4 2012 Q1 2013 Q2 2013 Q3 2013 Q4 2013 Q1 2014 Q2 2014 Q3 2014 Q4 2014 Q1 2015 Year 2014
Sales volume (1000 mt) 343 311 346 360 346 314 359 367 350 322 353 1 399
Revenues 10 414 9 654 10 367 10 974 10 798 10 132 11 346 11 544 11 603 11 890 14 134 46 384
Underlying EBITDA 365 154 304 508 328 (43) 440 641 492 343 705 1 916
Underlying EBIT 76 (142) 16 213 24 (339) 155 350 201 (55) 392 652
Underlying net income (loss) (281) 69 263 110 (44) 238 398
NOK million Q3 2012 Q4 2012 Q1 2013 Q2 2013 Q3 2013 Q4 2013 Q1 2014 Q2 2014 Q3 2014 Q4 2014 Q1 2015 Year 2014
Reported EBIT (954) (618) (148) (1 096) (1 985) (787) (3) 168 198 (679) 201 (316)
Reported net income (loss) (620) (103) 89 107 (719) 89 (626)
Sapa JV (100 % basis), underlying (unaudited)
Sapa JV (100 % basis), reported (unaudited)
Pro forma figures before Q4 2013
Sapa joint venture information

(113)(113)
Investor Relations in Hydro
Pål KildemoHead of Investor Relations
t: +47 970 96 711e: [email protected]
Next events
Annual General meetingMay 6, 2015
Sapa JV conference callMay 18, 2015
Second quarter resultsJuly 21, 2015
For more information seewww.hydro.com/ir
Olena LepikhinaInvestor Relations Officer
t: +47 96853035e: [email protected]