Embed Size (px)
Citation preview
0
INVESTOR PRESENTATIONJ A N U A R Y 1 5 , 2 0 1 9
1DISCLAIMER
© 2018 Hilton Grand Vacations Inc. Proprietary
Forward-Looking Statements
This presentation contains forward-looking statements within the meaning of the federal securities laws (including Section 27A of the Securities Act of 1933, as amended, and Section 21E of the Securities Exchange Act of 1934, as amended) and the Private Securities Litigation Reform Act of 1995. Forward-looking statements include all statements that are not historical facts and can be identified by the use of forward-looking terminology such as the words “outlook,” “believes,” “expects,” “potential,” “continues,” “may,” “will,” “should,” “could,” “seeks,” “approximately,” “projects,” “predicts,” “intends,” “plans,” “estimates,” “anticipates” or the negative version of these words or other comparable words. These forward-looking statements are based on management’s beliefs, expectations and assumptions and information currently available to management, and are subject to risks and uncertainties. Actual results could differ materially from those expressed in forward-looking statements because of factors such as: inherent business, financial and operating risks of the timeshare industry; adverse economic or market conditions that may affect the purchasing and vacationing decisions of consumers or otherwise harm our business; intense competition in the timeshare industry, which could lead to lower revenue or operating margins; the termination of material fee-for-service agreements with third parties; the ability of the Company to manage risks associated with our international activities, including complying with laws and regulations affecting our international operations; exposure to increased economic and operational uncertainties from expanding global operations, including the effects of foreign currency exchange; potential liability under anti-corruption and other laws resulting from our global operations; changes in tax rates and exposure to additional tax liabilities; the impact of future changes in legislation, regulations or accounting pronouncements; acquisitions, joint ventures, and strategic alliances that that may not result in expected benefits and that may have an adverse effect on our business; our dependence on development activities to secure inventory; cyber-attacks and security vulnerabilities that could lead to reduced revenue, increased costs, liability claims, or harm to our reputation or competitive position; disclosure of personal data that could cause liability and harm to our reputation; abuse of our advertising or social platforms that may harm our reputation or user engagement; outages, data losses, and disruptions of our online services; claims against us that may result in adverse outcomes in legal disputes; risks associated with our debt agreements and instruments, including variable interest rates, operating and financial restrictions, and our ability to borrow additional money or service our indebtedness; the continued service and availability of key executives and employees; and catastrophic events or geo-political conditions that may disrupt our business. In addition, there may be other risks and uncertainties that we are unable to predict at this time or that we currently do not expect to have a material adverse effect on our business and financial results.
Accordingly, you should not put undue reliance on any such forward-looking statements. For more information about these risks and uncertainties, as well as other potential factors that could affect our business and financial results, please refer to the “Risk Factors” and “Management’s Discussion and Analysis of Financial Condition and Results of Operations” sections of our SEC filings, including, but not limited to our most recent annual report on Form 10-K and quarterly reports on Form 10-Q, and those described from time to time in our future SEC filings.
Non-GAAP Financial Measures
This presentation includes discussion of terms that are not recognized terms under U.S. Generally Accepted Accounting Principles (“GAAP”), and financial measures that are not calculated in accordance with GAAP, including contract sales, sales revenue, real estate margin, tour flow, volume per guest (“VPG”), earnings before interest expense (excluding interest expense relating to our non-recourse debt), income tax expense, depreciation and amortization (“EBITDA”), Adjusted EBITDA, Adjusted EBITDA Margin, Net Debt and Net Debt / Adj. EBITDA, Free Cash Flow and Return on Invested Capital (“ROIC”). These non-GAAP financial measures should be considered only as supplemental to, and not as superior to, financial measures prepared in accordance with GAAP.
We derived the non-GAAP financial measures from the following sources:
• Audited consolidated statements of operations for the years ended December 31, 2017, 2016, 2015, 2014 and 2013 and from our audited consolidated balance sheets as of December 31, 2017, 2016, 2015 and 2014 – Prior to our spin-off from our former parent, Hilton Worldwide (“Hilton”), on January 3, 2017, our consolidated financial statements were derived from the financial results of our former parent and included certain indirect general and administrative costs allocated to us for certain functions and support services primarily on the basis of financial and operating metrics that Hilton has historically used to allocate resources and evaluate performance against its strategic objectives. Both we and Hilton, as our former parent, consider the basis on which expenses have been allocated for periods prior to our spin-off to be a reasonable reflection of the utilization of services provided to or the benefit received by us during the periods presented;
• Unaudited consolidated statement of operations for the years ended December 31, 2012 and 2011 and from our unaudited consolidated balance sheet as of December 31, 2013, 2012 and 2011 – These financial statements also contained allocations from Hilton, as our former parent, and were reviewed by our independent registered public accounting firm in connection with the spin-off transaction; and
• All financial statements for all periods prior to the year ended December 31, 2011 were derived from Hilton’s financial statements, do not reflect allocations from Hilton and were unaudited.
We believe such non-GAAP financial measures provide useful information to our investors about us and our financial condition and results of operations since many of these measures are used by our management to evaluate our operating performance and by securities analyst and investors as a common financial measure for comparison purposes in our industry. See “Management’s Discussion and Analysis of Financial Condition and Results of Operations—Key Business and Financial Metrics and Terms Used by Management” and “—Results of Operations” sections of our SEC filings, including, but not limited to our most recent annual report on Form 10-K and quarterly reports on Form 10-Q, for a more detailed discussion of the meanings of these terms and our reasons for providing non-GAAP financial measures. Full reconciliations of non-GAAP financial measures to the most directly comparable GAAP financial measures for the historical periods and for 2018 and 2019 full year estimates discussed in this presentation appear in the appendix of this presentation. For years 2020 and beyond, refer to “Forward Looking Non-GAAP Financial Measures” below.
Forward-Looking Non-GAAP Financial Measures
In addition to certain non-GAAP financial measures for historical periods noted above, this presentation contains certain forward-looking non-GAAP financial measures. We provide these forward-looking non-GAAP financial measures to investors on a prospective basis for the same reasons that we provide them to investors on a historical basis. For years 2020 and beyond, we are unable to provide a reconciliation of these forward-looking non-GAAP financial measures to the most directly comparable forward-looking GAAP financial measures without unreasonable effort due to variability and difficulty in making accurate projections for items that would be required to be included in the GAAP financial measures, such as: income tax expense (benefit); interest expense; asset dispositions; foreign currency transactions; debt restructurings/retirements; non-cash impairment losses; reorganization costs, including severance and relocation costs; share-based and certain other compensation expenses; and other items. We believe such reconciliations would imply a degree of precision that would be confusing or misleading to investors.
Disclaimer
This presentation and the information contained herein are solely for information purposes only. This presentation does not constitute a recommendation regarding securities of Hilton Grand Vacations Inc. This presentation or any related oral presentation does not constitute any offer to sell or issue, or the solicitation of an offer to subscribe for, buy or otherwise acquire any securities of Hilton Grand Vacations Inc. This presentation is not directed to, or intended for distribution to or use by, any person or entity that is a citizen or resident located in any jurisdiction where such distribution, publication, availability or use would be contrary to law or regulation or which would require registration or qualification under the applicable laws of such jurisdiction.
We undertake no obligation to publicly update or review any forward-looking statement or information to conform to actual results, whether as a result of new information, future developments, changes in the Company’s expectations, or otherwise, except as required by law.
All information in this presentation is as of October 31, 2018.
2
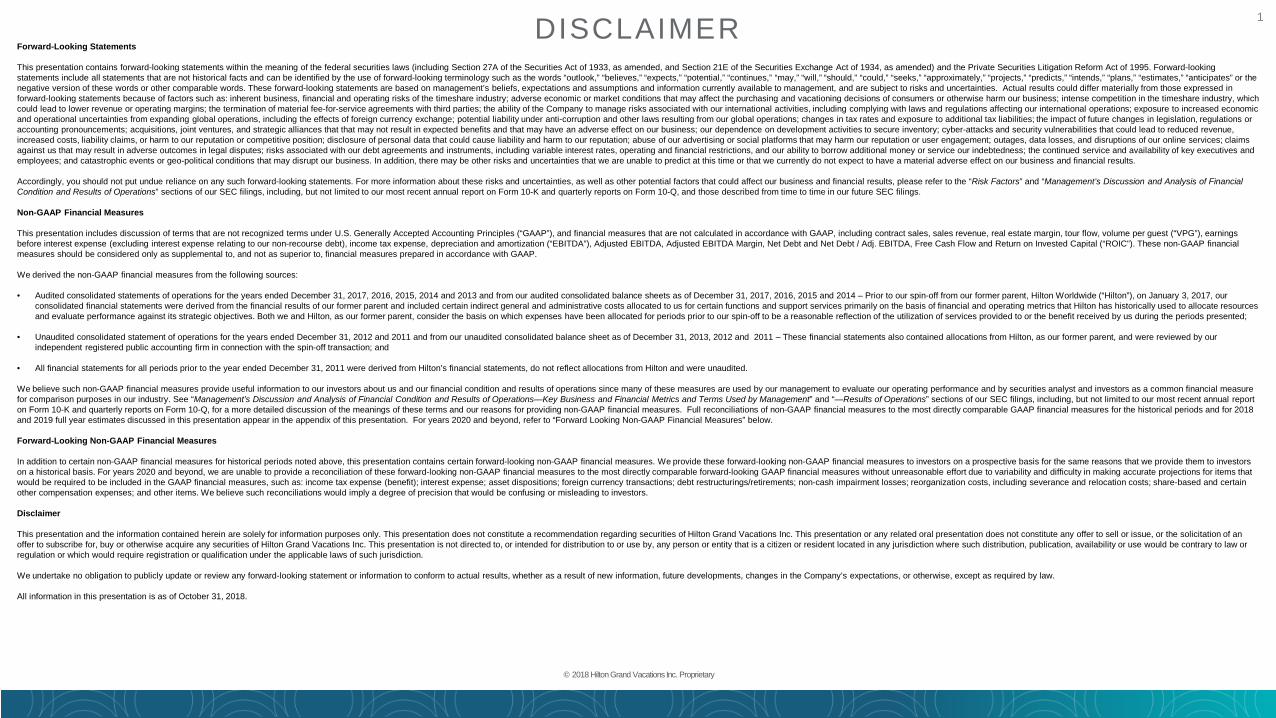
Our dynamic capital allocation strategy to maximize returns is supported by strong financial performance
We manage for strong returns through our unique capital efficient inventory strategy
We have a winning net owner growth driven demand strategy in a great industry
1 4
WHO WE ARE
© 2018 Hilton Grand Vacations Inc. Proprietary
Resilient and proven business model throughout economic cycles that isn’t tied to broader lodging fundamentals
2 3

3
NET OWNER GROWTH (NOG)DRIVEN STRATEGY
H I L T O N W A I K O L O A V I L L A G E © 2018 Hilton Grand Vacations Inc. Proprietary
4
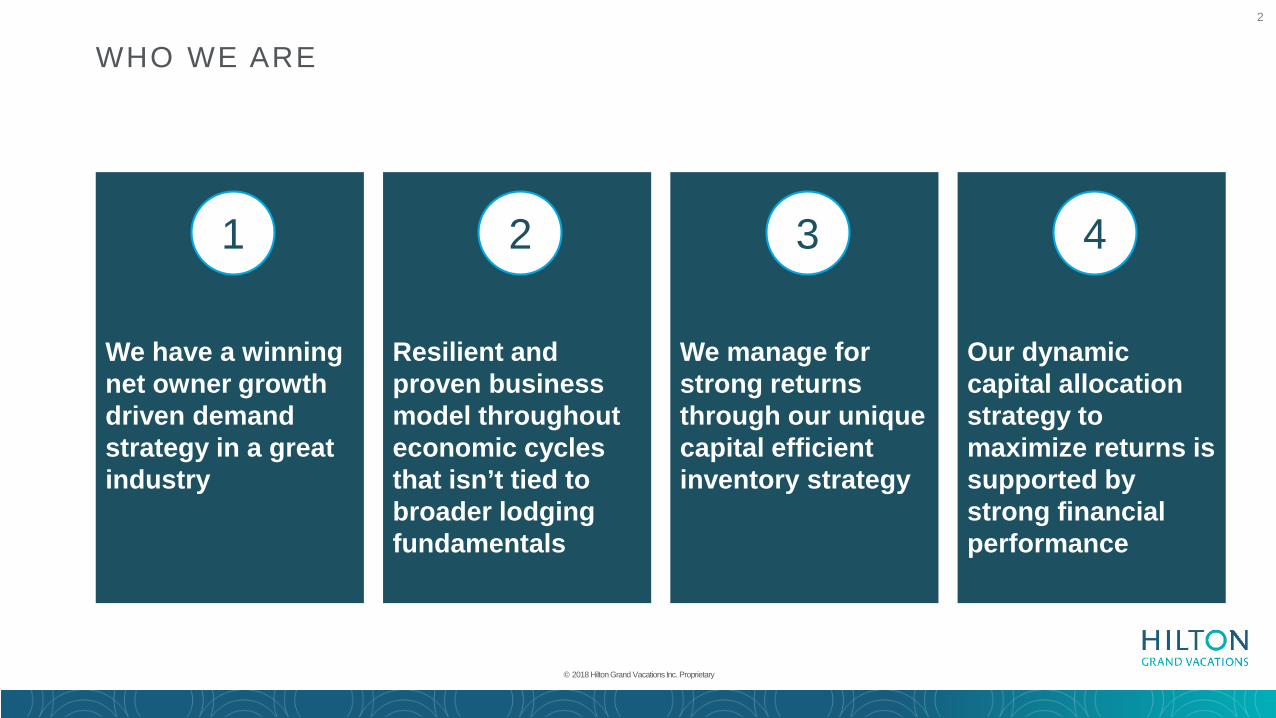
Each new owner is a source of highly
predictable recurring EBITDA
NOG increases the total embedded value in the
business year after year
We realize substantial value in near-term due to faster upgrade cycles
We replenish and expand embedded value by
constantly adding new owners
NOG IS A SIMPLE YET POWERFUL DRIVER OF OUR STRATEGY TO CREATE LONG-TERM SHAREHOLDER VALUE
© 2018 Hilton Grand Vacations Inc. Proprietary
RETAINexisting owners
ADDnew
owners
Net Owner
GROWTH
Create demand
Deliver exceptional vacation experiences
NOG is the y-o-y % change in members
5
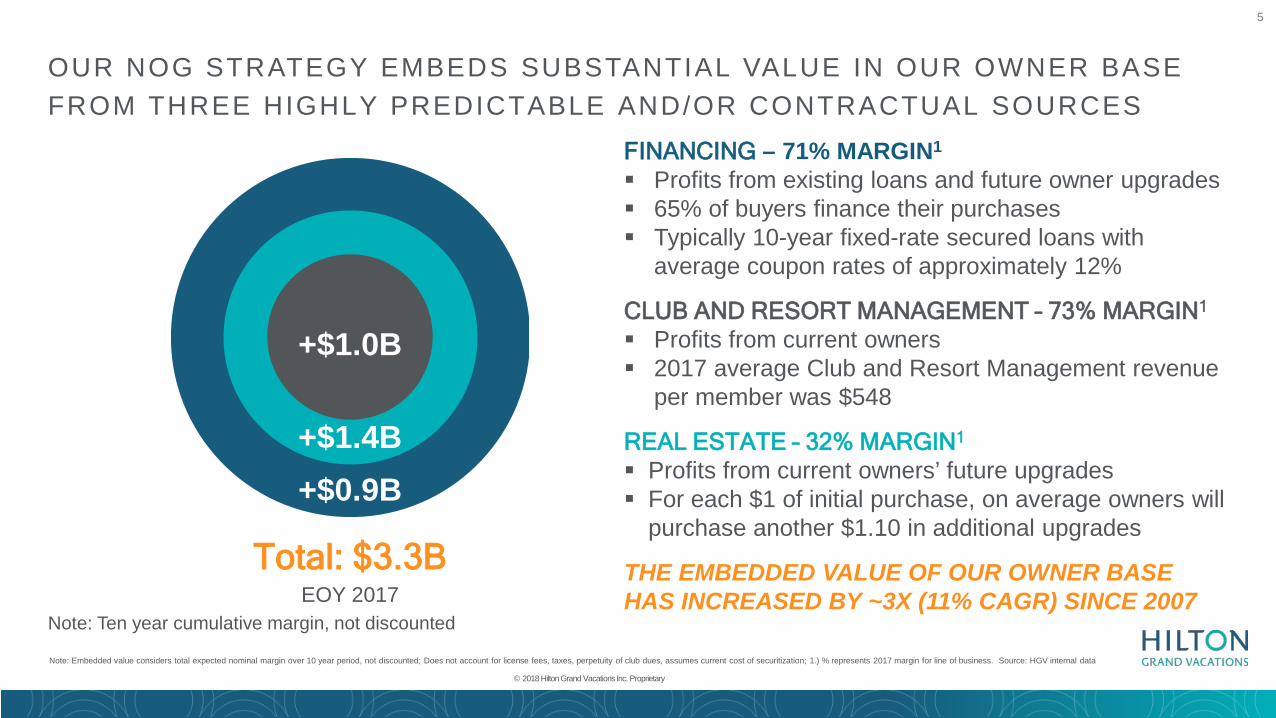
FINANCING – 71% MARGIN1
Profits from existing loans and future owner upgrades 65% of buyers finance their purchases Typically 10-year fixed-rate secured loans with
average coupon rates of approximately 12%
CLUB AND RESORT MANAGEMENT – 73% MARGIN1
Profits from current owners 2017 average Club and Resort Management revenue
per member was $548
REAL ESTATE – 32% MARGIN1
Profits from current owners’ future upgrades For each $1 of initial purchase, on average owners will
purchase another $1.10 in additional upgrades
THE EMBEDDED VALUE OF OUR OWNER BASE HAS INCREASED BY ~3X (11% CAGR) SINCE 2007
Total: $3.3BEOY 2017
+$1.0B
+$1.4B+$0.9B
G R A N D I S L A N D E R
OUR NOG STRATEGY EMBEDS SUBSTANTIAL VALUE IN OUR OWNER BASE FROM THREE HIGHLY PREDICTABLE AND/OR CONTRACTUAL SOURCES
Note: Embedded value considers total expected nominal margin over 10 year period, not discounted; Does not account for license fees, taxes, perpetuity of club dues, assumes current cost of securitization; 1.) % represents 2017 margin for line of business. Source: HGV internal data
© 2018 Hilton Grand Vacations Inc. Proprietary
Note: Ten year cumulative margin, not discounted
6
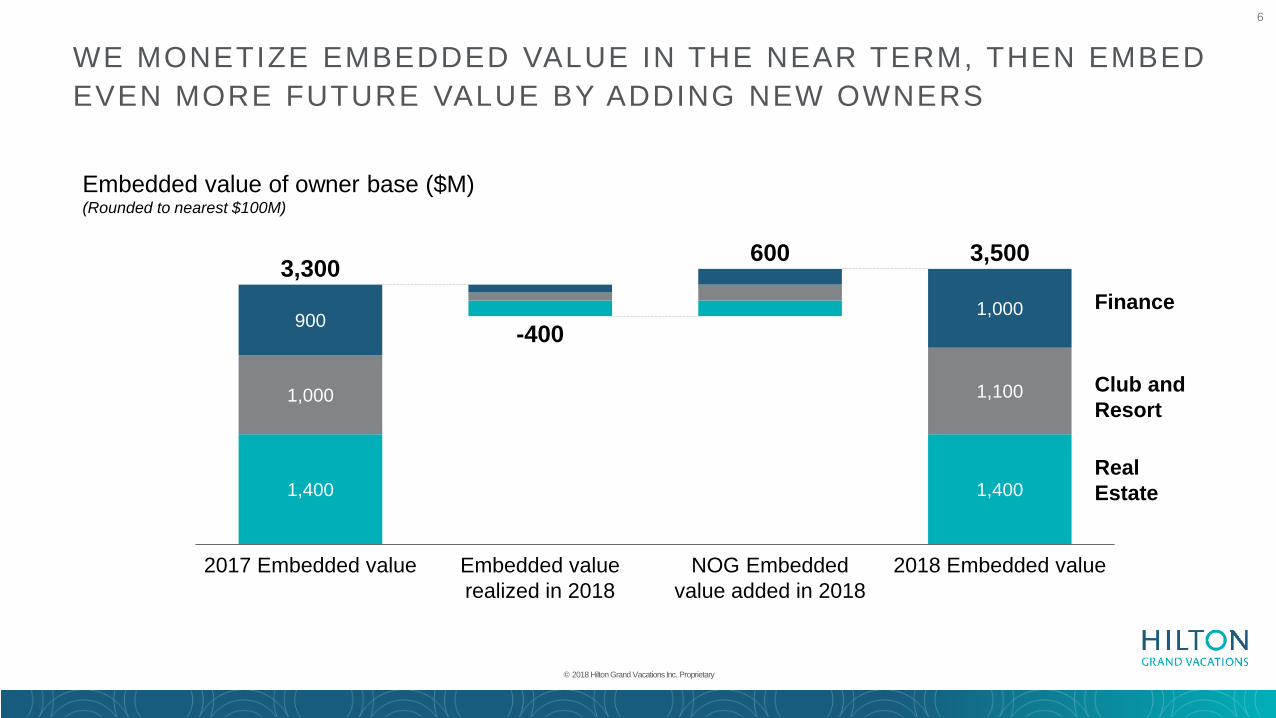
WE MONETIZE EMBEDDED VALUE IN THE NEAR TERM, THEN EMBED EVEN MORE FUTURE VALUE BY ADDING NEW OWNERS
© 2018 Hilton Grand Vacations Inc. Proprietary
1,400 1,400
1,000 1,100
900 1,000
3,300
2017 Embedded value Embedded value realized in 2018
NOG Embedded value added in 2018
2018 Embedded value
-400
600 3,500
Embedded value of owner base ($M)(Rounded to nearest $100M)
Finance
Club and Resort
Real Estate
7
0%5
30%
1510
50%
20%
10%
2520
40%
Years of ownership
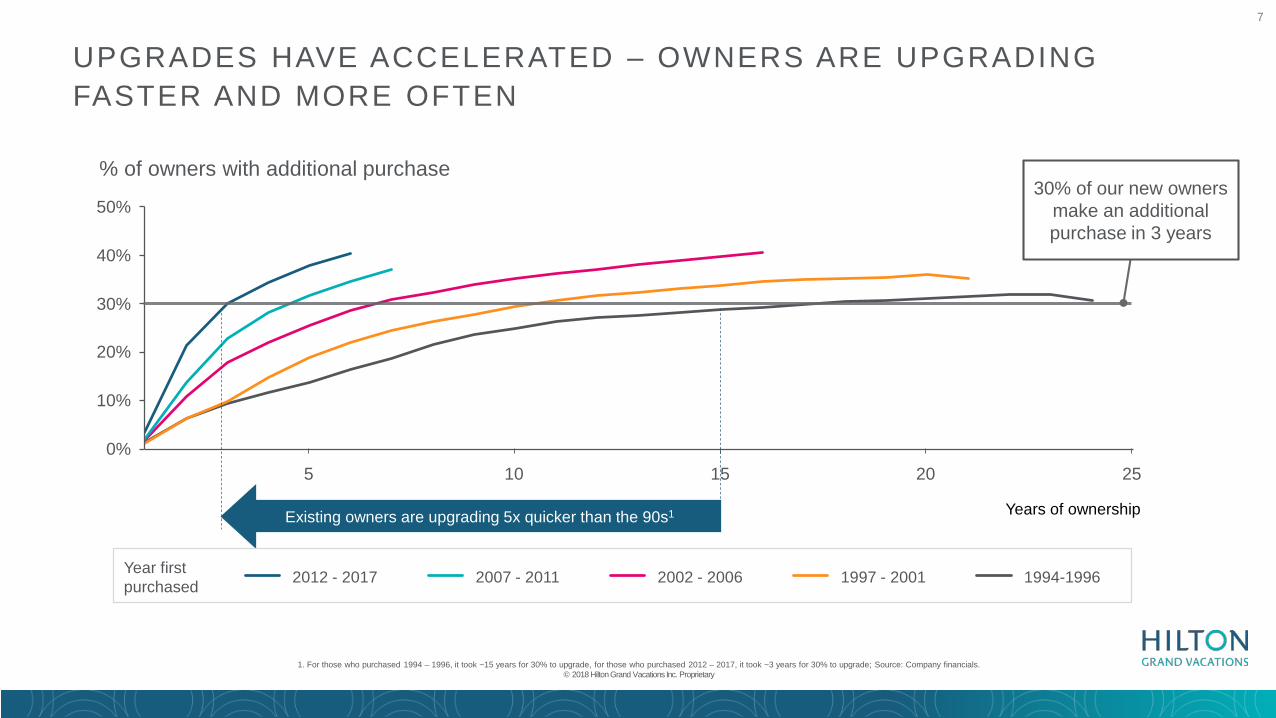
% of owners with additional purchase
1994-19962002 - 20062012 - 2017 1997 - 20012007 - 2011
Existing owners are upgrading 5x quicker than the 90s1
30% of our new owners make an additional purchase in 3 years
UPGRADES HAVE ACCELERATED – OWNERS ARE UPGRADING FASTER AND MORE OFTEN
1. For those who purchased 1994 – 1996, it took ~15 years for 30% to upgrade, for those who purchased 2012 – 2017, it took ~3 years for 30% to upgrade; Source: Company financials. © 2018 Hilton Grand Vacations Inc. Proprietary
Year first purchased
8
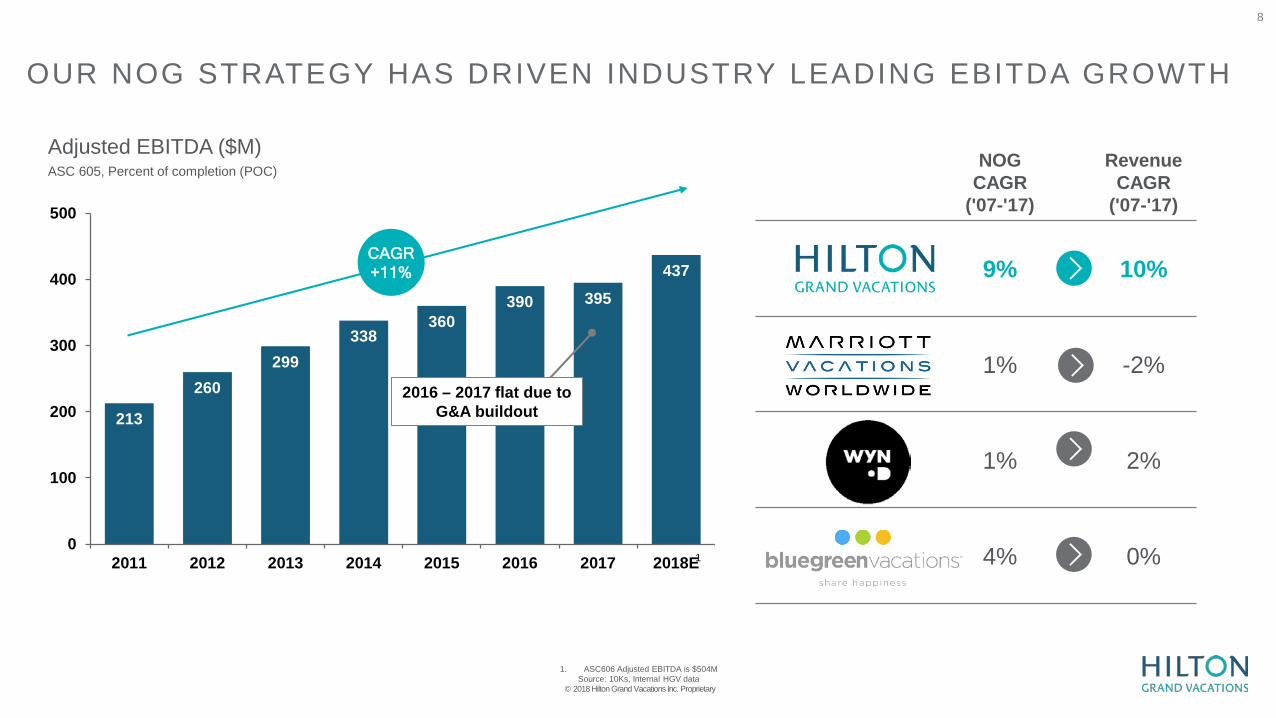
OUR NOG STRATEGY HAS DRIVEN INDUSTRY LEADING EBITDA GROWTH
213
260299
338360
390 395437
0
100
200
300
400
500
2011 2012 2013 2014 2015 2016 2017 2018E
Adjusted EBITDA ($M)ASC 605, Percent of completion (POC)
1. ASC606 Adjusted EBITDA is $504MSource: 10Ks, Internal HGV data
© 2018 Hilton Grand Vacations Inc. Proprietary
CAGR+11%
1
2016 – 2017 flat due to G&A buildout
NOG CAGR
('07-'17)
RevenueCAGR
('07-'17)
9% 10%
1% -2%
1% 2%
4% 0%
9
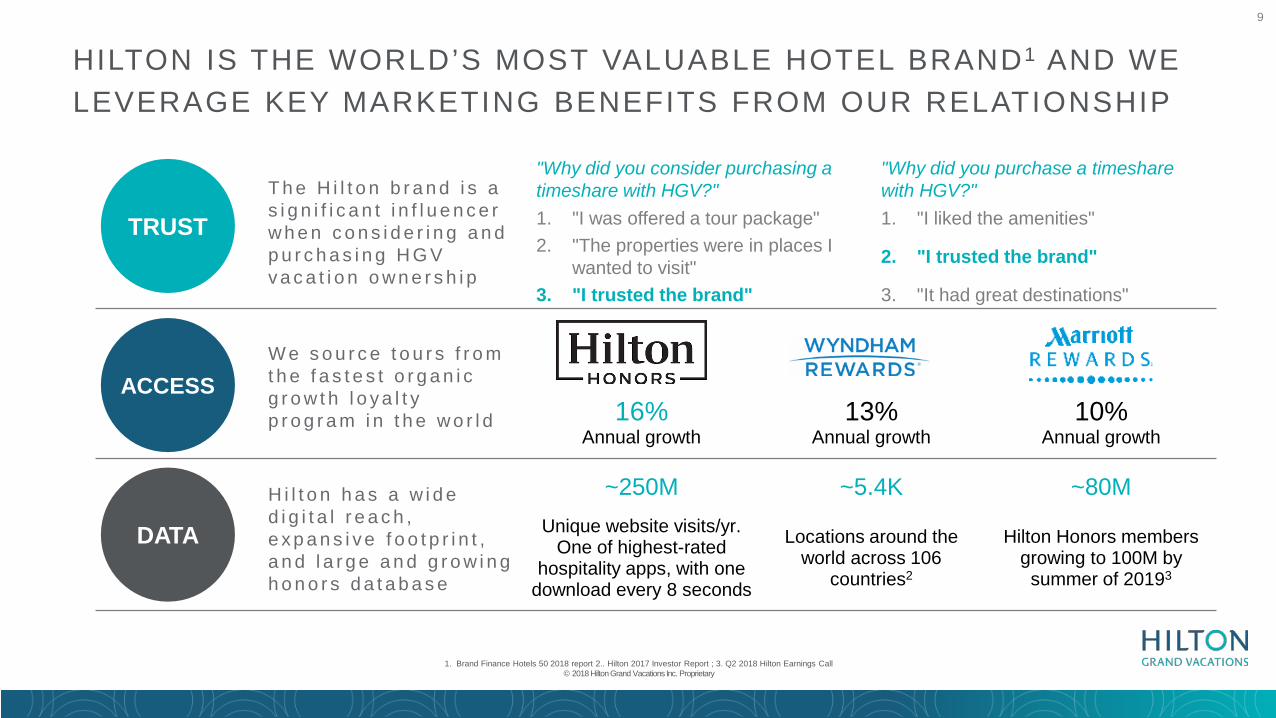
T h e H i l t o n b r a n d i s a s i g n i f i c a n t i n f l u e n c e r w h e n c o n s i d e r i n g a n d p u r c h a s i n g H G V v a c a t i o n o w n e r s h i p
"Why did you consider purchasing a timeshare with HGV?"
"Why did you purchase a timeshare with HGV?"
1. "I was offered a tour package" 1. "I liked the amenities"2. "The properties were in places I
wanted to visit" 2. "I trusted the brand"
3. "I trusted the brand" 3. "It had great destinations"
W e s o u r c e t o u r s f r o m t h e f a s t e s t o r g a n i c g r o w t h l o y a l t y p r o g r a m i n t h e w o r l d 16%
Annual growth13%
Annual growth10%
Annual growth
H i l t o n h a s a w i d e d i g i t a l r e a c h , e x p a n s i v e f o o t p r i n t , a n d l a r g e a n d g r o w i n g h o n o r s d a t a b a s e
~250M ~5.4K ~80MUnique website visits/yr.
One of highest-ratedhospitality apps, with one
download every 8 seconds
Locations around the world across 106
countries2
Hilton Honors members growing to 100M by
summer of 20193
HILTON IS THE WORLD’S MOST VALUABLE HOTEL BRAND1 AND WE LEVERAGE KEY MARKETING BENEFITS FROM OUR RELATIONSHIP
1. Brand Finance Hotels 50 2018 report 2.. Hilton 2017 Investor Report ; 3. Q2 2018 Hilton Earnings Call© 2018 Hilton Grand Vacations Inc. Proprietary
TRUST
ACCESS
DATA
10
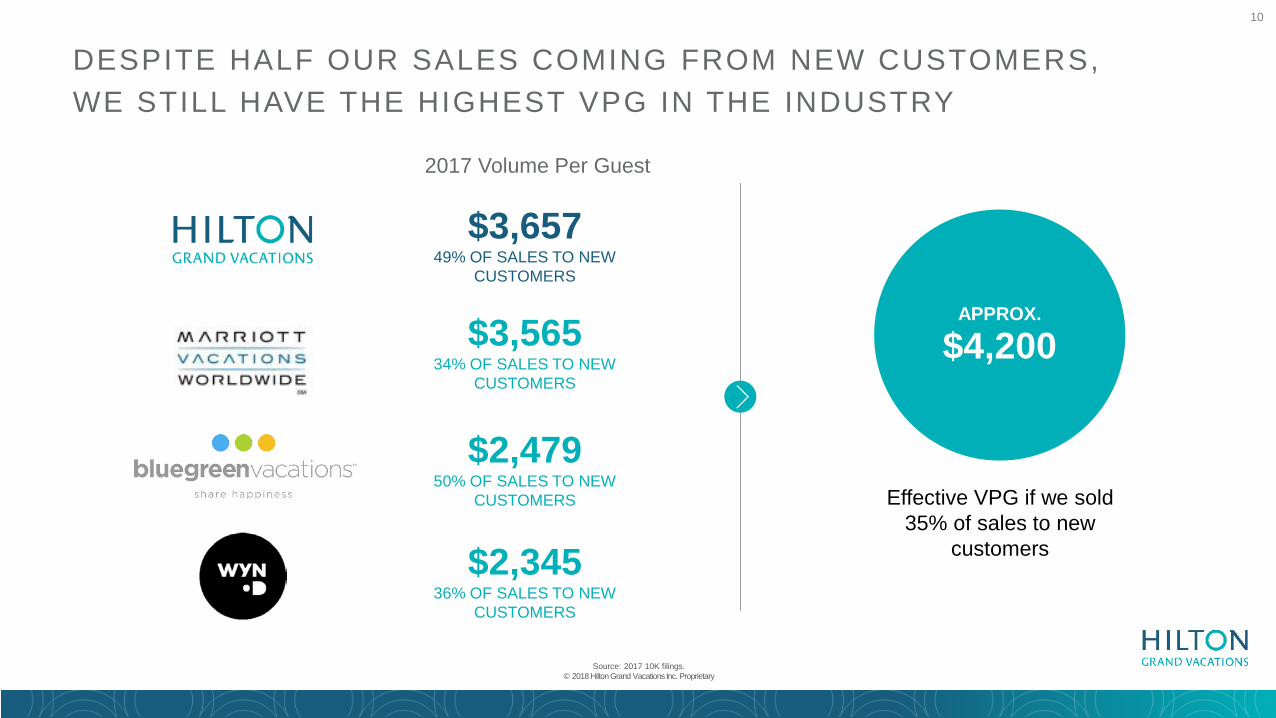
APPROX.
$4,200
Effective VPG if we sold 35% of sales to new
customers
$3,65749% OF SALES TO NEW
CUSTOMERS
$2,34536% OF SALES TO NEW
CUSTOMERS
$2,47950% OF SALES TO NEW
CUSTOMERS
$3,56534% OF SALES TO NEW
CUSTOMERS
2017 Volume Per Guest
DESPITE HALF OUR SALES COMING FROM NEW CUSTOMERS, WE STILL HAVE THE HIGHEST VPG IN THE INDUSTRY
Source: 2017 10K filings. © 2018 Hilton Grand Vacations Inc. Proprietary
11
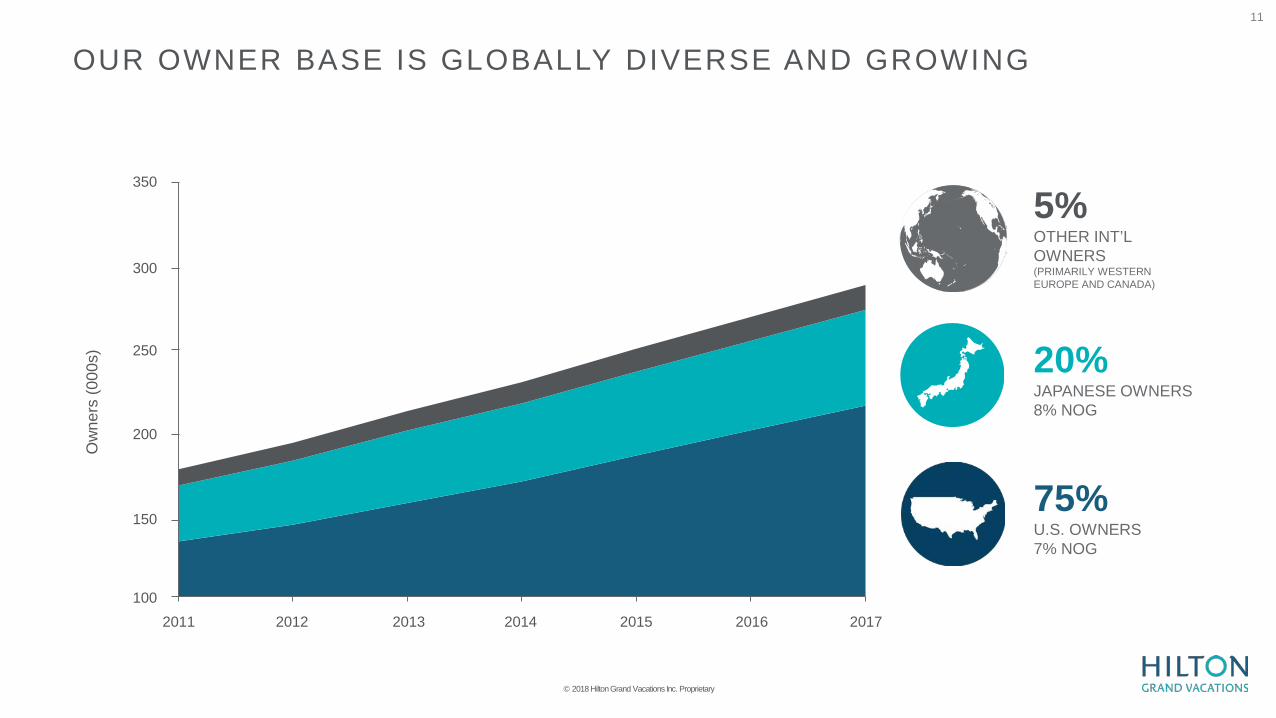
75%U.S. OWNERS7% NOG
20%JAPANESE OWNERS8% NOG
5%OTHER INT’L OWNERS(PRIMARILY WESTERN EUROPE AND CANADA)
150
100
200
300
250
350
2017
Ow
ners
(000
s)
20122011 2015 20162013 2014
OUR OWNER BASE IS GLOBALLY DIVERSE AND GROWING
© 2018 Hilton Grand Vacations Inc. Proprietary
12
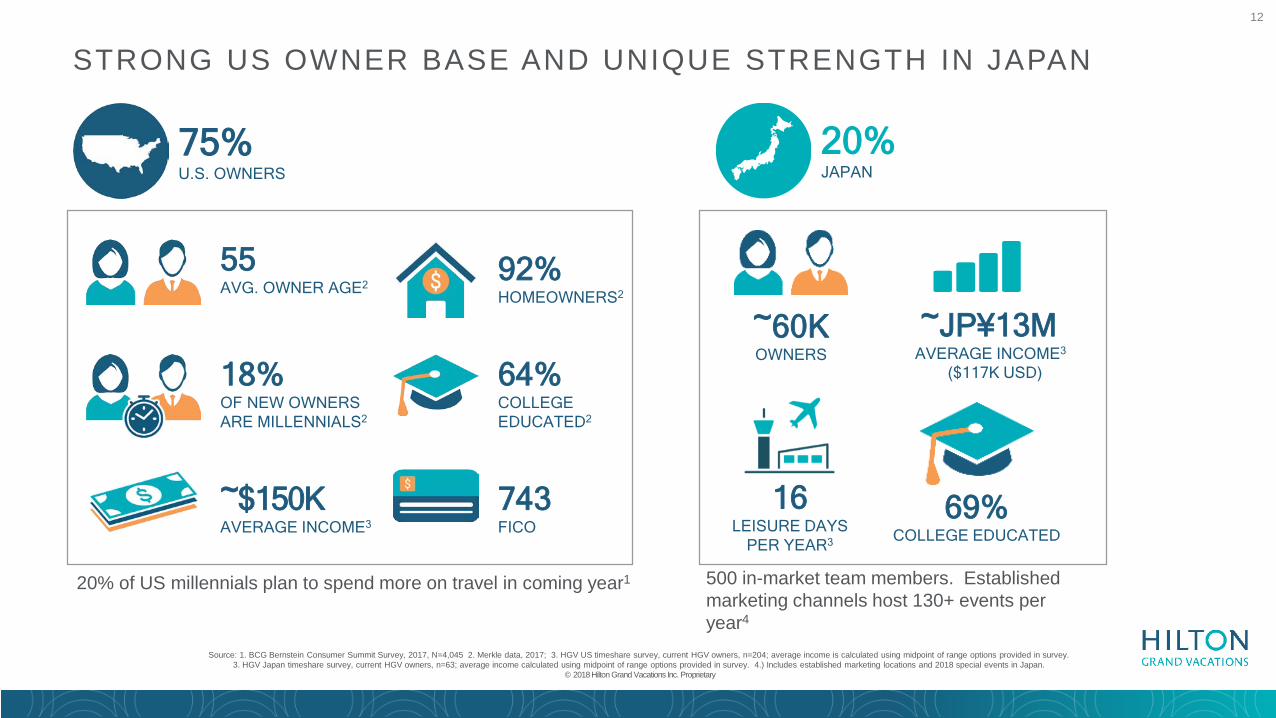
STRONG US OWNER BASE AND UNIQUE STRENGTH IN JAPAN
Source: 1. BCG Bernstein Consumer Summit Survey, 2017, N=4,045 2. Merkle data, 2017; 3. HGV US timeshare survey, current HGV owners, n=204; average income is calculated using midpoint of range options provided in survey.3. HGV Japan timeshare survey, current HGV owners, n=63; average income calculated using midpoint of range options provided in survey. 4.) Includes established marketing locations and 2018 special events in Japan.
© 2018 Hilton Grand Vacations Inc. Proprietary
55AVG. OWNER AGE2
18%OF NEW OWNERS ARE MILLENNIALS2
~$150KAVERAGE INCOME3
75%U.S. OWNERS
92%HOMEOWNERS2
64%COLLEGE EDUCATED2
743FICO
~60KOWNERS
~JP¥13M AVERAGE INCOME3
($117K USD)
16LEISURE DAYS
PER YEAR3
69%COLLEGE EDUCATED
20%JAPAN
20% of US millennials plan to spend more on travel in coming year1 500 in-market team members. Established marketing channels host 130+ events per year4
13
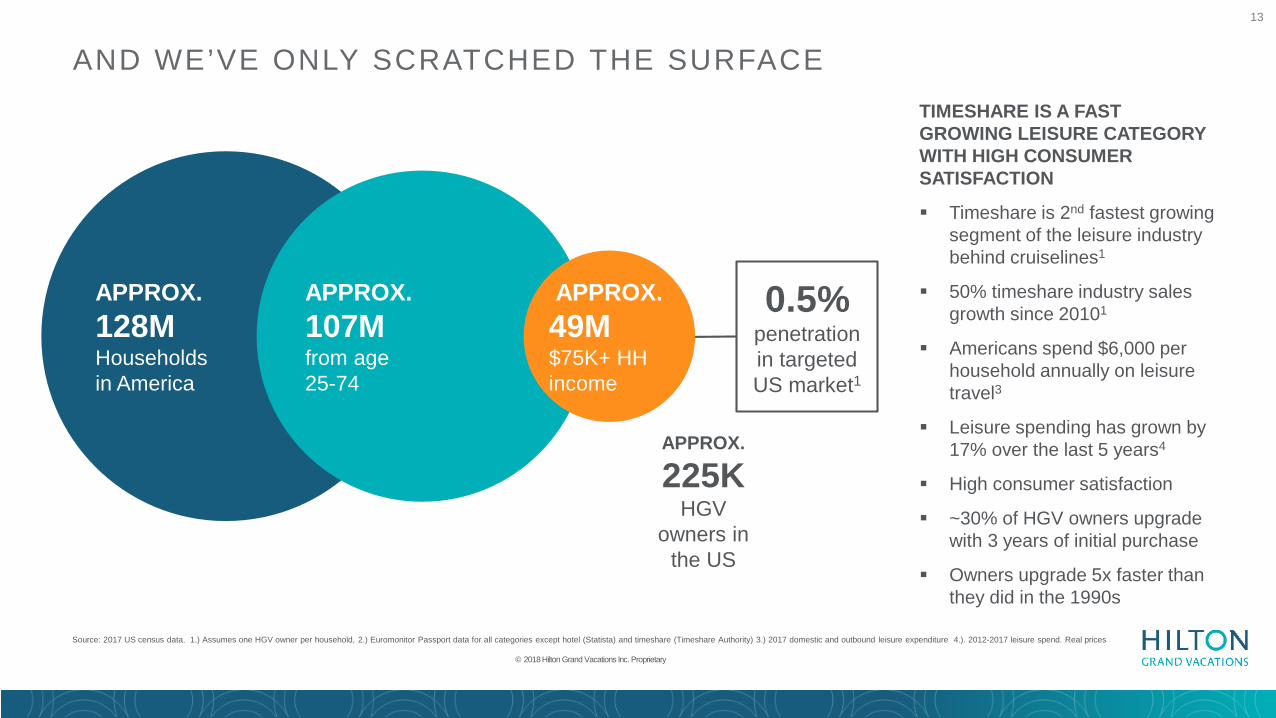
AND WE’VE ONLY SCRATCHED THE SURFACE
Source: 2017 US census data. 1.) Assumes one HGV owner per household, 2.) Euromonitor Passport data for all categories except hotel (Statista) and timeshare (Timeshare Authority) 3.) 2017 domestic and outbound leisure expenditure 4.). 2012-2017 leisure spend. Real prices
© 2018 Hilton Grand Vacations Inc. Proprietary
APPROX.128MHouseholdsin America
APPROX.107M from age 25-74
~49M $75K+
Householdincome
APPROX.
225K HGV
owners in the US
0.5%penetration in targeted US market1
APPROX.49M $75K+ HH income
TIMESHARE IS A FAST GROWING LEISURE CATEGORY WITH HIGH CONSUMER SATISFACTION
Timeshare is 2nd fastest growing segment of the leisure industry behind cruiselines1
50% timeshare industry sales growth since 20101
Americans spend $6,000 per household annually on leisure travel3
Leisure spending has grown by 17% over the last 5 years4
High consumer satisfaction
~30% of HGV owners upgrade with 3 years of initial purchase
Owners upgrade 5x faster than they did in the 1990s

14
O C E A N T O W E R B Y H I L T O N G R A N D V A C A T I O N S , W A I K O L O A , H A W A I I © 2018 Hilton Grand Vacations Inc. Proprietary
RESILIENCY AND STRENGTHTHROUGH MULTIPLE CYCLES
15
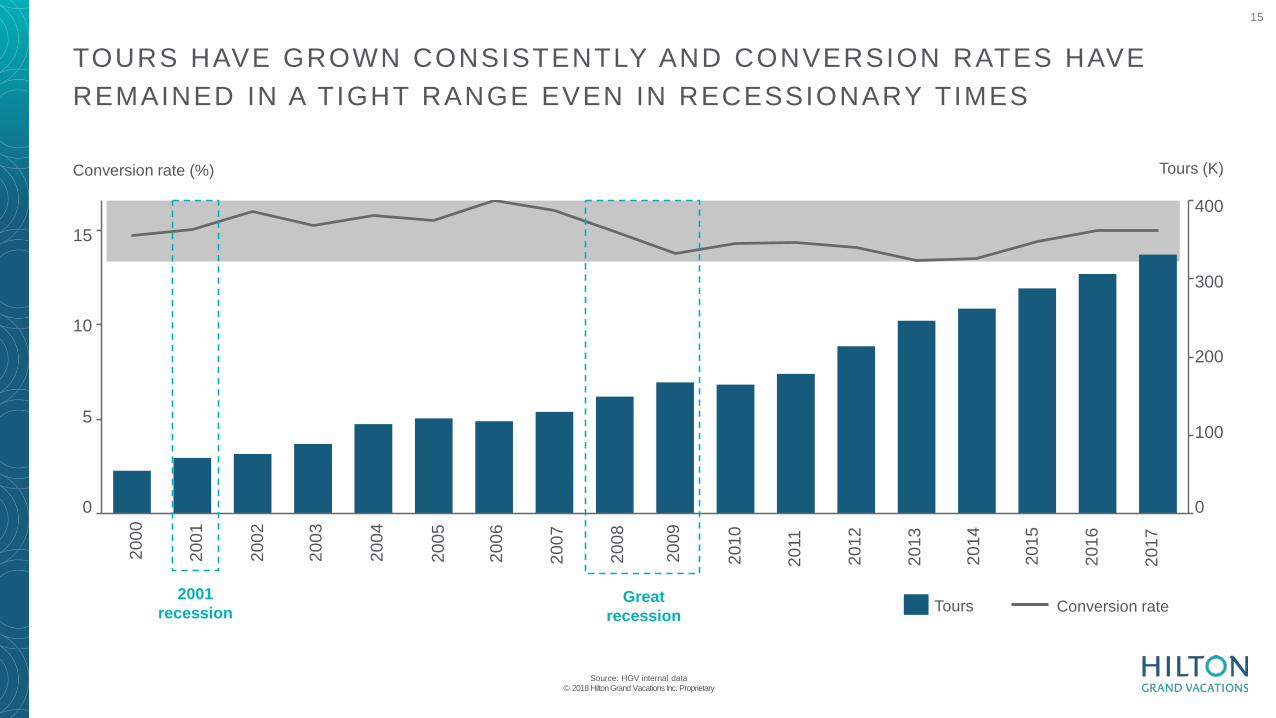
15
10
400
300
0
200
100
0
5
2016
2008
2010
2006
2017
2007
2011
2013
2009
2005
2012
2014
2015
2003
2004
2002
2000
2001
Tours (K)Conversion rate (%)
Conversion rateTours2001
recessionGreat
recession
TOURS HAVE GROWN CONSISTENTLY AND CONVERSION RATES HAVE REMAINED IN A TIGHT RANGE EVEN IN RECESSIONARY TIMES
Source: HGV internal data© 2018 Hilton Grand Vacations Inc. Proprietary
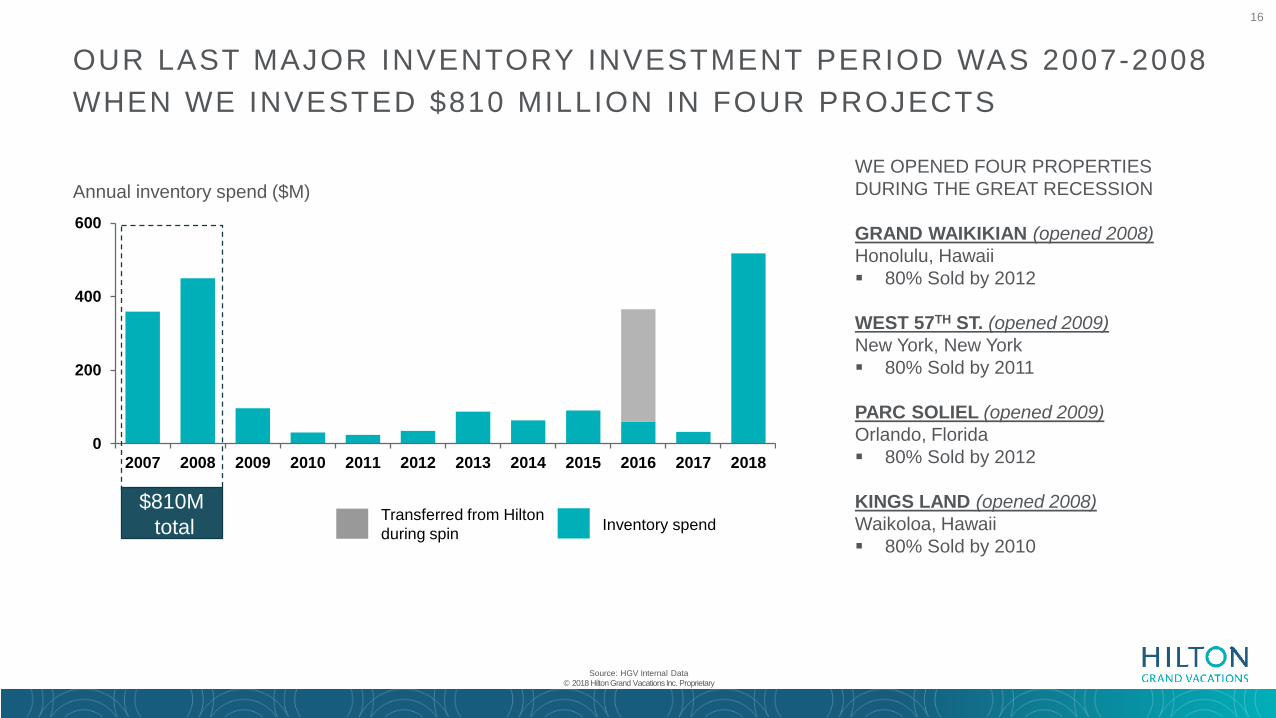
16
0
200
400
600
2007 2008 2009 2010 2011 2012 2013 2014 2015 2016 2017 2018
$810Mtotal
OUR LAST MAJOR INVENTORY INVESTMENT PERIOD WAS 2007-2008 WHEN WE INVESTED $810 MILLION IN FOUR PROJECTS
Annual inventory spend ($M)
Source: HGV Internal Data© 2018 Hilton Grand Vacations Inc. Proprietary
Inventory spendTransferred from Hiltonduring spin
WE OPENED FOUR PROPERTIES DURING THE GREAT RECESSION
GRAND WAIKIKIAN (opened 2008)Honolulu, Hawaii 80% Sold by 2012
WEST 57TH ST. (opened 2009)New York, New York 80% Sold by 2011
PARC SOLIEL (opened 2009)Orlando, Florida 80% Sold by 2012
KINGS LAND (opened 2008)Waikoloa, Hawaii 80% Sold by 2010
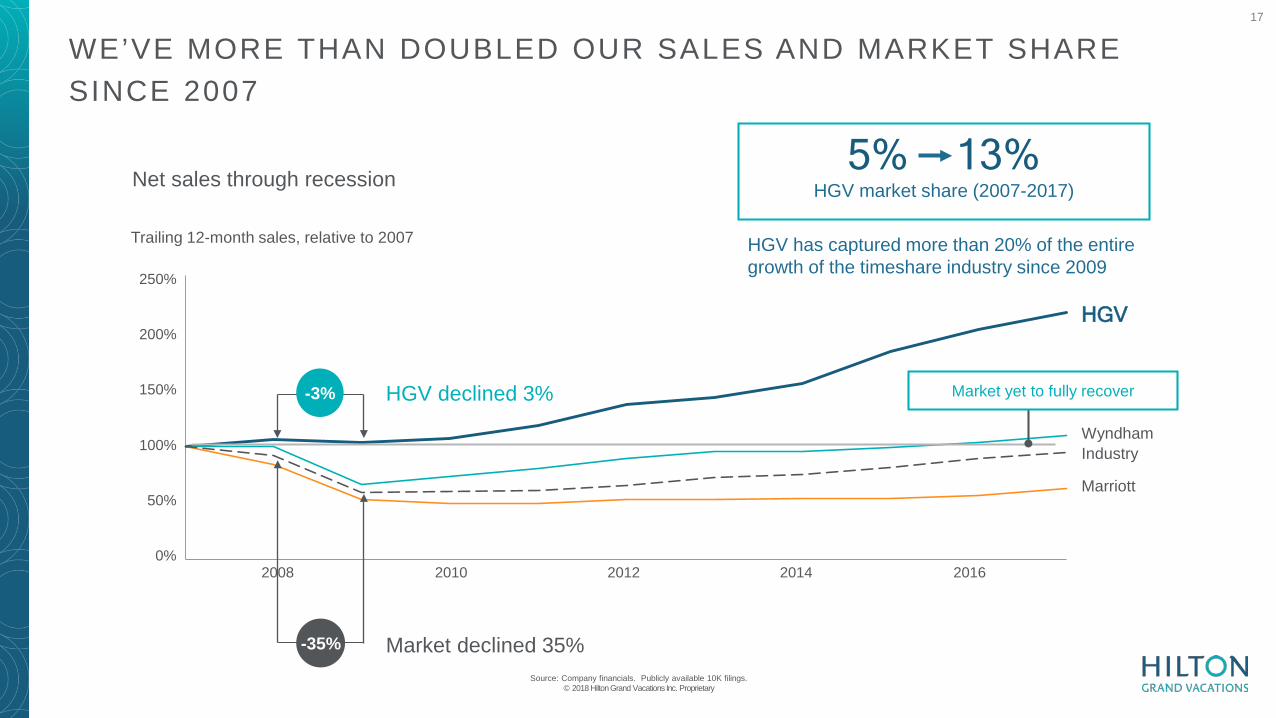
17
5% 13%HGV market share (2007-2017)
WE’VE MORE THAN DOUBLED OUR SALES AND MARKET SHARE SINCE 2007
150%
250%
2012 2014
50%
2008
200%
100%
20100%
2016
Wyndham
Marriott
-3%
-35%
Trailing 12-month sales, relative to 2007
HGV
Industry
Market yet to fully recover
Source: Company financials. Publicly available 10K filings. © 2018 Hilton Grand Vacations Inc. Proprietary
Net sales through recession
Market declined 35%
HGV declined 3%
HGV has captured more than 20% of the entire growth of the timeshare industry since 2009
18
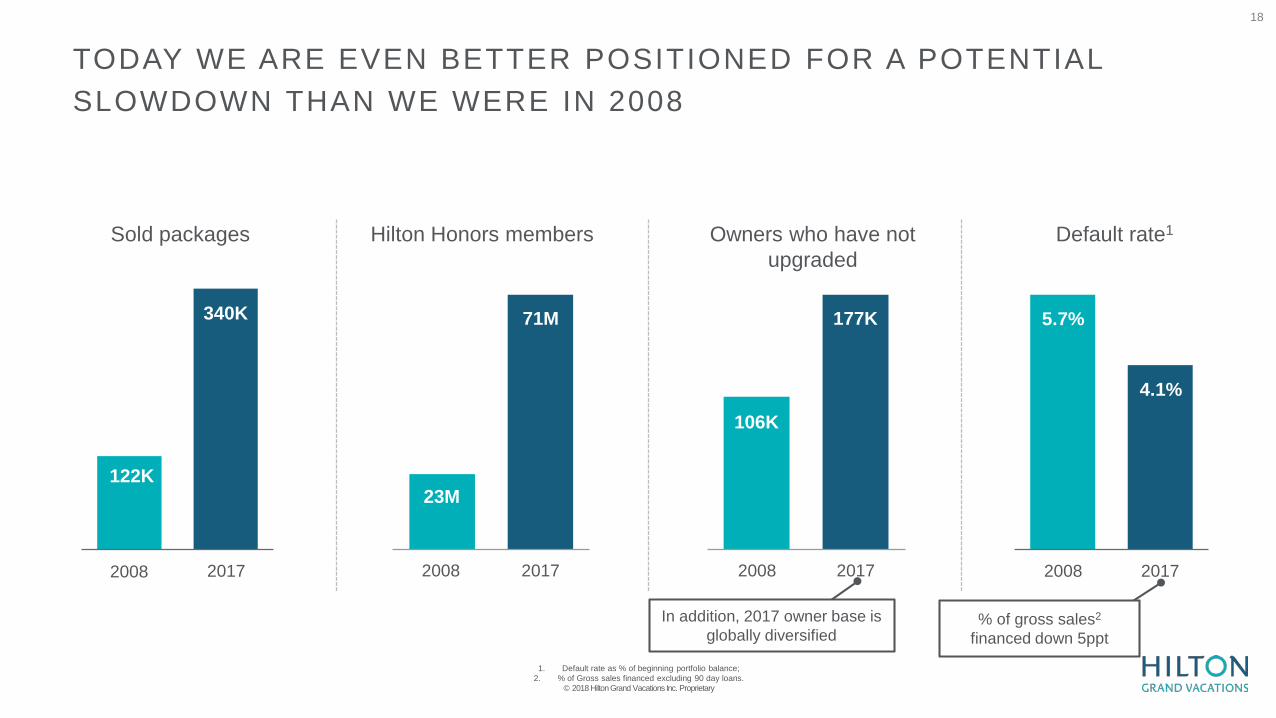
TODAY WE ARE EVEN BETTER POSITIONED FOR A POTENTIAL SLOWDOWN THAN WE WERE IN 2008
Sold packages Hilton Honors members Owners who have not upgraded
Default rate1
2008
71M
2017
23M
2017
106K
177K
2008 2008 2017
4.1%
In addition, 2017 owner base is globally diversified
% of gross sales2
financed down 5ppt
20172008
122K
340K 5.7%
4.1%
1. Default rate as % of beginning portfolio balance; 2. % of Gross sales financed excluding 90 day loans.
© 2018 Hilton Grand Vacations Inc. Proprietary
19
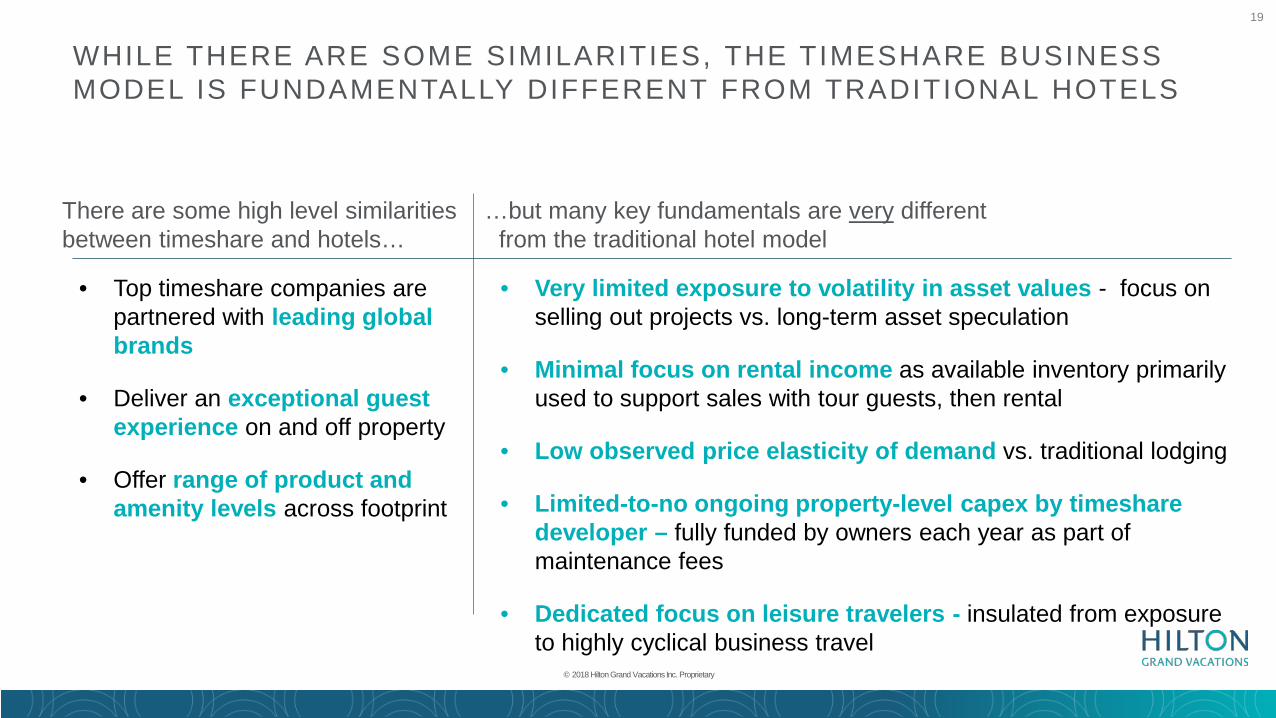
• Top timeshare companies are partnered with leading global brands
• Deliver an exceptional guest experience on and off property
• Offer range of product and amenity levels across footprint
• Very limited exposure to volatility in asset values - focus on selling out projects vs. long-term asset speculation
• Minimal focus on rental income as available inventory primarily used to support sales with tour guests, then rental
• Low observed price elasticity of demand vs. traditional lodging
• Limited-to-no ongoing property-level capex by timeshare developer – fully funded by owners each year as part of maintenance fees
• Dedicated focus on leisure travelers - insulated from exposure to highly cyclical business travel
There are some high level similarities between timeshare and hotels…
…but many key fundamentals are very different from the traditional hotel model
WHILE THERE ARE SOME SIMILARITIES, THE TIMESHARE BUSINESS MODEL IS FUNDAMENTALLY DIFFERENT FROM TRADITIONAL HOTELS
© 2018 Hilton Grand Vacations Inc. Proprietary
20
CAPITAL EFFICIENT INVENTORY
STRATEGY
© 2018 Hilton Grand Vacations Inc. Proprietary
21
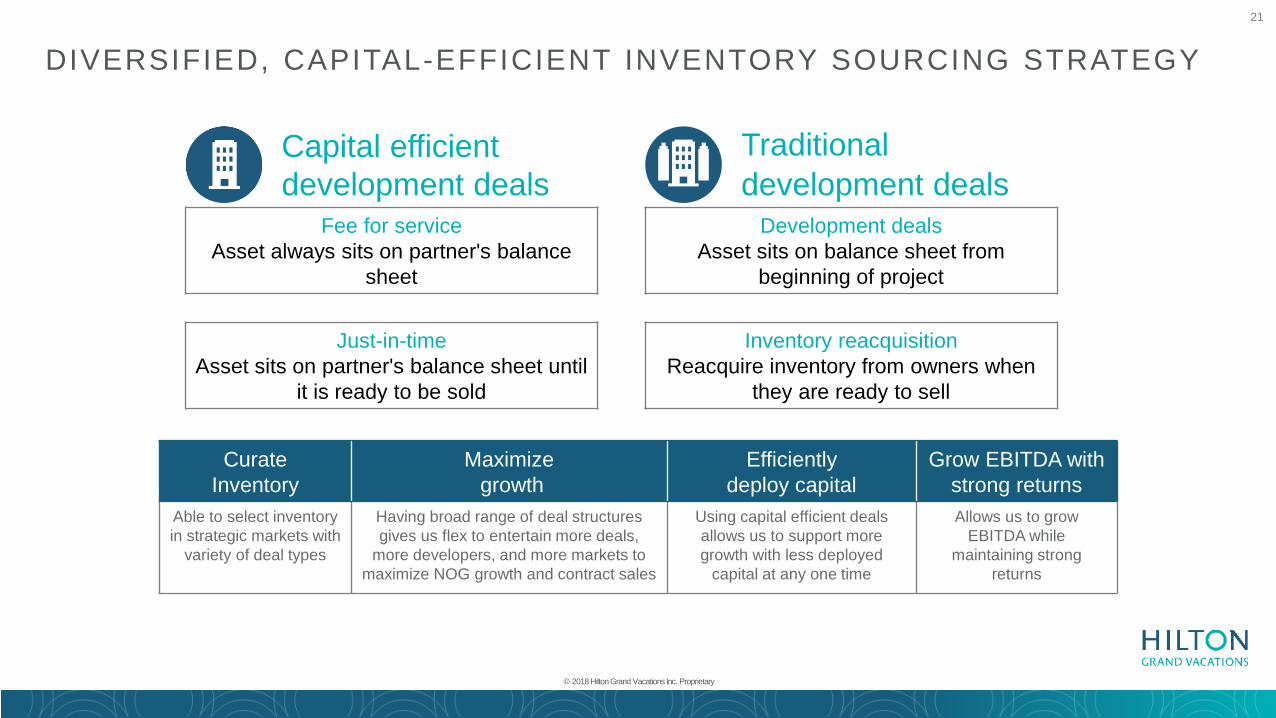
Capital efficient development deals
Traditional development deals
Fee for serviceAsset always sits on partner's balance
sheet
Development dealsAsset sits on balance sheet from
beginning of project
Just-in-timeAsset sits on partner's balance sheet until
it is ready to be sold
Inventory reacquisitionReacquire inventory from owners when
they are ready to sell
DIVERSIFIED, CAPITAL-EFFICIENT INVENTORY SOURCING STRATEGY
© 2018 Hilton Grand Vacations Inc. Proprietary
Curate Inventory
Maximizegrowth
Efficiently deploy capital
Grow EBITDA with strong returns
Able to select inventory in strategic markets with
variety of deal types
Having broad range of deal structures gives us flex to entertain more deals,
more developers, and more markets to maximize NOG growth and contract sales
Using capital efficient deals allows us to support more growth with less deployed
capital at any one time
Allows us to grow EBITDA while
maintaining strong returns
22
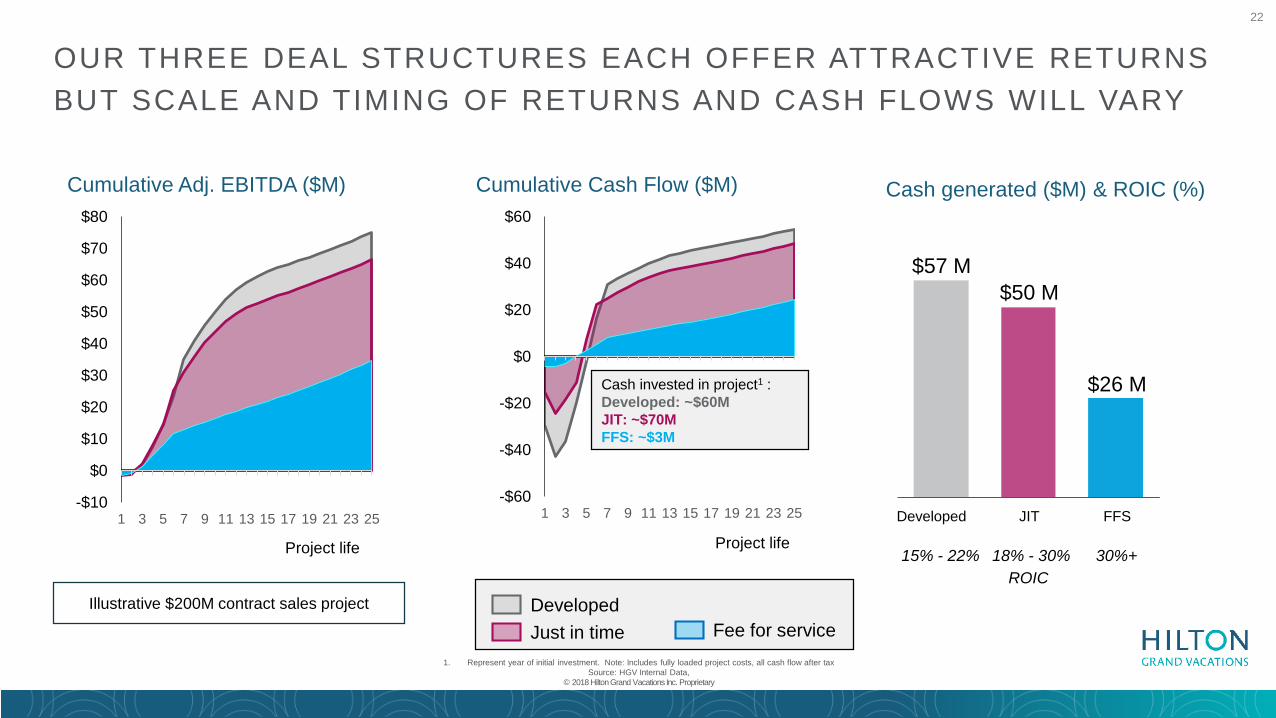
OUR THREE DEAL STRUCTURES EACH OFFER ATTRACTIVE RETURNS BUT SCALE AND TIMING OF RETURNS AND CASH FLOWS WILL VARY
Cumulative Adj. EBITDA ($M) Cumulative Cash Flow ($M)
Fee for serviceJust in timeDeveloped
Project life
-$10
$0
$10
$20
$30
$40
$50
$60
$70
$80
1 3 5 7 9 11 13 15 17 19 21 23 25-$60
-$40
-$20
$0
$20
$40
$60
1 3 5 7 9 11 13 15 17 19 21 23 25
Cash generated ($M) & ROIC (%)
$57 M
Developed
$50 M
$26 M
JIT FFS
15% - 22%ROIC
18% - 30% 30%+
Illustrative $200M contract sales project
Project life
Cash invested in project1 :Developed: ~$60MJIT: ~$70MFFS: ~$3M
1. Represent year of initial investment. Note: Includes fully loaded project costs, all cash flow after taxSource: HGV Internal Data,
© 2018 Hilton Grand Vacations Inc. Proprietary
23
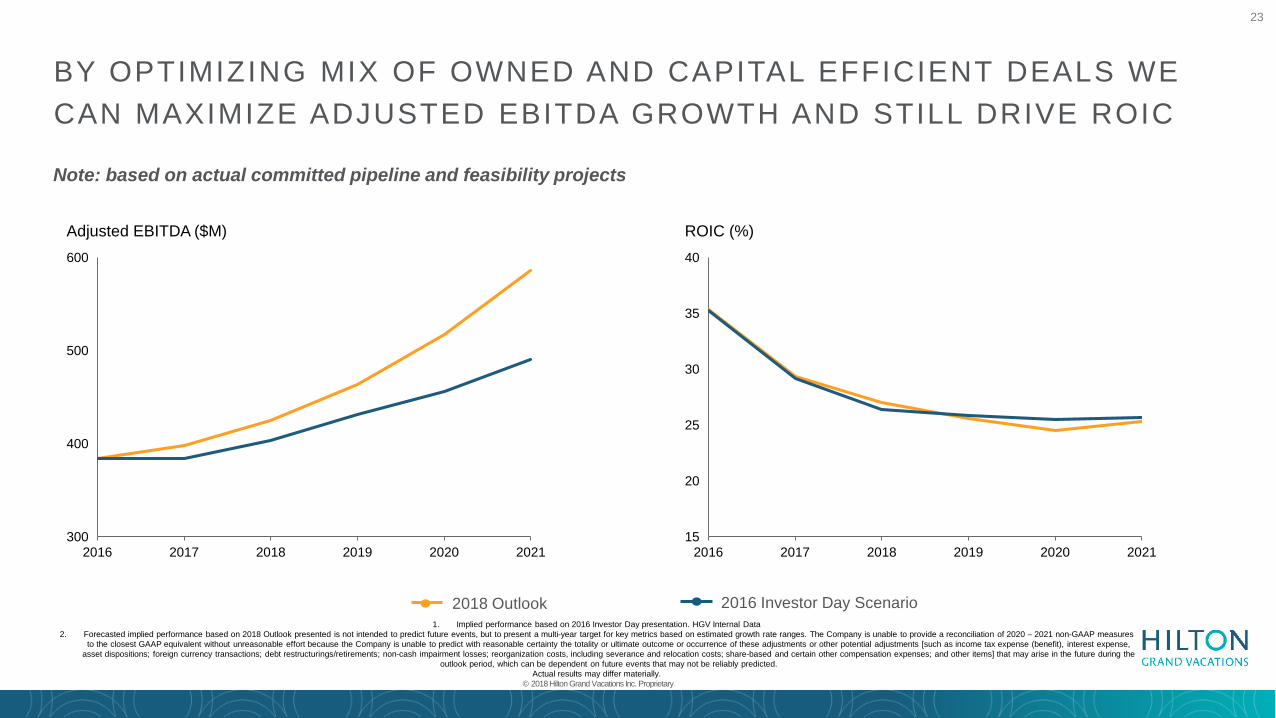
Note: based on actual committed pipeline and feasibility projects
BY OPTIMIZING MIX OF OWNED AND CAPITAL EFFICIENT DEALS WE CAN MAXIMIZE ADJUSTED EBITDA GROWTH AND STILL DRIVE ROIC
2016 2017 2018 2019 2020 2021
400
500
300
600
Adjusted EBITDA ($M)
2018 Outlook 2016 Investor Day Scenario
2016 2017 2018 2019 2020 2021
40
15
20
35
25
30
ROIC (%)
1. Implied performance based on 2016 Investor Day presentation. HGV Internal Data 2. Forecasted implied performance based on 2018 Outlook presented is not intended to predict future events, but to present a multi-year target for key metrics based on estimated growth rate ranges. The Company is unable to provide a reconciliation of 2020 – 2021 non-GAAP measures
to the closest GAAP equivalent without unreasonable effort because the Company is unable to predict with reasonable certainty the totality or ultimate outcome or occurrence of these adjustments or other potential adjustments [such as income tax expense (benefit), interest expense, asset dispositions; foreign currency transactions; debt restructurings/retirements; non-cash impairment losses; reorganization costs, including severance and relocation costs; share-based and certain other compensation expenses; and other items] that may arise in the future during the
outlook period, which can be dependent on future events that may not be reliably predicted. Actual results may differ materially.
© 2018 Hilton Grand Vacations Inc. Proprietary
24
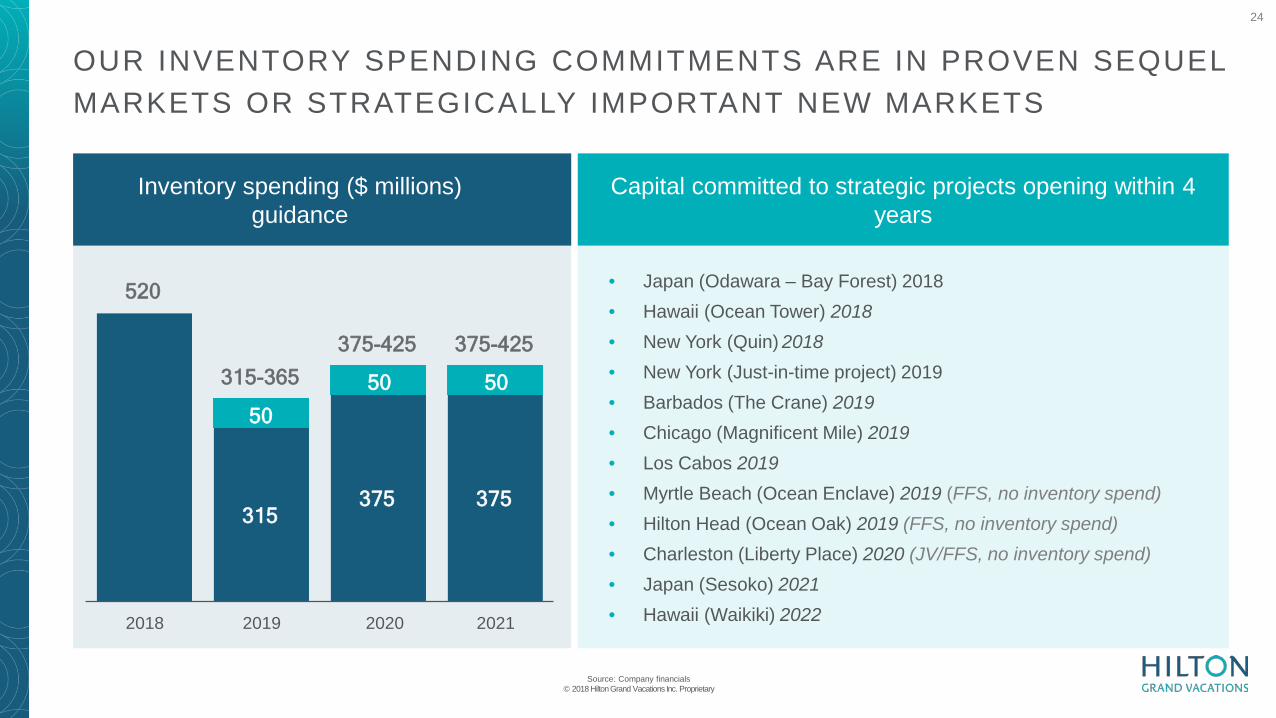
OUR INVENTORY SPENDING COMMITMENTS ARE IN PROVEN SEQUEL MARKETS OR STRATEGICALLY IMPORTANT NEW MARKETS
• Japan (Odawara – Bay Forest) 2018• Hawaii (Ocean Tower) 2018• New York (Quin) 2018• New York (Just-in-time project) 2019• Barbados (The Crane) 2019• Chicago (Magnificent Mile) 2019• Los Cabos 2019• Myrtle Beach (Ocean Enclave) 2019 (FFS, no inventory spend)• Hilton Head (Ocean Oak) 2019 (FFS, no inventory spend)• Charleston (Liberty Place) 2020 (JV/FFS, no inventory spend) • Japan (Sesoko) 2021• Hawaii (Waikiki) 202220212020
375
375-425
50
520
50
2019
315
375-425
375
50
2018
315-365
Capital committed to strategic projects opening within 4 years
Source: Company financials© 2018 Hilton Grand Vacations Inc. Proprietary
Inventory spending ($ millions)guidance
25
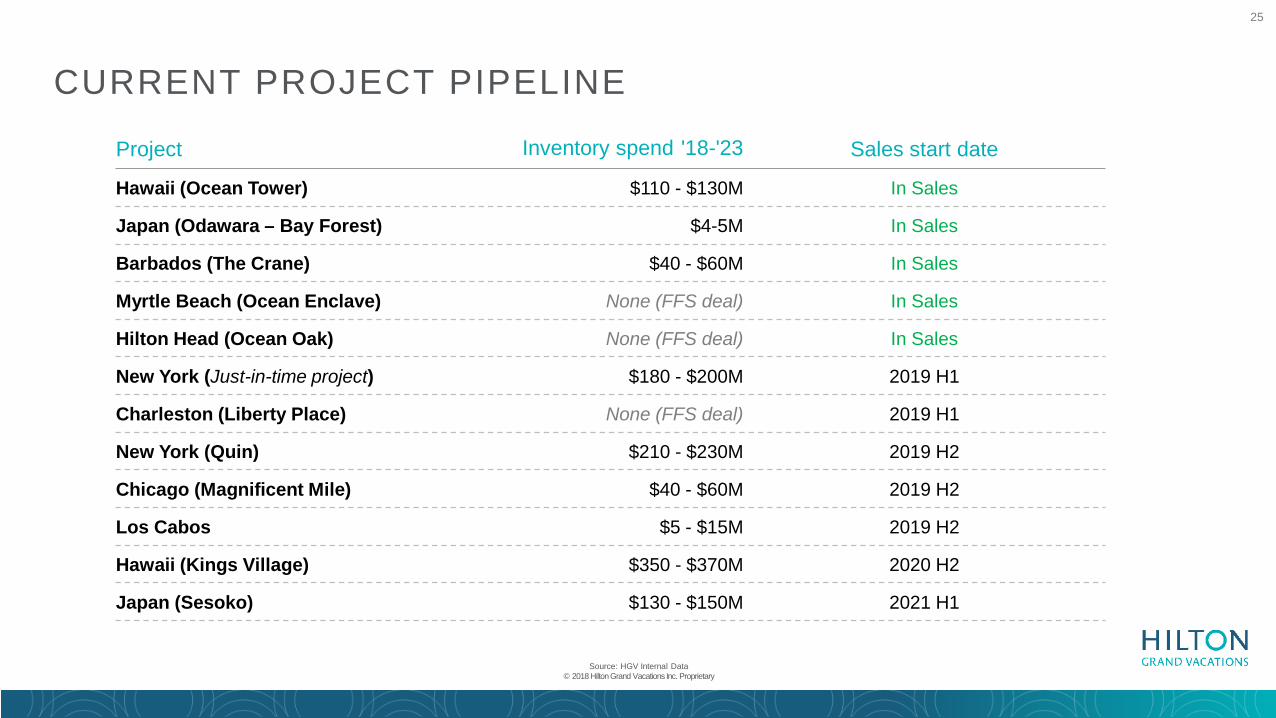
CURRENT PROJECT PIPELINE
Project Inventory spend '18-'23 Sales start date
Hawaii (Ocean Tower) $110 - $130M In Sales
Japan (Odawara – Bay Forest) $4-5M In Sales
Barbados (The Crane) $40 - $60M In Sales
Myrtle Beach (Ocean Enclave) None (FFS deal) In Sales
Hilton Head (Ocean Oak) None (FFS deal) In Sales
New York (Just-in-time project) $180 - $200M 2019 H1
Charleston (Liberty Place) None (FFS deal) 2019 H1
New York (Quin) $210 - $230M 2019 H2
Chicago (Magnificent Mile) $40 - $60M 2019 H2
Los Cabos $5 - $15M 2019 H2
Hawaii (Kings Village) $350 - $370M 2020 H2
Japan (Sesoko) $130 - $150M 2021 H1
Source: HGV Internal Data© 2018 Hilton Grand Vacations Inc. Proprietary
26
DYNAMIC CAPITAL ALLOCATION STRATEGY SUPPORTED BY STRONG FINANCIAL PERFORMANCE
H I L T O N H A W A I I A N V I L L A G E , O A H U , H A W A I I © 2018 Hilton Grand Vacations Inc. Proprietary
27
1. Excludes non-recourse debt© 2018 Hilton Grand Vacations Inc. Proprietary
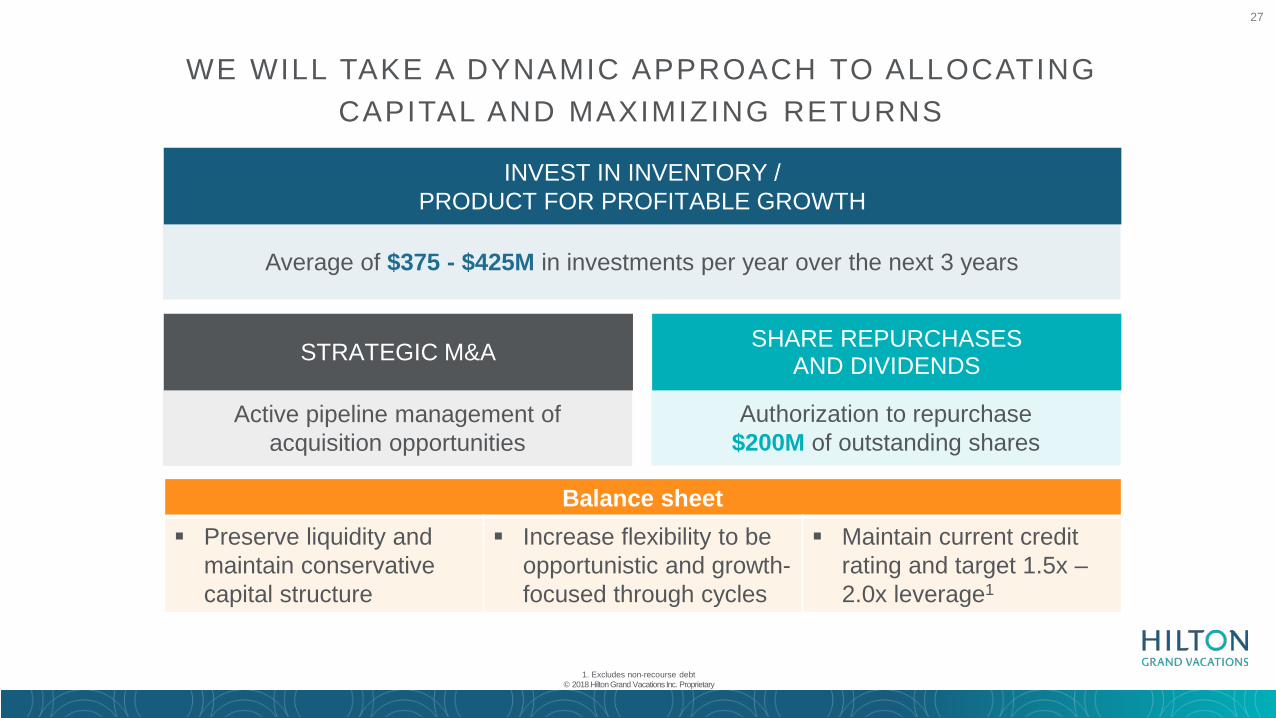
WE WILL TAKE A DYNAMIC APPROACH TO ALLOCATING CAPITAL AND MAXIMIZING RETURNS
INVEST IN INVENTORY / PRODUCT FOR PROFITABLE GROWTH
SHARE REPURCHASES AND DIVIDENDSSTRATEGIC M&A
Average of $375 - $425M in investments per year over the next 3 years
Active pipeline management of acquisition opportunities
Authorization to repurchase $200M of outstanding shares
Balance sheet Preserve liquidity and
maintain conservative capital structure
Increase flexibility to be opportunistic and growth-focused through cycles
Maintain current credit rating and target 1.5x –2.0x leverage1
28
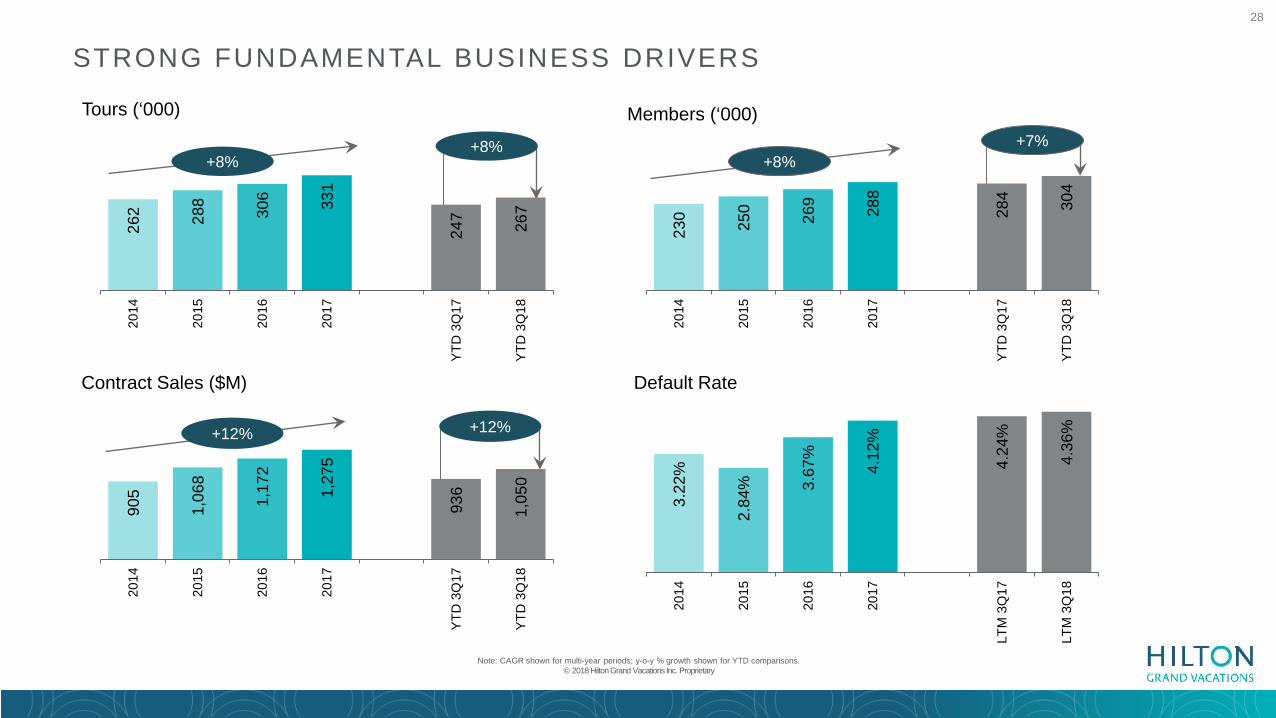
230 250 269 288
284 304
2014
2015
2016
2017
YTD
3Q
17
YTD
3Q
18
Members (‘000)90
5
1,06
8
1,17
2
1,27
5
936
1,05
0
2014
2015
2016
2017
YTD
3Q
17
YTD
3Q
18
Contract Sales ($M)
3.22
%
2.84
% 3.67
%
4.12
%
4.24
%
4.36
%
2014
2015
2016
2017
LTM
3Q
17
LTM
3Q
18
Default Rate
Note: CAGR shown for multi-year periods; y-o-y % growth shown for YTD comparisons. © 2018 Hilton Grand Vacations Inc. Proprietary
1. Domestic defaults as % of beginning balance; 2. % of Gross sales financed excluding 90 day loans, Source: HGV Internal data
STRONG FUNDAMENTAL BUSINESS DRIVERS
+8%+7%
+12% +12%
262 28
8
306 331
247 267
2014
2015
2016
2017
YTD
3Q
17
YTD
3Q
18
Tours (‘000)
+8%+8%
29
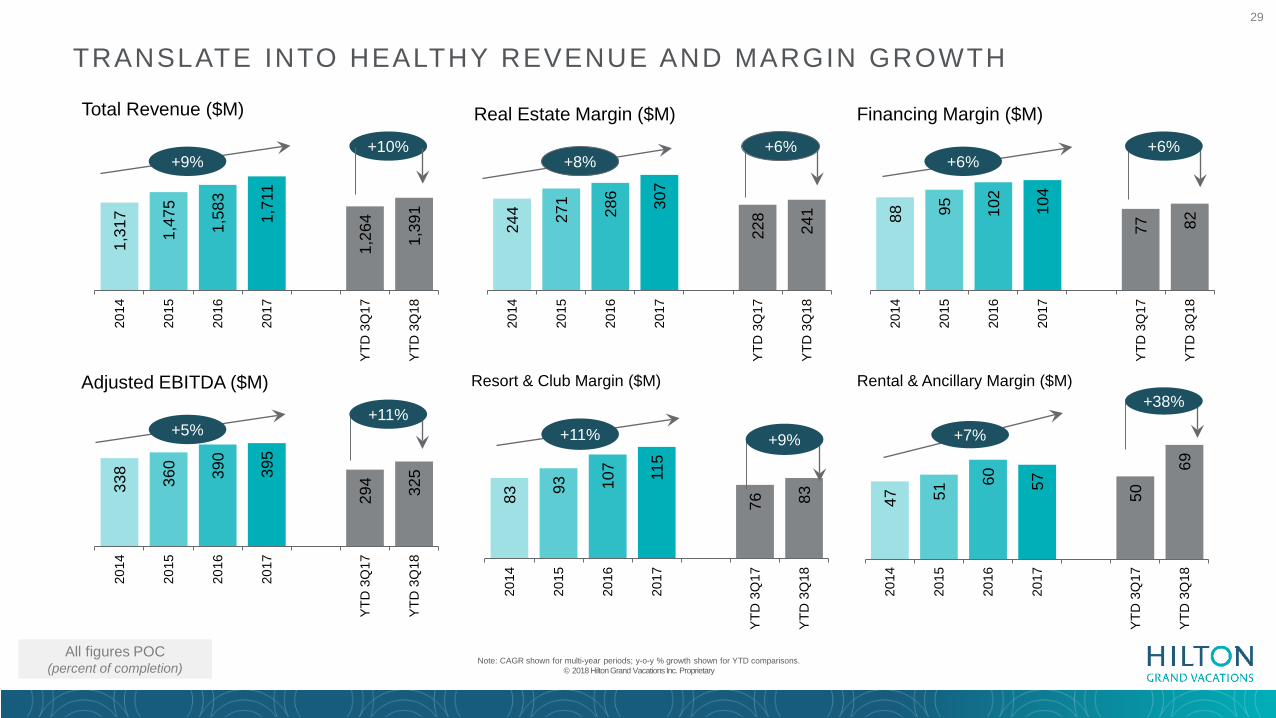
83 93 107 115
76 83
2014
2015
2016
2017
YTD
3Q
17
YTD
3Q
18
Resort & Club Margin ($M)
Note: CAGR shown for multi-year periods; y-o-y % growth shown for YTD comparisons. © 2018 Hilton Grand Vacations Inc. Proprietary
1. Domestic defaults as % of beginning balance; 2. % of Gross sales financed excluding 90 day loans, Source: HGV Internal data
TRANSLATE INTO HEALTHY REVENUE AND MARGIN GROWTH
All figures POC (percent of completion)
244 27
1
286 307
228
241
2014
2015
2016
2017
YTD
3Q
17
YTD
3Q
18
Real Estate Margin ($M)
+8%+6%
88 95 102
104
77 82
2014
2015
2016
2017
YTD
3Q
17
YTD
3Q
18
Financing Margin ($M)
+6%+6%
+11% +9%
47 51
60 57
50
69
2014
2015
2016
2017
YTD
3Q
17
YTD
3Q
18
Rental & Ancillary Margin ($M)
+7%
+38%
338
360 390
395
294 325
2014
2015
2016
2017
YTD
3Q
17
YTD
3Q
18
Adjusted EBITDA ($M)
+5%+11%
1,31
7
1,47
5
1,58
3
1,71
1
1,26
4
1,39
1
2014
2015
2016
2017
YTD
3Q
17
YTD
3Q
18
Total Revenue ($M)
+9%+10%
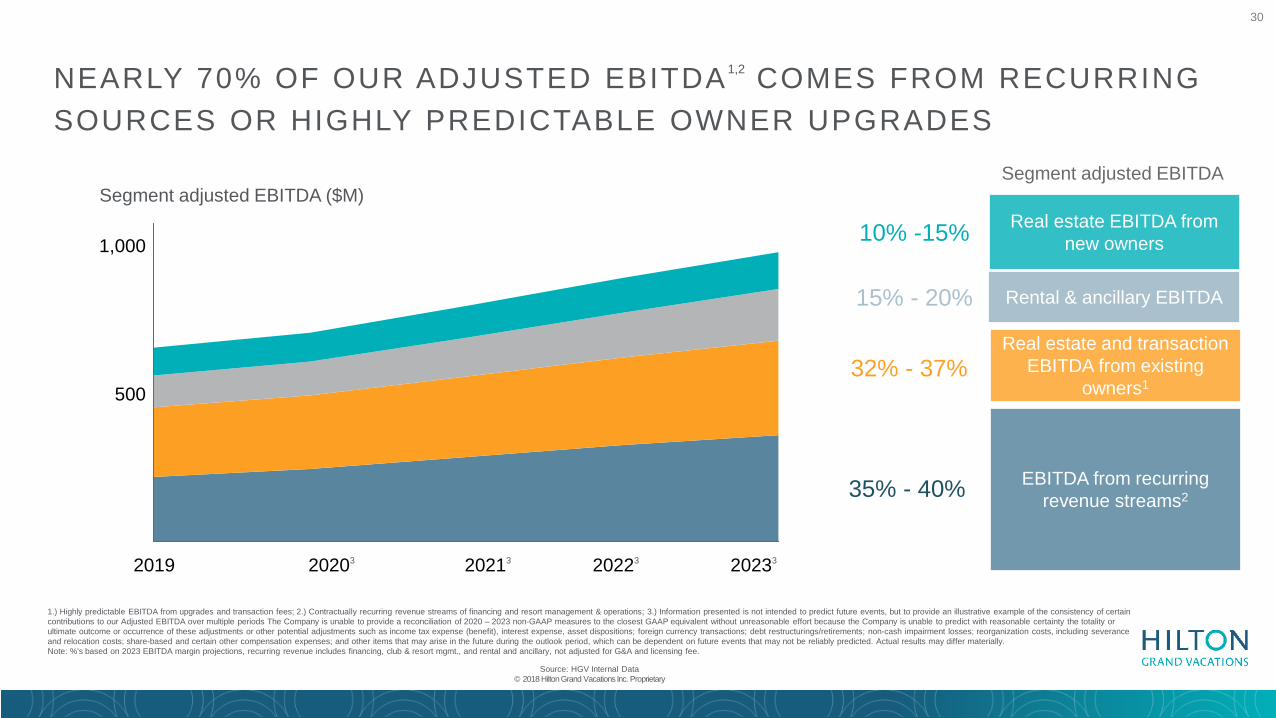
30
Real estate EBITDA from new owners
Real estate and transaction EBITDA from existing
owners1
EBITDA from recurring revenue streams2
10% -15%
32% - 37%
35% - 40%
500
1,000
20233
Segment adjusted EBITDA ($M)
20213202032019 20223
NEARLY 70% OF OUR ADJUSTED EBITDA1,2 COMES FROM RECURRING SOURCES OR HIGHLY PREDICTABLE OWNER UPGRADES
Rental & ancillary EBITDA15% - 20%
1.) Highly predictable EBITDA from upgrades and transaction fees; 2.) Contractually recurring revenue streams of financing and resort management & operations; 3.) Information presented is not intended to predict future events, but to provide an illustrative example of the consistency of certain contributions to our Adjusted EBITDA over multiple periods The Company is unable to provide a reconciliation of 2020 – 2023 non-GAAP measures to the closest GAAP equivalent without unreasonable effort because the Company is unable to predict with reasonable certainty the totality or ultimate outcome or occurrence of these adjustments or other potential adjustments such as income tax expense (benefit), interest expense, asset dispositions; foreign currency transactions; debt restructurings/retirements; non-cash impairment losses; reorganization costs, including severance and relocation costs; share-based and certain other compensation expenses; and other items that may arise in the future during the outlook period, which can be dependent on future events that may not be reliably predicted. Actual results may differ materially.Note: %'s based on 2023 EBITDA margin projections, recurring revenue includes financing, club & resort mgmt., and rental and ancillary, not adjusted for G&A and licensing fee.
Source: HGV Internal Data © 2018 Hilton Grand Vacations Inc. Proprietary
Segment adjusted EBITDA
31
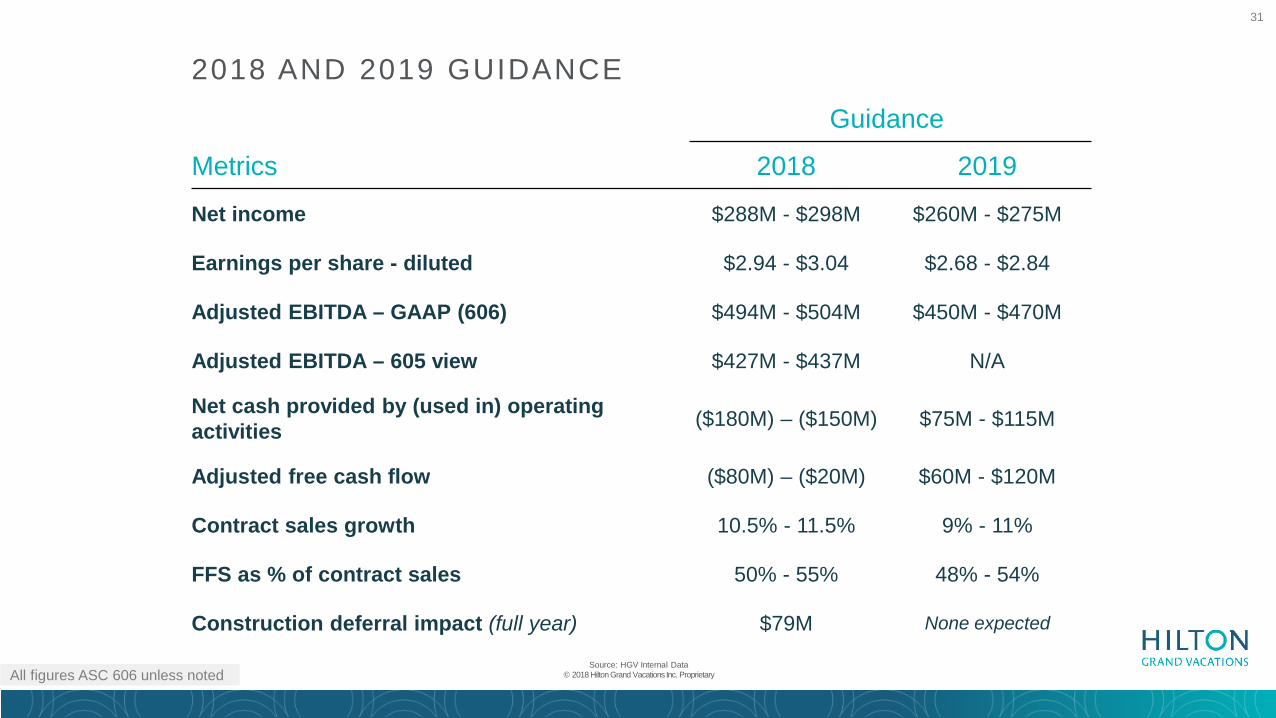
2018 AND 2019 GUIDANCE
Metrics
Guidance
2018 2019
Net income $288M - $298M $260M - $275M
Earnings per share - diluted $2.94 - $3.04 $2.68 - $2.84
Adjusted EBITDA – GAAP (606) $494M - $504M $450M - $470M
Adjusted EBITDA – 605 view $427M - $437M N/A
Net cash provided by (used in) operating activities ($180M) – ($150M) $75M - $115M
Adjusted free cash flow ($80M) – ($20M) $60M - $120M
Contract sales growth 10.5% - 11.5% 9% - 11%
FFS as % of contract sales 50% - 55% 48% - 54%
Construction deferral impact (full year) $79M None expected
1. Domestic defaults as % of beginning balance; 2. % of Gross sales financed excluding 90 day loans, Source: HGV Internal dataAll figures ASC 606 unless noted
Source: HGV Internal Data© 2018 Hilton Grand Vacations Inc. Proprietary
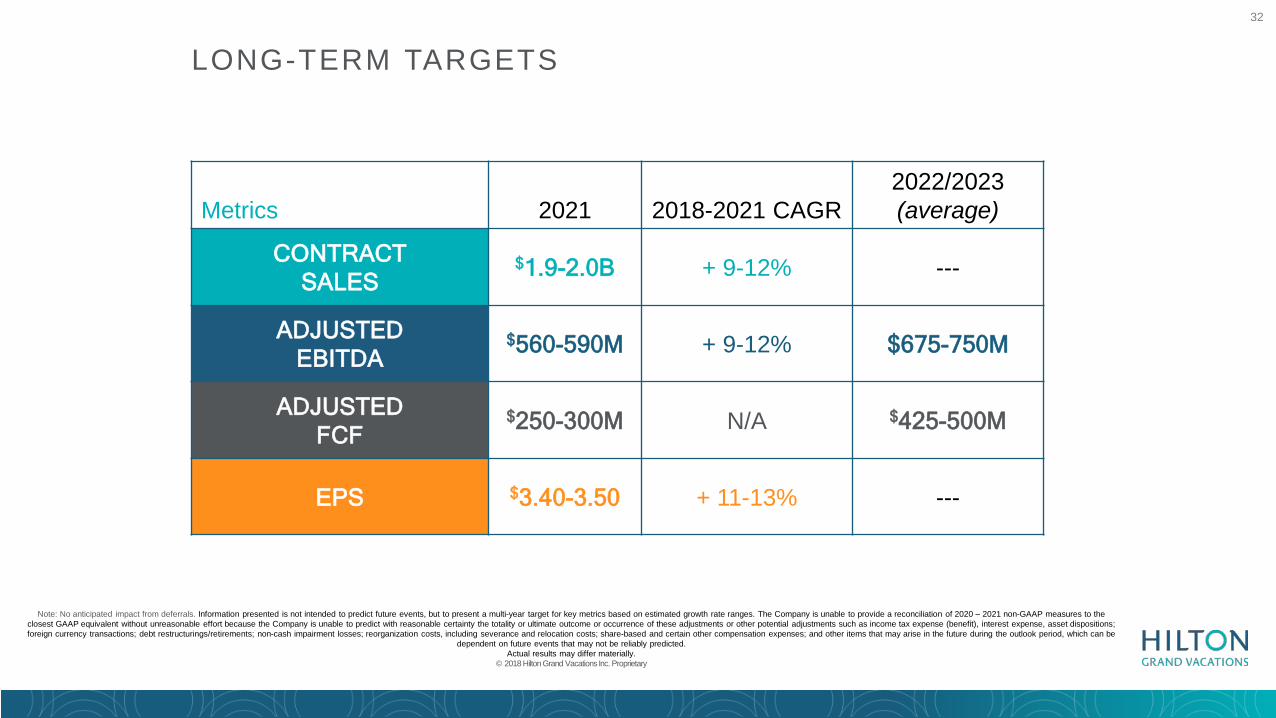
32
Metrics 2021 2018-2021 CAGR2022/2023(average)
CONTRACTSALES
$1.9-2.0B + 9-12% ---
ADJUSTED EBITDA
$560-590M + 9-12% $675-750M
ADJUSTEDFCF
$250-300M N/A $425-500M
EPS $3.40-3.50 + 11-13% ---
LONG-TERM TARGETS
Note: No anticipated impact from deferrals. Information presented is not intended to predict future events, but to present a multi-year target for key metrics based on estimated growth rate ranges. The Company is unable to provide a reconciliation of 2020 – 2021 non-GAAP measures to the closest GAAP equivalent without unreasonable effort because the Company is unable to predict with reasonable certainty the totality or ultimate outcome or occurrence of these adjustments or other potential adjustments such as income tax expense (benefit), interest expense, asset dispositions; foreign currency transactions; debt restructurings/retirements; non-cash impairment losses; reorganization costs, including severance and relocation costs; share-based and certain other compensation expenses; and other items that may arise in the future during the outlook period, which can be
dependent on future events that may not be reliably predicted. Actual results may differ materially.
© 2018 Hilton Grand Vacations Inc. Proprietary

33
H I L T O N H A W A I I A N V I L L A G E , O A H U , H A W A I I © 2018 Hilton Grand Vacations Inc. Proprietary
APPENDIX
34
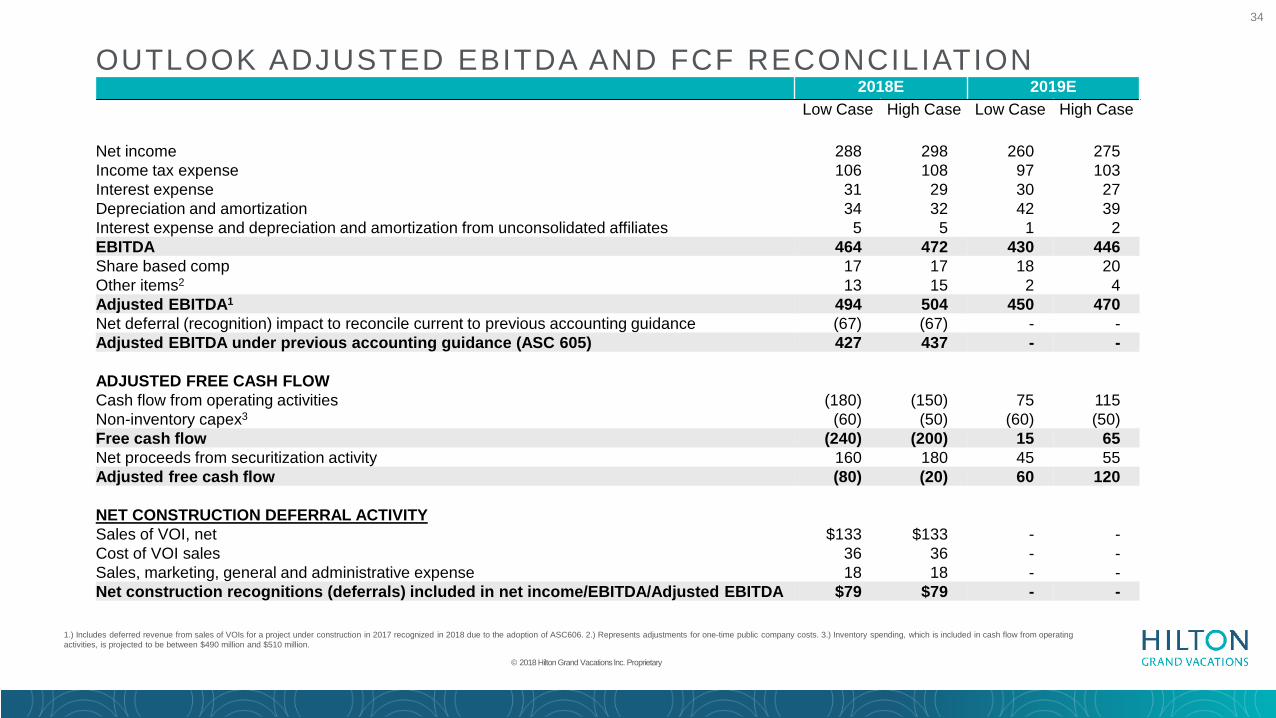
OUTLOOK ADJUSTED EBITDA AND FCF RECONCILIATION
1. Domestic defaults as % of beginning balance; 2. % of Gross sales financed excluding 90 day loans, Source: HGV Internal data
1.) Includes deferred revenue from sales of VOIs for a project under construction in 2017 recognized in 2018 due to the adoption of ASC606. 2.) Represents adjustments for one-time public company costs. 3.) Inventory spending, which is included in cash flow from operating activities, is projected to be between $490 million and $510 million.
© 2018 Hilton Grand Vacations Inc. Proprietary
2018E 2019ELow Case High Case Low Case High Case
Net income 288 298 260 275Income tax expense 106 108 97 103Interest expense 31 29 30 27Depreciation and amortization 34 32 42 39Interest expense and depreciation and amortization from unconsolidated affiliates 5 5 1 2EBITDA 464 472 430 446Share based comp 17 17 18 20Other items2 13 15 2 4Adjusted EBITDA1 494 504 450 470Net deferral (recognition) impact to reconcile current to previous accounting guidance (67) (67) - -Adjusted EBITDA under previous accounting guidance (ASC 605) 427 437 - -
ADJUSTED FREE CASH FLOWCash flow from operating activities (180) (150) 75 115Non-inventory capex3 (60) (50) (60) (50)Free cash flow (240) (200) 15 65Net proceeds from securitization activity 160 180 45 55Adjusted free cash flow (80) (20) 60 120
NET CONSTRUCTION DEFERRAL ACTIVITYSales of VOI, net $133 $133 - -Cost of VOI sales 36 36 - -Sales, marketing, general and administrative expense 18 18 - -Net construction recognitions (deferrals) included in net income/EBITDA/Adjusted EBITDA $79 $79 - -
35
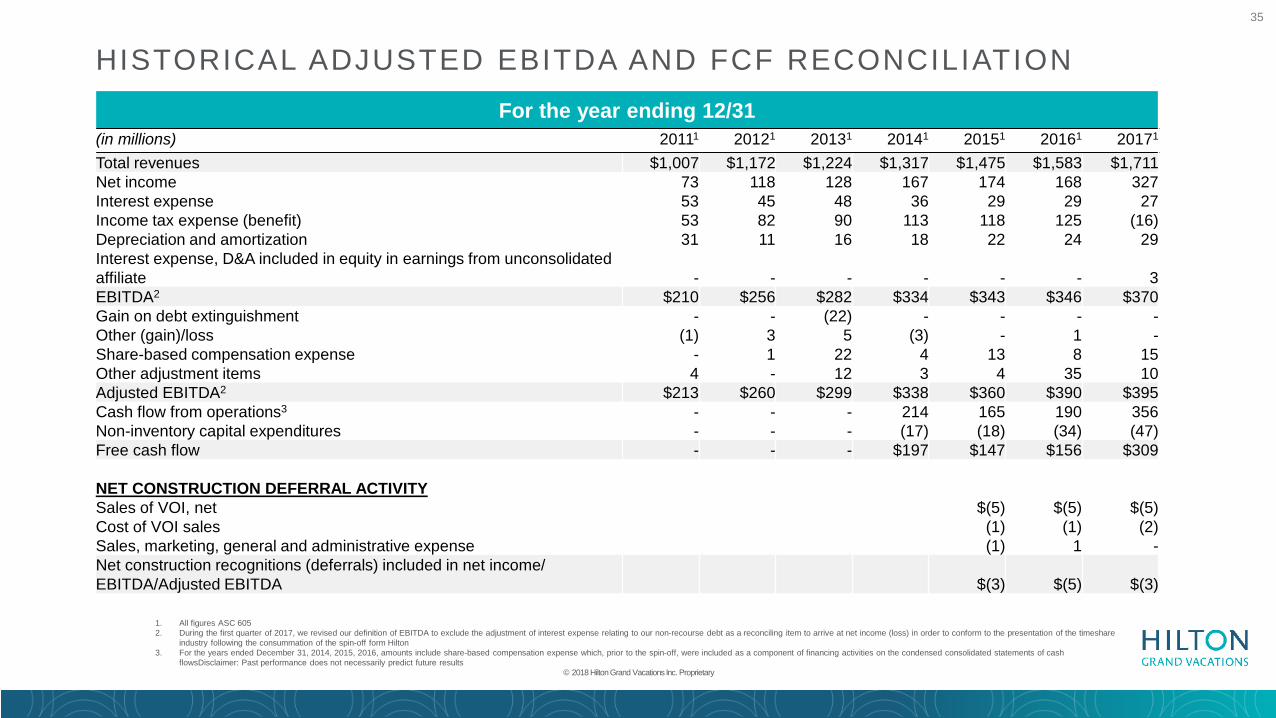
HISTORICAL ADJUSTED EBITDA AND FCF RECONCILIATION
1. Domestic defaults as % of beginning balance; 2. % of Gross sales financed excluding 90 day loans, Source: HGV Internal data
1. All figures ASC 6052. During the first quarter of 2017, we revised our definition of EBITDA to exclude the adjustment of interest expense relating to our non-recourse debt as a reconciling item to arrive at net income (loss) in order to conform to the presentation of the timeshare
industry following the consummation of the spin-off form Hilton3. For the years ended December 31, 2014, 2015, 2016, amounts include share-based compensation expense which, prior to the spin-off, were included as a component of financing activities on the condensed consolidated statements of cash
flowsDisclaimer: Past performance does not necessarily predict future results© 2018 Hilton Grand Vacations Inc. Proprietary
For the year ending 12/31(in millions) 20111 20121 20131 20141 20151 20161 20171
Total revenues $1,007 $1,172 $1,224 $1,317 $1,475 $1,583 $1,711Net income 73 118 128 167 174 168 327Interest expense 53 45 48 36 29 29 27Income tax expense (benefit) 53 82 90 113 118 125 (16)Depreciation and amortization 31 11 16 18 22 24 29Interest expense, D&A included in equity in earnings from unconsolidated affiliate - - - - - - 3EBITDA2 $210 $256 $282 $334 $343 $346 $370Gain on debt extinguishment - - (22) - - - -Other (gain)/loss (1) 3 5 (3) - 1 -Share-based compensation expense - 1 22 4 13 8 15Other adjustment items 4 - 12 3 4 35 10Adjusted EBITDA2 $213 $260 $299 $338 $360 $390 $395Cash flow from operations3 - - - 214 165 190 356Non-inventory capital expenditures - - - (17) (18) (34) (47)Free cash flow - - - $197 $147 $156 $309
NET CONSTRUCTION DEFERRAL ACTIVITYSales of VOI, net $(5) $(5) $(5)Cost of VOI sales (1) (1) (2)Sales, marketing, general and administrative expense (1) 1 -Net construction recognitions (deferrals) included in net income/ EBITDA/Adjusted EBITDA $(3) $(5) $(3)