Embed Size (px)
Citation preview
INVESTOR PRESENTATION //// MAY 2018

2
DISCLAIMER
FORWARD LOOKING STATEMENTS
This presentation includes “forward looking statements” within the meaning of the “safe harbor” provisions of the United States Private Securities Litigation Reform Act of 1995. Forward-looking statements may be
identified by the use of words such as “anticipate,” “believe,” “expect,” “estimate,” “plan,” “outlook,” and “project” and other similar expressions that predict or indicate future events or trends or that are not
statements of historical matters. Such forward looking statements with respect to revenues, earnings, financial information, performance, strategies, prospects and other aspects of the businesses of Jason
Industries, Inc. (the “Company”) are based on current expectations that are subject to risks and uncertainties. A number of factors could cause actual results or outcomes to differ materially from those indicated by
such forward looking statements.
The forward‐looking statements contained in this presentation are based on assumptions that we have made in light of our industry experience and our perceptions of historical trends, current conditions, expected
future developments and other factors we believe are appropriate under the circumstances. The forward-looking statements are not guarantees of performance or results, as they involve risks, uncertainties (some
of which are beyond our control) and assumptions. Although we believe that these forward‐looking statements are based on reasonable assumptions, many factors could affect our actual results and cause them to
differ materially from those anticipated in the forward-looking statements.
More information on potential factors that could affect the Company’s financial condition and operating results is included in “Risk Factors” and “Management’s Discussion and Analysis of Financial Condition and
Results of Operations” in the Company’s Annual Report on Form 10-K filed on March 1, 2018, and in the Company’s other filings with the Securities and Exchange Commission. Any forward‐looking statement
made by the Company in this presentation speaks only as of the date on which we make it. We undertake no obligation to publicly update any forward‐looking statement, whether as a result of new information,
future developments or otherwise, except as may be required by law.
NON-GAAP AND OTHER COMPANY INFORMATION
Included in this presentation are certain non-GAAP financial measures designed to complement the financial information presented in accordance with generally accepted accounting principles in the United States
of America because management believes such measures are useful to investors. Because the Company’s calculations of these measures may differ from similar measures used by other companies, you should be
careful when comparing the Company’s non-GAAP financial measures to those of other companies. A reconciliation of non-GAAP financial measures to GAAP financial measures is included in an appendix to this
presentation.
JASON INDUSTRIES – INVESTOR PRESENTATION MAY 2018 //// PAGE
3
JASON INVESTMENT HIGHLIGHTS
JASON INDUSTRIES – INVESTOR PRESENTATION MAY 2018 //// PAGE
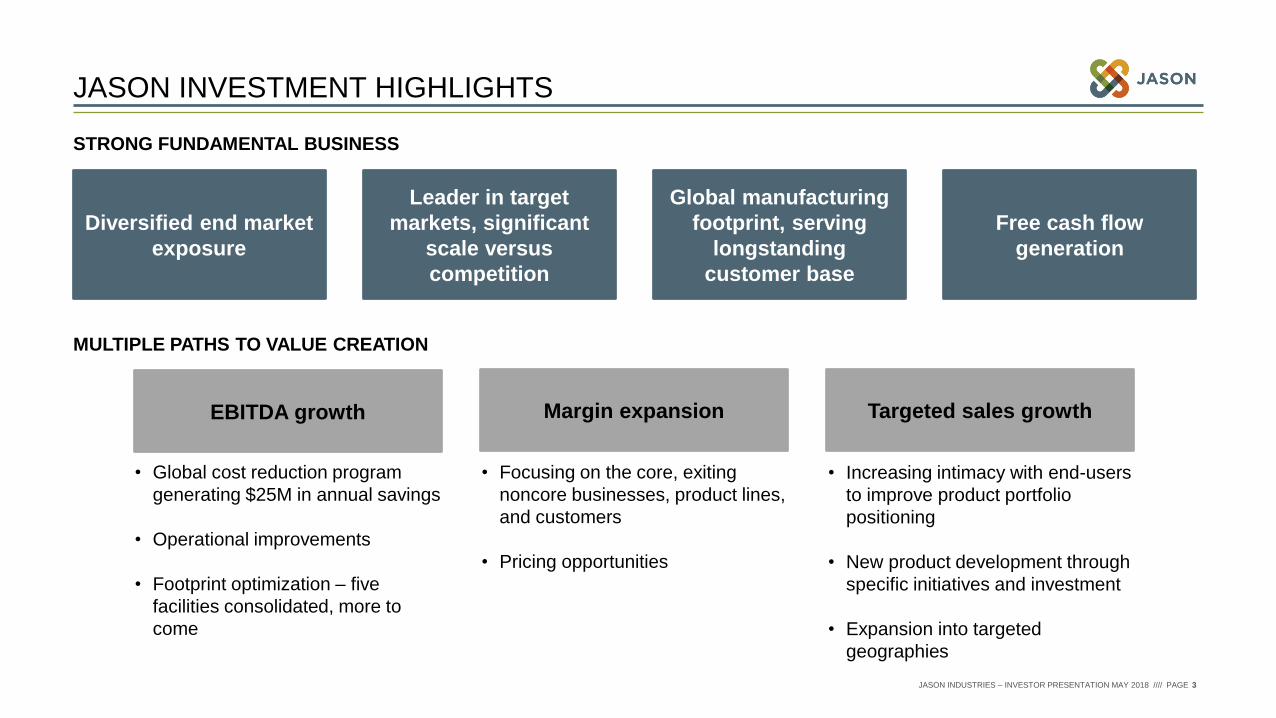
STRONG FUNDAMENTAL BUSINESS
MULTIPLE PATHS TO VALUE CREATION
EBITDA growth
• Global cost reduction program
generating $25M in annual savings
• Operational improvements
• Footprint optimization – five
facilities consolidated, more to
come
• Focusing on the core, exiting
noncore businesses, product lines,
and customers
• Pricing opportunities
• Increasing intimacy with end-users
to improve product portfolio
positioning
• New product development through
specific initiatives and investment
• Expansion into targeted
geographies
Diversified end market
exposure
Leader in target
markets, significant
scale versus
competition
Global manufacturing
footprint, serving
longstanding
customer base
Free cash flow
generation
Margin expansion Targeted sales growth
4
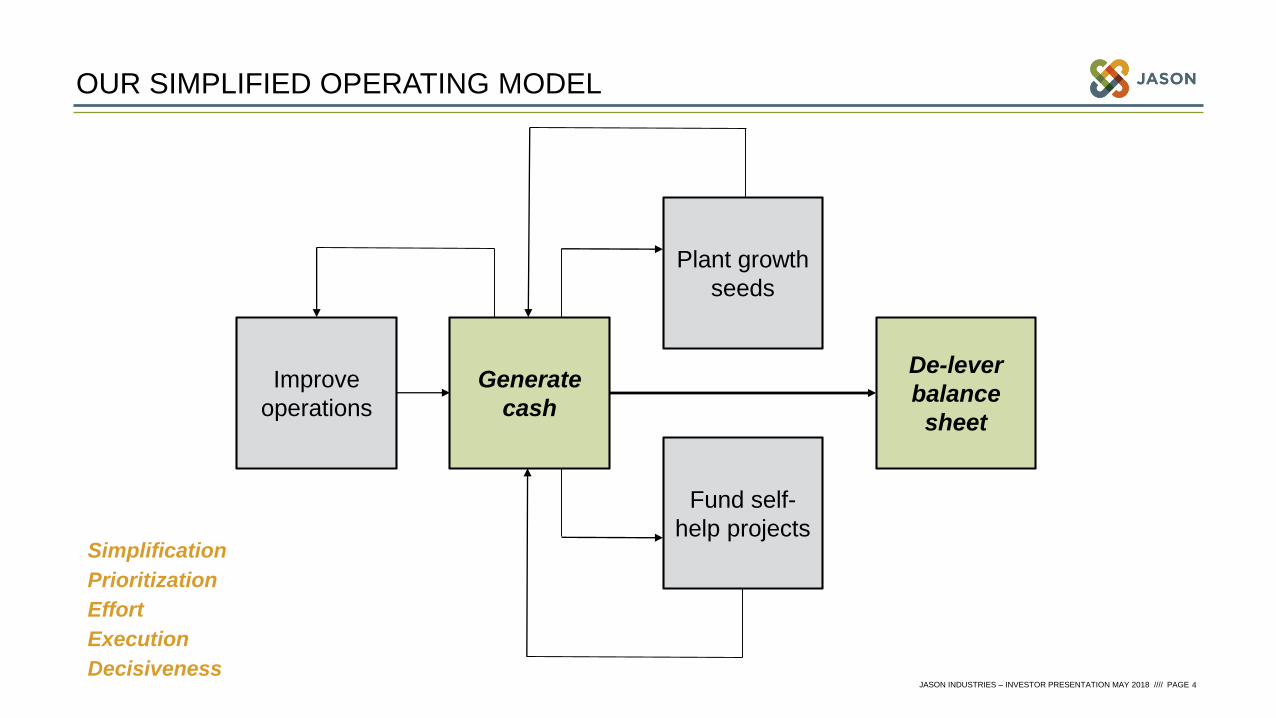
OUR SIMPLIFIED OPERATING MODEL
Simplification
Prioritization
Effort
Execution
Decisiveness
Improve
operations
Generate
cash
Plant growth
seeds
Fund self-
help projects
De-lever
balance
sheet
JASON INDUSTRIES – INVESTOR PRESENTATION MAY 2018 //// PAGE

5
Low single-digit organic sales decline, in line with expectationsOrganic growth in Finishing and Components industrial segments
Softness in Seating and Acoustics OEM segments
150 bps gross profit margin improvement
Adjusted EBITDA margin growth in all 4 businesses, first time since 2014 go-public transaction
Increased free cash flow through improved operations
Continued footprint rationalization progressLibertyville facility consolidation completed
Acoustics Richmond operations rationalization actioned
Q1 2018 RESULTS
JASON INDUSTRIES – INVESTOR PRESENTATION MAY 2018 //// PAGE
Revenue
$167.3M
2.1% organic
decline
Solid Start To 2018
Adj. EBITDA
$19.7M, 11.8%
120 bps
Free Cash Flow
$0.2M
$0.7M
Net Leverage
5.3x
¼ of a turn

6
JASON OVERVIEW
KEY COMPANY FACTS
Employees ~4,000
Headquarters Milwaukee, WI
2017 Revenue $648.8 million
2017 Adjusted EBITDA $67.8 million
Founded 1985
Listed on NASDAQ (JASN, JASNW) July 2014
Manufacturing 33 Sites in 12 Countries
GEOGRAPHIC FOOTPRINT
FINANCIAL PROFILE
$702.5 $708.4 $705.5
$648.8 $600 - $615
$400
$500
$600
$700
$800
ʼ14 ʼ15 ʼ16 ʼ17 ʼ18E
$77.8 $81.2
$64.2 $67.8 $66 - $70
11.1% 11.5%
9.1%
10.4%~11%
$0
$10
$20
$30
$40
$50
$60
$70
$80
$90
ʼ14 ʼ15 ʼ16 ʼ17 ʼ18E
NET SALES($ in Millions)
ADJUSTED EBITDA($ in Millions)
JASON INDUSTRIES – INVESTOR PRESENTATION MAY 2018 //// PAGE

7
SEGMENT OVERVIEW
JASON INDUSTRIES – INVESTOR PRESENTATION MAY 2018 //// PAGE
SEGMENT KEY HIGHLIGHTS BRANDS 2017 REVENUE
% OF JASON
2017 REVENUE
2017 ADJUSTED
EBITDA %
• World’s leading producer of
industrial brushes, buffs and
polishing compounds
• Used for surface preparation,
cutting, finishing, polishing, and
sealing
• Only global provider supplying full
product portfolio range
• 85% consumable, high recurring
revenue
$200M 14%
• Expanded and perforated metal
solutions
• Used in filter products, safety
grating, security fencing, railcars,
and other industrial equipment
• Industry-leading engineering,
coupled with customized
components and individualized
solutions
$83M 12%
FINISHING
31%
COMPONENTS
87%13%
8
SEGMENT OVERVIEW
JASON INDUSTRIES – INVESTOR PRESENTATION MAY 2018 //// PAGE
SEGMENT KEY HIGHLIGHTS BRANDS 2017 REVENUE
% OF JASON
2017 REVENUE
2017 ADJUSTED
EBITDA %
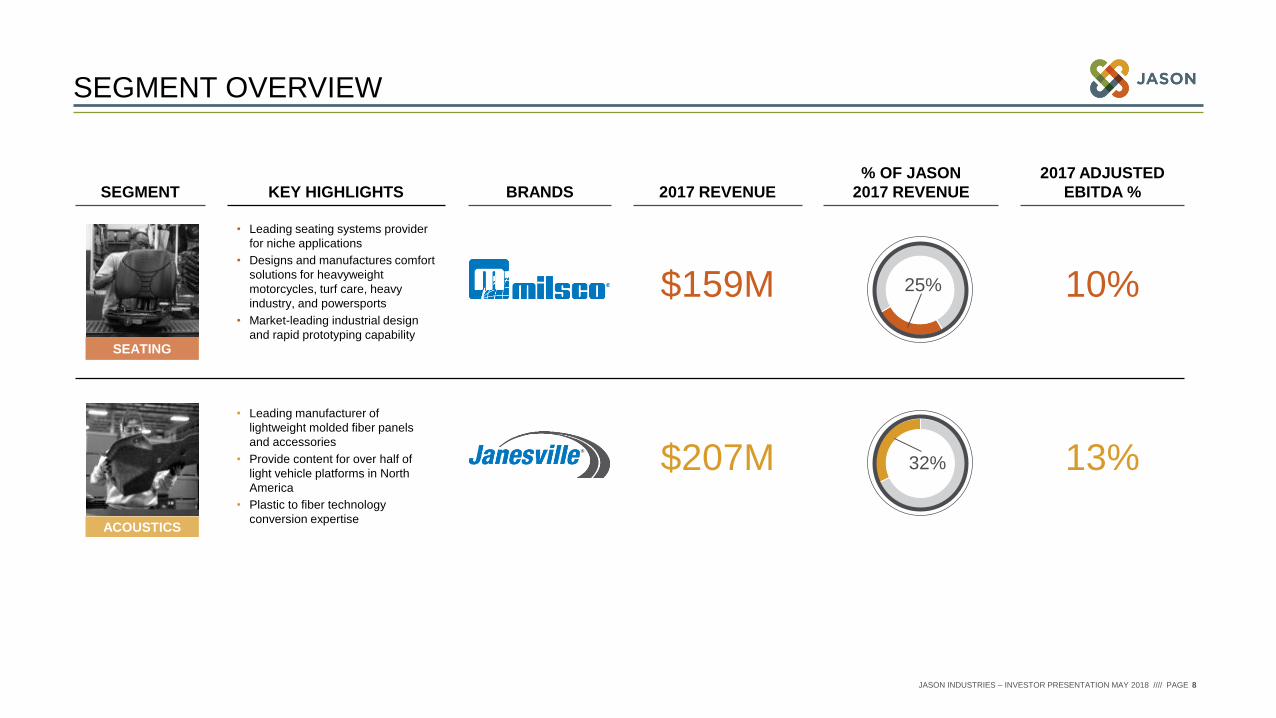
• Leading seating systems provider
for niche applications
• Designs and manufactures comfort
solutions for heavyweight
motorcycles, turf care, heavy
industry, and powersports
• Market-leading industrial design
and rapid prototyping capability
$159M 10%
• Leading manufacturer of
lightweight molded fiber panels
and accessories
• Provide content for over half of
light vehicle platforms in North
America
• Plastic to fiber technology
conversion expertise
$207M 13%
SEATING 25%
25%
ACOUSTICS
32%
9
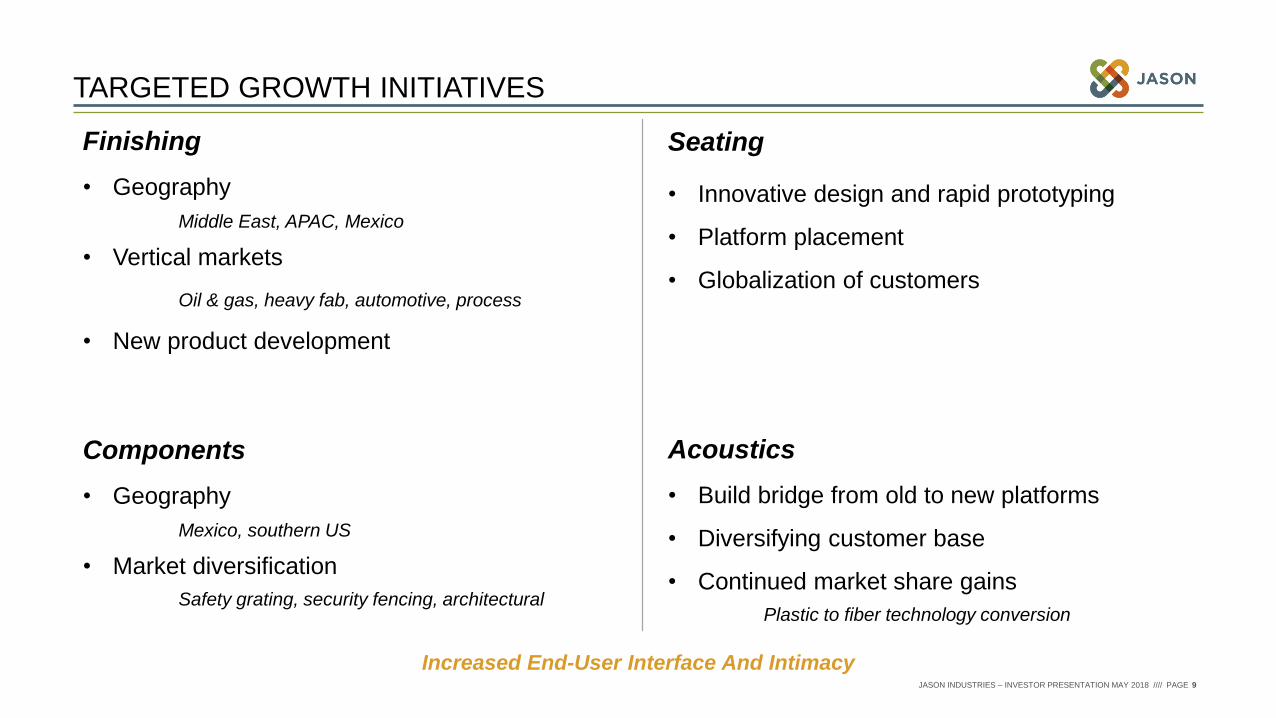
TARGETED GROWTH INITIATIVES
JASON INDUSTRIES – INVESTOR PRESENTATION MAY 2018 //// PAGE
Finishing
• Geography
Middle East, APAC, Mexico
• Vertical markets
Oil & gas, heavy fab, automotive, process
• New product development
Seating
• Innovative design and rapid prototyping
• Platform placement
• Globalization of customers
Components
• Geography
Mexico, southern US
• Market diversification
Safety grating, security fencing, architectural
Acoustics
• Build bridge from old to new platforms
• Diversifying customer base
• Continued market share gains
Plastic to fiber technology conversion
Increased End-User Interface And Intimacy
10
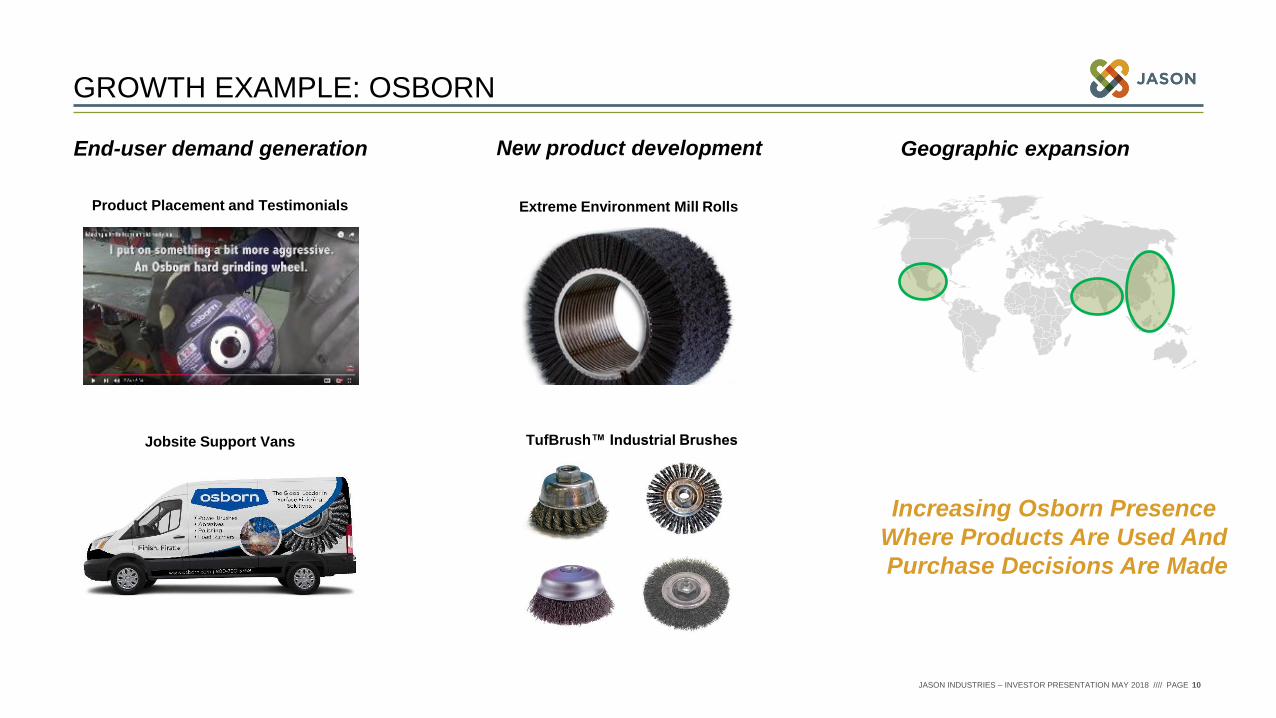
GROWTH EXAMPLE: OSBORN
JASON INDUSTRIES – INVESTOR PRESENTATION MAY 2018 //// PAGE
Increasing Osborn Presence
Where Products Are Used And
Purchase Decisions Are Made
Product Placement and Testimonials
Jobsite Support Vans
End-user demand generation Geographic expansionNew product development
TufBrush™ Industrial Brushes
Extreme Environment Mill Rolls
11
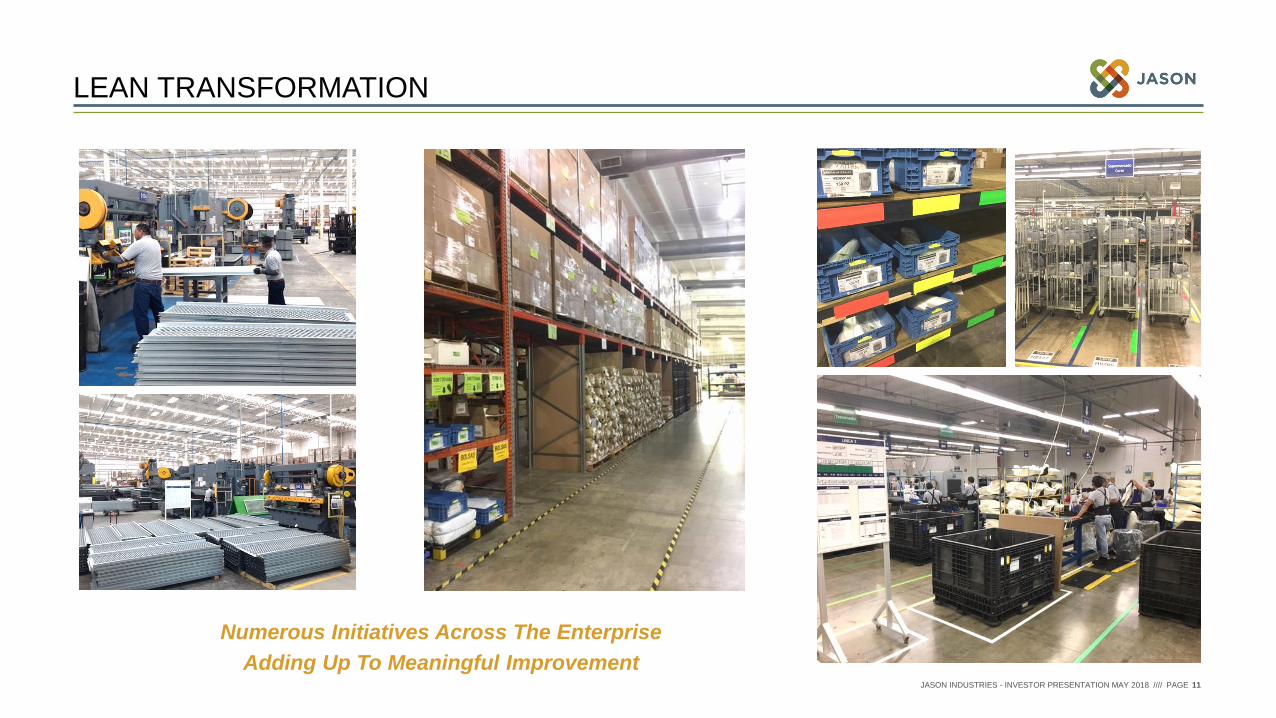
LEAN TRANSFORMATION
JASON INDUSTRIES - INVESTOR PRESENTATION MAY 2018 //// PAGE
Numerous Initiatives Across The Enterprise
Adding Up To Meaningful Improvement

12
COST REDUCTION AND
MARGIN EXPANSION PROGRAM
JASON INDUSTRIES - INVESTOR PRESENTATION MAY 2018 //// PAGE
SELF HELP PROGRAMS EBITDA ImpactAnnual
Savings
Achieved
Annual
Savings
Target Over
3 Years2016 2017 2018 2019
SG&A RESTRUCTURING• Actions exceeded target
$8M $3M -- -- $11M $10M
OPERATIONS OPTIMIZATION• Supply chain project
• Footprint rationalization $2M $7M $3M $1M $13M $15M
$10M $10M $3M $1M $24M $25M
ACTIONS PROGRESS UPDATE
FINISHING BRAZIL EXIT COMPLETE
FACILITY SALE LEASEBACK COMPLETE
ACOUSTICS SALE OF EUROPEAN OPERATIONS COMPLETE
FINISHING VIRGINIA FACILITY CLOSURE COMPLETE
COMPONENTS FACILITY CLOSURE COMPLETE
ACOUSTICS FACILITY CONSOLIDATION• Consolidating Richmond, IN plant into existing facilities
• Annual cost savings of $1.8M, ~$2.1M of restructuring costs
IN PROCESS / ON TRACK 2Q18
ADDITIONAL ACTIONS PENDING

13
FINANCIAL POSITION
JASON INDUSTRIES - INVESTOR PRESENTATION MAY 2018 //// PAGE
LIQUIDITY, DEBT & LEVERAGE FREE CASH FLOW
Focus On Debt Reduction &
Free Cash Flow Generation
(in millions)
$400
$410
$420
$430
$440
$450
$460
$0
$20
$40
$60
$80
$100
$120
1Q16 2Q16 3Q16 4Q16 1Q17 2Q17 3Q17 4Q17 1Q18
D
e
b
t
L
i
q
u
i
d
i
t
y
Cash Revolver Availability Debt
*See Appendix for calculation of Net Debt to Adjusted EBITDA.
Net Debt To Adj. EBITDA 5.3X As Of 1Q18
Reducing debt and leverage, and improving liquidity in 2018
Preferred exchange executed on 25% of outstanding preferred shares
Rating agencies outlooks upgraded to stable
Net Debt to
Adj. EBITDA5.2X 5.6X 5.8x 6.2x 6.2x 5.7x 5.7x 5.5x 5.3x
$2.6
$11.7
$14.2
$13 - $17
$0.0
$2.0
$4.0
$6.0
$8.0
$10.0
$12.0
$14.0
$16.0
$18.0
2015 2016 2017 2018E
14
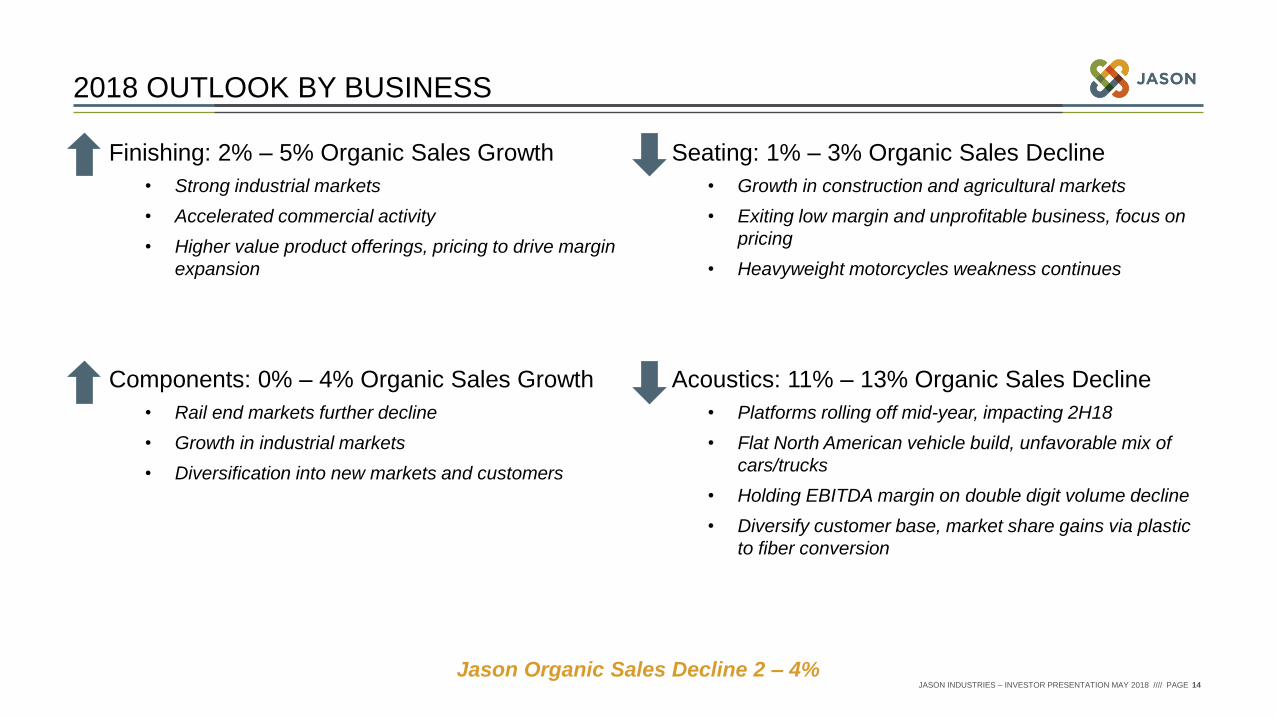
2018 OUTLOOK BY BUSINESS
Finishing: 2% – 5% Organic Sales Growth
• Strong industrial markets
• Accelerated commercial activity
• Higher value product offerings, pricing to drive margin
expansion
Components: 0% – 4% Organic Sales Growth
• Rail end markets further decline
• Growth in industrial markets
• Diversification into new markets and customers
Jason Organic Sales Decline 2 – 4%
Seating: 1% – 3% Organic Sales Decline
• Growth in construction and agricultural markets
• Exiting low margin and unprofitable business, focus on
pricing
• Heavyweight motorcycles weakness continues
Acoustics: 11% – 13% Organic Sales Decline
• Platforms rolling off mid-year, impacting 2H18
• Flat North American vehicle build, unfavorable mix of
cars/trucks
• Holding EBITDA margin on double digit volume decline
• Diversify customer base, market share gains via plastic
to fiber conversion
JASON INDUSTRIES – INVESTOR PRESENTATION MAY 2018 //// PAGE
15
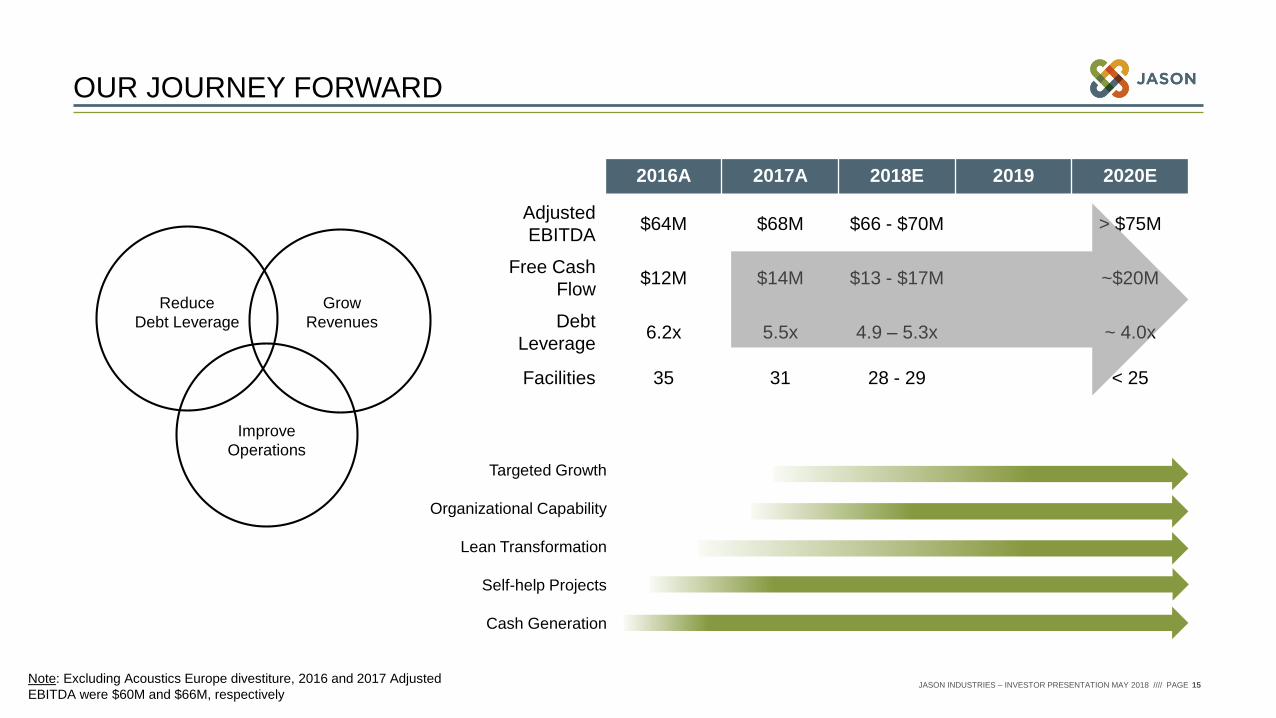
OUR JOURNEY FORWARD
JASON INDUSTRIES – INVESTOR PRESENTATION MAY 2018 //// PAGE
Improve
Operations
Reduce
Debt Leverage
Grow
Revenues
Targeted Growth
Organizational Capability
Lean Transformation
Self-help Projects
Cash Generation
2016A 2017A 2018E 2019 2020E
Adjusted
EBITDA$64M $68M $66 - $70M > $75M
Free Cash
Flow$12M $14M $13 - $17M ~$20M
Debt
Leverage6.2x 5.5x 4.9 – 5.3x ~ 4.0x
Facilities 35 31 28 - 29 < 25
Note: Excluding Acoustics Europe divestiture, 2016 and 2017 Adjusted
EBITDA were $60M and $66M, respectively

16
SUMMARY
JASON INDUSTRIES – INVESTOR PRESENTATION MAY 2018 //// PAGE
MULTIPLE PATHS TO VALUE CREATION
EBITDA growth
• Global cost reduction program
generating $25M in annual savings
• Operational improvements
• Footprint optimization – five
facilities consolidated, more to
come
• Focusing on the core, exiting
noncore businesses, product lines,
and customers
• Pricing opportunities
• Increasing intimacy with end-users
to improve product portfolio
positioning
• New product development through
specific initiatives and investment
• Expansion into targeted
geographies
Margin expansion Targeted sales growth
2017 EXECUTION
• Completed and ongoing restructuring actions
• Improving operations through Lean
• Free cash flow and working capital reduction
• Leverage reduction
Did What We Said We Were Going To Do,
Creating Future Value

APPENDIX
JASON INDUSTRIES – INVESTOR PRESENTATION MAY 2018 //// PAGE

18
ADDRESSABLE MARKET(1)
$8 BILLIONWORLDWIDE
EUROPE 60%
U.S. 34%
MEXICO 4%
ROW 2%
INDUSTRIAL BRUSHES 44%
ABRASIVES 24%
INDUSTRIAL BUFFS &
COMPOUNDS 22%
OTHER 10%
FINISHING OVERVIEW
OVERVIEW
• Global manufacturer of products used for finishing, preparation, metal removal, sealing, shielding and polishing; manufacturing, distribution and sales facilities in 13 countries
• #1 manufacturer of industrial brushes, buffs and polishing compounds in the world; 85% of revenue is recurring in nature (consumable)
• Improving profit margins by consolidating facilities and employing 80/20 techniques to portfolio of products and customers
• Targeted growth initiatives through new product development, select geographies, and end-user demand generation
GLOBALLY RECOGNIZED BRAND, WITH EXCEPTIONAL REPUTATION
FOR QUALITY, PERFORMANCE, AND MARKET LEADERSHIP
JASON INDUSTRIES – INVESTOR PRESENTATION MAY 2018 //// PAGE
Europe
55%
2017
REVENUE BY
END PRODUCT
2017
REVENUE BY
GEOGRAPHY
$188 $191 $197 $200
14% 14%
12%
14%
$0
$40
$80
$120
$160
$200
ʼ14 ʼ15 ʼ16 ʼ17
FINANCIAL PROFILE
Adjusted EBITDA %
Revenue ($ in millions)
(1) Management estimates

19
U.S. 100%
FILTRATION 36%
RAIL 33%
ELECTRIC METERS 21%
INDUSTRIAL 8%
OTHER 1%
COMPONENTS OVERVIEW
OVERVIEW
• North America’s top manufacturer of expanded and perforated metal products,
used in filtration, safety grating, security fencing, and other industrial applications
• Exited dilutive non-core product lines in 2016 and 2017, consolidated footprint
• Targeting attractive growth markets including infrastructure security, architectural
applications, and Mexico
INNOVATIVE DESIGN AND MANUFACTURING CAPABILITIES TO
SUPPORT AND SUSTAIN SUCCESSFUL, LONG-TERM CUSTOMER
RELATIONSHIPS
JASON INDUSTRIES – INVESTOR PRESENTATION MAY 2018 //// PAGE
2017
REVENUE BY
GEOGRAPHY
2017
REVENUE BY
END PRODUCT
$124 $122
$98
$83
14%
17%
15%
12%
$0
$30
$60
$90
$120
$150
ʼ14 ʼ15 ʼ16 ʼ17
FINANCIAL PROFILE
Adjusted EBITDA %
Revenue ($ in millions)
ADDRESSABLE MARKET(1)
$750 MILLIONIN NORTH AMERICA
$2 BILLIONWORLDWIDE//
(1) Management estimates
20
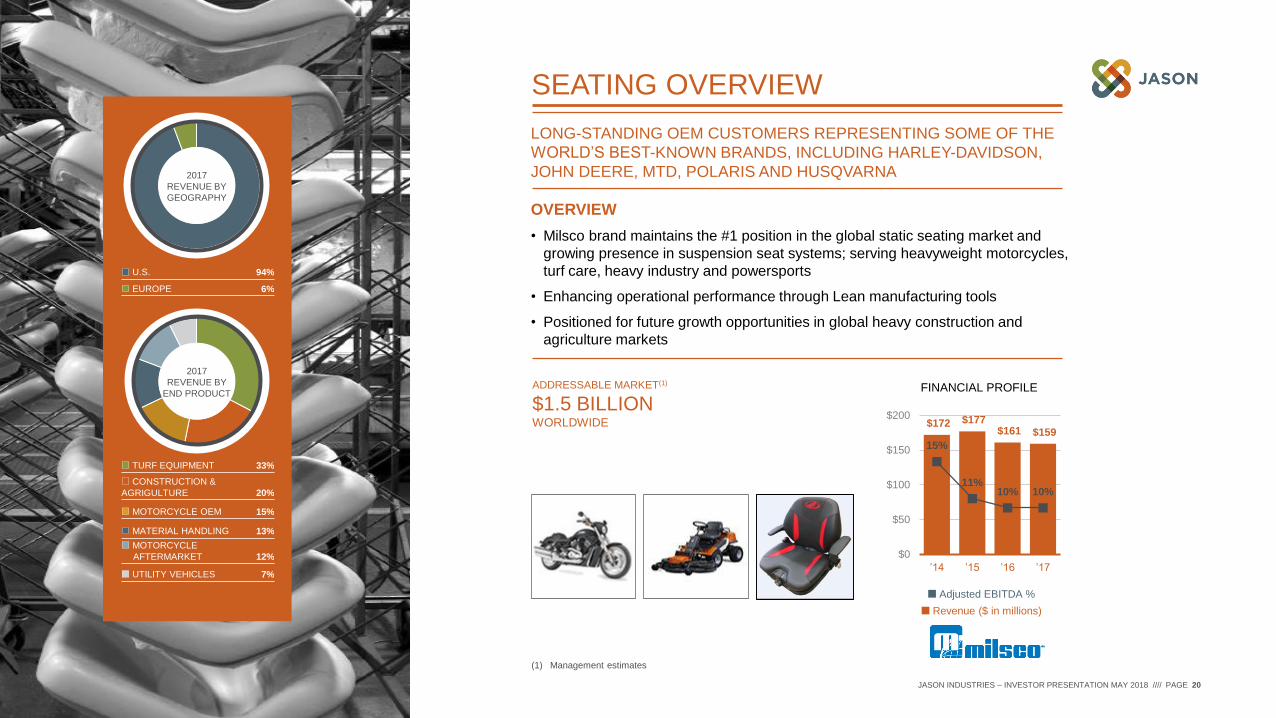
ADDRESSABLE MARKET(1)
$1.5 BILLIONWORLDWIDE
SEATING OVERVIEW
OVERVIEW
• Milsco brand maintains the #1 position in the global static seating market and
growing presence in suspension seat systems; serving heavyweight motorcycles,
turf care, heavy industry and powersports
• Enhancing operational performance through Lean manufacturing tools
• Positioned for future growth opportunities in global heavy construction and
agriculture markets
LONG-STANDING OEM CUSTOMERS REPRESENTING SOME OF THE
WORLD’S BEST-KNOWN BRANDS, INCLUDING HARLEY-DAVIDSON,
JOHN DEERE, MTD, POLARIS AND HUSQVARNA
United
States
95%
(1) Management estimates
$172 $177 $161 $159
15%
11%10% 10%
$0
$50
$100
$150
$200
ʼ14 ʼ15 ʼ16 ʼ17
FINANCIAL PROFILE
Adjusted EBITDA %
Revenue ($ in millions)
2017
REVENUE BY
GEOGRAPHY
31%2017
REVENUE BY
END PRODUCT
U.S. 94%
EUROPE 6%
TURF EQUIPMENT 33%
CONSTRUCTION &
AGRIGULTURE 20%
MOTORCYCLE OEM 15%
MATERIAL HANDLING 13%
MOTORCYCLE
AFTERMARKET 12%
UTILITY VEHICLES 7%
JASON INDUSTRIES – INVESTOR PRESENTATION MAY 2018 //// PAGE

21
OVERVIEW
• North America’s largest producer of acoustical fiber insulation and a leading
producer of automotive fiber-based molded and die-cut products
• Products are used in greater than 50% of light vehicles in North America today,
including the majority of top platforms
• Future organic growth will be driven by innovative new products, including
lightweight-fiber automotive underbodies and wheel liners
EXTENSIVE DESIGN AND MANUFACTURING EXPERTISE TO
PROVIDE CUSTOM ACOUSTICAL SOLUTIONS FOR EACH VEHICLE
PLATFORM IT SERVES
ADDRESSABLE MARKET(1)
$2.5 BILLIONIN NORTH AMERICA
U.S. 69%
MEXICO 20%
EUROPE 11%
TRUNK SYSTEMS 27%
MOLDED INSULATION 27%
DIE CUT INSULATION 18%
IP CLOSEOUTS 8%
CARPET SYSTEMS 8%
WHEEL LINERS 3%
ENGINE 1%
OTHER 8%
ACOUSTICS OVERVIEW
JASON INDUSTRIES – INVESTOR PRESENTATION MAY 2018 //// PAGE
2017
REVENUE BY
GEOGRAPHY
2017
REVENUE BY
END PRODUCT*
$219 $218
$250
$207
9%
13%
11%
13%
$0
$50
$100
$150
$200
$250
ʼ14 ʼ15 ʼ16 ʼ17
FINANCIAL PROFILE
Adjusted EBITDA %
Revenue ($ in millions)
(1) Management estimates
Wheelhouse/Cowl
Under Bonnet
Hush Panels
Dashboard Insulators(Interior & Exterior)
Door Panel Insulation
Underbody
Floor/CarpetUnderlayment
LuggageCompartment
*North America only
22
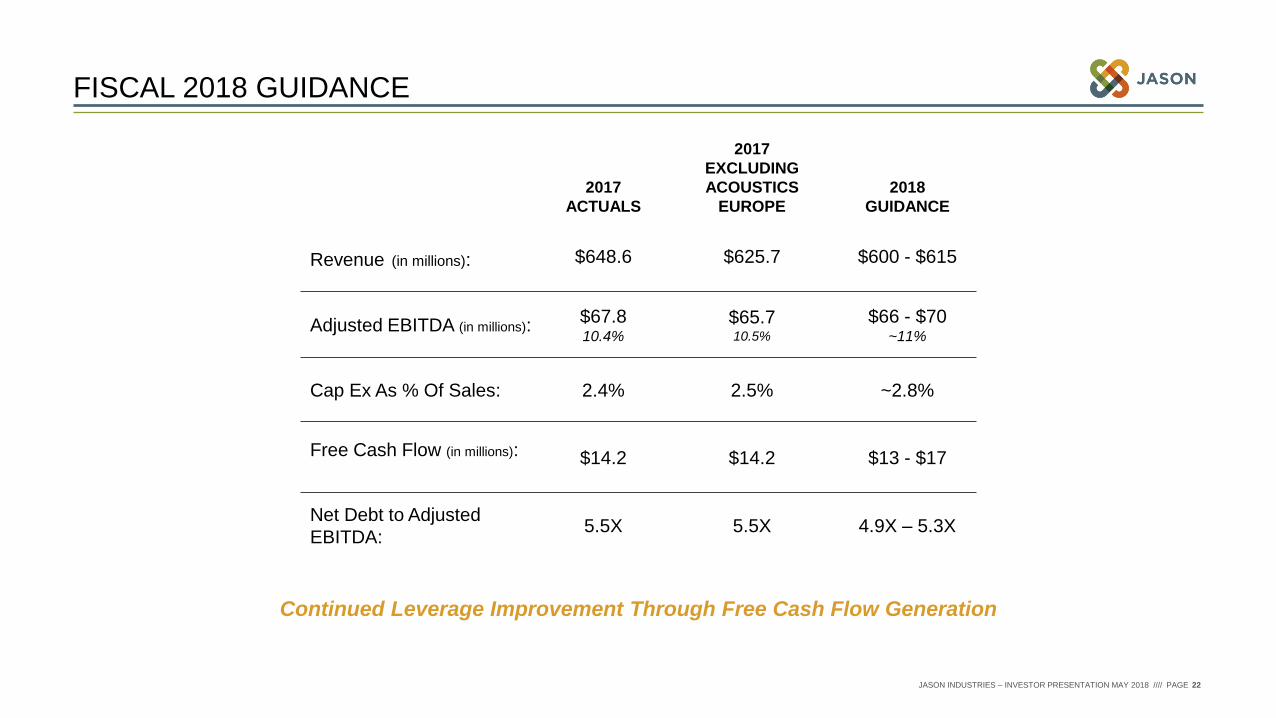
FISCAL 2018 GUIDANCE
Continued Leverage Improvement Through Free Cash Flow Generation
2017
ACTUALS
2017
EXCLUDING
ACOUSTICS
EUROPE
2018
GUIDANCE
Revenue (in millions): $648.6 $625.7 $600 - $615
Adjusted EBITDA (in millions):$67.810.4%
$65.710.5%
$66 - $70~11%
Cap Ex As % Of Sales: 2.4% 2.5% ~2.8%
Free Cash Flow (in millions): $14.2 $14.2 $13 - $17
Net Debt to Adjusted
EBITDA:5.5X 5.5X 4.9X – 5.3X
JASON INDUSTRIES – INVESTOR PRESENTATION MAY 2018 //// PAGE
23
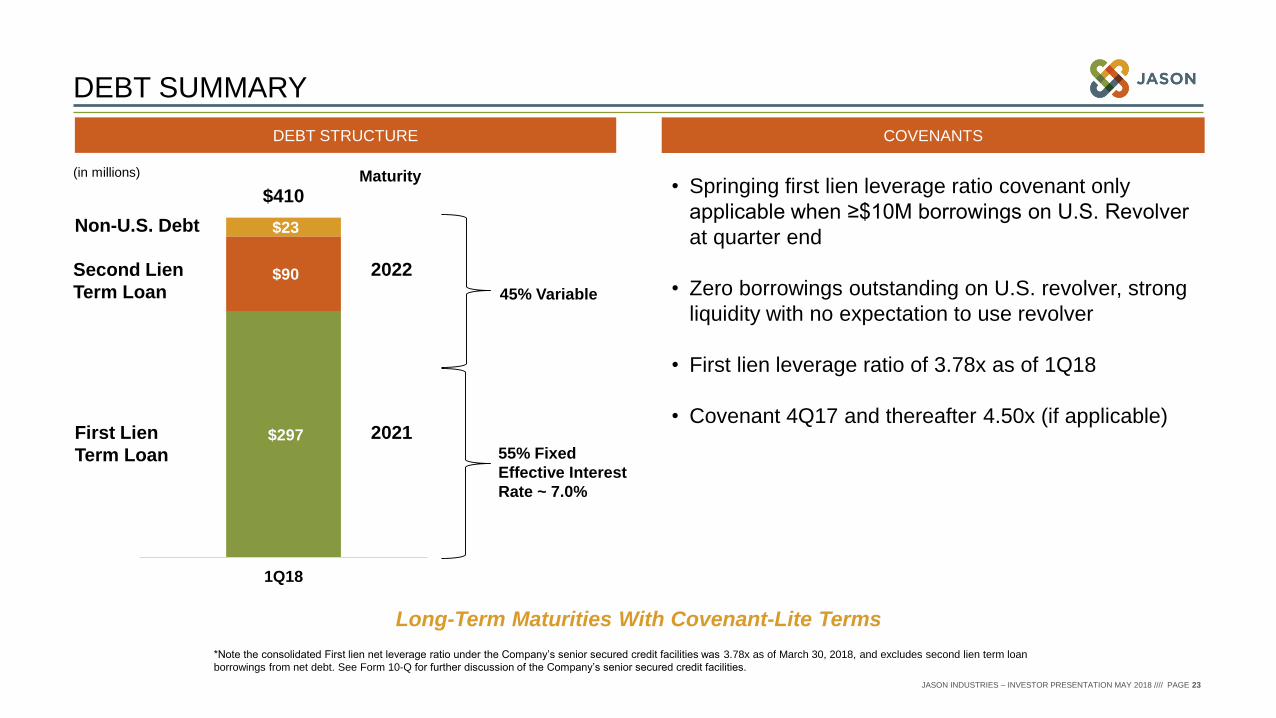
DEBT SUMMARY
JASON INDUSTRIES – INVESTOR PRESENTATION MAY 2018 //// PAGE
DEBT STRUCTURE
Long-Term Maturities With Covenant-Lite Terms
(in millions)
$297
$90
$23
1Q18
First Lien
Term Loan
Second Lien
Term Loan
Non-U.S. Debt
2021
2022
Maturity
45% Variable
55% Fixed
Effective Interest
Rate ~ 7.0%
COVENANTS
• Springing first lien leverage ratio covenant only
applicable when ≥$10M borrowings on U.S. Revolver
at quarter end
• Zero borrowings outstanding on U.S. revolver, strong
liquidity with no expectation to use revolver
• First lien leverage ratio of 3.78x as of 1Q18
• Covenant 4Q17 and thereafter 4.50x (if applicable)
*Note the consolidated First lien net leverage ratio under the Company’s senior secured credit facilities was 3.78x as of March 30, 2018, and excludes second lien term loan
borrowings from net debt. See Form 10-Q for further discussion of the Company’s senior secured credit facilities.
$410

24
ADJUSTED EBITDA RECONCILIATION
JASON INDUSTRIES – INVESTOR PRESENTATION MAY 2018 //// PAGE
1Q18 1Q17
(in millions)
Net Income (Loss) $(0.8) $(0.5)
Interest expense 8.0 8.4
Tax provision (benefit) 0.3 (0.0)
Depreciation and amortization 10.8 10.0
EBITDA 18.3 17.9
Adjustments:
Restructuring 0.6 0.7
Integration and other restructuring costs 0.4 -
Share-based compensation 0.2 0.3
(Gain) loss on disposals of fixed assets – net 0.2 (0.3)
(Gain) loss on extinguishment of debt - -
Loss on divestitures - -
Total adjustments 1.4 0.7
Adjusted EBITDA $19.7 $18.6

25
ADJUSTED NET INCOME &
ADJUSTED EARNINGS PER SHARE
JASON INDUSTRIES – INVESTOR PRESENTATION MAY 2018 //// PAGE
1Q18 1Q17
(in millions, except per share amounts)
GAAP Net Income (Loss) $(0.8) $(0.5)
Adjustments:
Restructuring 0.6 0.7
Integration and other restructuring costs 0.4 -
Share-based compensation 0.2 0.3
(Gain) loss on disposal of fixed assets-net 0.2 (0.3)
Tax effect on adjustments (0.3) (0.1)
Tax benefit 0.4
Adjusted Net Income (Loss) $0.7 $0.2
Diluted weighted average number of
common shares outstanding (non-GAAP)30.6 29.8
GAAP Net (loss) income per share available to
Common shareholders of Jason Industries$(0.09) $(0.05)
Adjustments net of income taxes:
Restructuring 0.02 0.02
Integration and other restructuring costs 0.01 -
Share-based compensation 0.01 0.02
(Gain) loss on disposal of fixed assets-net 0.01 (0.01)
Tax benefit 0.02 -
Redemption premium on preferred stock
conversion0.04
GAAP to non-GAAP impact per share - 0.03
Adjusted (loss) earnings per share $0.02 $0.01
26
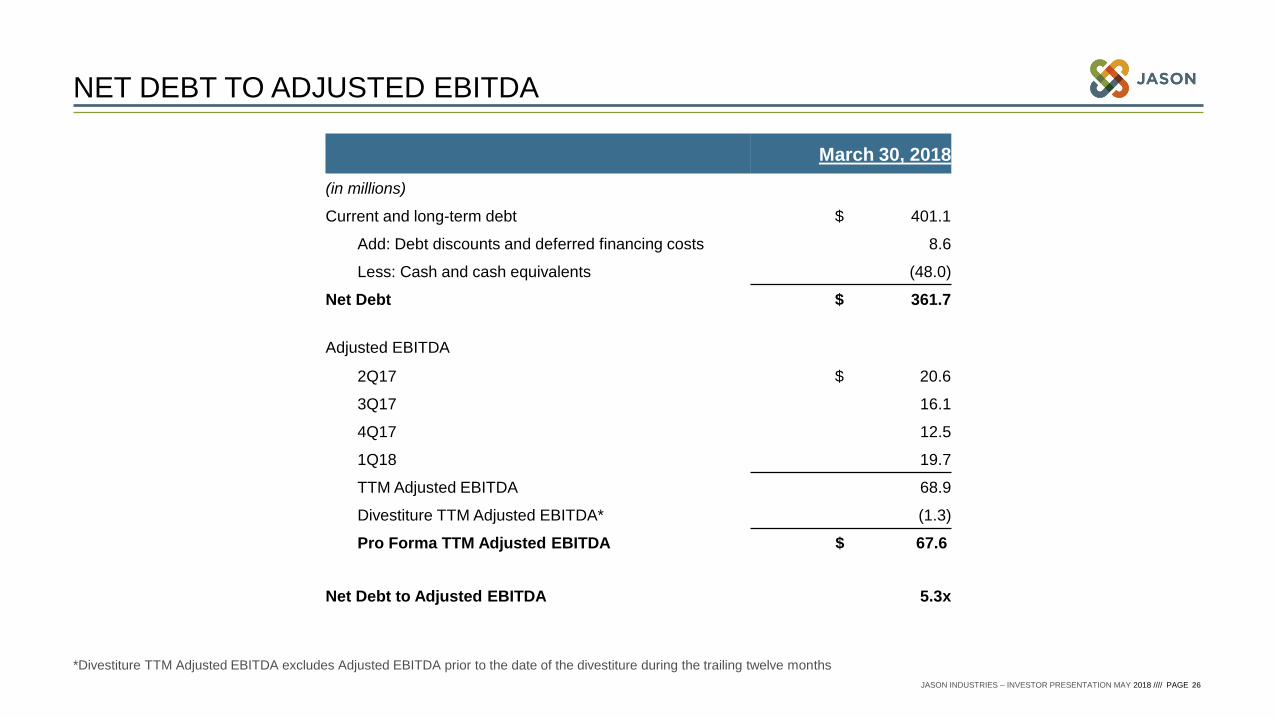
NET DEBT TO ADJUSTED EBITDA
JASON INDUSTRIES – INVESTOR PRESENTATION MAY 2018 //// PAGE
March 30, 2018
(in millions)
Current and long-term debt $ 401.1
Add: Debt discounts and deferred financing costs 8.6
Less: Cash and cash equivalents (48.0)
Net Debt $ 361.7
Adjusted EBITDA
2Q17 $ 20.6
3Q17 16.1
4Q17 12.5
1Q18 19.7
TTM Adjusted EBITDA 68.9
Divestiture TTM Adjusted EBITDA* (1.3)
Pro Forma TTM Adjusted EBITDA $ 67.6
Net Debt to Adjusted EBITDA 5.3x
*Divestiture TTM Adjusted EBITDA excludes Adjusted EBITDA prior to the date of the divestiture during the trailing twelve months

JASON INDUSTRIES – INVESTOR PRESENTATION MAY 2018 //// PAGE