Embed Size (px)
Citation preview

© 2015 DMC. All rights reserved. INGENUITY IN ACTION.
Investor PresentationMay 2018
DMCGlobal.com2018 Investor Presentation
CAUTIONARY STATEMENT REGARDING FORWARD-LOOKING INFORMATION
2
This presentation contains “forward-looking
statements” within the meaning of section 27A of the
Securities Act of 1933 and section 21E of the Securities
Exchange Act of 1934. We intend the forward-looking
statements throughout this presentation to be covered
by the safe harbor provisions for forward-looking
statements. Statements contained in this report which
are not historical facts are forward-looking statements
that involve risks and uncertainties that could cause
actual results to differ materially from projected results.
These statements can sometimes be identified by our
use of forward-looking words such as “may,” “believe,”
“plan,” “anticipate,” “estimate,” “expect,” “intend,” and
other phrases of similar meaning. Such statements
include projections, guidance and other statements
regarding our expected financial position and operating
results, the expected impacts of new accounting
standards and the timing of our implementation
thereof, our business strategy, expectations regarding
NobelClad's end markets and activity levels, comments
regarding expanding demand for DynaEnergetics'
products, particularly DynaSelectTM and DynaStageTM,
in foreign currencies; competitive factors; the timely
completion of contracts; the timing and size of
expenditures; the timely receipt of government
approvals and permits; the price and availability of
metal and other raw material; the adequacy of local
labor supplies at our facilities; current or future limits
on manufacturing capacity at our various operations;
our ability to complete our expansion plans on
schedule and on budget; our ability to successfully
integrate acquired businesses; the impact of pending or
future litigation or regulatory matters; the availability
and cost of funds; and general economic conditions,
both domestic and foreign, impacting our business and
the business of the end-market users we serve. Readers
are cautioned not to place undue reliance on these
forward-looking statements, which reflect
management’s analysis only as of the date hereof. We
undertake no obligation to publicly release the results
of any revision to these forward-looking statements
that may be made to reflect events or circumstances
after the date hereof or to reflect the occurrence of
unanticipated events.
expected expansion plans in Blum, Texas, Troisdorf,
Germany and Mt. Braddock, Pennsylvania, the expected
amounts of AD/CVD penalties to be assessed, our
liquidity position and factors impacting such position,
including expectations regarding legal costs, and the
outcome of pending regulatory matters and patent
litigation. The forward-looking information is based on
information available as of the date of this report and
on numerous assumptions and developments that are
not within our control. Although we believe that our
expectations as expressed in these forward-looking
statements are reasonable, we cannot assure you that
our expectations will turn out to be correct. Factors that
could cause actual results to differ materially include,
but are not limited to, those factors referenced in our
Annual Report on Form 10-K for the year ended
December 31, 2017 and such things as the following:
changes in global economic conditions; the ability to
obtain new contracts at attractive prices; the size and
timing of customer orders and shipments ; product
pricing and margins; our ability to realize sales from our
backlog; fluctuations in customer demand; fluctuations
DMCGlobal.com
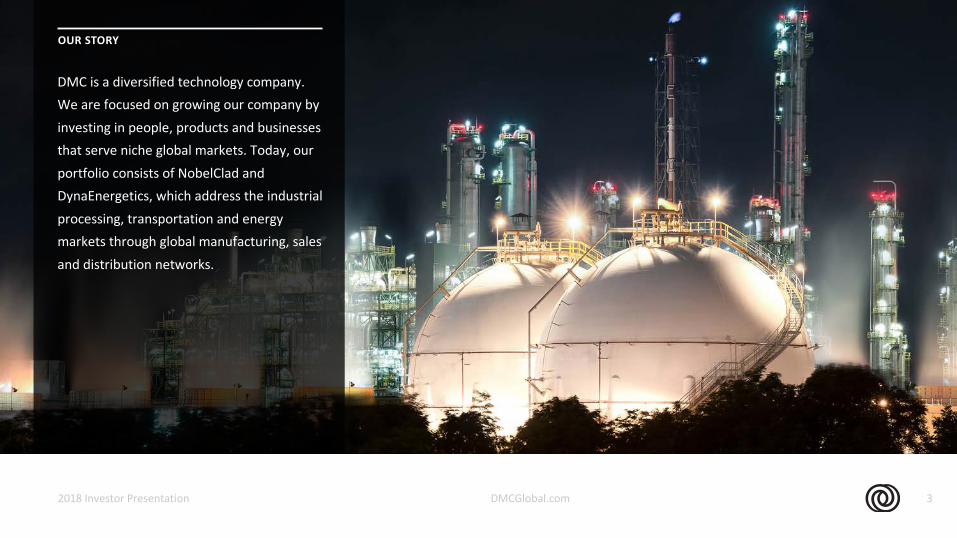
DMC is a diversified technology company. We are focused on growing our company by investing in people, products and businesses that serve niche global markets. Today, our portfolio consists of NobelClad and DynaEnergetics, which address the industrial processing, transportation and energy markets through global manufacturing, sales and distribution networks.
2018 Investor Presentation 3
OUR STORY
DMCGlobal.com
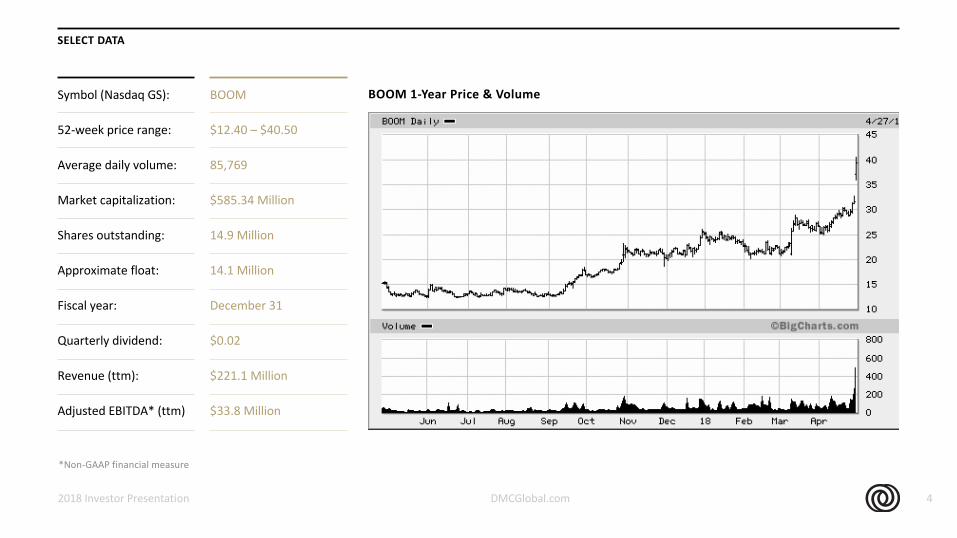
SELECT DATA
BOOM
$12.40 – $40.50
85,769
$585.34 Million
14.9 Million
14.1 Million
December 31
$0.02
$221.1 Million
$33.8 Million
2018 Investor Presentation 4
Symbol (Nasdaq GS):
52-week price range:
Average daily volume:
Market capitalization:
Shares outstanding:
Approximate float:
Fiscal year:
Quarterly dividend:
Revenue (ttm):
Adjusted EBITDA* (ttm)
BOOM 1-Year Price & Volume
*Non-GAAP financial measure
DMCGlobal.com
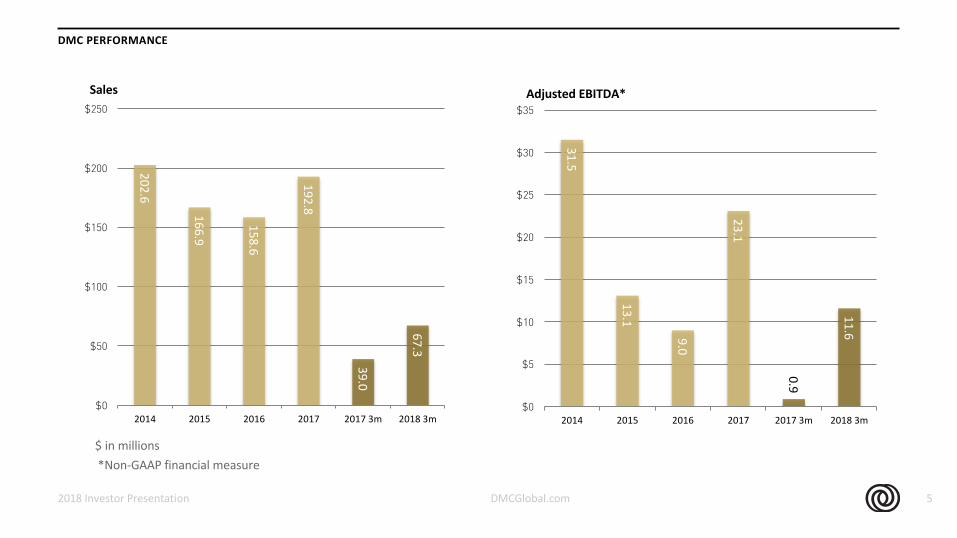
DMC PERFORMANCE
2018 Investor Presentation 5
$ in millions
202.6
166.9
158.6
192.8
39.0
67.3
$0
$50
$100
$150
$200
$250
2014 2015 2016 2017 2017 3m 2018 3m
Sales
*Non-GAAP financial measure
1
1
31.5
13.1
9.0
23.1
0.9
11.6
$0
$5
$10
$15
$20
$25
$30
$35
2014 2015 2016 2017 2017 3m 2018 3m
Adjusted EBITDA*
DMCGlobal.com
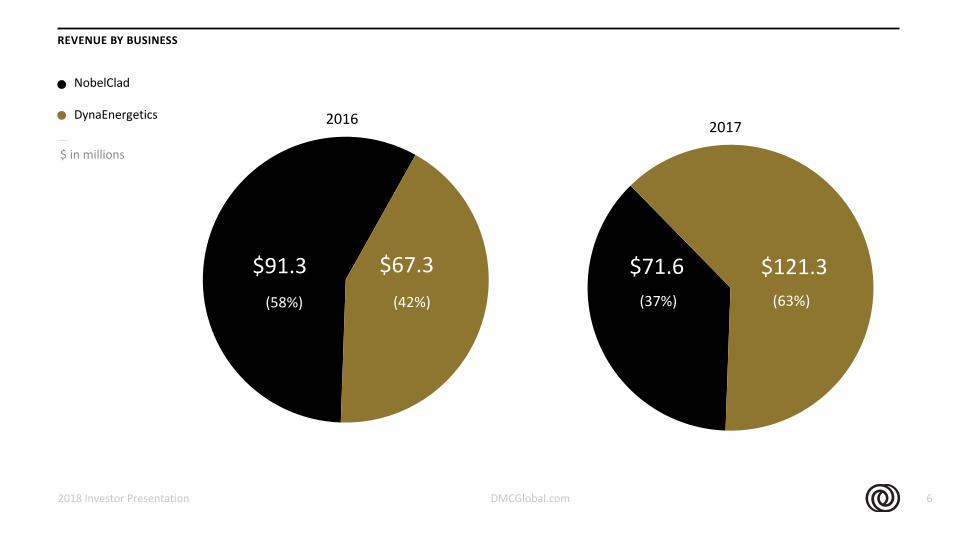
2016
(58%)
$67.3
(42%)
$91.3
REVENUE BY BUSINESS
2018 Investor Presentation
6
2017
(37%)
$121.3(63%)
NobelClad
DynaEnergetics
$ in millions
$71.6
6
DMCGlobal.com
DMC EXECUTIVE LEADERSHIP
2018 Investor Presentation 7
KEVIN LONGE
• Named President, CEO and Director in March 2013
• Joined DMC as COO in July 2012
• Former VP and and GM of Sonoco's $600 million Protective Packaging division
• Former President of Sonoco's ThermoSafe Brands
• Oversaw global sales, marketing, engineering and R&D for the life sciences, medical, food and industrial durables markets
• Oversaw eight manufacturing centers in the U.S., Europe and Asia
• Former President of three operating divisions at Lydall, Inc. (NYSE-LDL)
President & CEO MICHAEL KUTA
• Joined DMC as CFO in March 2014
• Former Corporate Controller at Berkshire Hathaway’s Lubrizol Corporation, a global, $6 billion specialty chemicals company
• Was responsible for building and managing financial operations for Lubrizol’s disbursed global operations, including accounting, consolidation and financial reporting functions, and oversight of internal controls
• Former financial positions of increasing responsibility at Lincoln Electric and Eaton Corporation
CFO MICHELLE SHEPSTON
• Joined DMC in 2016 after 16 years with Denver-based Davis Graham & Stubbs LLP
• Was a partner with DGS, and practiced with the Corporate Finance and Acquisitions Group
• Expertise in securities law, mergers & acquisitions, cross border debt & equity transactions, contract negotiation and execution
• Industry expertise includes energy and natural resources
CLO GEOFF HIGH
• Joined DMC in November 2014 after 21 years with Denver-based Pfeiffer High Investor Relations, Inc.
• Former partner with Pfeiffer High; oversaw small-cap and mid-cap public-company accounts across multiple industries. Managed the DMC Global account for 10 years
• Expertise in institutional, analyst and retail investor relations; shareholder analysis and targeting; IR strategy development and implementation
• Industry expertise includes oil & gas and industrial infrastructure
VP, IR
DMCGlobal.com
LEADERSHIP TEAM
2018 Investor Presentation 8
IAN GRIEVESPresident, DynaEnergetics
• Joined DynaEnergetics in 2013
• 20 years of diverse operational, engineering, finance and management experience with international industrial businesses
• Previously Senior Vice President of Lydall, Inc.’s Performance Materials division
JOHN SCHEATZLEPresident, NobelClad
• Joined DMC in 2016 after 19 years with advanced materials manufacturer Materion
• As Vice President and General Manager of Materion’s Performance Alloys division, was responsible for multiple North American production facilities and international sales and distribution centers
• Former General Manager of Materion’s Ceramic Products division
BIN ZHANGManaging Director, China, DMC
• Responsible for Chinese business development and market positioning for NobelClad and DynaEnergetics
• Native of Beijing with 20 years of senior level business experience
• Established an Asia Pacific sales and marketing presence for a Sheldahl, Inc., a specialized manufacturer based in Minnesota

DMCGlobal.com
DMC empowers its people and organizations by institutionalizing entrepreneurship and celebrating technical ingenuity. Our growth is fueled by energized, relevant and nimbly executed solutions that make a real difference to our customers. DMC’s responsive organizations are focused on serving the world’s growth markets, giving investors high returns throughout varying economic cycles.
2018 Investor Presentation 9
OUR CULTURE
DMCGlobal.com
CHAPTER & PAGE TITLE HERE
2018 Investor Presentation 10
REPRESENTATIVE: NAME & POSITION HERE
DMCGlobal.com
DYNAENERGETICS OVERVIEW
2018 Investor Presentation 11
Leading provider of advanced perforating technologies and systems to the oil and gas industry.
Acquired by DMC in 2007 as new platform business
Unmatched global reach serving a worldwide network of oil and gas service providers
Reputation for product safety, technical innovation and system reliability under extreme environmental conditions
Perforating and well-completion technologies drive improved safety, productivity and lower operating costs for customers
DMCGlobal.com 122018 Investor Presentation
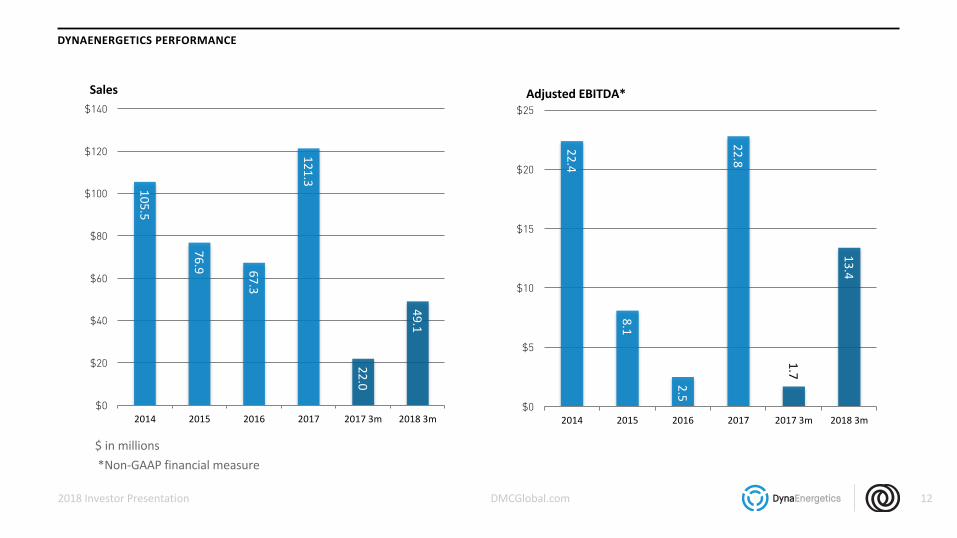
DYNAENERGETICS PERFORMANCE
$ in millions
105.5
76.9 67.3
121.3
22.0
49.1
$0
$20
$40
$60
$80
$100
$120
$140
2014 2015 2016 2017 2017 3m 2018 3m
Sales
*Non-GAAP financial measure
1
1
22.4
8.1
2.5
22.8
1.7
13.4
$0
$5
$10
$15
$20
$25
2014 2015 2016 2017 2017 3m 2018 3m
Adjusted EBITDA*
DMCGlobal.com
PERFORATING BASICS
2018 Investor Presentation 13
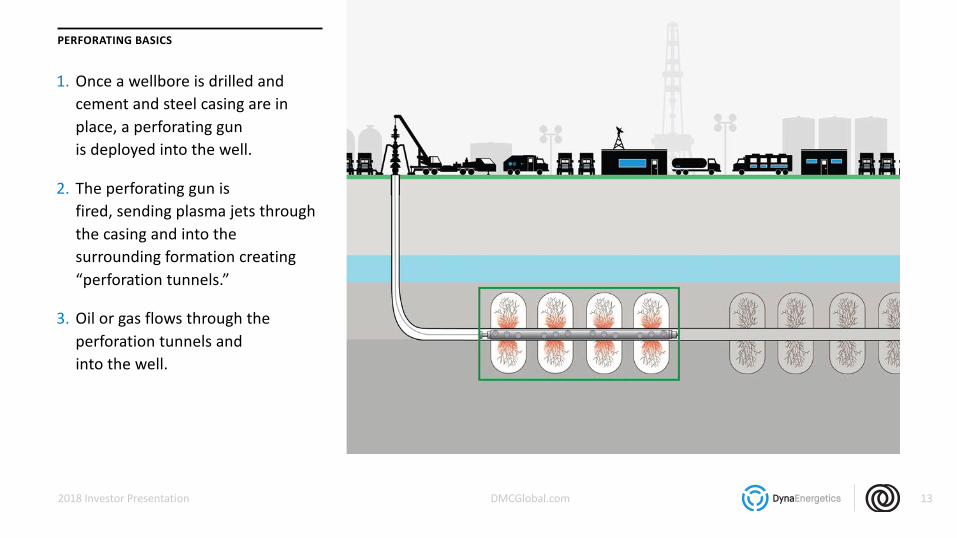
1. Once a wellbore is drilled and cement and steel casing are in place, a perforating gun is deployed into the well.
2. The perforating gun is fired, sending plasma jets through the casing and into the surrounding formation creating “perforation tunnels.”
3. Oil or gas flows through the perforation tunnels and into the well.
DMCGlobal.com 14
PRIMARY COMPONENTS OF A PERFORATING SYSTEM
2018 Investor Presentation
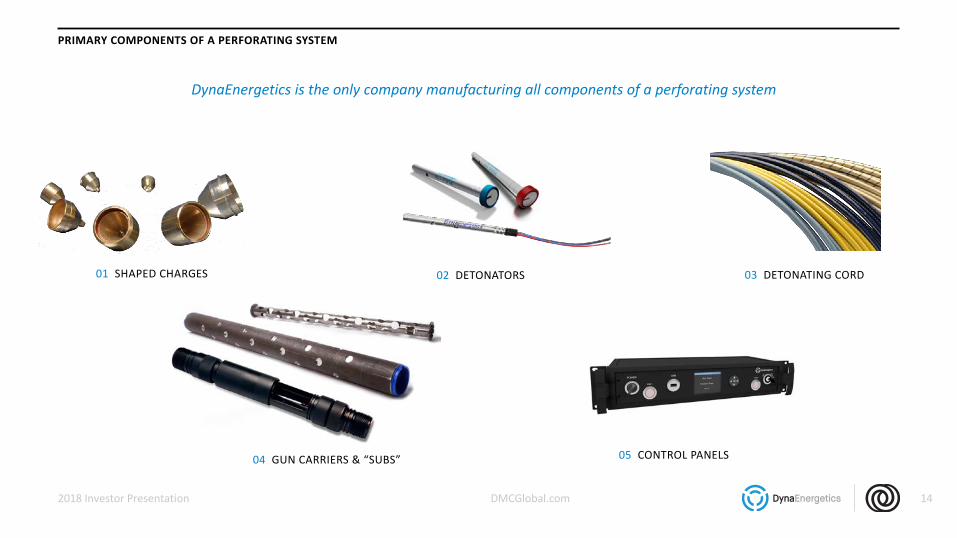
DynaEnergetics is the only company manufacturing all components of a perforating system
01 SHAPED CHARGES 02 DETONATORS 03 DETONATING CORD
04 GUN CARRIERS & “SUBS” 05 CONTROL PANELS
DMCGlobal.com 15
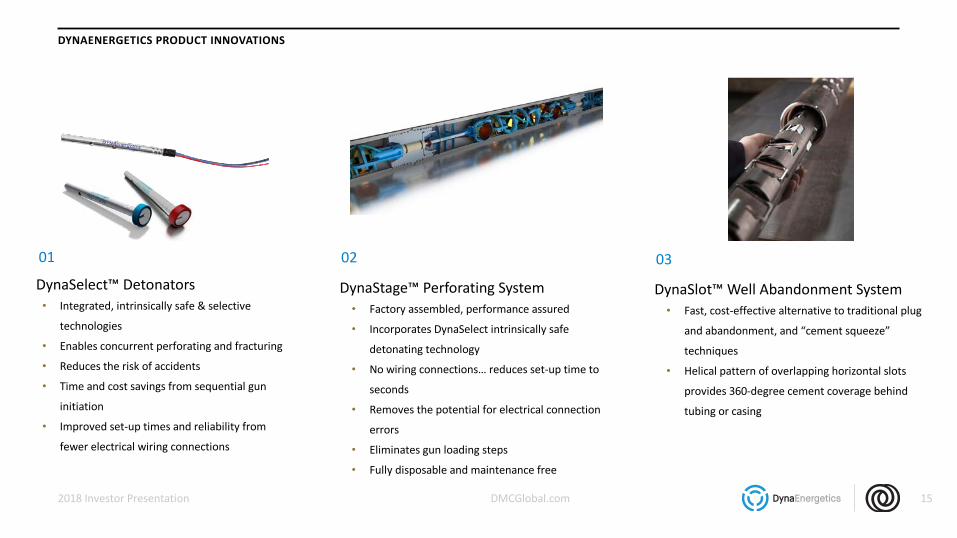
DynaStage™ Perforating System• Factory assembled, performance assured
• Incorporates DynaSelect intrinsically safe
detonating technology
• No wiring connections… reduces set-up time to
seconds
• Removes the potential for electrical connection
errors
• Eliminates gun loading steps
• Fully disposable and maintenance free
DynaSelect™ Detonators• Integrated, intrinsically safe & selective
technologies
• Enables concurrent perforating and fracturing
• Reduces the risk of accidents
• Time and cost savings from sequential gun
initiation
• Improved set-up times and reliability from
fewer electrical wiring connections
01 02
DYNAENERGETICS PRODUCT INNOVATIONS
2018 Investor Presentation
DynaSlot™ Well Abandonment System• Fast, cost-effective alternative to traditional plug
and abandonment, and “cement squeeze”
techniques
• Helical pattern of overlapping horizontal slots
provides 360-degree cement coverage behind
tubing or casing
03
DMCGlobal.com
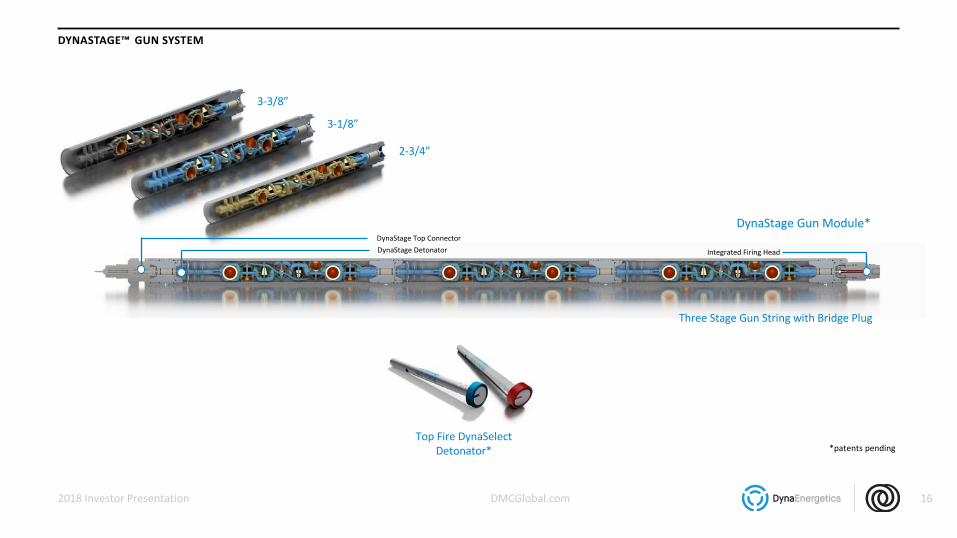
3-3/8”
3-1/8”
2-3/4”
DYNASTAGE™ GUN SYSTEM
2018 Investor Presentation 16
*patents pendingTop Fire DynaSelect
Detonator*
Three Stage Gun String with Bridge Plug
DynaStage Gun Module*
DynaStage Detonator Integrated Firing Head
DynaStage Top Connector
DMCGlobal.com
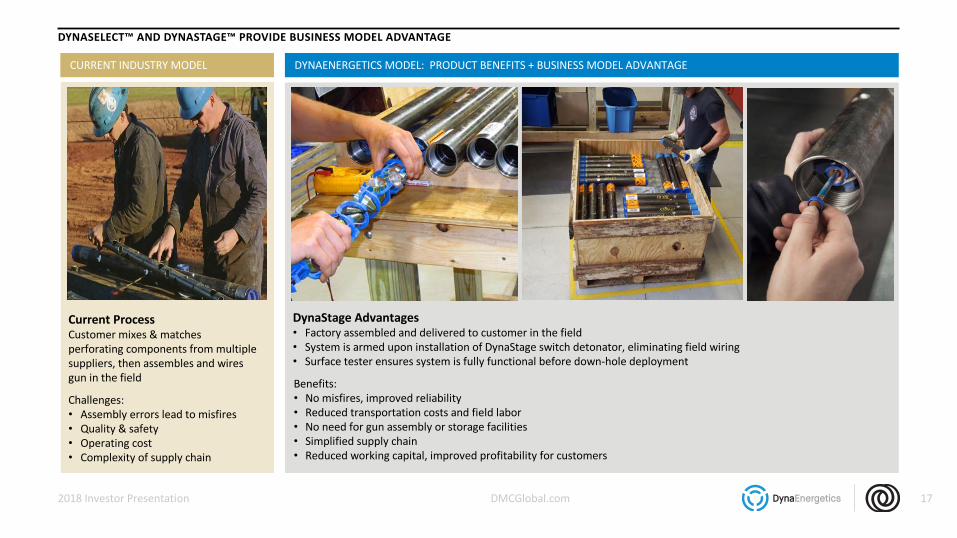
DYNASELECT™ AND DYNASTAGE™ PROVIDE BUSINESS MODEL ADVANTAGE
2018 Investor Presentation
CURRENT INDUSTRY MODEL DYNAENERGETICS MODEL: PRODUCT BENEFITS + BUSINESS MODEL ADVANTAGE
DynaStage Advantages• Factory assembled and delivered to customer in the field• System is armed upon installation of DynaStage switch detonator, eliminating field wiring • Surface tester ensures system is fully functional before down-hole deployment
Benefits:• No misfires, improved reliability • Reduced transportation costs and field labor • No need for gun assembly or storage facilities• Simplified supply chain• Reduced working capital, improved profitability for customers
Current ProcessCustomer mixes & matches perforating components from multiple suppliers, then assembles and wires gun in the field
Challenges:• Assembly errors lead to misfires• Quality & safety• Operating cost• Complexity of supply chain
17
DMCGlobal.com
DYNASTAGE CASE STUDY: PATRIOT WELL SOLUTIONS
2018 Investor Presentation 18
Advanced well design called for 15 perforating systems in each
“gun string,” 3-times the industry average
DynaStage reduced gun-string assembly time by more than
80% – from 1.25 hours to approximately 13 minutes – versus
conventional guns
DynaStage enabled a 40% increase in completed stages per day
Failures effectively eliminated – Patriot deployed 8,500
DynaStage systems without a mis-run
Gun-string length reduced by 17.5 feet, or 30%, versus
conventional guns. Weight cut by 400 lbs, or 40%. Completion
teams reduced from 15 to 11 members
Patriot’s supply chain simplified; vendors reduced from 3 to 1
DynaStage was adopted by
Patriot Well Solutions in April
2017 to address a complex 42-
well completion program in the
D-J Basin.
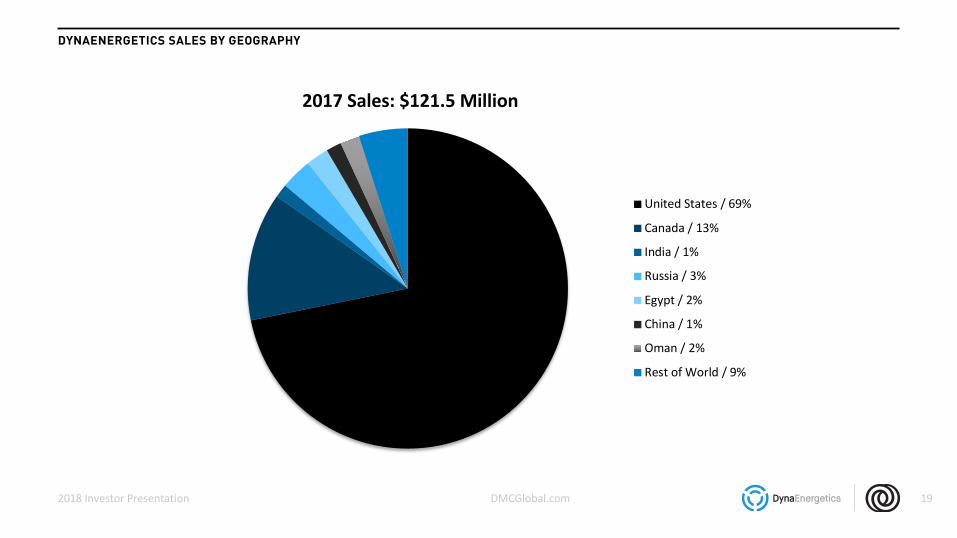
DMCGlobal.com 19
DYNAENERGETICS SALES BY GEOGRAPHY
2017 Sales: $121.5 Million
United States / 69%
Canada / 13%
India / 1%
Russia / 3%
Egypt / 2%
China / 1%
Oman / 2%
Rest of World / 9%
2018 Investor Presentation
DMCGlobal.com
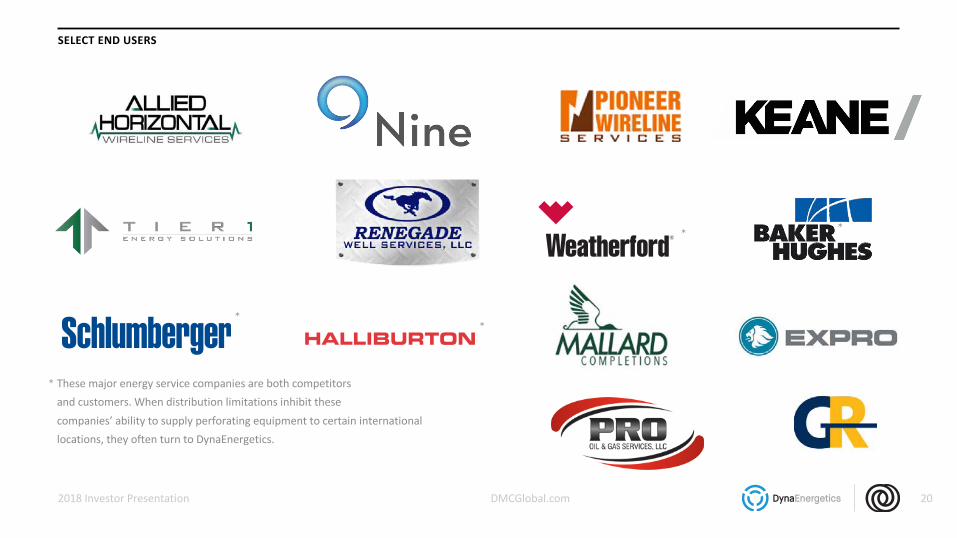
SELECT END USERS
20
These major energy service companies are both competitors and customers. When distribution limitations inhibit these companies’ ability to supply perforating equipment to certain international locations, they often turn to DynaEnergetics.
*
2018 Investor Presentation
**
* *
DMCGlobal.com
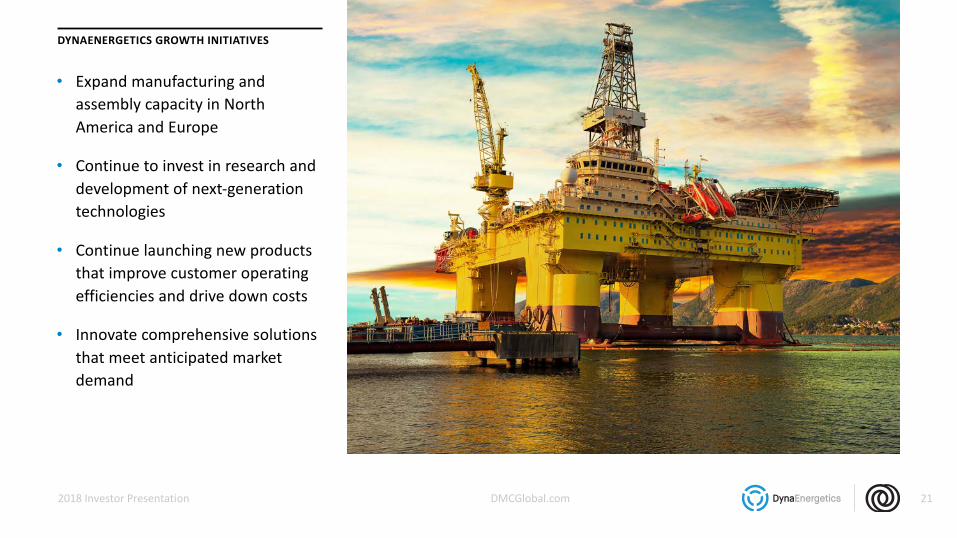
DYNAENERGETICS GROWTH INITIATIVES
2018 Investor Presentation 21
• Expand manufacturing and assembly capacity in North America and Europe
• Continue to invest in research and development of next-generation technologies
• Continue launching new products that improve customer operating efficiencies and drive down costs
• Innovate comprehensive solutions that meet anticipated market demand
DMCGlobal.com2018 Investor Presentation 22
DMCGlobal.com
NOBELCLAD OVERVIEW
23
NobelClad is the worldwide leader in explosion welded plate production.
Largest global supplier of explosion clad plates
Serving a diversified roster of industrial and infrastructure end markets. Working to drive engineering specifications for clad
Profiting from global industrial infrastructure investments
Strong free cash flow
2018 Investor Presentation
DMCGlobal.com
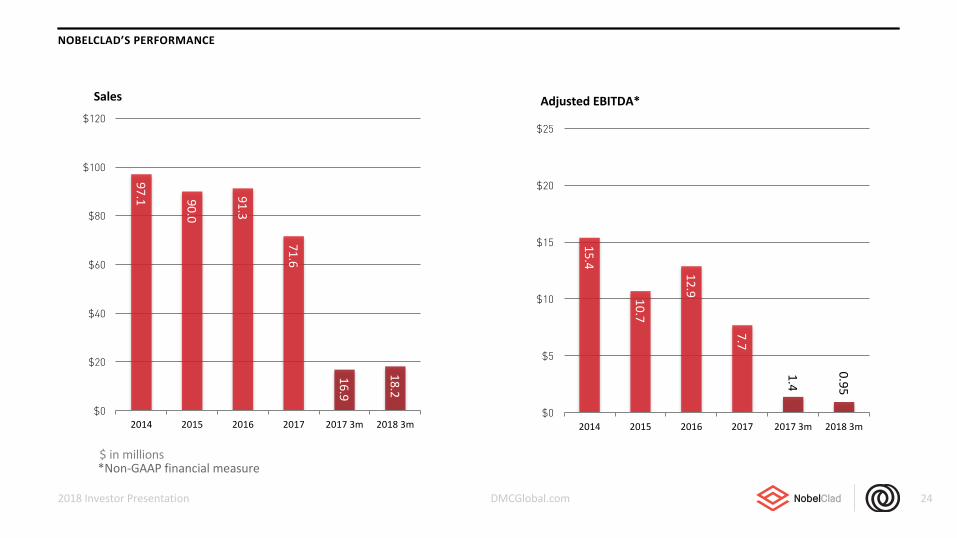
97.1 90.0
91.3
71.6
16.9
18.2
$0
$20
$40
$60
$80
$100
$120
2014 2015 2016 2017 2017 3m 2018 3m
Sales
NOBELCLAD’S PERFORMANCE
2018 Investor Presentation 24
$ in millions
15.4
10.7
12.9
7.7
1.4
0.95
$0
$5
$10
$15
$20
$25
2014 2015 2016 2017 2017 3m 2018 3m
Adjusted EBITDA*
*Non-GAAP financial measure
DMCGlobal.com
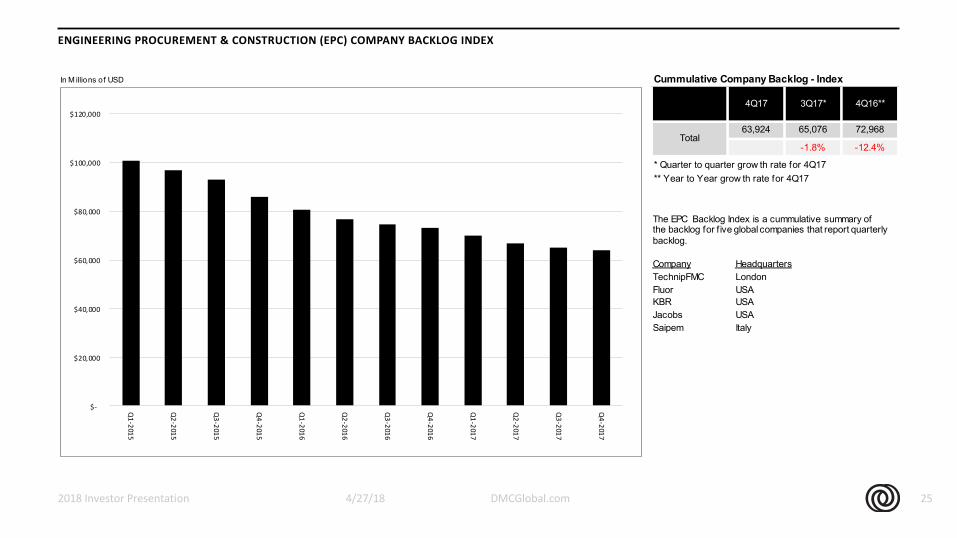
ENGINEERING PROCUREMENT & CONSTRUCTION (EPC) COMPANY BACKLOG INDEX
4/27/182018 Investor Presentation 25
In M illions of USD Cummulative Company Backlog - Index
63,924 65,076 72,968
-1.8% -12.4%
* Quarter to quarter grow th rate for 4Q17** Year to Year grow th rate for 4Q17
4Q17 3Q17* 4Q16**
Total
$-
$20,000
$40,000
$60,000
$80,000
$100,000
$120,000
Q1-2015
Q2-2015
Q3-2015
Q4-2015
Q1-2016
Q2-2016
Q3-2016
Q4-2016
Q1-2017
Q2-2017
Q3-2017
Q4-2017
The EPC Backlog Index is a cummulative summary of the backlog for f ive global companies that report quarterly backlog.
Company HeadquartersTechnipFMC LondonFluor USAKBR USAJacobs USASaipem Italy
DMCGlobal.com
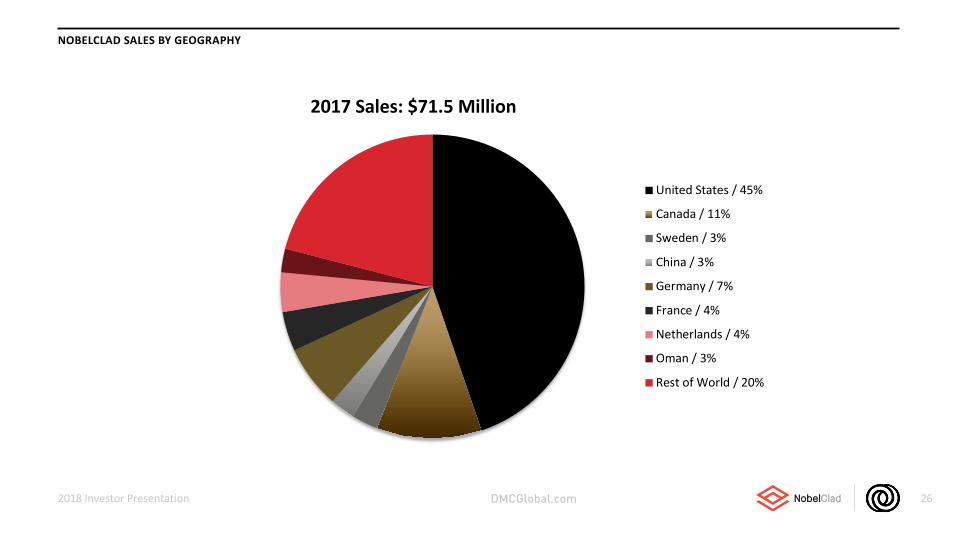
2017 Sales: $71.5 Million
United States / 45%
Canada / 11%
Sweden / 3%
China / 3%
Germany / 7%
France / 4%
Netherlands / 4%
Oman / 3%
Rest of World / 20%
2018 Investor Presentation 26
NOBELCLAD SALES BY GEOGRAPHY
DMCGlobal.com
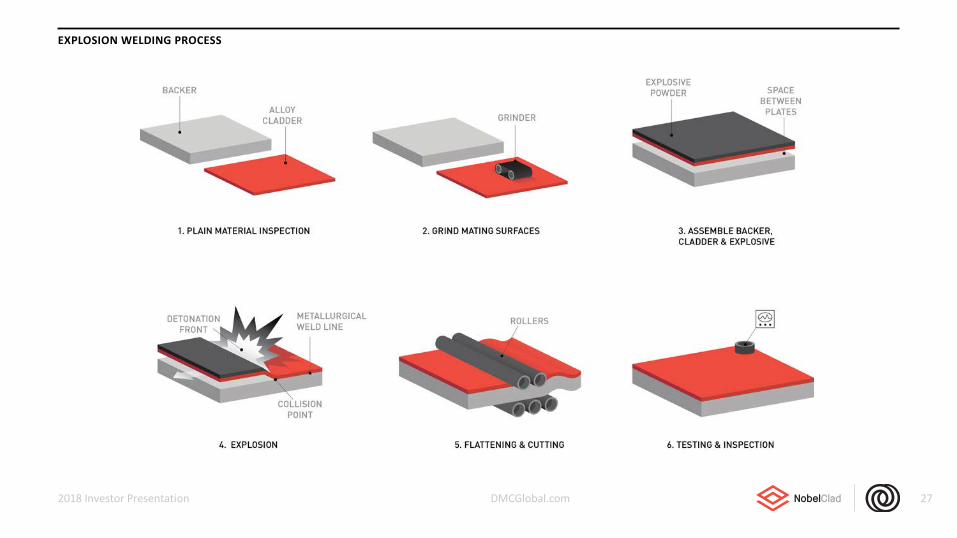
EXPLOSION WELDING PROCESS
272018 Investor Presentation
DMCGlobal.com
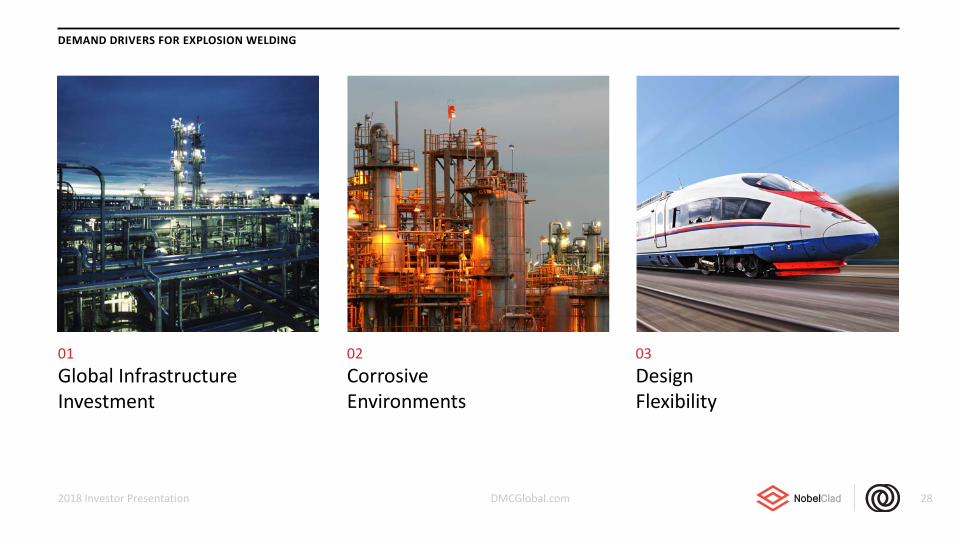
DEMAND DRIVERS FOR EXPLOSION WELDING
28
03Design Flexibility
02Corrosive Environments
01Global Infrastructure Investment
2018 Investor Presentation
DMCGlobal.com
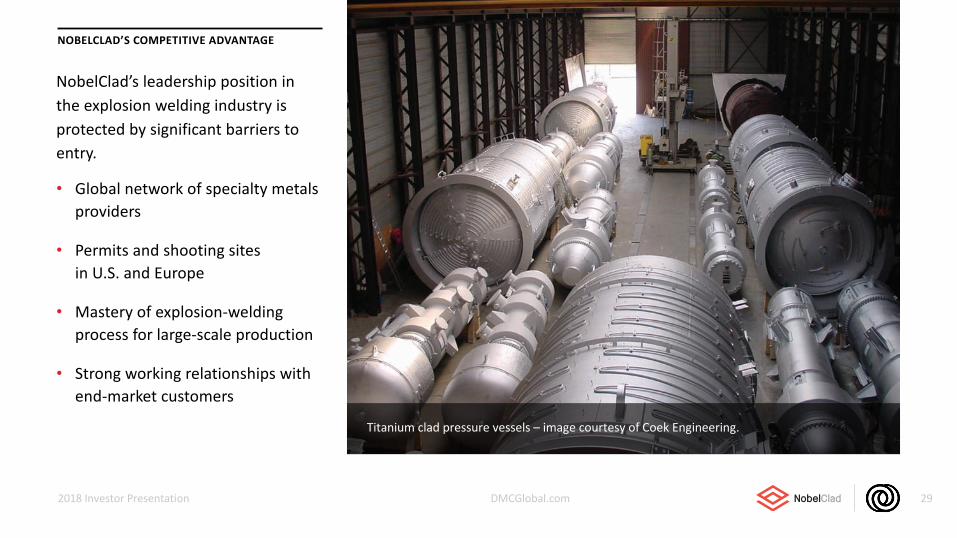
NOBELCLAD’S COMPETITIVE ADVANTAGE
2018 Investor Presentation 29
• Global network of specialty metals
providers
• Permits and shooting sites
in U.S. and Europe
• Mastery of explosion-welding
process for large-scale production
• Strong working relationships with
end-market customers
NobelClad’s leadership position in
the explosion welding industry is
protected by significant barriers to
entry.
Titanium clad pressure vessels – image courtesy of Coek Engineering.
DMCGlobal.com
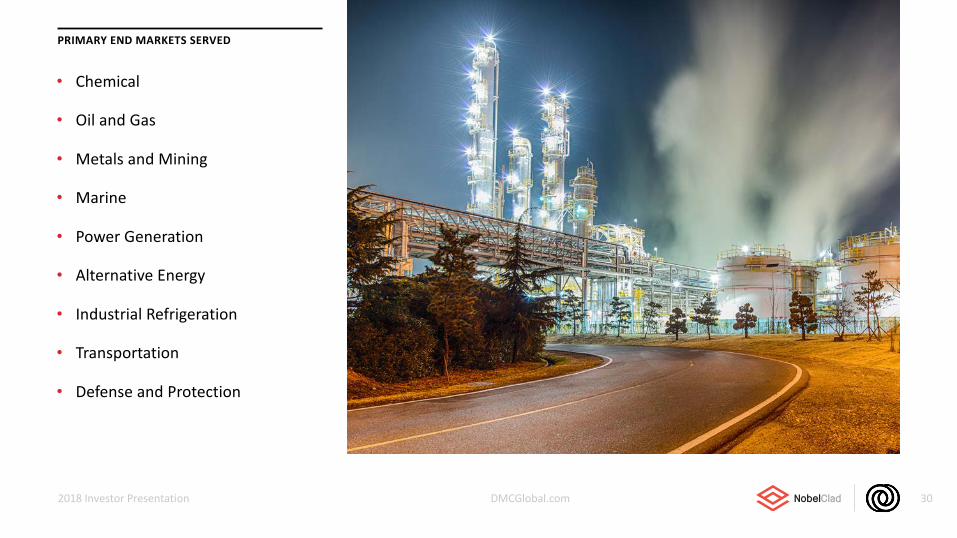
PRIMARY END MARKETS SERVED
2018 Investor Presentation 30
• Chemical
• Oil and Gas
• Metals and Mining
• Marine
• Power Generation
• Alternative Energy
• Industrial Refrigeration
• Transportation
• Defense and Protection
DMCGlobal.com
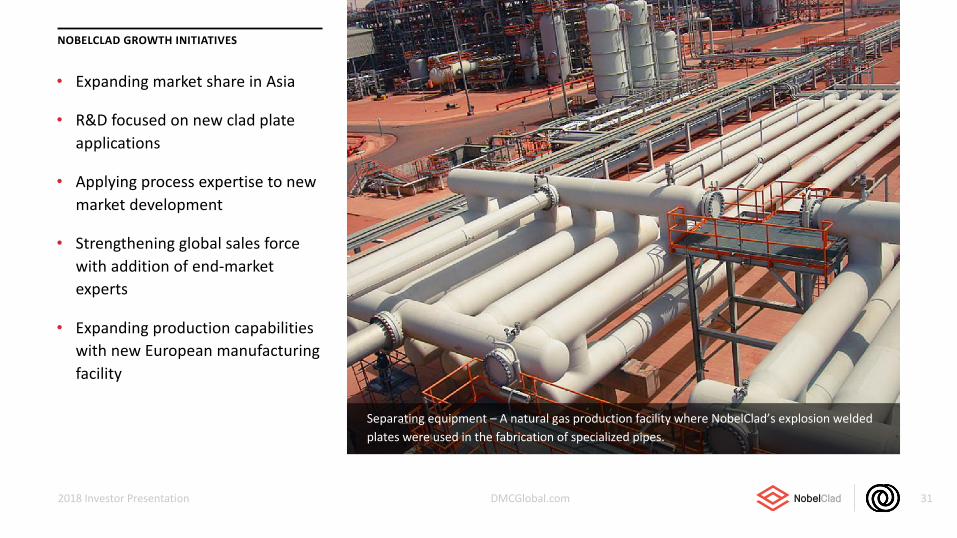
NOBELCLAD GROWTH INITIATIVES
2018 Investor Presentation 31
• Expanding market share in Asia
• R&D focused on new clad plate
applications
• Applying process expertise to new
market development
• Strengthening global sales force
with addition of end-market
experts
• Expanding production capabilities
with new European manufacturing
facility
Separating equipment – A natural gas production facility where NobelClad’s explosion welded
plates were used in the fabrication of specialized pipes.
DMCGlobal.com
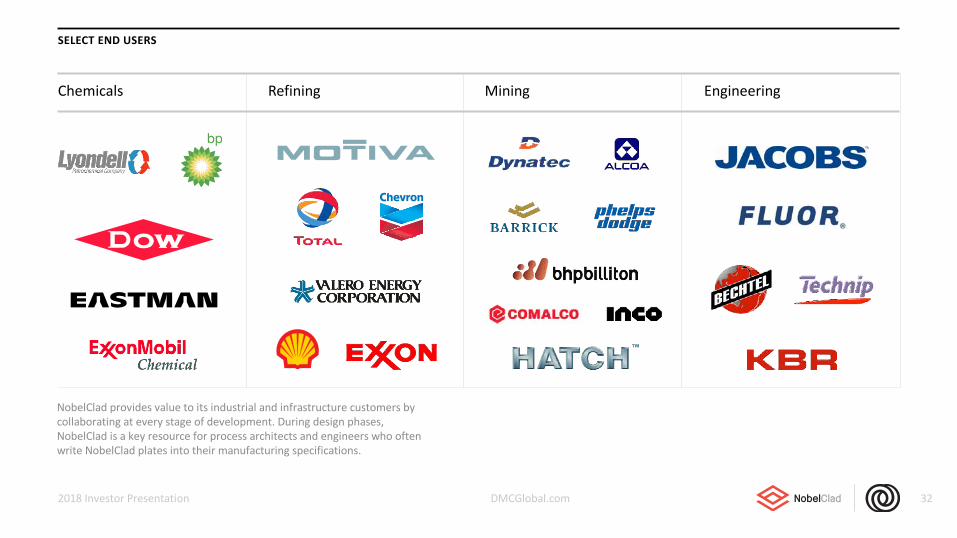
SELECT END USERS
32
Chemicals Refining Mining Engineering
2018 Investor Presentation
NobelClad provides value to its industrial and infrastructure customers by collaborating at every stage of development. During design phases, NobelClad is a key resource for process architects and engineers who often write NobelClad plates into their manufacturing specifications.
DMCGlobal.com
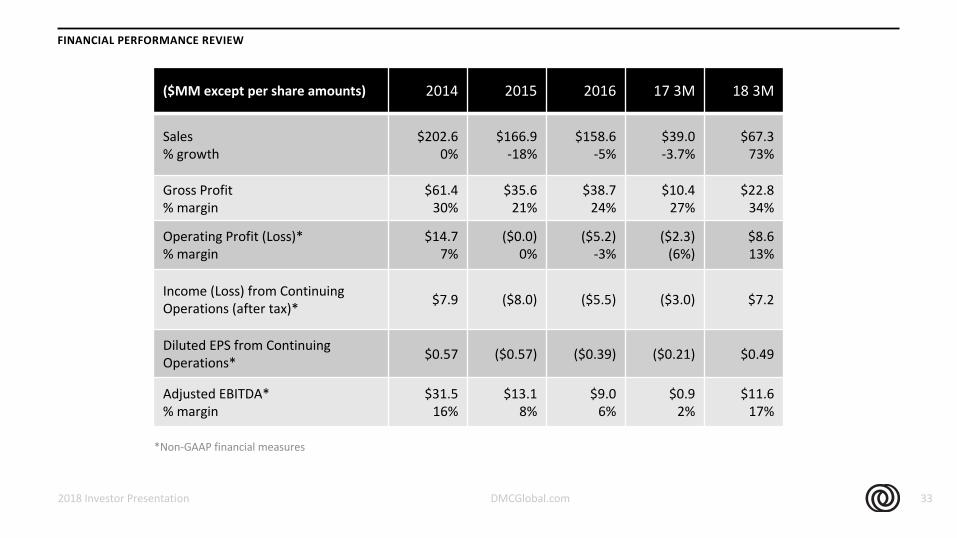
FINANCIAL PERFORMANCE REVIEW
2018 Investor Presentation 33
($MM except per share amounts) 2014 2015 2016 17 3M 18 3M
Sales % growth
$202.60%
$166.9-18%
$158.6-5%
$39.0-3.7%
$67.373%
Gross Profit% margin
$61.430%
$35.621%
$38.724%
$10.427%
$22.834%
Operating Profit (Loss)*% margin
$14.77%
($0.0)0%
($5.2)-3%
($2.3)(6%)
$8.613%
Income (Loss) from Continuing Operations (after tax)*
$7.9 ($8.0) ($5.5) ($3.0) $7.2
Diluted EPS from Continuing Operations*
$0.57 ($0.57) ($0.39) ($0.21) $0.49
Adjusted EBITDA*% margin
$31.516%
$13.18%
$9.06%
$0.92%
$11.617%
*Non-GAAP financial measures
DMCGlobal.com
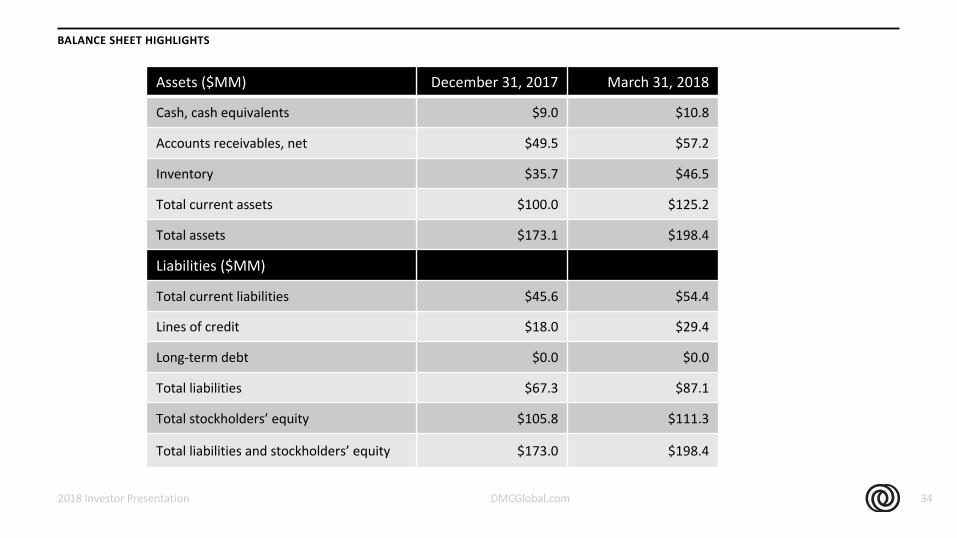
BALANCE SHEET HIGHLIGHTS
2018 Investor Presentation 34
Assets ($MM) December 31, 2017 March 31, 2018
Cash, cash equivalents $9.0 $10.8
Accounts receivables, net $49.5 $57.2
Inventory $35.7 $46.5
Total current assets $100.0 $125.2
Total assets $173.1 $198.4
Liabilities ($MM)
Total current liabilities $45.6 $54.4
Lines of credit $18.0 $29.4
Long-term debt $0.0 $0.0
Total liabilities $67.3 $87.1
Total stockholders’ equity $105.8 $111.3
Total liabilities and stockholders’ equity $173.0 $198.4

DMCGlobal.com
DMC’S PERFORMANCE TENETS
2018 Investor Presentation 35
Through share ownership, DMC
management has closely
aligned its interest with
independent shareholders, and
all management decisions are
made to maximize shareholder
value.
DMC has adopted three tenets to guide superior share price performance:
1. Maximize free cash flow through financial discipline
2. Maximize return on invested capital by achieving operational excellence and making discerning investment decisions
3. Invest in new technology, product and market development to drive sustained growth and increased profitability
DMCGlobal.com
CONTACT INFORMATION
2018 Investor Presentation 36
DMC
5405 Spine Road
Boulder, Colorado 80301, USA
T 800-821-2666
Geoff High
Vice President of Investor Relations
T 303-514-0656
Contact Primary Contact
DMCGlobal.com
APPENDIX: USE OF NON-GAAP FINANCIAL MEASURES
4/27/18Presentation Title 37
APPENDIX: USE OF NON-GAAP FINANCIAL MEASURES
DMCGlobal.com 372018 Investor Presentation
Adjusted EBITDA and diluted EPS are non-GAAP (generally accepted accounting principles) financial measures used by management to measure operating performance. Non-GAAP results are presented only as a supplement to the financial statements based on U.S. generally accepted accounting principles (GAAP). The non-GAAP financial information is provided to enhance the reader's understanding of DMC’s financial performance, but no non-GAAP measure should be considered in isolation or as a substitute for financial measures calculated in accordance with GAAP. Reconciliations of the most directly comparable GAAP measures to non-GAAP measures are provided within the schedules attached to this release.
EBITDA is defined as net income plus or minus net interest plus taxes, depreciation and amortization. Adjusted EBITDA excludes from EBITDA stock-based compensation, restructuring and impairment charges and, when appropriate, other items that management does not utilize in assessing DMC’s operating performance (as further described in the attached financial schedules). None of these non-GAAP financial measures are recognized terms under GAAP and do not purport to be an alternative to net income as an indicator of operating performance or any other GAAP measure.
Management uses these non-GAAP measures in its operational and financial decision-making, believing that it is useful to eliminate certain items in order to focus on what it deems to be a more reliable indicator of ongoing operating performance.
As a result, internal management reports used during monthly operating reviews feature the adjusted EBITDA.In addition, certain management incentive awards were based, in part, on the amount of adjusted EBITDA achieved during the year. Management also believes that investors may find non-GAAP financial measures useful for the same reasons, although investors are cautioned that non-GAAP financial measures are not a substitute for GAAP disclosures. EBITDA and adjusted EBITDA are also used by research analysts, investment bankers and lenders to assess operating performance. For example, a measure similar to EBITDA is required by the lenders under DMC’s credit facility.
Because not all companies use identical calculations, DMC’s presentation of non-GAAP financial measures may not be comparable to other similarly titled measures of other companies. However, these measures can still be useful in evaluating the company’s performance against its peer companies because management believes the measures provide users with valuable insight into key components of GAAP financial disclosures. For example, a company with greater GAAP net income may not be as appealing to investors if its net income is more heavily comprised of gains on asset sales. Likewise, eliminating the effects of interest income and expense moderates the impact of a company's capital structure on its performance.
All of the items included in the reconciliation from net income to EBITDA and adjusted EBITDA are either (i) non-cash items (e.g., depreciation, amortization of purchased intangibles and stock-based compensation)
or (ii) items that management does not consider to be useful in assessing DMC’s operating performance (e.g., income taxes, restructuring and impairment charges and gain on sale of assets). In the case of the non-cash items, management believes that investors can better assess the company’s operating performance if the measures are presented without such items because, unlike cash expenses, these adjustments do not affect DMC's ability to generate free cash flow or invest in its business. For example, by adjusting for depreciation and amortization in computing EBITDA, users can compare operating performance without regard to different accounting determinations such as useful life. In the case of the other items, management believes that investors can better assess operating performance if the measures are presented without these items because their financial impact does not reflect ongoing operating performance.
We have also presented certain financial measures excluding certain one-time, non-recurring “special items,” including our accrued anti-dumping duties, inventory reserve adjustment, the non-cash goodwill impairment charge and restructuring charges. These are non-GAAP financial measures when the special items are excluded. We believe these are important supplemental measures because they eliminate one-time, non-recurring items that have less bearing on our operating performance and so highlight trends in our business that may not otherwise be apparent when relying solely on GAAP financial measures. We have quantified those special items earlier in this release, or immediately following, the financial measures that excluded the special items, to allow readers to measure their impact.
DMCGlobal.com
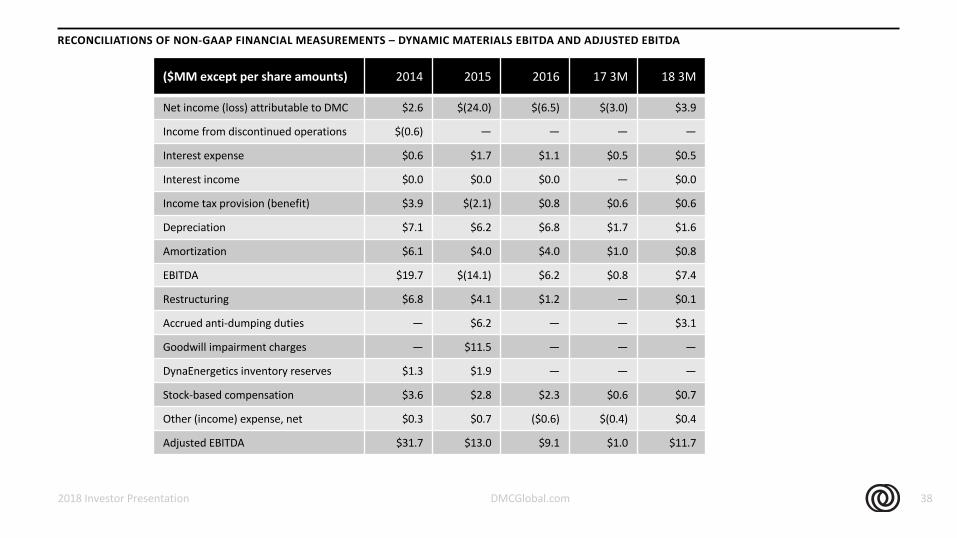
RECONCILIATIONS OF NON-GAAP FINANCIAL MEASUREMENTS – DYNAMIC MATERIALS EBITDA AND ADJUSTED EBITDA
2018 Investor Presentation 38
($MM except per share amounts) 2014 2015 2016 17 3M 18 3M
Net income (loss) attributable to DMC $2.6 $(24.0) $(6.5) $(3.0) $3.9
Income from discontinued operations $(0.6) — — — —
Interest expense $0.6 $1.7 $1.1 $0.5 $0.5
Interest income $0.0 $0.0 $0.0 — $0.0
Income tax provision (benefit) $3.9 $(2.1) $0.8 $0.6 $0.6
Depreciation $7.1 $6.2 $6.8 $1.7 $1.6
Amortization $6.1 $4.0 $4.0 $1.0 $0.8
EBITDA $19.7 $(14.1) $6.2 $0.8 $7.4
Restructuring $6.8 $4.1 $1.2 — $0.1
Accrued anti-dumping duties — $6.2 — — $3.1
Goodwill impairment charges — $11.5 — — —
DynaEnergetics inventory reserves $1.3 $1.9 — — —
Stock-based compensation $3.6 $2.8 $2.3 $0.6 $0.7
Other (income) expense, net $0.3 $0.7 ($0.6) $(0.4) $0.4
Adjusted EBITDA $31.7 $13.0 $9.1 $1.0 $11.7
DMCGlobal.com
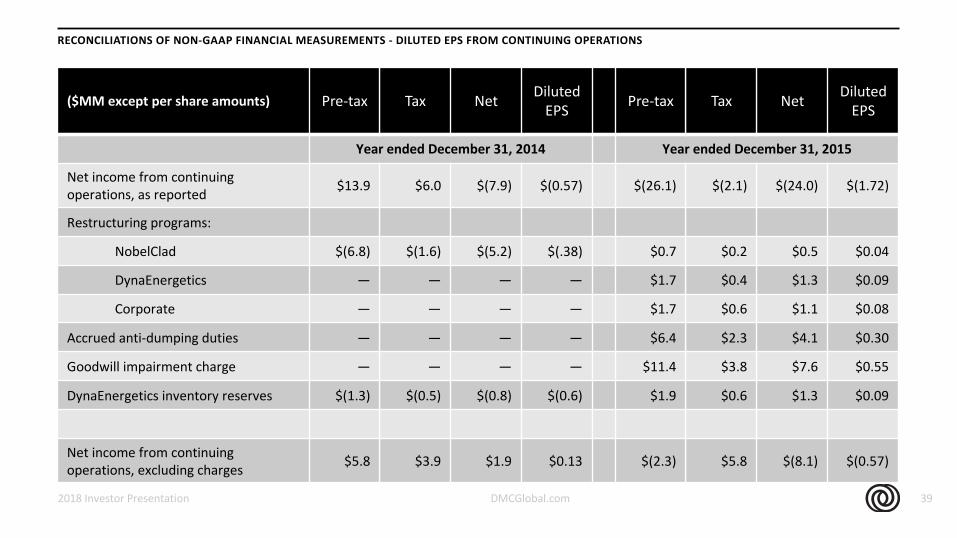
RECONCILIATIONS OF NON-GAAP FINANCIAL MEASUREMENTS - DILUTED EPS FROM CONTINUING OPERATIONS
2018 Investor Presentation 39
($MM except per share amounts) Pre-tax Tax Net DilutedEPS Pre-tax Tax Net Diluted
EPS
Year ended December 31, 2014 Year ended December 31, 2015
Net income from continuingoperations, as reported $13.9 $6.0 $(7.9) $(0.57) $(26.1) $(2.1) $(24.0) $(1.72)
Restructuring programs:
NobelClad $(6.8) $(1.6) $(5.2) $(.38) $0.7 $0.2 $0.5 $0.04
DynaEnergetics — — — — $1.7 $0.4 $1.3 $0.09
Corporate — — — — $1.7 $0.6 $1.1 $0.08
Accrued anti-dumping duties — — — — $6.4 $2.3 $4.1 $0.30
Goodwill impairment charge — — — — $11.4 $3.8 $7.6 $0.55
DynaEnergetics inventory reserves $(1.3) $(0.5) $(0.8) $(0.6) $1.9 $0.6 $1.3 $0.09
Net income from continuing operations, excluding charges $5.8 $3.9 $1.9 $0.13 $(2.3) $5.8 $(8.1) $(0.57)
DMCGlobal.com
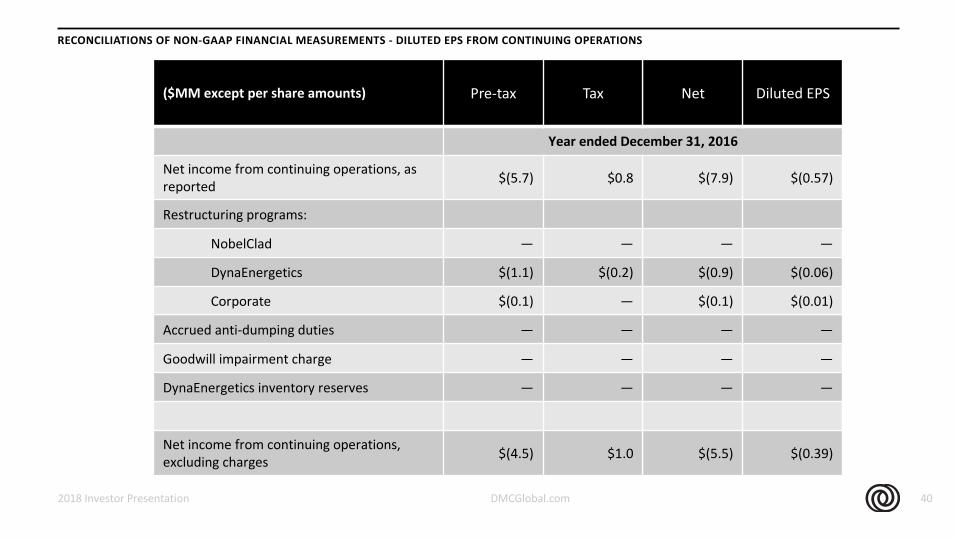
RECONCILIATIONS OF NON-GAAP FINANCIAL MEASUREMENTS - DILUTED EPS FROM CONTINUING OPERATIONS
2018 Investor Presentation 40
($MM except per share amounts) Pre-tax Tax Net Diluted EPS
Year ended December 31, 2016
Net income from continuing operations, as reported
$(5.7) $0.8 $(7.9) $(0.57)
Restructuring programs:
NobelClad — — — —
DynaEnergetics $(1.1) $(0.2) $(0.9) $(0.06)
Corporate $(0.1) — $(0.1) $(0.01)
Accrued anti-dumping duties — — — —
Goodwill impairment charge — — — —
DynaEnergetics inventory reserves — — — —
Net income from continuing operations, excluding charges
$(4.5) $1.0 $(5.5) $(0.39)
DMCGlobal.com
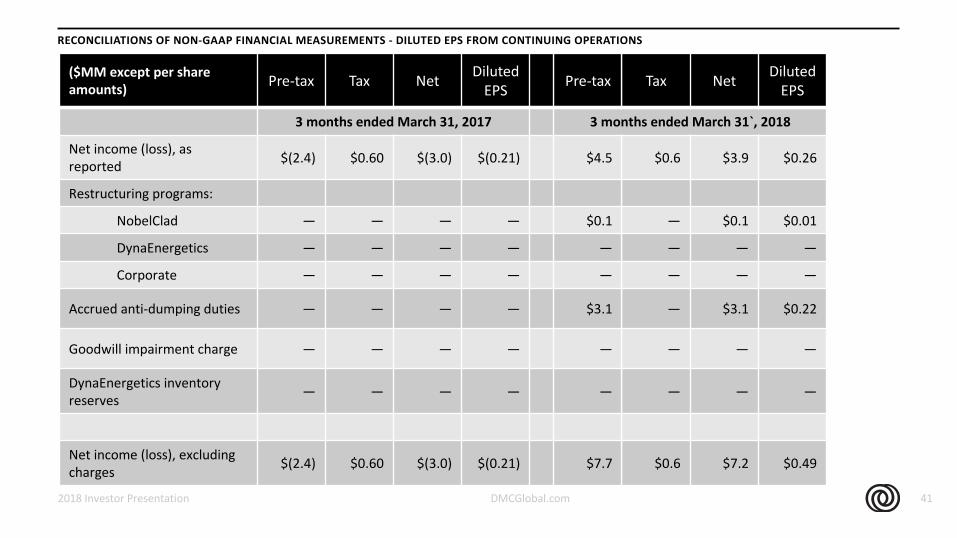
RECONCILIATIONS OF NON-GAAP FINANCIAL MEASUREMENTS - DILUTED EPS FROM CONTINUING OPERATIONS
2018 Investor Presentation 41
($MM except per share amounts) Pre-tax Tax Net
Diluted
EPSPre-tax Tax Net
Diluted
EPS
3 months ended March 31, 2017 3 months ended March 31`, 2018
Net income (loss), as
reported$(2.4) $0.60 $(3.0) $(0.21) $4.5 $0.6 $3.9 $0.26
Restructuring programs:
NobelClad — — — — $0.1 — $0.1 $0.01
DynaEnergetics — — — — — — — —
Corporate — — — — — — — —
Accrued anti-dumping duties — — — — $3.1 — $3.1 $0.22
Goodwill impairment charge — — — — — — — —
DynaEnergetics inventory
reserves— — — — — — — —
Net income (loss), excluding
charges$(2.4) $0.60 $(3.0) $(0.21) $7.7 $0.6 $7.2 $0.49
DMCGlobal.com
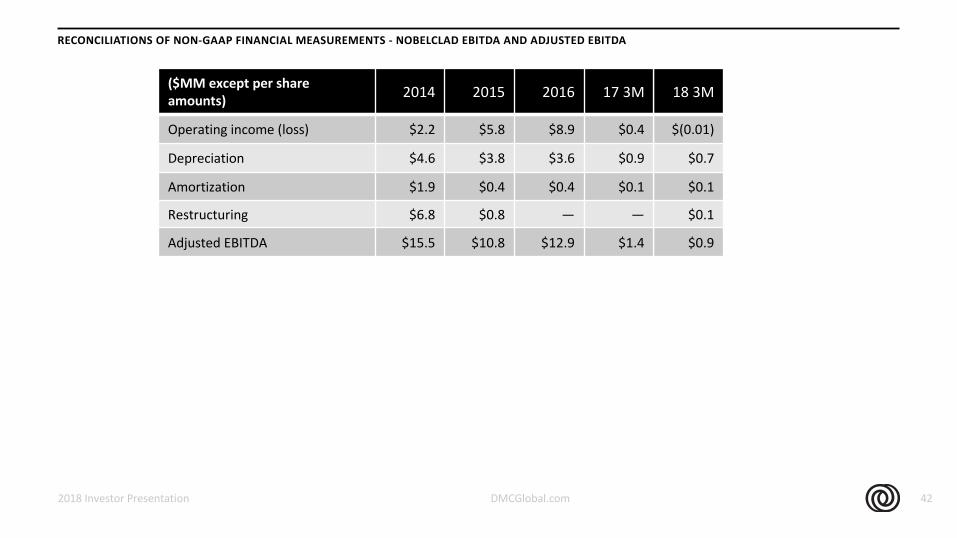
RECONCILIATIONS OF NON-GAAP FINANCIAL MEASUREMENTS - NOBELCLAD EBITDA AND ADJUSTED EBITDA
2018 Investor Presentation 42
($MM except per share amounts) 2014 2015 2016 17 3M 18 3M
Operating income (loss) $2.2 $5.8 $8.9 $0.4 $(0.01)
Depreciation $4.6 $3.8 $3.6 $0.9 $0.7
Amortization $1.9 $0.4 $0.4 $0.1 $0.1
Restructuring $6.8 $0.8 — — $0.1
Adjusted EBITDA $15.5 $10.8 $12.9 $1.4 $0.9
DMCGlobal.com
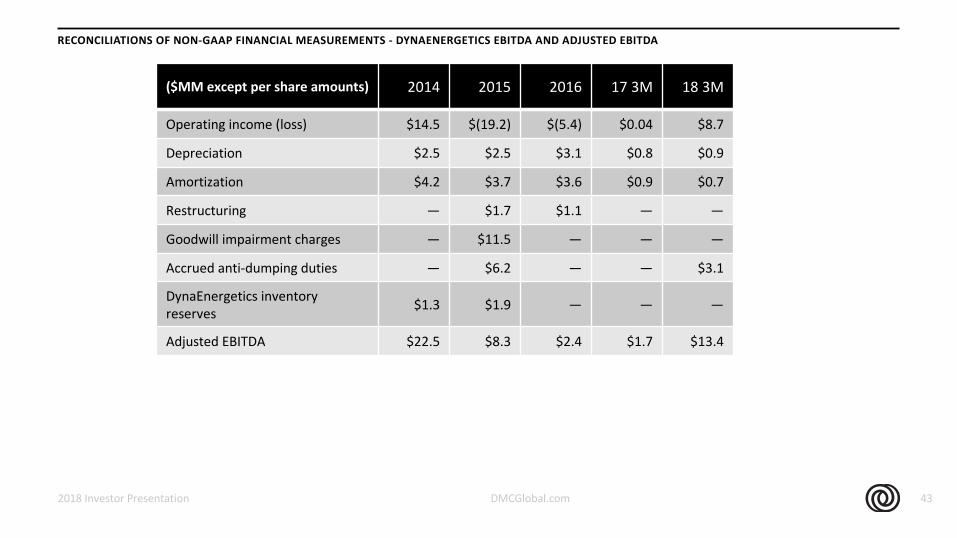
RECONCILIATIONS OF NON-GAAP FINANCIAL MEASUREMENTS - DYNAENERGETICS EBITDA AND ADJUSTED EBITDA
2018 Investor Presentation 43
($MM except per share amounts) 2014 2015 2016 17 3M 18 3M
Operating income (loss) $14.5 $(19.2) $(5.4) $0.04 $8.7
Depreciation $2.5 $2.5 $3.1 $0.8 $0.9
Amortization $4.2 $3.7 $3.6 $0.9 $0.7
Restructuring — $1.7 $1.1 — —
Goodwill impairment charges — $11.5 — — —
Accrued anti-dumping duties — $6.2 — — $3.1
DynaEnergetics inventory reserves
$1.3 $1.9 — — —
Adjusted EBITDA $22.5 $8.3 $2.4 $1.7 $13.4