Embed Size (px)
Citation preview

INVESTOR PRESENTATION
IMPORTANT DISCLOSURE
• This presentation contains estimates and forward-looking statements made pursuant to the safe harbour provisions of the Private Securities Litigation Reform Act of 1995. Forward-looking statements are based on our current expectations and estimates with respect to current and future events and trends which affect or may affect our business operations. All statements that address future operating, financial or business performance or our strategies or expectations are forward-looking statements. In some cases, you can identify these statements by forward-looking words such as “may,” “might,” “will,” “could,” “would,” “should,” “expect,” “plan,” “anticipate,” “intend,” “seek,” “believe,” “estimate,” “predict,” “potential,” “continue,” “contemplate,” “possible” and other comparable terminology. These statements are subject to many risks, uncertainties and factors relating to our operations and business environment, which may cause our actual results to be materially different from any future results, express or implied, by such statements. Among these factors are (1) our ability to maintain and enhance our brand and reputation; (2) our ability to attract and retain key personnel, including players; (3) the performance and popularity of our first team; (4) our ability to properly manage our growth; (5) our ability to maintain, train and build an effective international sales and marketing infrastructure; (6) the negotiation and pricing of key media contracts; (7) our ability to maintain strong relationship with certain third parties; (8) our ability to deal with competition in Europe and internationally; (9) our ability to adequately protect our intellectual property; and (10) the effectiveness of our digital media strategy. Additional information concerning these and other factors can be found in Manchester United plc’s filings with the United States Securities and Exchange Commission.
• New risks and uncertainties arise from time to time, and it is impossible for us to predict these events or how they may affect us. It should be remembered that the price of the Class A ordinary shares and any income from them can go down as well as up. We disclaim any intention or obligation to update or revise any forward-looking statements, whether as a result of new information, future events and/or otherwise, except to the extent required by law.
• This presentation contains a discussion of EBITDA and Adjusted EBITDA, which are non-IFRS measures and are not uniformly or legally defined financial measures. EBITDA is defined as profit/(loss) for the period from continuing operations before net finance costs, tax credit/(expense), depreciation, and amortization of players’ registrations, and Adjusted EBITDA is defined as EBITDA adjusted for profit on disposal of players’ registrations and operating expenses—exceptional items. Adjusted EBITDA is included in this presentation because it is a measure of our operating performance and our management believes that Adjusted EBITDA is useful to investors because it is frequently used by securities analysts, investors and other interested parties in their evaluation of the operating performance of companies in industries similar to ours. We have provided reconciliations of EBITDA and Adjusted EBITDA to the most directly comparable IFRS measures in the Appendix to this presentation. EBITDA and Adjusted EBITDA should not be considered substitutes for comparable measures prepared in accordance with IFRS. EBITDA and Adjusted EBITDA, as determined and measured by us, should also not be compared to similarly titled measures reported by other companies.
2
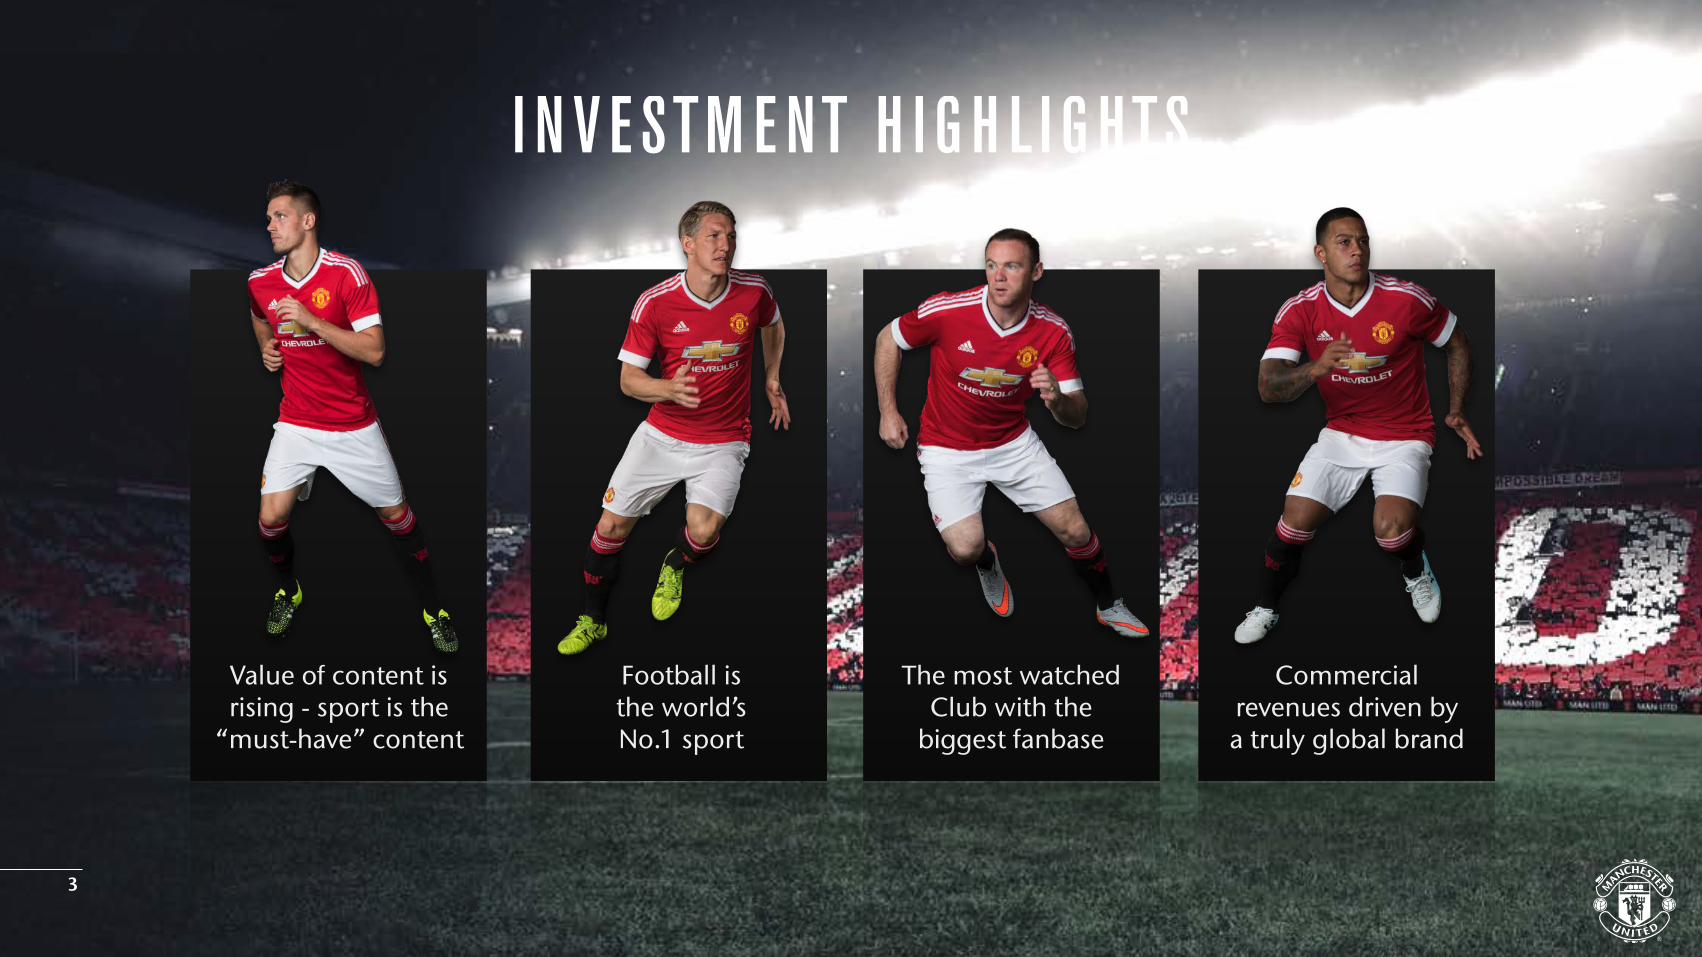
Value of content is rising - sport is the
“must-have” content
The most watched Club with the
biggest fanbase
Commercial revenues driven by a truly global brand
I N V E STM E NT H I G H L I G HTS
Football is the world’s No.1 sport
3
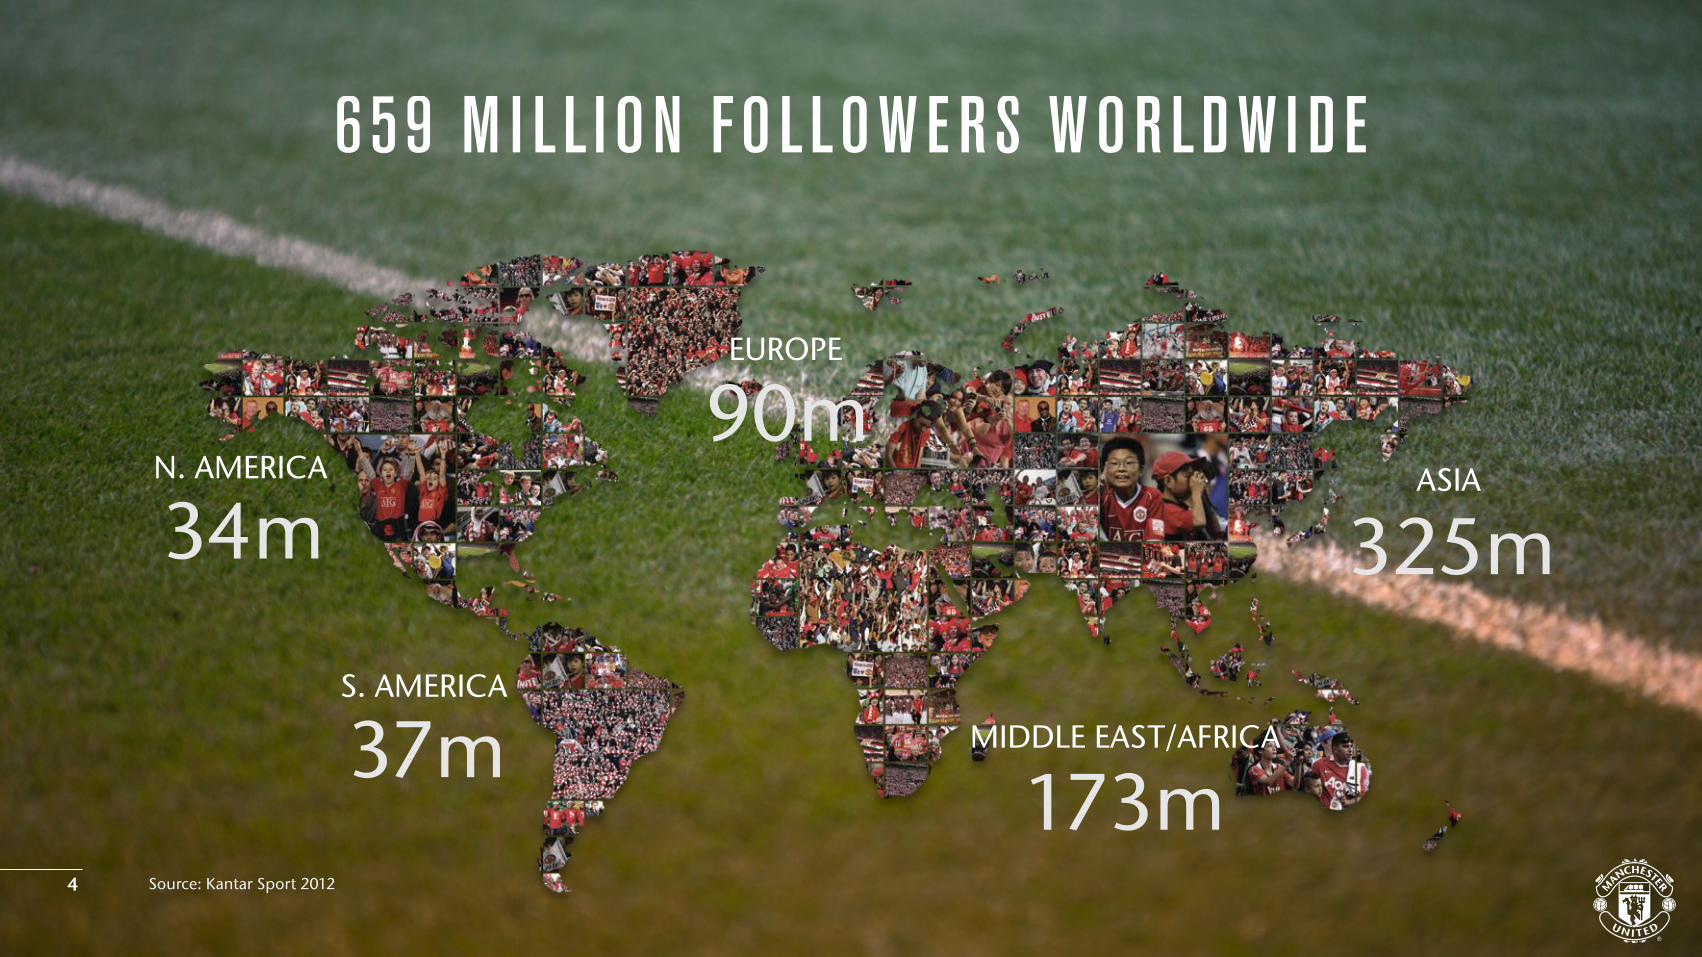
659 M I L L I ON FO L LO W E RS W OR LD W I D E
N. AMERICA
34m
S. AMERICA
37m
90mEUROPE
325mASIA
173mMIDDLE EAST/AFRICA
Source: Kantar Sport 20124
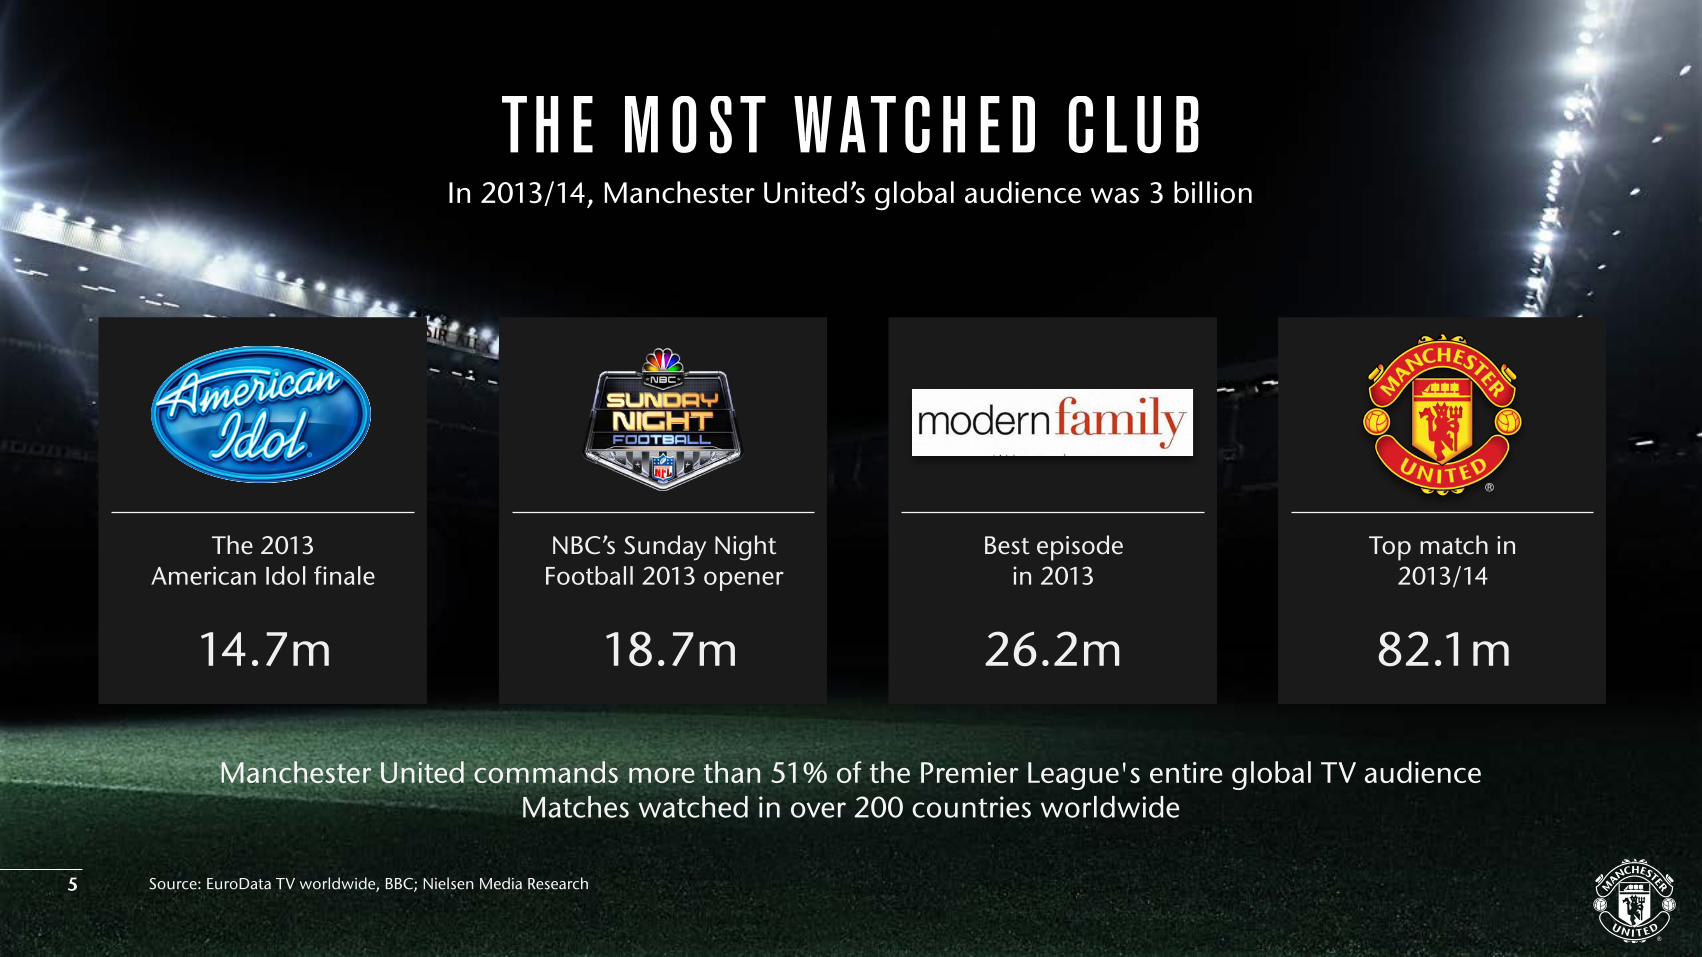
TH E MOST WATCH E D C LU B
Source: EuroData TV worldwide, BBC; Nielsen Media Research
Manchester United commands more than 51% of the Premier League's entire global TV audience Matches watched in over 200 countries worldwide
The 2013 American Idol finale
NBC’s Sunday Night Football 2013 opener
Best episode in 2013
Top match in 2013/14
In 2013/14, Manchester United’s global audience was 3 billion
14.7m 18.7m 26.2m 82.1m
5
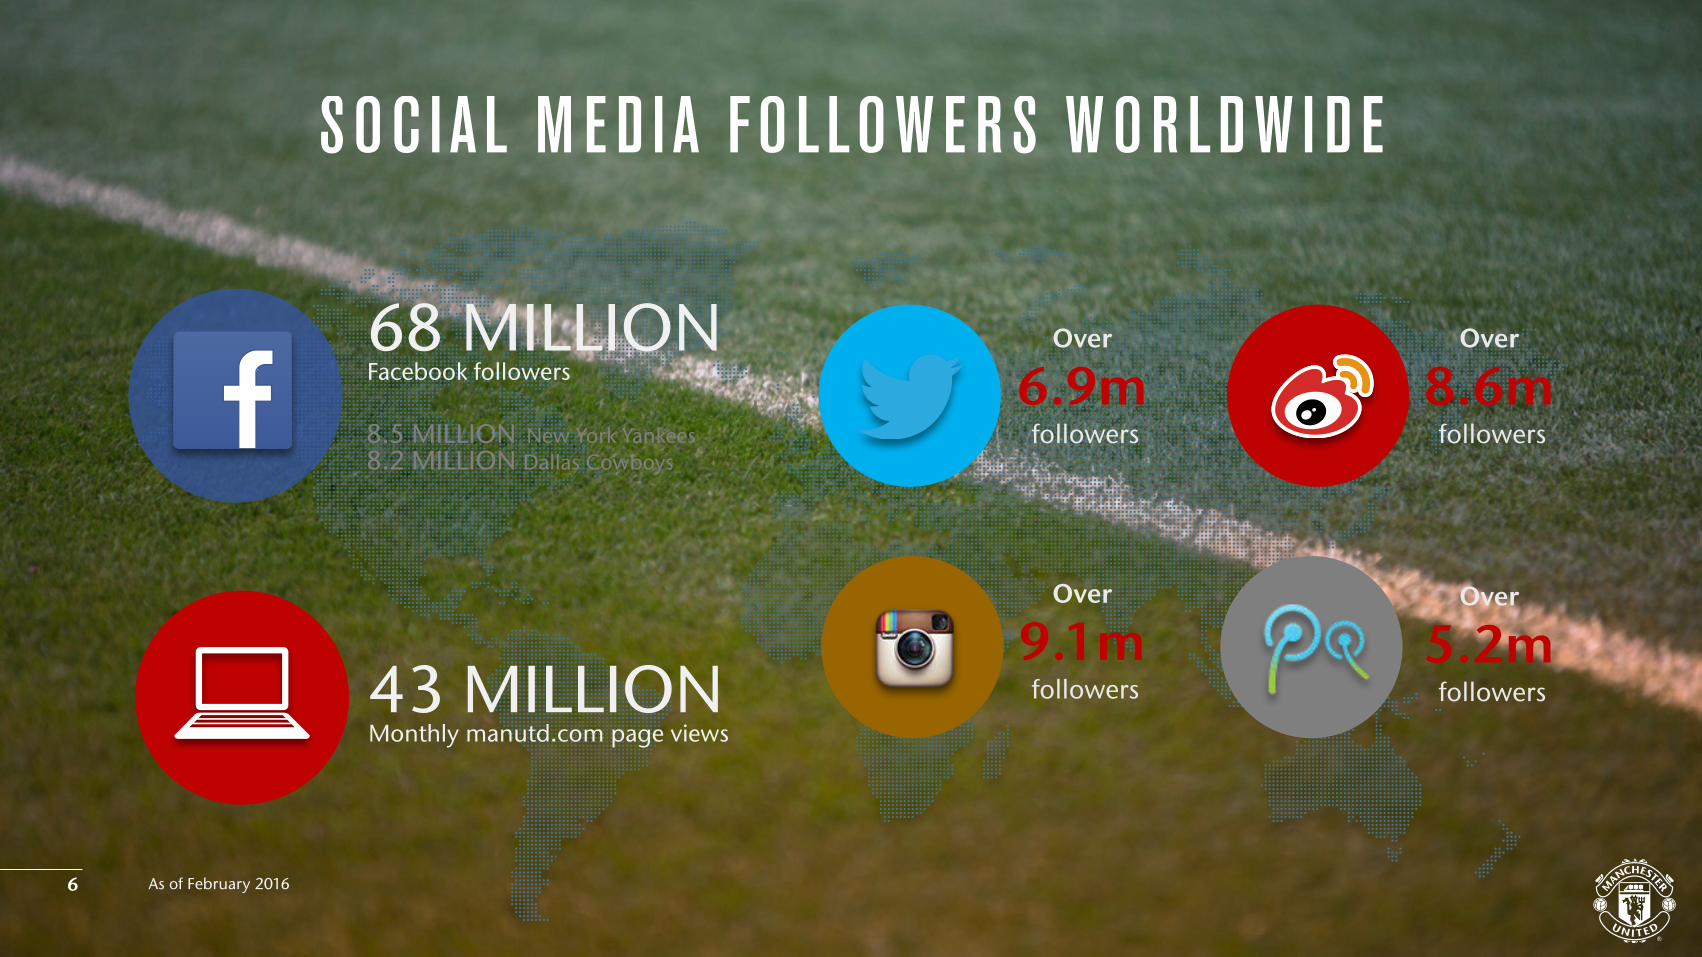
43 MILLIONMonthly manutd.com page views
8.5 MILLION New York Yankees8.2 MILLION Dallas Cowboys
Facebook followers68 MILLION Over
6.9m followers
Over
9.1m followers
Over
5.2m followers
Over
8.6m followers
As of February 2016
SOC I A L M E D I A FO L LO W E RS W OR LD W I D E
6

OU R B US I N E SS
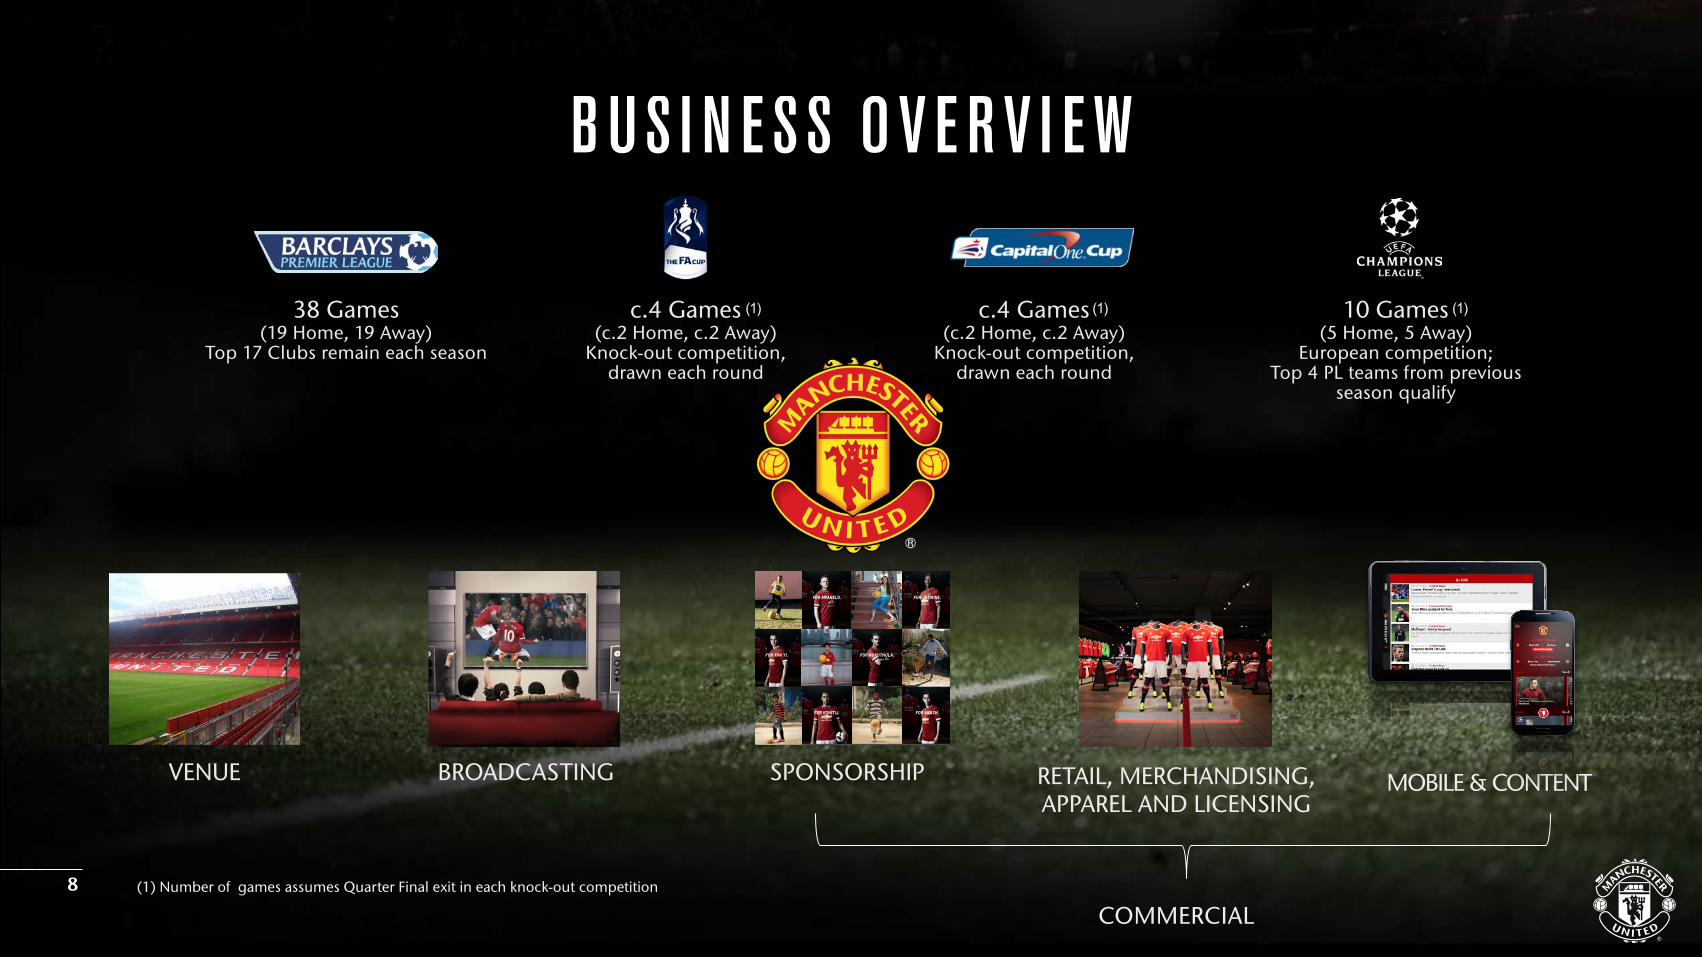
38 Games(19 Home, 19 Away)
Top 17 Clubs remain each season
c.4 Games(c.2 Home, c.2 Away)
Knock-out competition, drawn each round
10 Games(5 Home, 5 Away)
European competition; Top 4 PL teams from previous
season qualify
(1) Number of games assumes Quarter Final exit in each knock-out competition
c.4 Games(c.2 Home, c.2 Away)
Knock-out competition, drawn each round
(1) (1) (1)
VENUE BROADCASTING SPONSORSHIP RETAIL, MERCHANDISING, APPAREL AND LICENSING
COMMERCIAL
MOBILE & CONTENT
FOR MFANELO.
FOR YAN YI.
FOR KSHITIJ. FOR AKASH.
FOR JASMINE.
FOR NOKUTHULA.
B US I N E SS O V E R V I E W
8
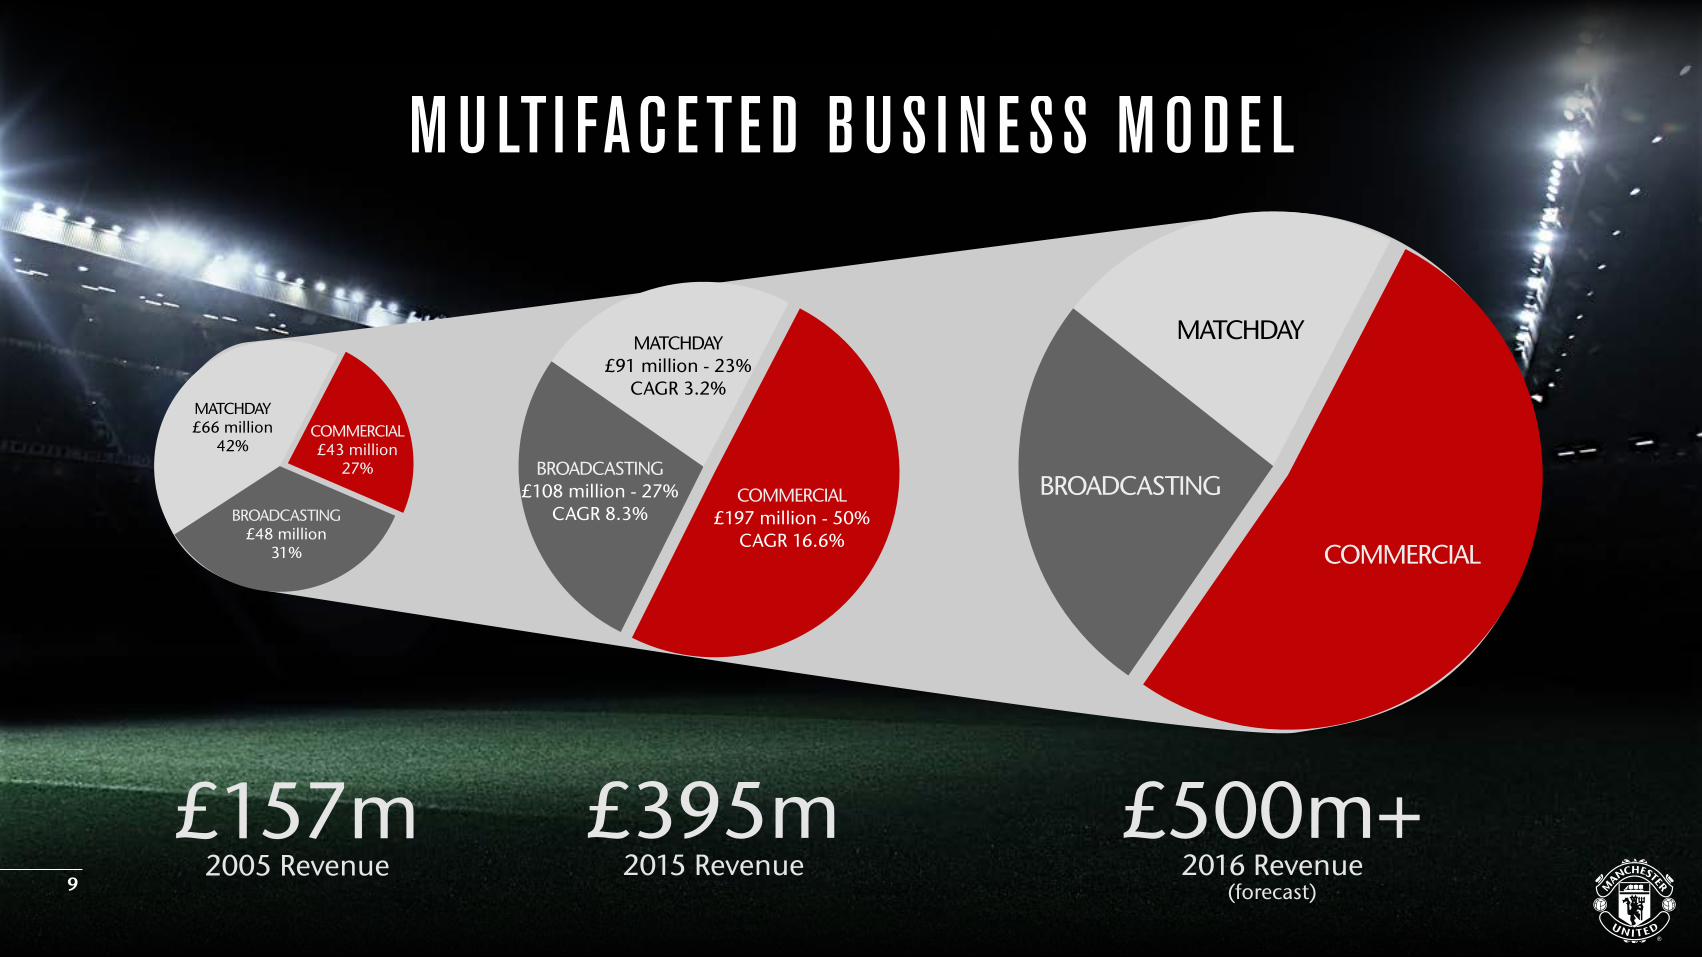
M U LTI FAC ETE D B US I N E SS MOD E L
9
£157m2005 Revenue
£395m 2015 Revenue
BROADCASTING£48 million
31%
MATCHDAY£66 million
42%COMMERCIAL£43 million
27% BROADCASTING£108 million - 27%
CAGR 8.3%
MATCHDAY£91 million - 23%
CAGR 3.2%
COMMERCIAL£197 million - 50%
CAGR 16.6%
£500m+ 2016 Revenue
(forecast)
BROADCASTING
MATCHDAY
COMMERCIAL
MATCH DAY
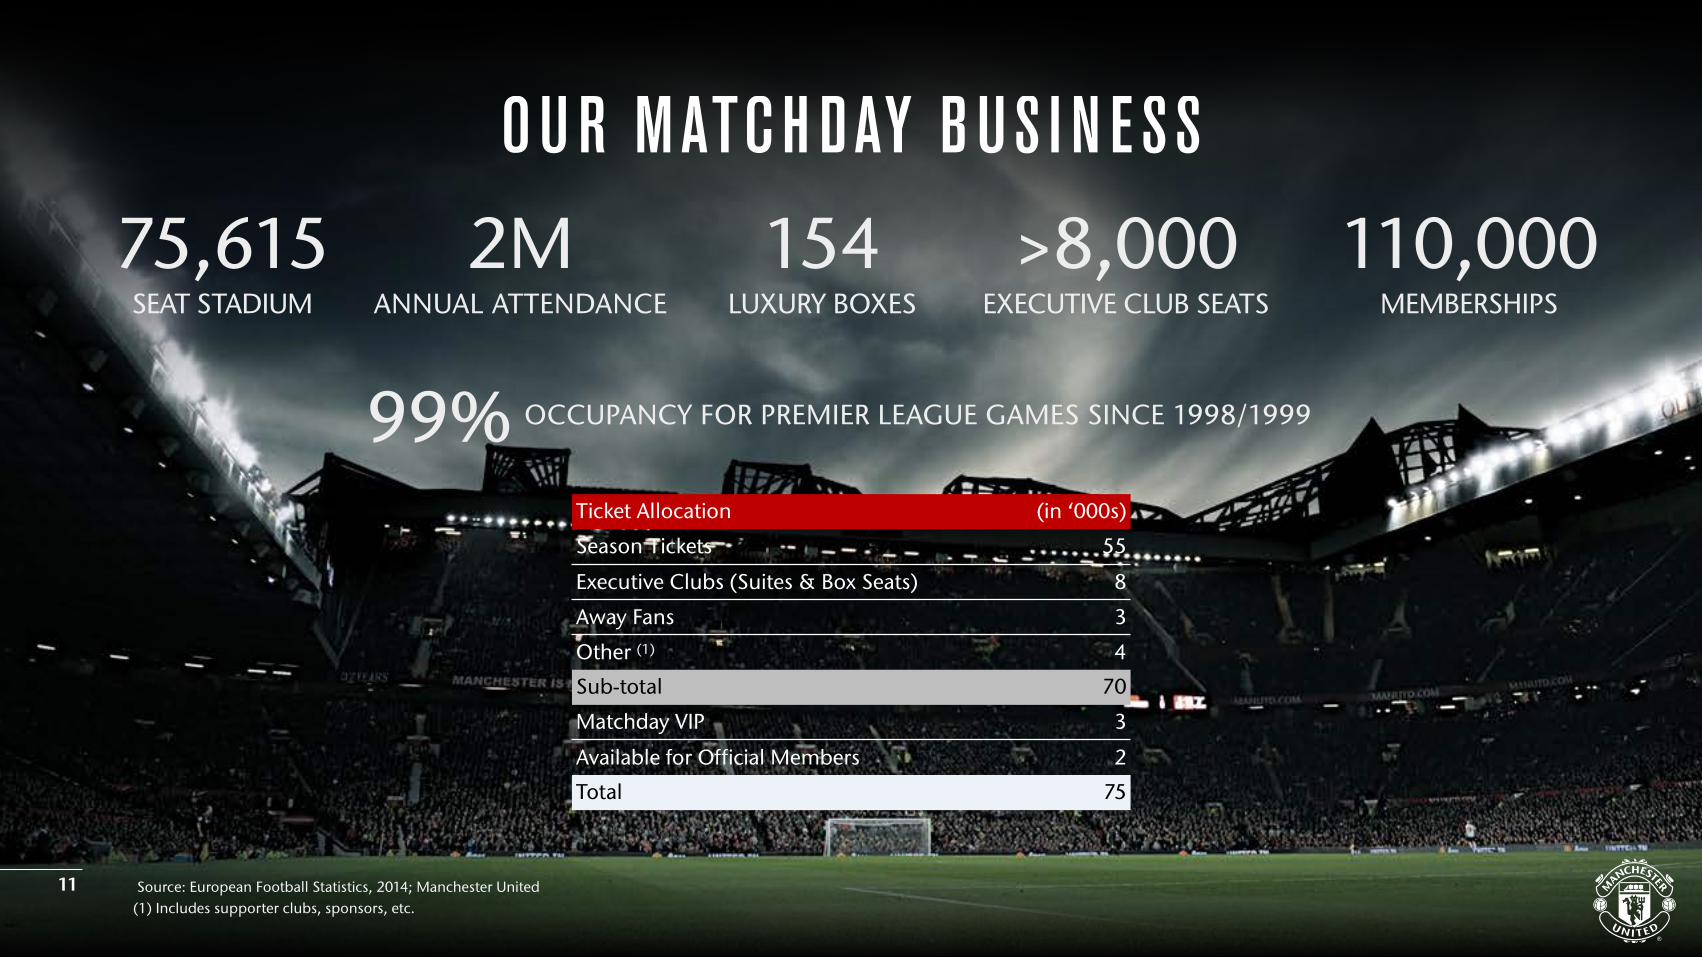
OU R MATCH DAY B US I N E SS
99% OCCUPANCY FOR PREMIER LEAGUE GAMES SINCE 1998/1999
75,615 2M 154 >8,000 SEAT STADIUM ANNUAL ATTENDANCE LUXURY BOXES EXECUTIVE CLUB SEATS
110,000 MEMBERSHIPS
Ticket Allocation (in ‘000s)
Season Tickets 55
Executive Clubs (Suites & Box Seats) 8
Away Fans 3
Other (1) 4
Sub-total 70
Matchday VIP 3
Available for Official Members 2
Total 75
Source: European Football Statistics, 2014; Manchester United(1) Includes supporter clubs, sponsors, etc.
11
B ROADCASTI N G
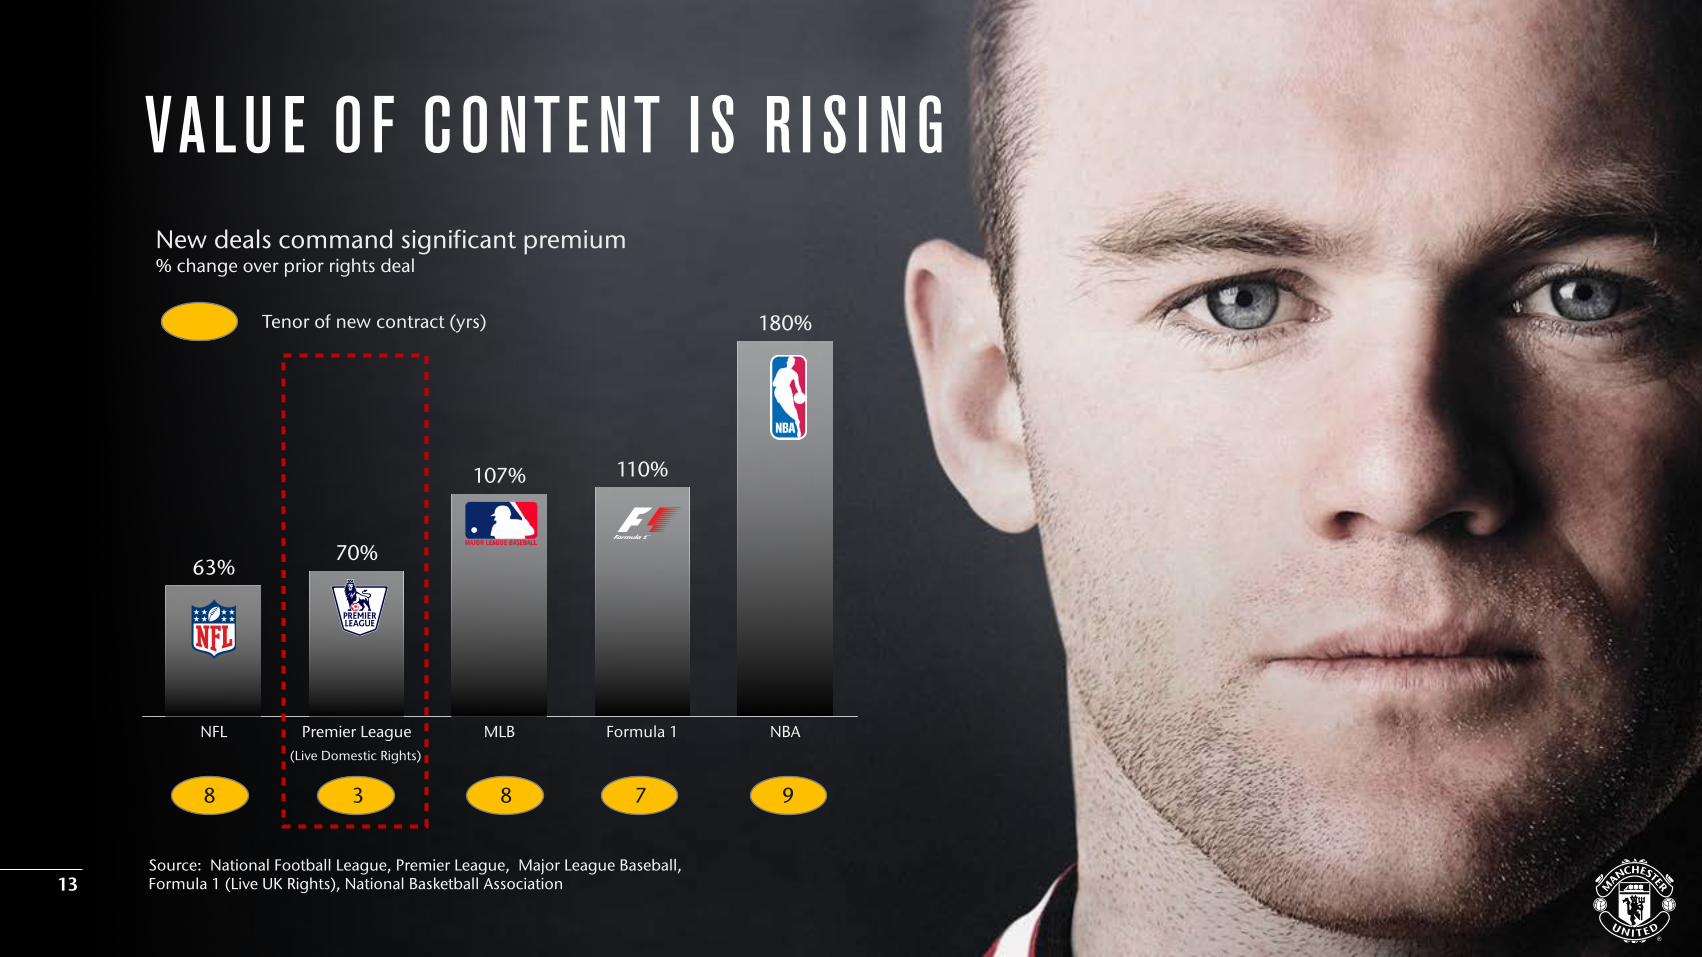
NFL Premier League MLB Formula 1 NBA
180%
110%107%
70%63%
New deals command significant premium% change over prior rights deal
VALU E O F CONTE NT I S R I S I N G
Tenor of new contract (yrs)
(Live Domestic Rights)
38 8 9
Source: National Football League, Premier League, Major League Baseball, Formula 1 (Live UK Rights), National Basketball Association 13
7
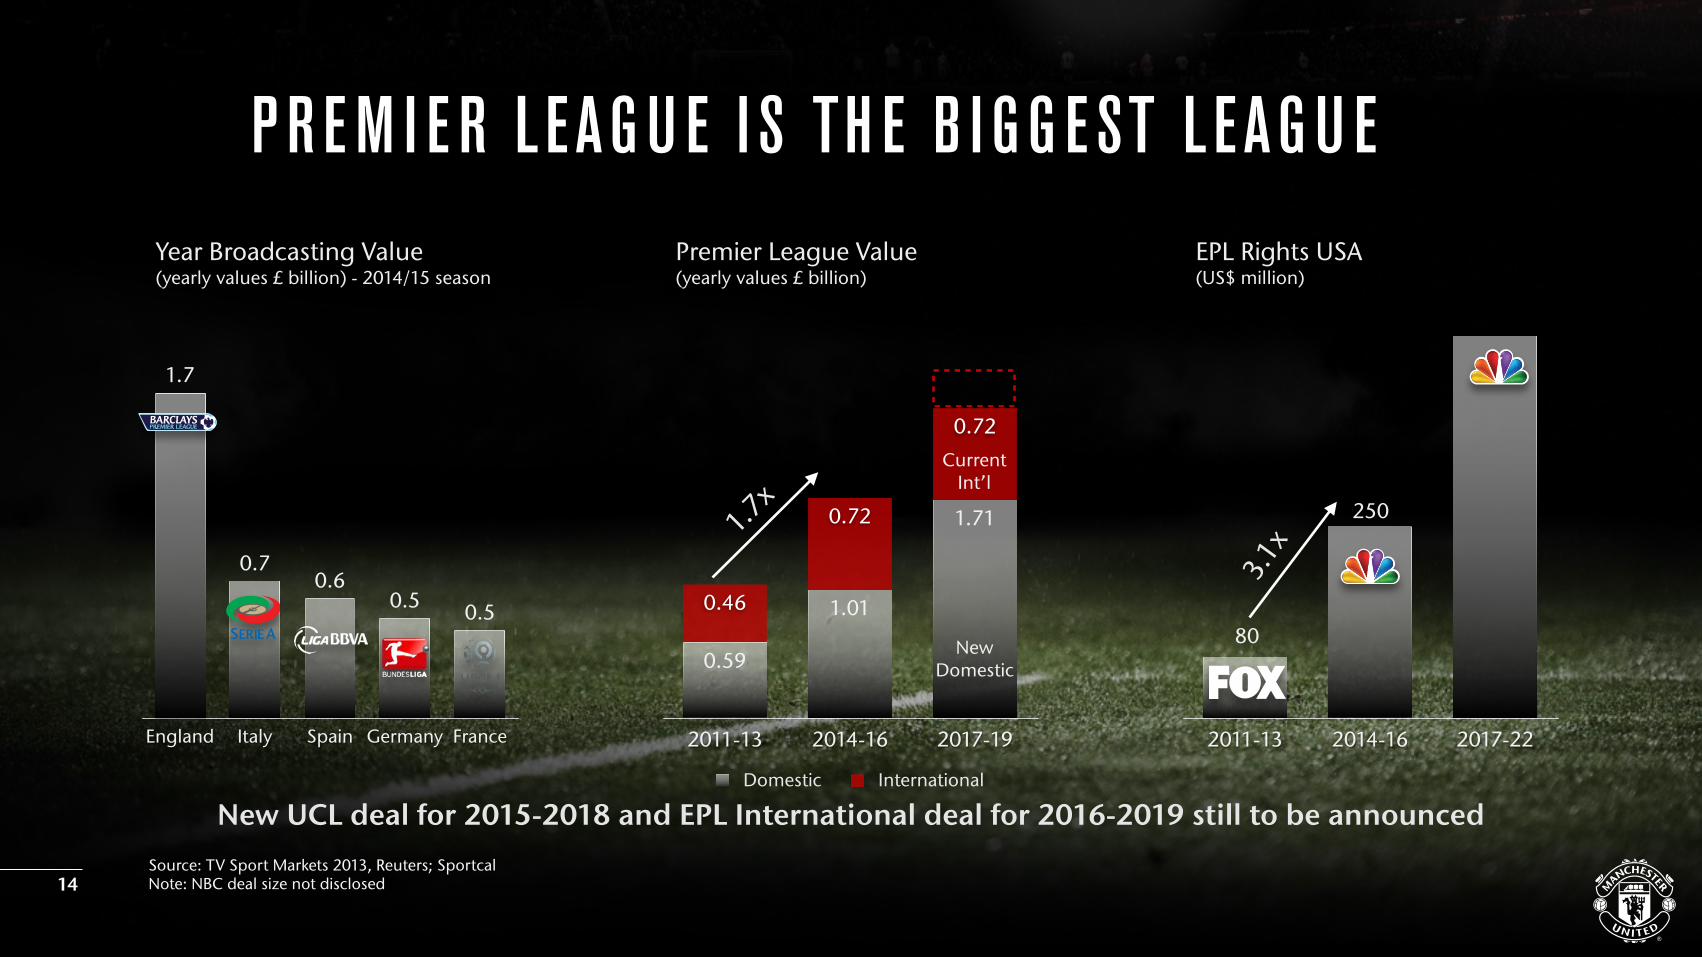
England Italy Spain Germany France
0.50.50.6
0.7
1.7
Year Broadcasting Value
2011-13 2014-16 2017-19
0.72
0.72
0.46
1.71
1.01
0.59
Premier League Value
2011-13 2014-16 2017-22
EPL Rights USA(yearly values £ billion) (US$ million)
1.7x
3.1x
(yearly values £ billion) - 2014/15 season
New UCL deal for 2015-2018 and EPL International deal for 2016-2019 still to be announcedDomestic International
NewDomestic
CurrentInt’l
P R E M I E R L EAG U E I S TH E B I G G E ST L EAG U E
Source: TV Sport Markets 2013, Reuters; SportcalNote: NBC deal size not disclosed14
80
250
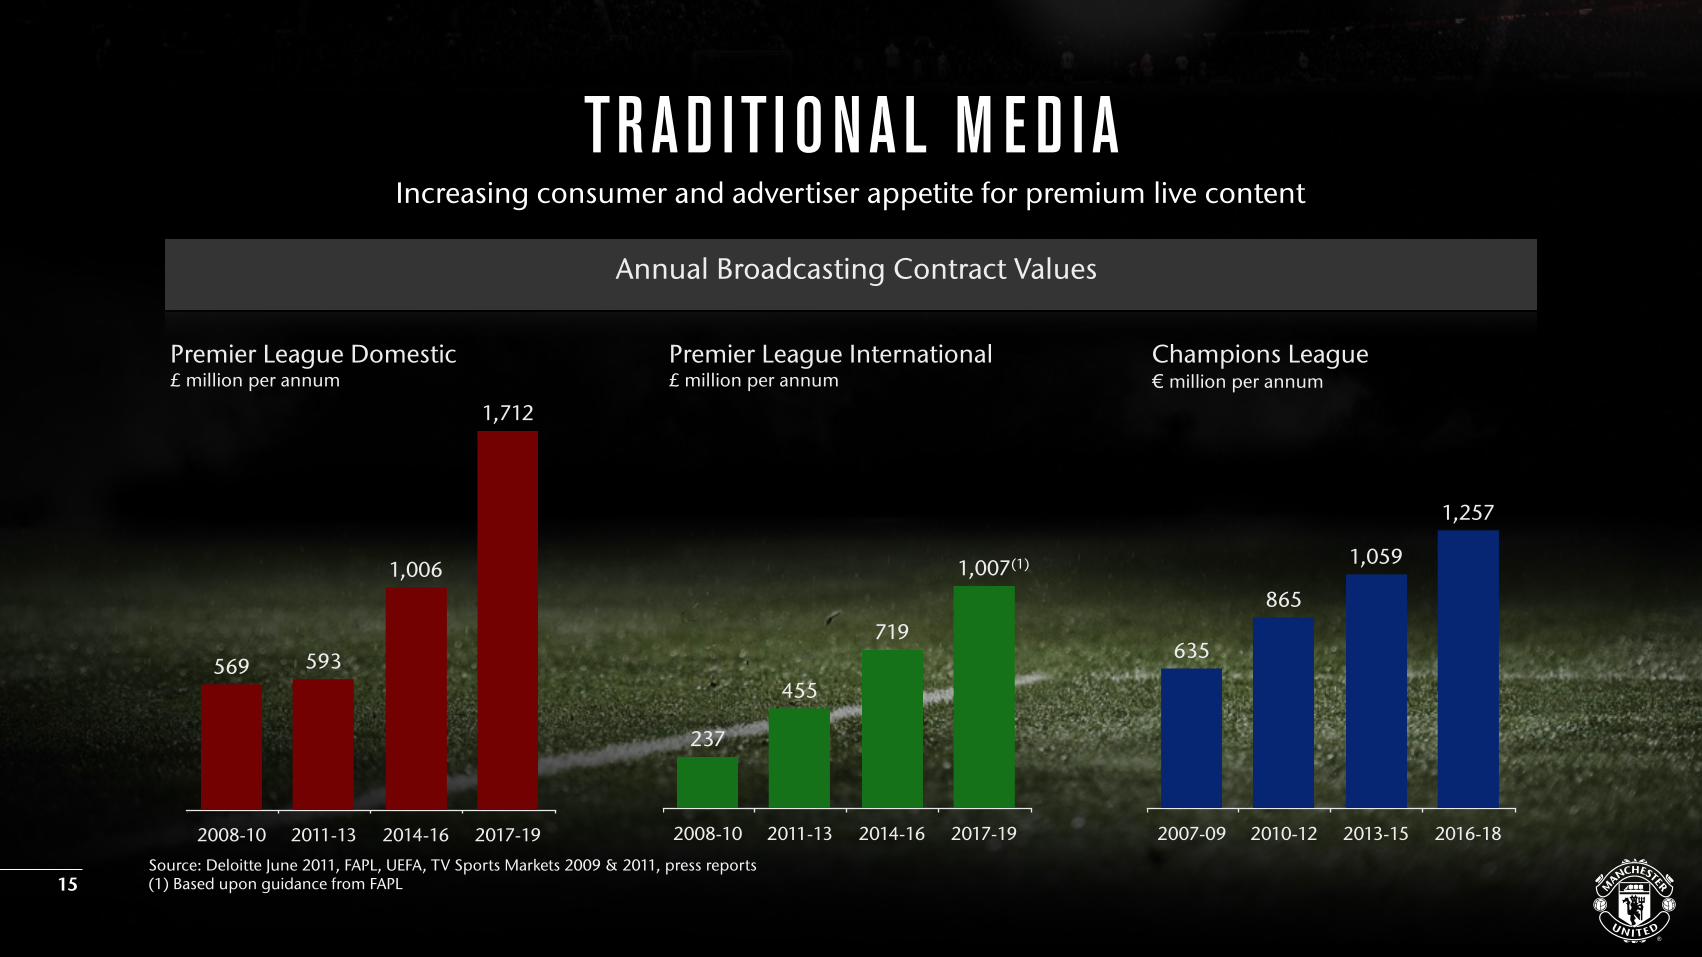
2008-10 2011-13 2014-16 2017-19
1,007
719
455
237
2008-10 2011-13 2014-16 2017-19
1,712
1,006
593569
Source: Deloitte June 2011, FAPL, UEFA, TV Sports Markets 2009 & 2011, press reports(1) Based upon guidance from FAPL
Increasing consumer and advertiser appetite for premium live content
Annual Broadcasting Contract Values
TRAD IT I ONAL M E D I A
Premier League Domestic£ million per annum
Premier League International£ million per annum
Champions League€ million per annum
2007-09 2010-12 2013-15 2016-18
1,257
1,059
865
635
(1)
15

COM M E RC I A L - S P ONSORSH I P
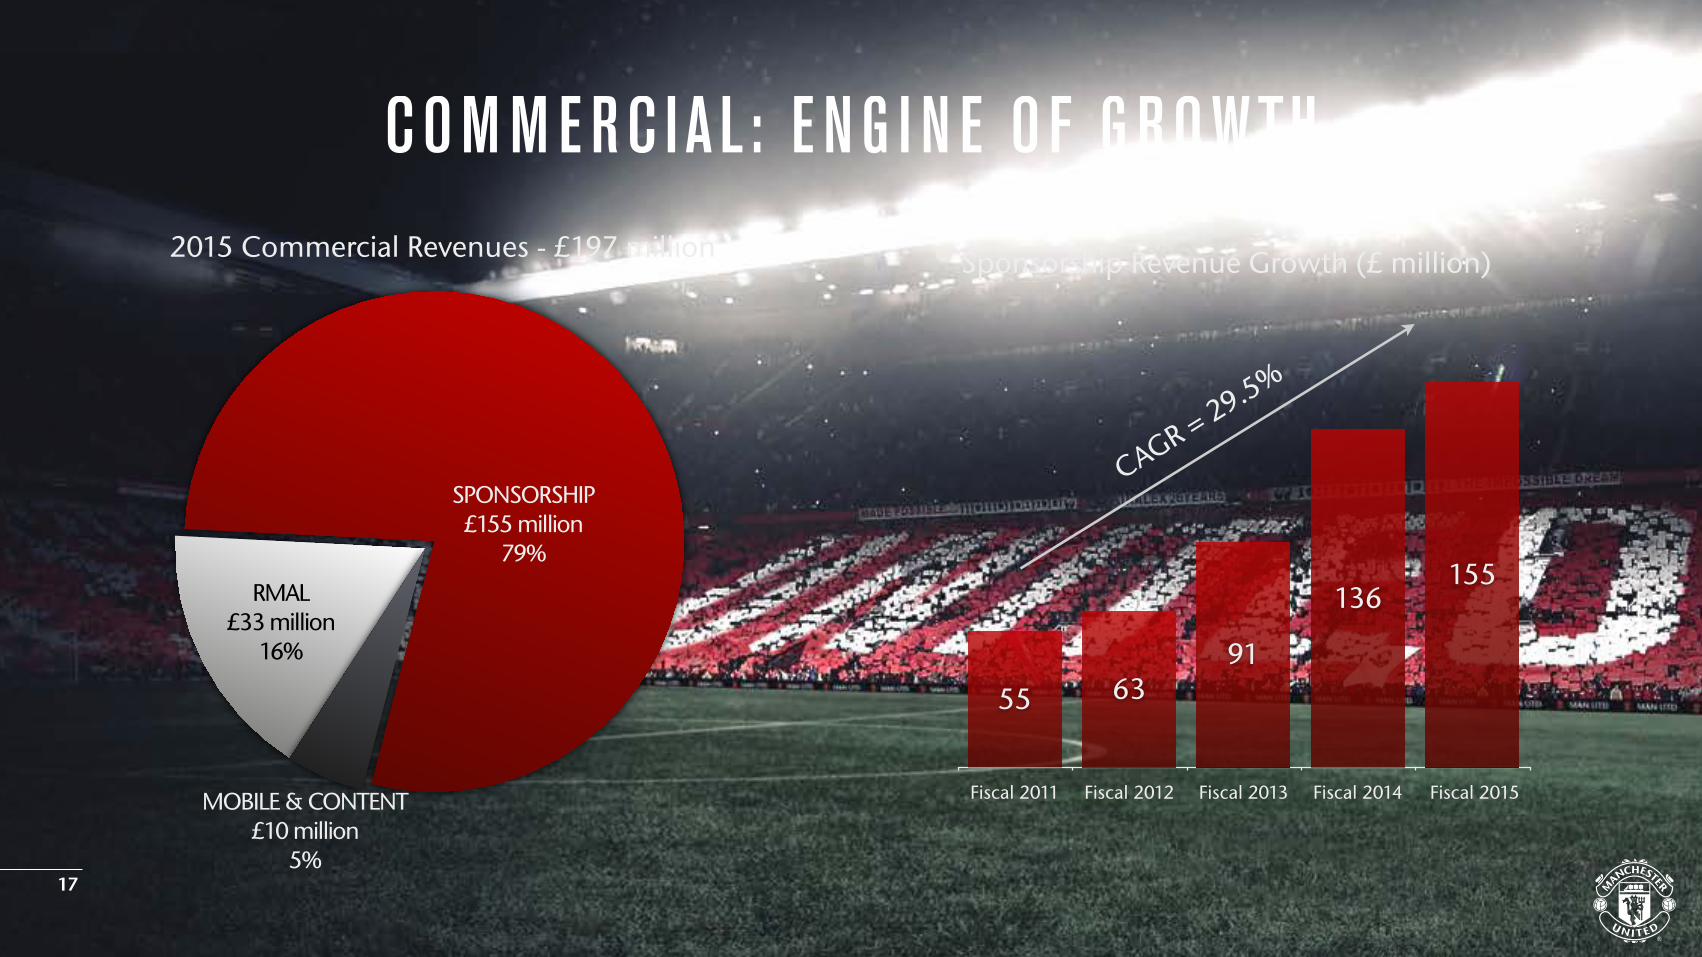
COM M E RC I A L: E N G I N E O F G RO WTH
RMAL£33 million
16%
MOBILE & CONTENT£10 million
5%
SPONSORSHIP £155 million
79%
Fiscal 2011 Fiscal 2012 Fiscal 2013 Fiscal 2014 Fiscal 2015
155136
916355
Sponsorship Revenue Growth (£ million)
CAGR = 29.5%
2015 Commercial Revenues - £197 million
17
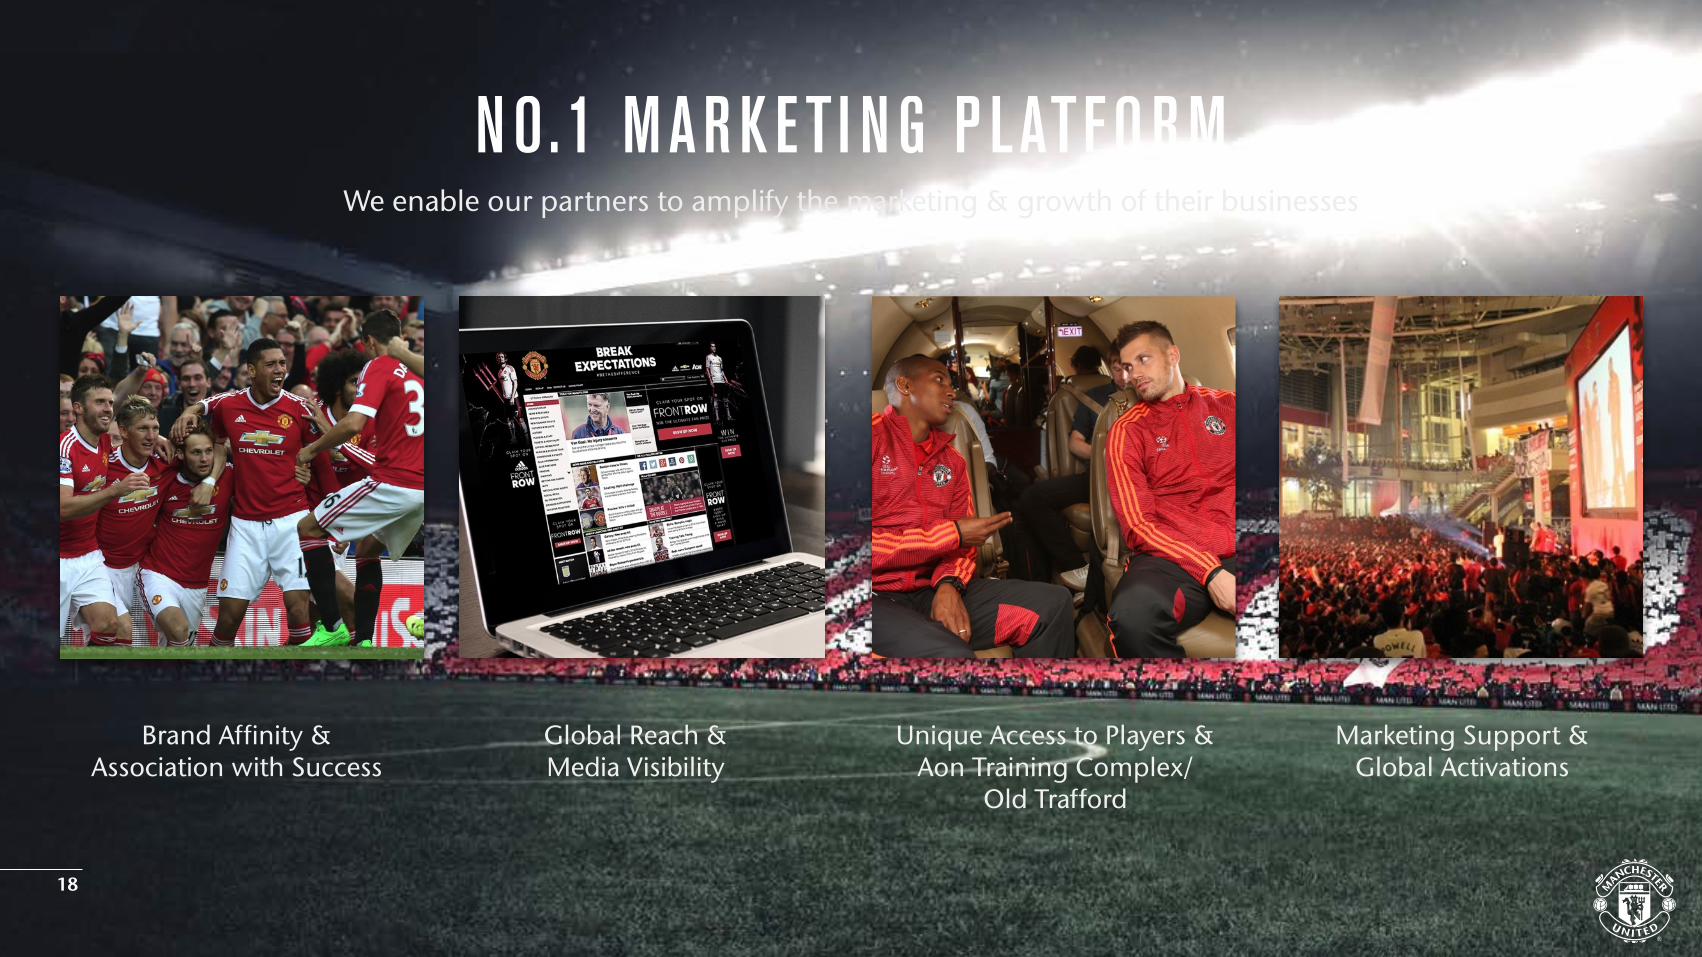
We enable our partners to amplify the marketing & growth of their businesses
NO.1 MARKETI N G P LATFORM
Brand Affinity & Association with Success
Global Reach & Media Visibility
Unique Access to Players & Aon Training Complex/
Old Trafford
Marketing Support & Global Activations
18
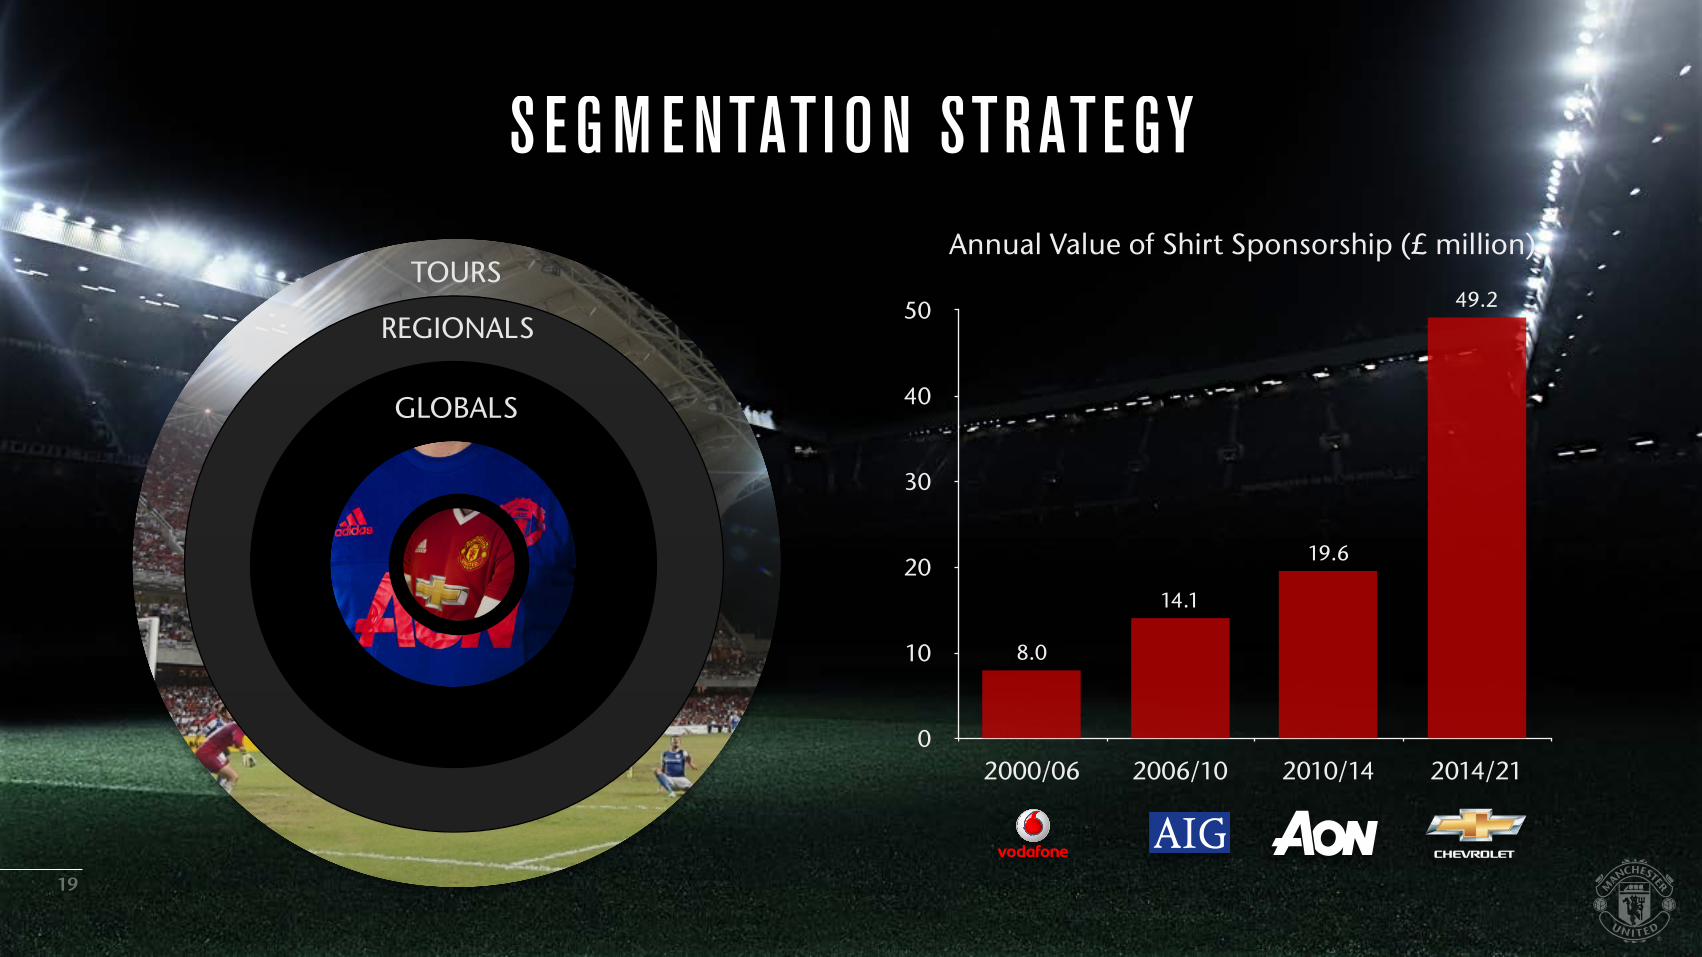
S E G M E NTATI ON STRATE GY
GLOBALS
REGIONALS
TOURS
0
10
20
30
40
50
2000/06 2006/10 2010/14 2014/21
49.2
19.6
14.1
8.0
Annual Value of Shirt Sponsorship (£ million)
19
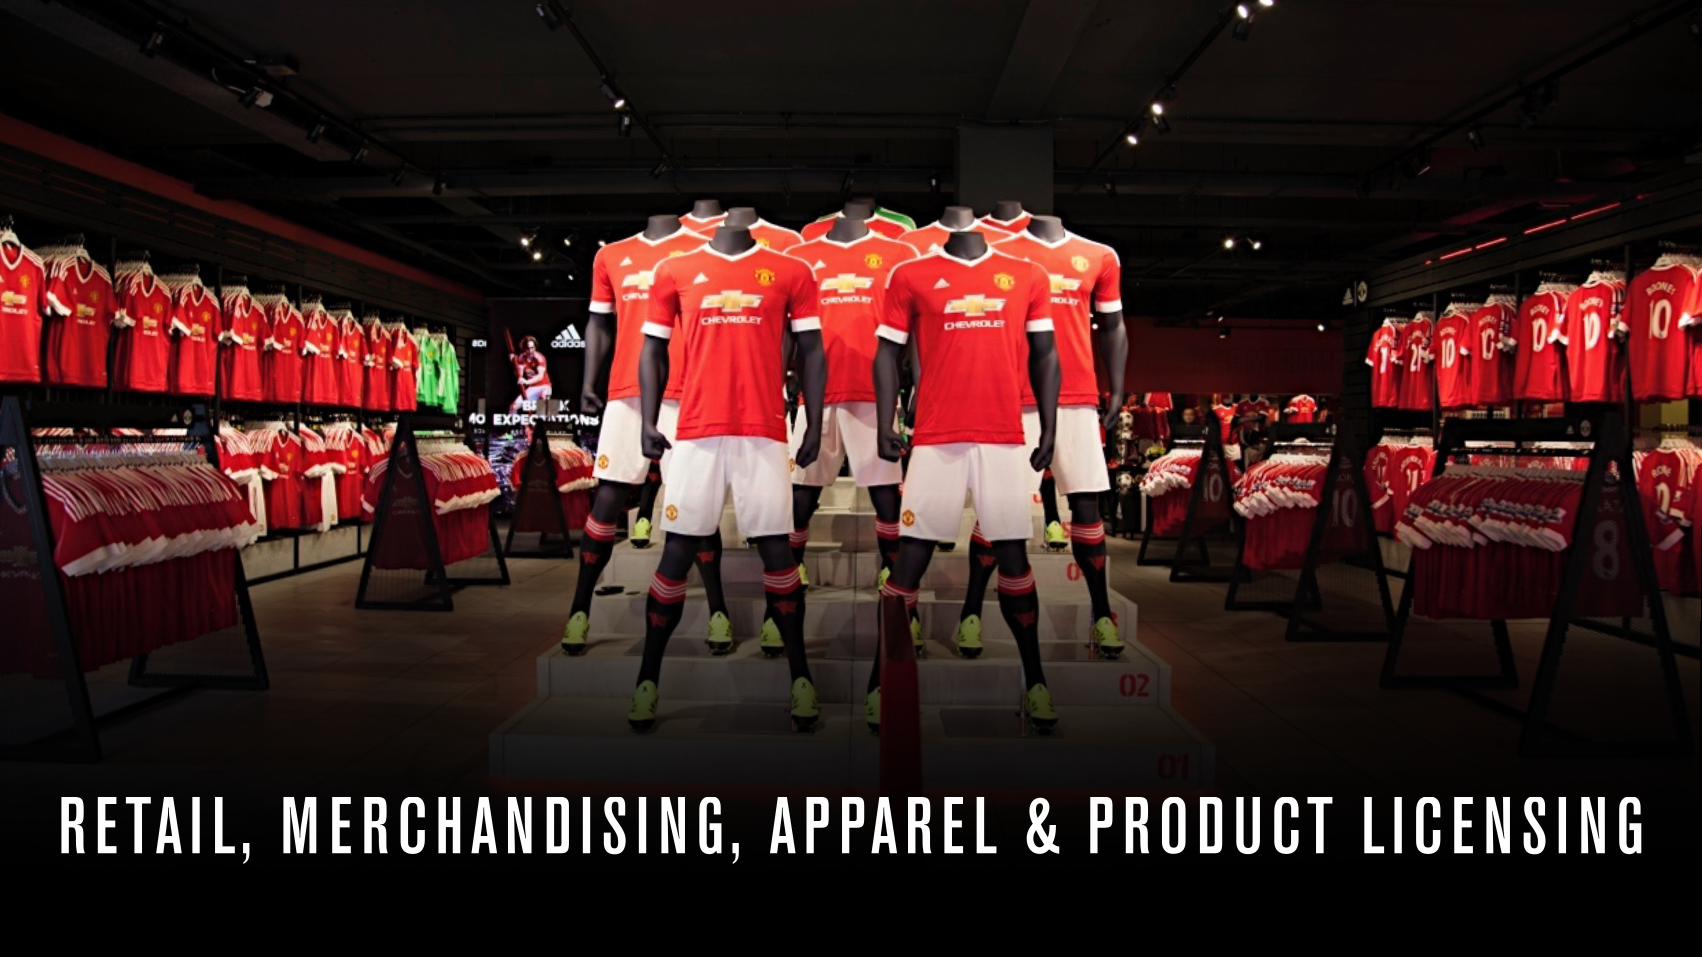
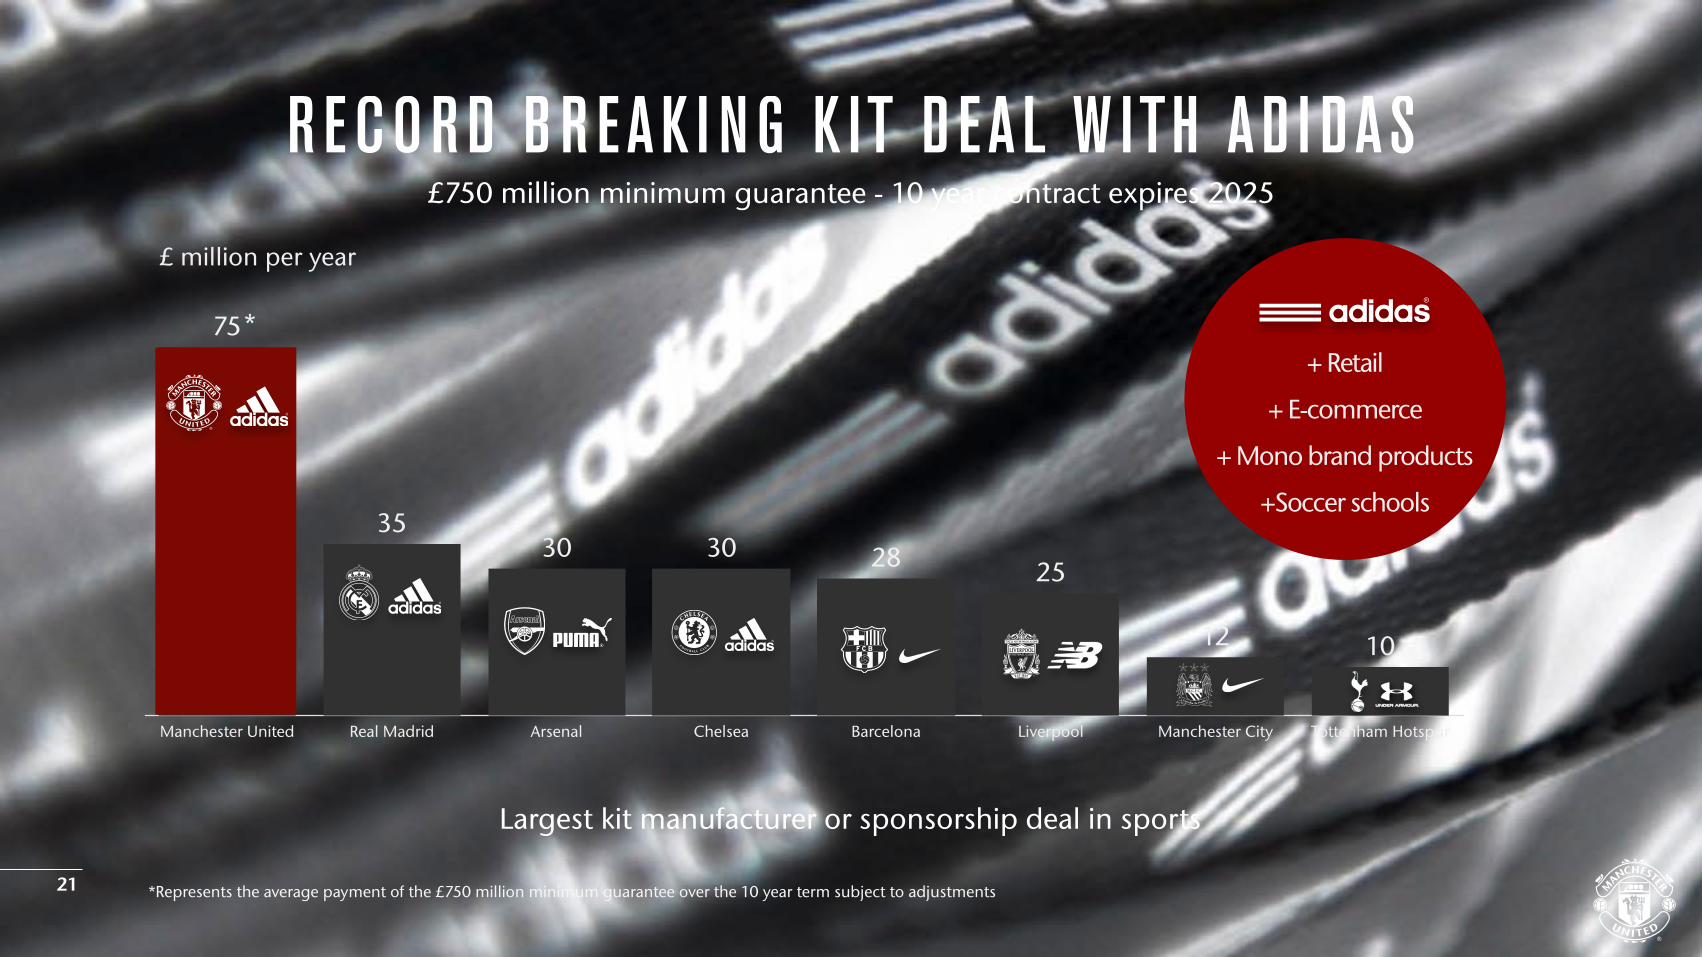
R ETA I L , M E RCHAN D I S I N G, AP PAR E L & P RODUCT L I C E N S I N G
*
Manchester United Real Madrid Arsenal Chelsea Barcelona Liverpool Manchester City Tottenham Hotspur
1012
2528303035
75
£ million per year
R ECORD B R EAK I N G K IT D EA L W ITH AD I DAS
Largest kit manufacturer or sponsorship deal in sports
*Represents the average payment of the £750 million minimum guarantee over the 10 year term subject to adjustments
£750 million minimum guarantee - 10 year contract expires 2025
+ Retail
+ E-commerce
+ Mono brand products
+Soccer schools
21
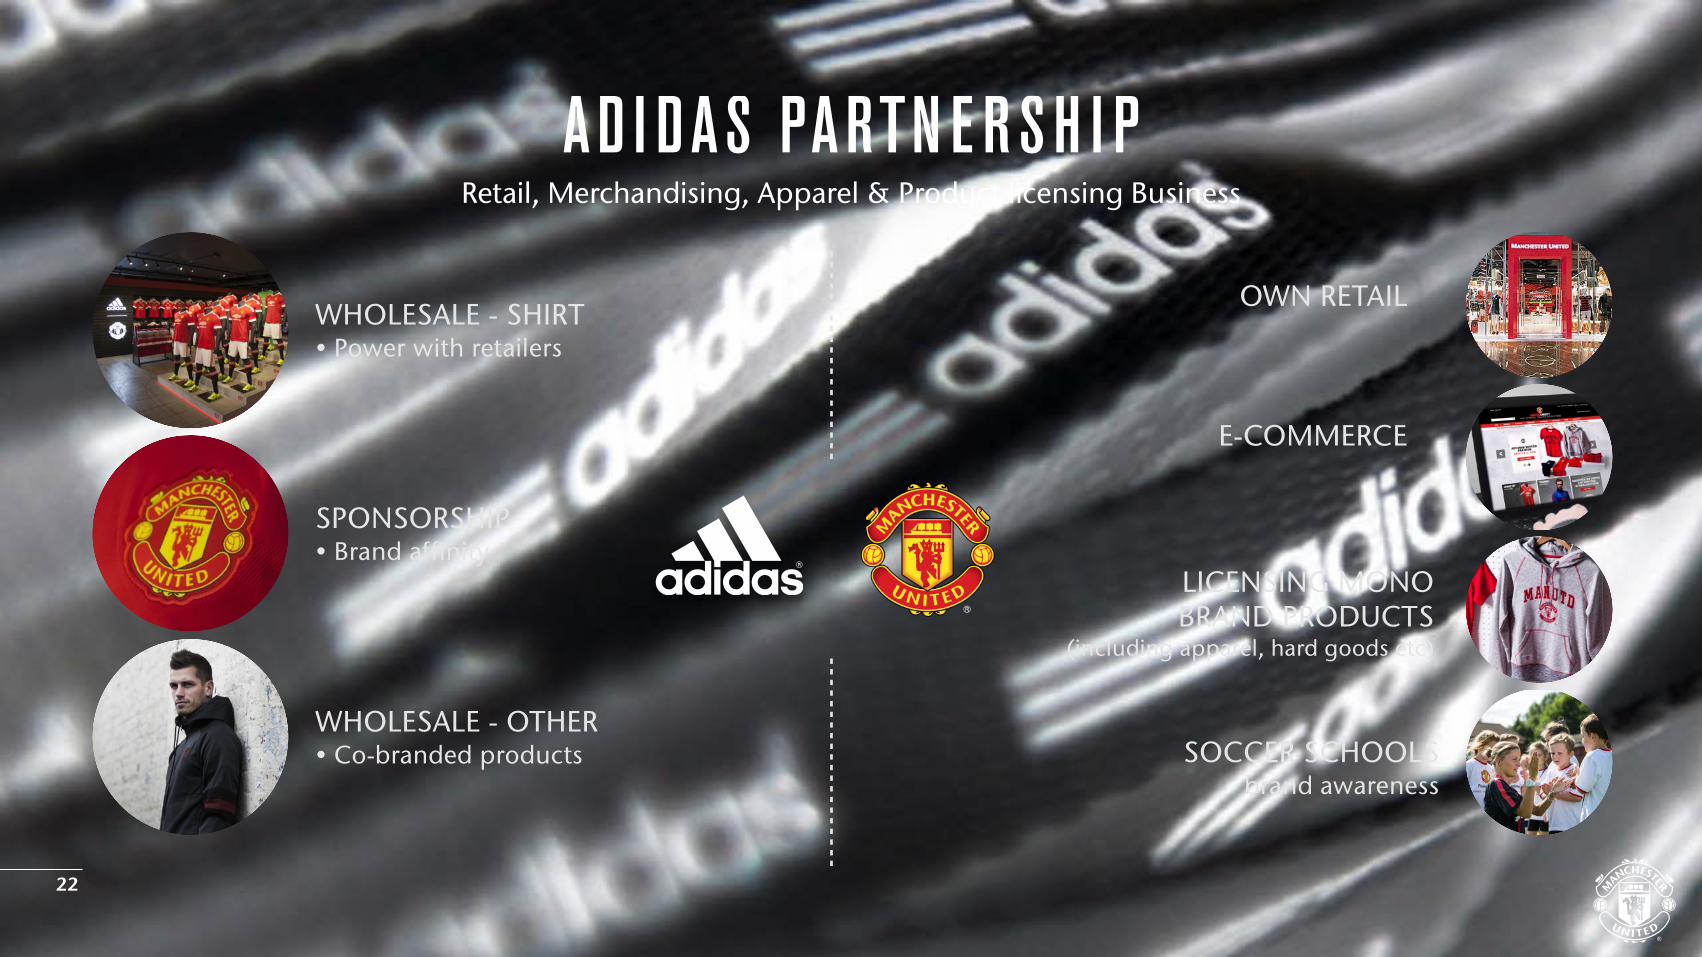
WHOLESALE - SHIRT• Power with retailers
SPONSORSHIP• Brand affinity
WHOLESALE - OTHER• Co-branded products
OWN RETAIL
E-COMMERCE
LICENSING MONO BRAND PRODUCTS
(including apparel, hard goods etc)
SOCCER SCHOOLSbrand awareness
AD I DAS PARTN E R SH I PRetail, Merchandising, Apparel & Product licensing Business
22

MOB I L E & CONTE NT

New Digital Media Platform
Sponsorship & Advertising
Mobile Apps
Subscription Content& Membership
Social Media Platforms
Content Licensing & Syndication
E-commerce
OU R D I G ITA L M E D I A O P P ORTU N ITY
24
COSTS
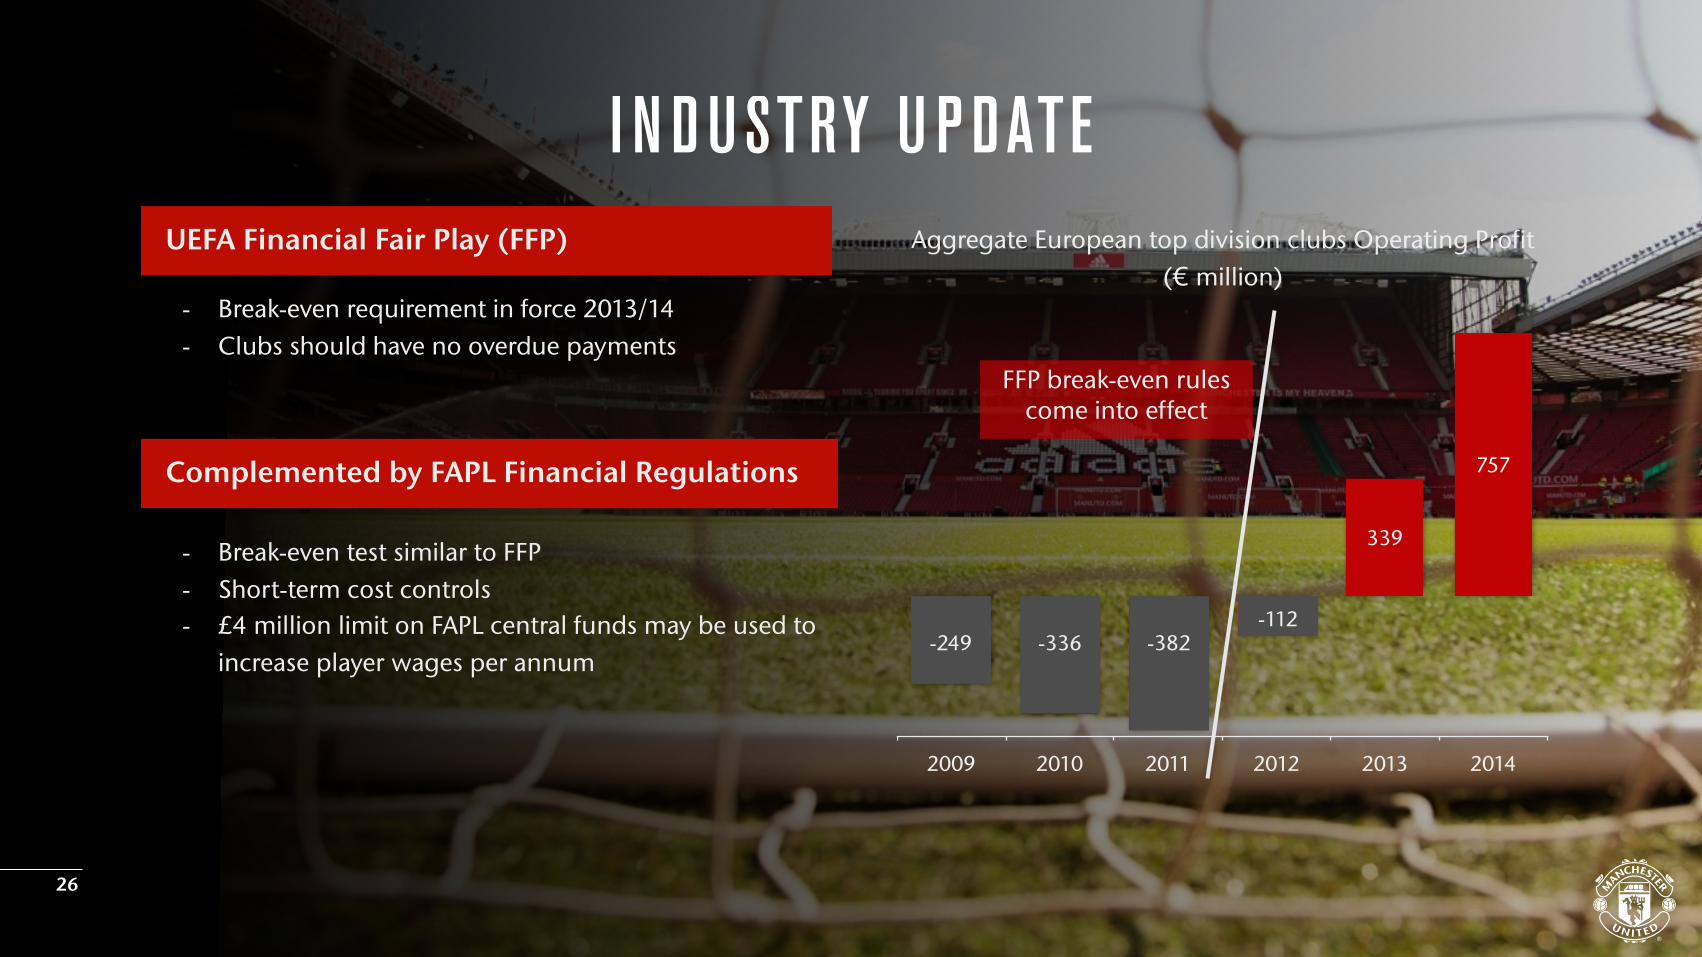
I N DUSTRY U P DATE
- Break-even requirement in force 2013/14 - Clubs should have no overdue payments
UEFA Financial Fair Play (FFP)
Complemented by FAPL Financial Regulations
- Break-even test similar to FFP- Short-term cost controls - £4 million limit on FAPL central funds may be used to
increase player wages per annum
26
2009 2010 2011 2012 2013 2014
757
339
-112
-382-336-249-249 -336 -382
-112
FFP break-even rules come into effect
Aggregate European top division clubs Operating Profit (€ million)
(50)
(25)
0
25
50
75
100
99/0
0A00
/01A
01/0
2A02
/03A
03/0
4A04
/05A
05/0
6A06
/07A
07/0
8A08
/09A
09/1
0A10
/11A
11/1
2A12
/13A
13/1
4A14
/15A
96.8
78.9
36.449.6
11.4
30.4
-44.0
26.5
10.6
32.6
-2.6
28.8
7.912.1
43.3
17.8
(44.0)
(2.6)
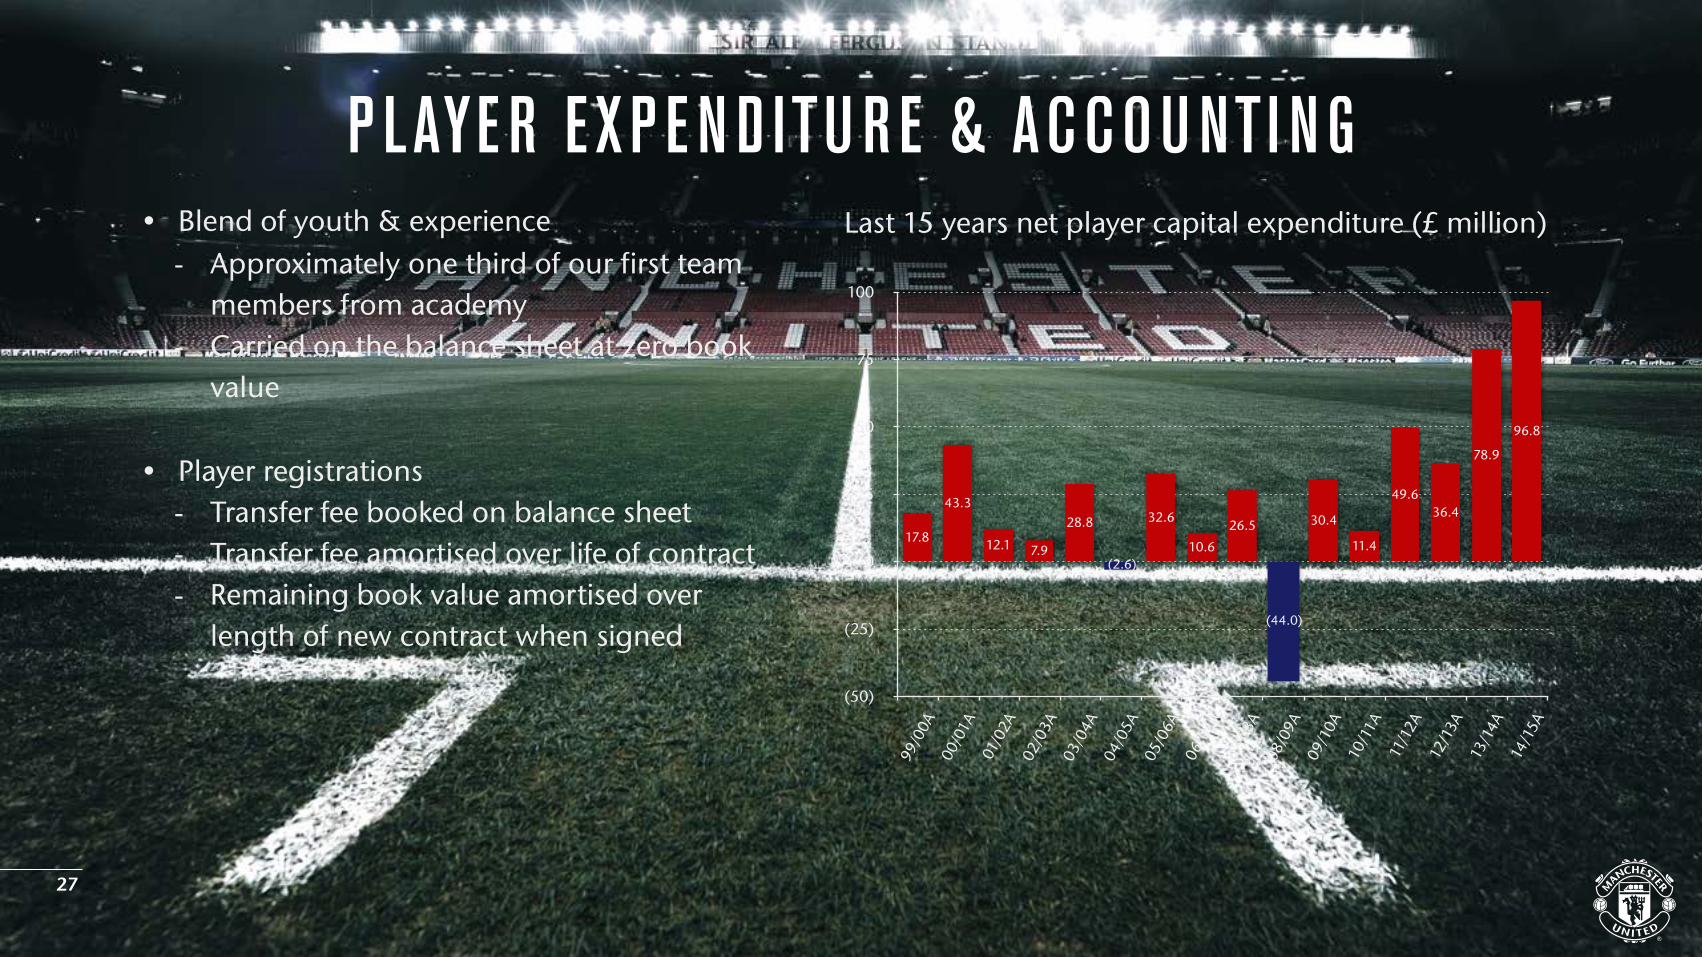
• Blend of youth & experience- Approximately one third of our first team
members from academy- Carried on the balance sheet at zero book
value
• Player registrations- Transfer fee booked on balance sheet- Transfer fee amortised over life of contract- Remaining book value amortised over
length of new contract when signed
Last 15 years net player capital expenditure (£ million)
P LAYE R E XP E N D ITU R E & ACCOU NTI N G
27
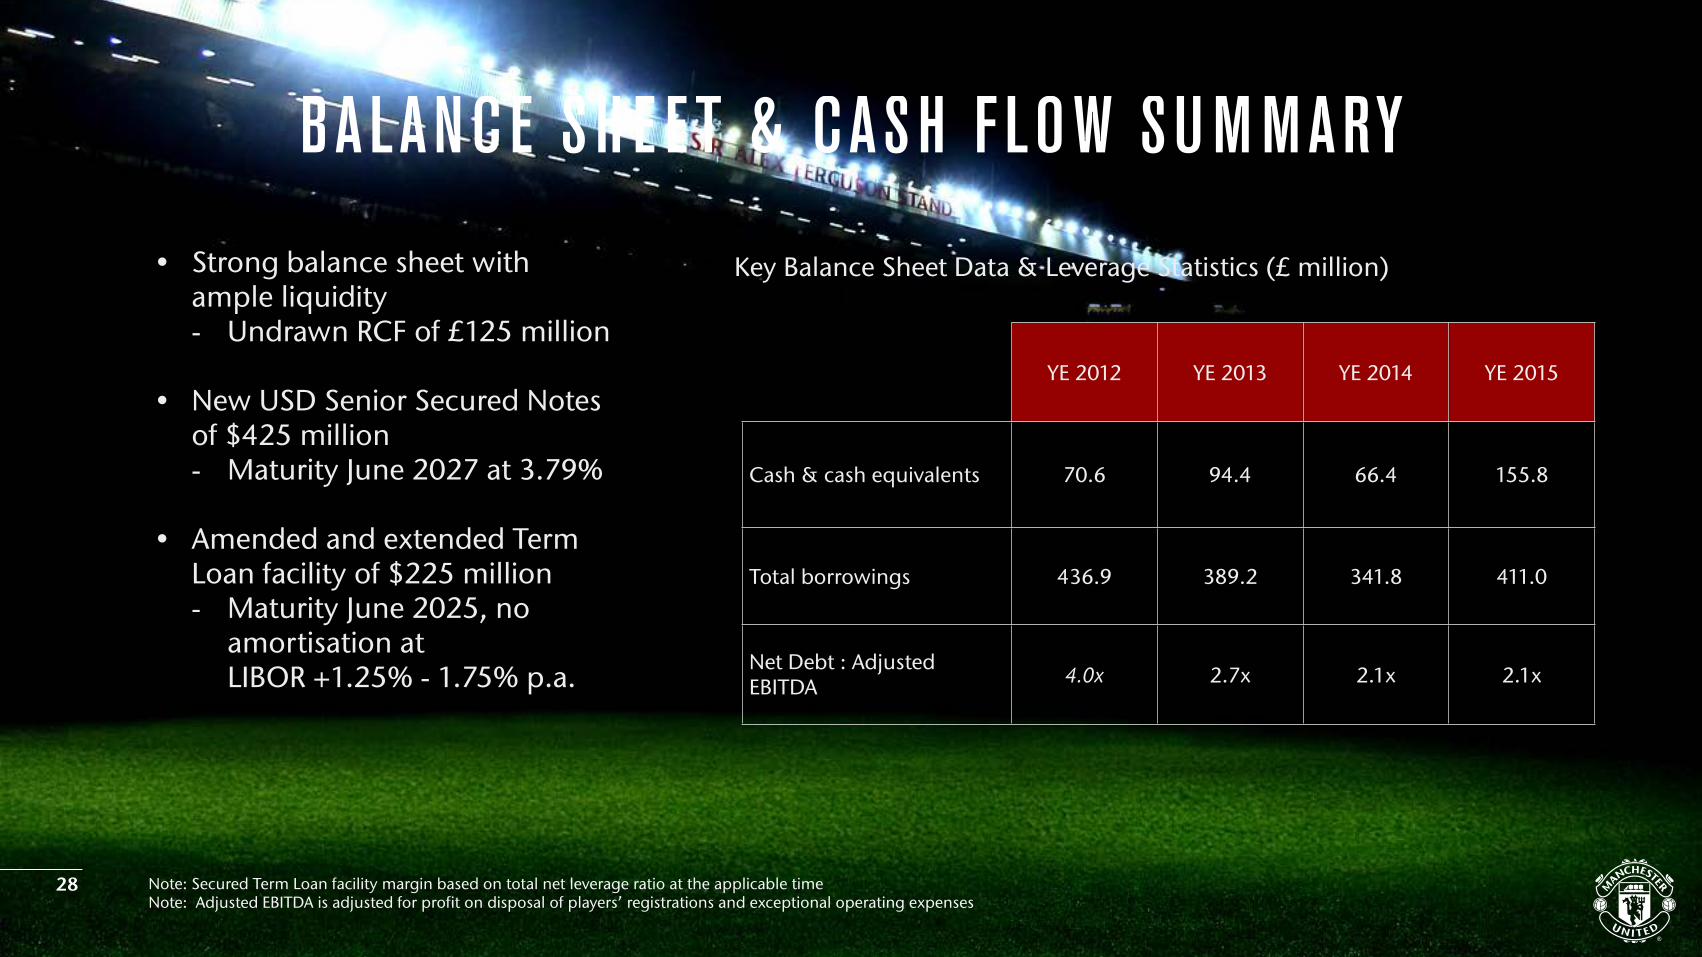
YE 2012 YE 2013 YE 2014 YE 2015
Cash & cash equivalents 70.6 94.4 66.4 155.8
Total borrowings 436.9 389.2 341.8 411.0
Net Debt : Adjusted EBITDA 4.0x 2.7x 2.1x 2.1x
Key Balance Sheet Data & Leverage Statistics (£ million)
Note: Secured Term Loan facility margin based on total net leverage ratio at the applicable timeNote: Adjusted EBITDA is adjusted for profit on disposal of players’ registrations and exceptional operating expenses
BALANC E S H E ET & CASH F LO W SU M MARY
• Strong balance sheet with ample liquidity- Undrawn RCF of £125 million
• New USD Senior Secured Notes of $425 million - Maturity June 2027 at 3.79%
• Amended and extended Term
Loan facility of $225 million- Maturity June 2025, no
amortisation at LIBOR +1.25% - 1.75% p.a.
28
LOOK I N G TO TH E FUTU R EGrowth Catalysts
• New Premier League International rights deal for 2017-19
• Continued growth in sponsorship
• Retail, e-commerce and licensing opportunity
• Launch of digital media platform
29

AP P E N D I X
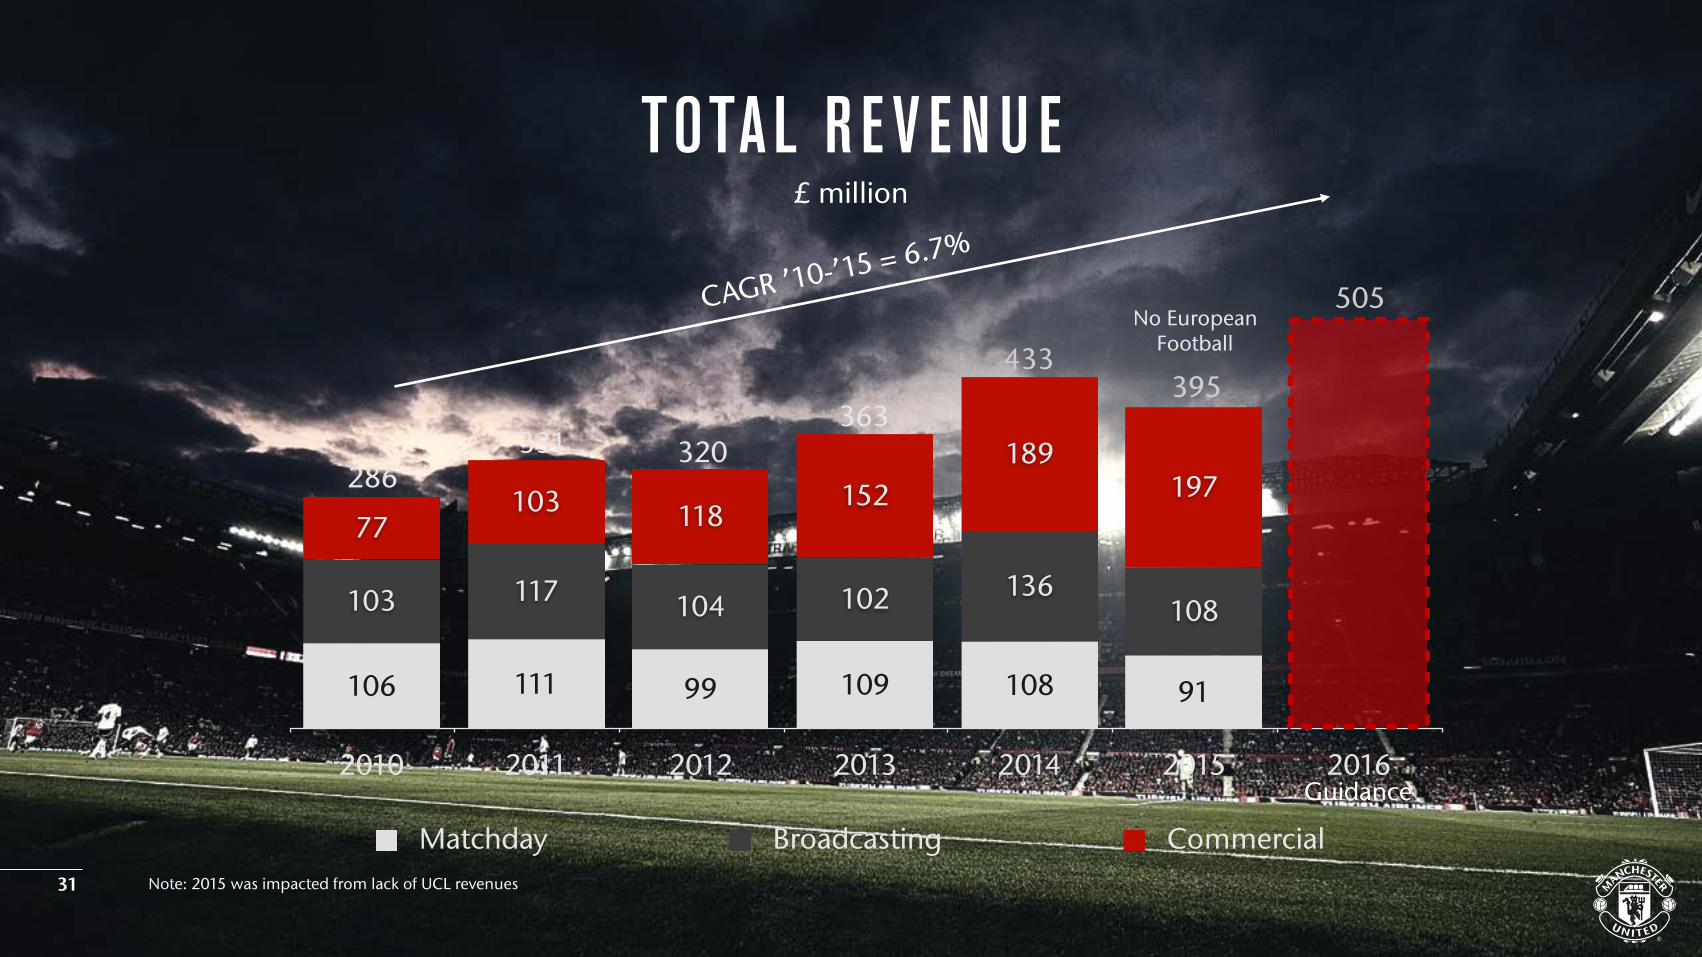
2010 2011 2012 2013 2014 2015 2016
197189
152118103
77
108136102104117103
9110810999111106
TOTAL R E V E N U E£ million
433
320363
331286
CAGR ’10-’15 = 6.7%
31
395
Note: 2015 was impacted from lack of UCL revenues
505
Matchday Broadcasting Commercial
Guidance
No European Football
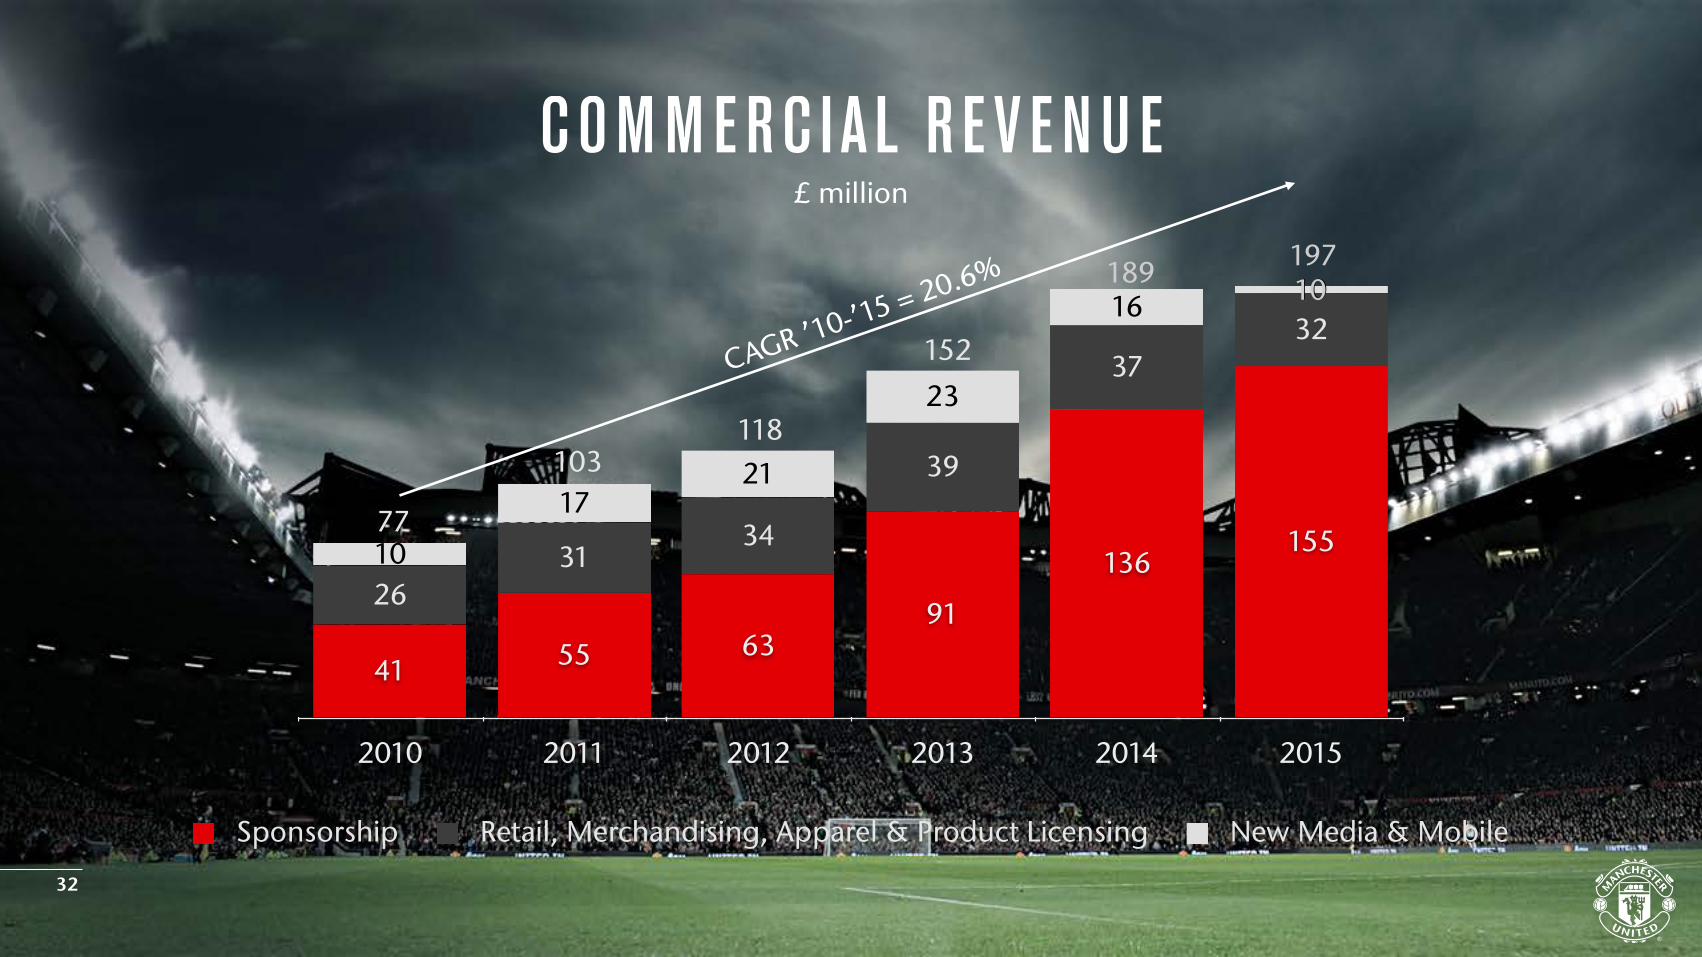
COM M E RC I A L R E V E N U E£ million
Sponsorship Retail, Merchandising, Apparel & Product Licensing New Media & Mobile
2010 2011 2012 2013 2014 2015
1016
23
2117
10
3237
39
3431
26
155136
91635541
118
152
189
103
77
CAGR ’10-’15 = 20.6%
32
19710
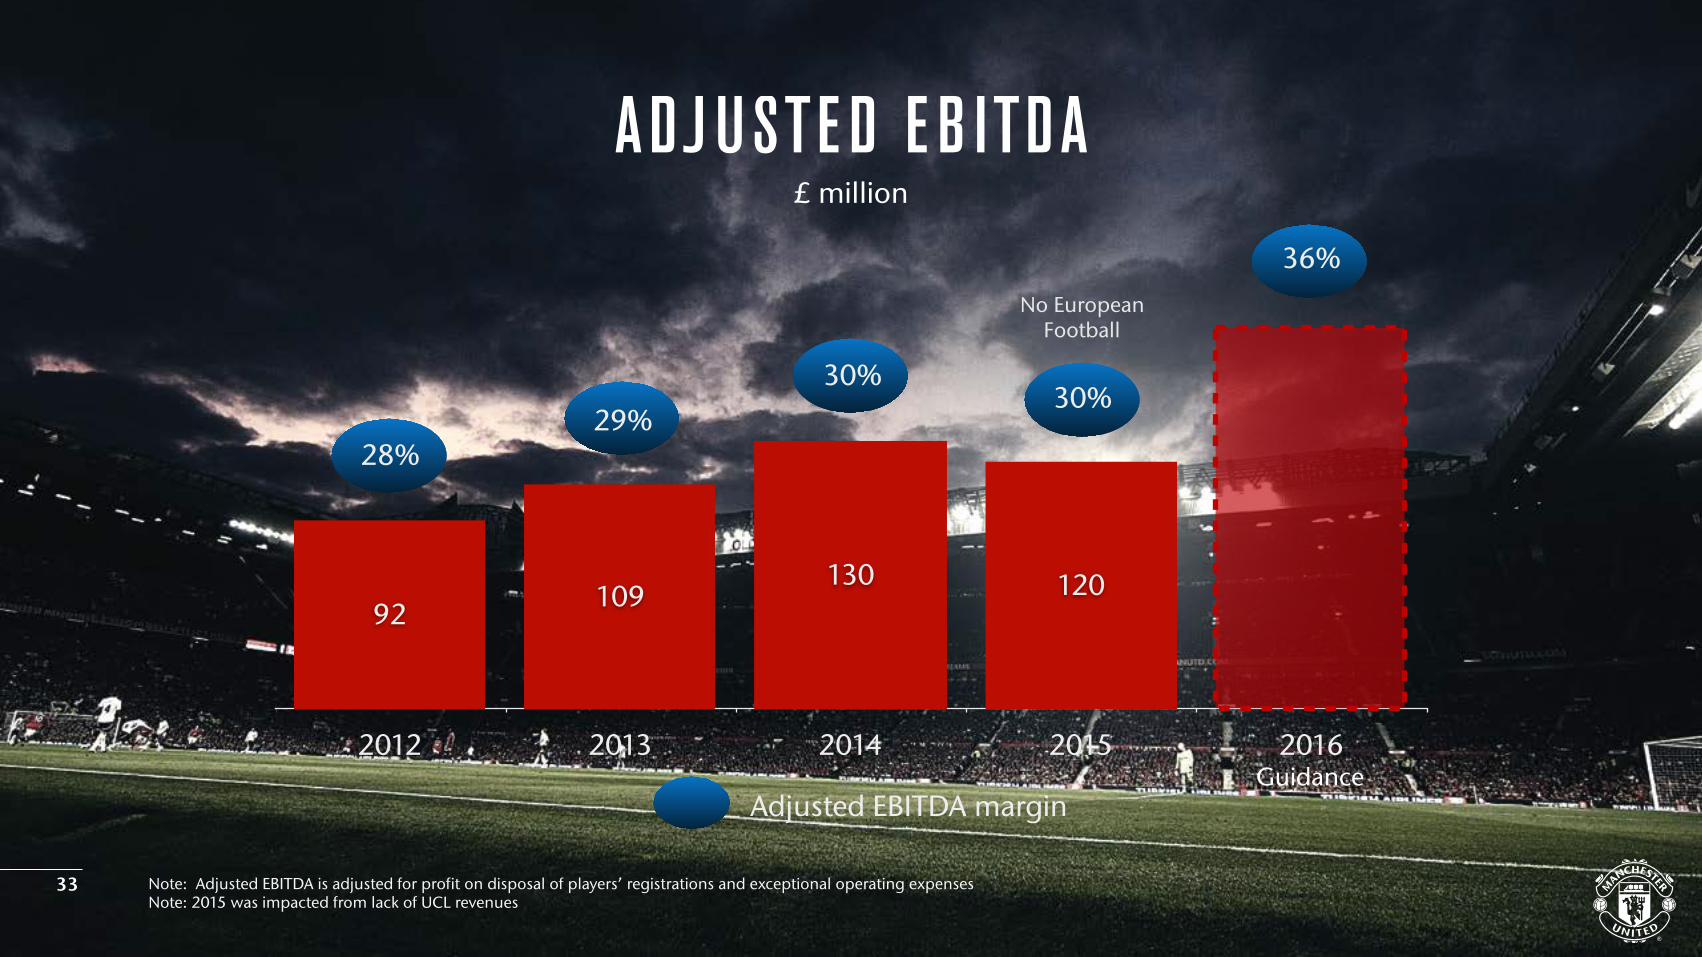
2012 2013 2014 2015 2016
12013010992
30%
ADJ USTE D E B ITDA
Adjusted EBITDA margin
28%29%
30%
£ million
Note: Adjusted EBITDA is adjusted for profit on disposal of players’ registrations and exceptional operating expensesNote: 2015 was impacted from lack of UCL revenues
33
36%
Guidance
No European Football
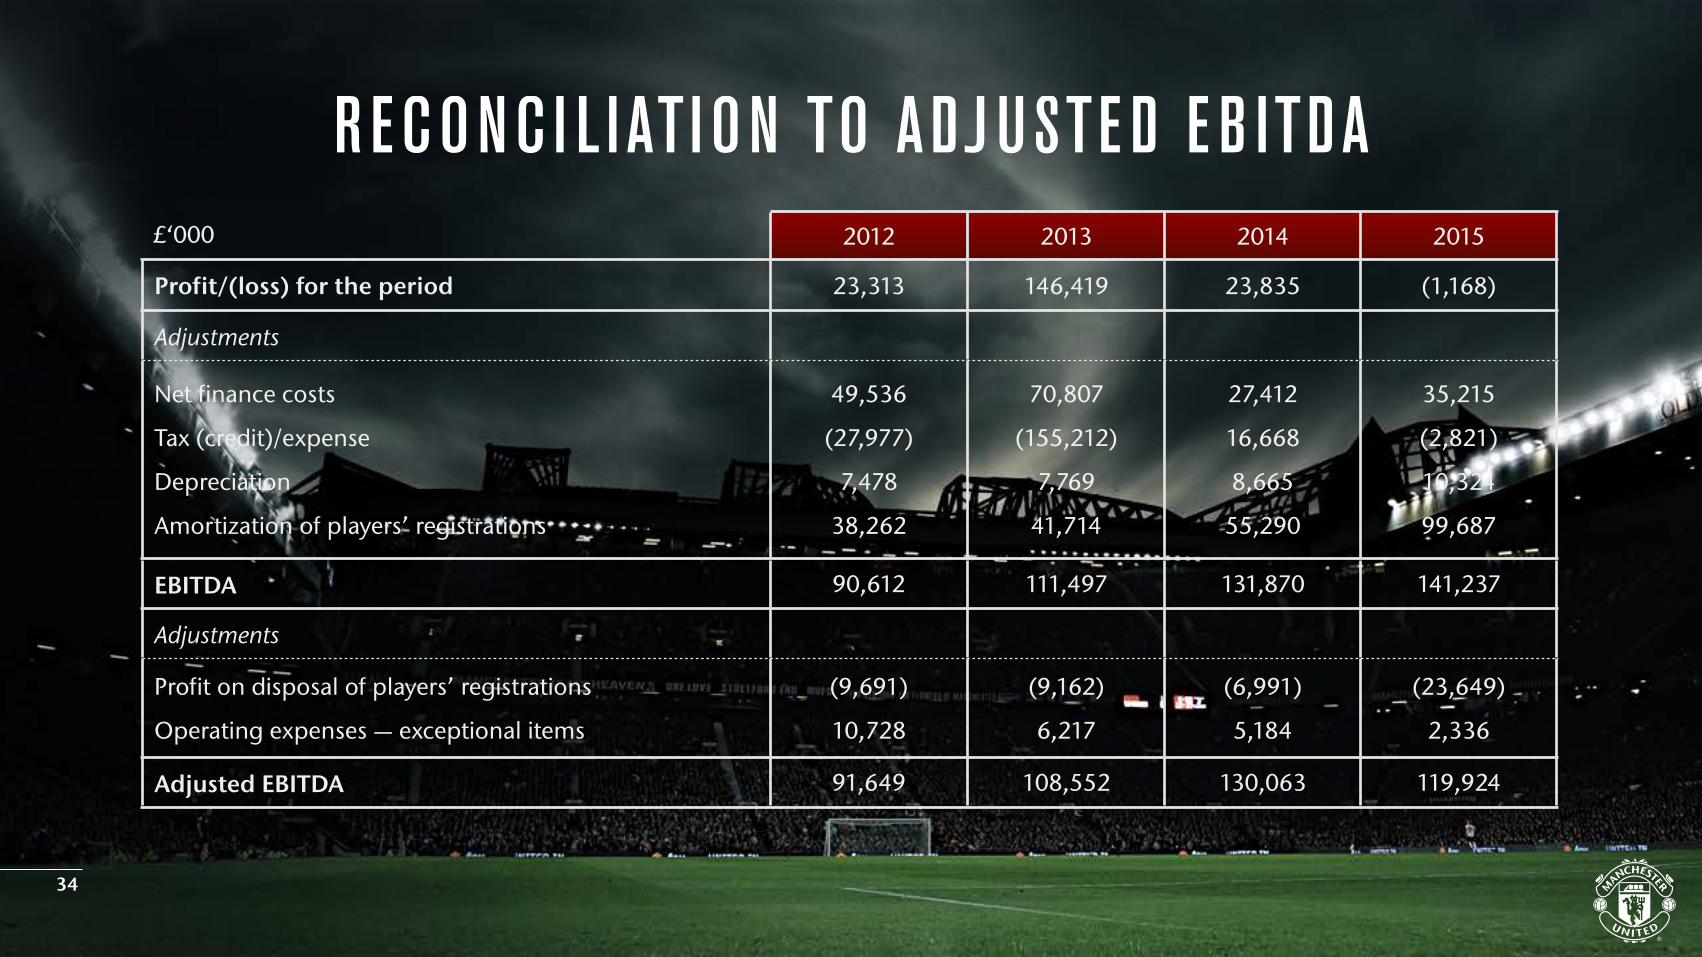
R ECONC I L I ATI ON TO ADJ USTE D E B ITDA
2012 2013 2014 2015
Profit/(loss) for the period 23,313 146,419 23,835 (1,168)
Adjustments
Net finance costs
Tax (credit)/expense
Depreciation
Amortization of players’ registrations
49,536
(27,977)
7,478
38,262
70,807
(155,212)
7,769
41,714
27,412
16,668
8,665
55,290
35,215
(2,821)
10,324
99,687
EBITDA 90,612 111,497 131,870 141,237
Adjustments
Profit on disposal of players’ registrations
Operating expenses — exceptional items
(9,691)
10,728
(9,162)
6,217
(6,991)
5,184
(23,649)
2,336
Adjusted EBITDA 91,649 108,552 130,063 119,924
34
£‘000