Embed Size (px)
Citation preview
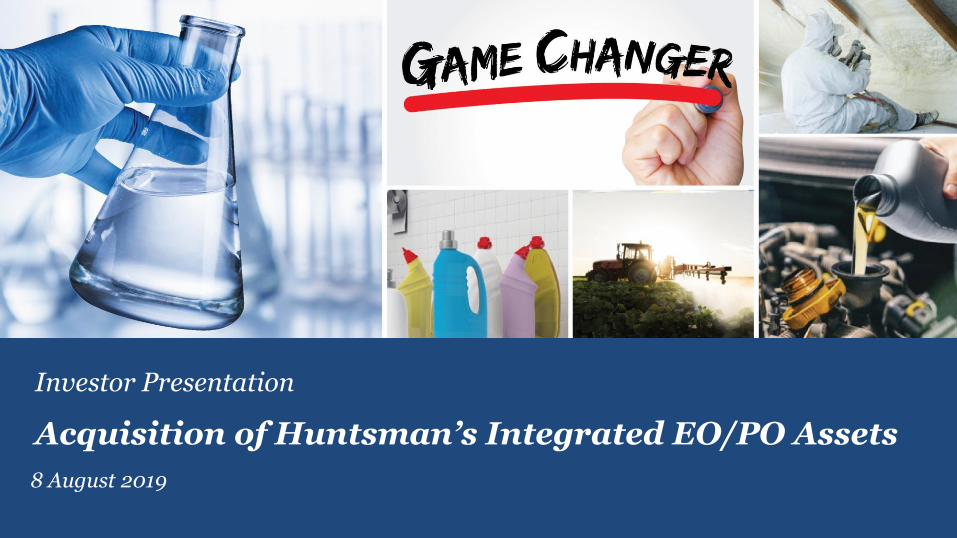
Investor Presentation
Acquisition of Huntsman’s Integrated EO/PO Assets
8 August 2019
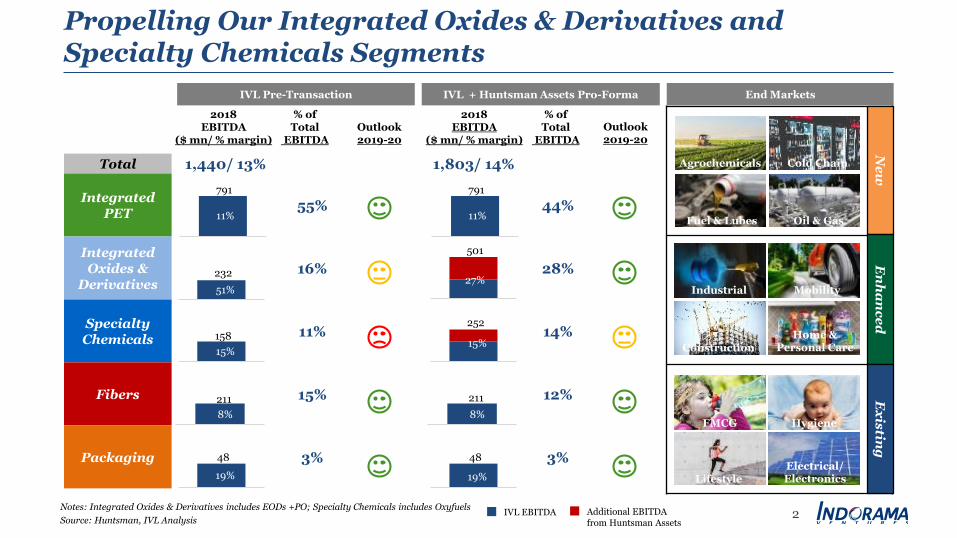
Total 1,440/ 13% 1,803/ 14%
Integrated PET
55% 44%
Integrated Oxides &
Derivatives16% 28%
SpecialtyChemicals
11% 14%
Fibers 15% 12%
Packaging 3% 3%
791
232
158
48
211
2018EBITDA
($ mn/ % margin)
% of Total
EBITDAOutlook2019-20
IVL + Huntsman Assets Pro-Forma
% of Total
EBITDA
Outlook2019-20
791
501
252
48
211
Propelling Our Integrated Oxides & Derivatives and Specialty Chemicals Segments
Notes: Integrated Oxides & Derivatives includes EODs +PO; Specialty Chemicals includes Oxyfuels
Source: Huntsman, IVL Analysis
11%
51%
15%
8%
19%
11%
27%
15%
8%
19%
IVL EBITDA Additional EBITDA from Huntsman Assets
2018EBITDA
($ mn/ % margin)
IVL Pre-Transaction End Markets
Ne
wE
nh
an
ce
dE
xis
ting
Construction
Industrial
Home & Personal Care
Mobility
FMCG Hygiene
Electrical/ElectronicsLifestyle
Fuel & Lubes
Agrochemicals
Oil & Gas
Cold Chain
2
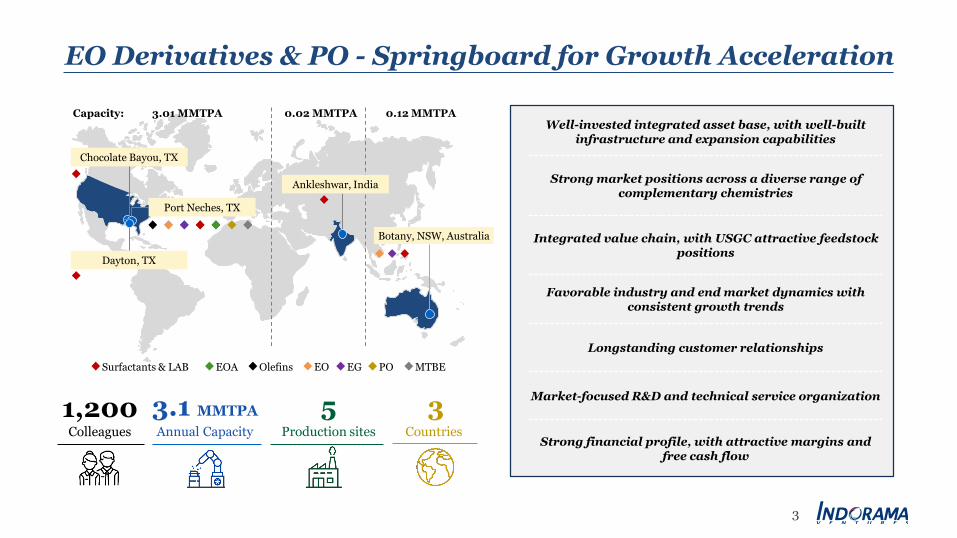
5Production sites
3Countries
EO Derivatives & PO - Springboard for Growth Acceleration
1,200Colleagues
3.1 MMTPA
Annual Capacity
Chocolate Bayou, TX
Port Neches, TX
Dayton, TX
Botany, NSW, Australia
EOA EGSurfactants & LAB MTBEOlefins EO PO
Well-invested integrated asset base, with well-built infrastructure and expansion capabilities
Strong market positions across a diverse range of complementary chemistries
Integrated value chain, with USGC attractive feedstock positions
Favorable industry and end market dynamics with consistent growth trends
Longstanding customer relationships
Market-focused R&D and technical service organization
Strong financial profile, with attractive margins and free cash flow
Capacity: 3.01 MMTPA 0.02 MMTPA 0.12 MMTPA
Ankleshwar, India
3
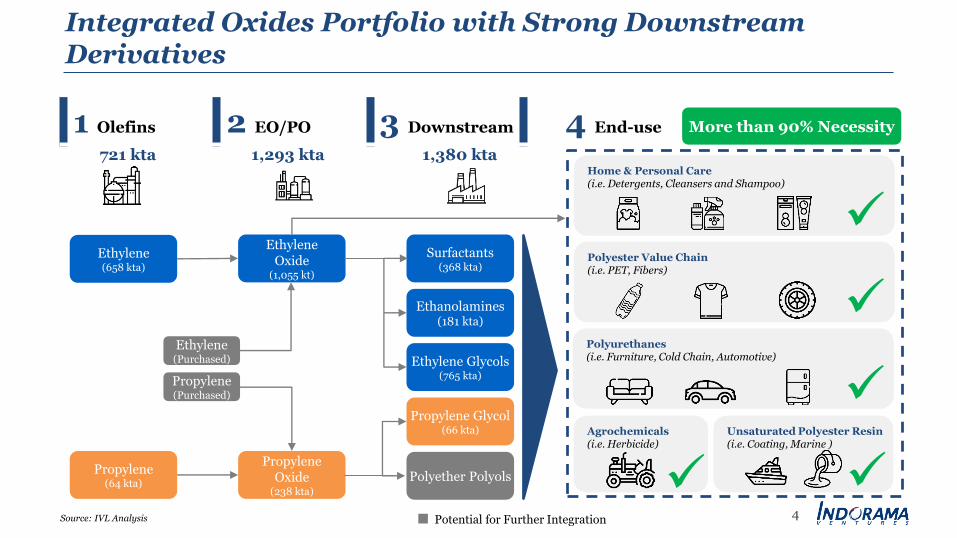
Home & Personal Care(i.e. Detergents, Cleansers and Shampoo)
Integrated Oxides Portfolio with Strong Downstream Derivatives
4Source: IVL Analysis
Ethylene(658 kta)
EthyleneOxide
(1,055 kt)
Surfactants(368 kta)
Ethanolamines(181 kta)
Ethylene Glycols(765 kta)
Propylene(64 kta)
PropyleneOxide
(238 kta)
Propylene Glycol(66 kta)
Polyether Polyols
1 Olefins 2 EO/PO 3 Downstream 4 End-use
Agrochemicals(i.e. Herbicide)
Polyester Value Chain(i.e. PET, Fibers)
Polyurethanes(i.e. Furniture, Cold Chain, Automotive)
Unsaturated Polyester Resin(i.e. Coating, Marine )
721 kta 1,293 kta 1,380 kta
More than 90% Necessity
Potential for Further Integration
Ethylene(Purchased)
Propylene(Purchased)

IVL’s Downstream Integration and Portfolio Diversification Strategy Provides Steady and Visible Earnings
0%
5%
10%
15%
20%
2014 2015 2016 2017 2018
Asian Petchems IVL + Huntsman's Assets Pro-Forma
EBITDA Margin
IVL Pro-Forma vs. Asian Petchems(*)
5Note: *Asian Petchems include: Hanwha, PTTGC, Lotte Chemical, and Formosa Petrochemical
Source: Eikon, IVL Analysis
Key Products
IVL+
Huntsman Assets
Typical AsianPetchem
Companies
Integrated PTA/PET
Surfactants
Ethylene Oxide
Propylene Oxide
Ethylene Glycol
Fiber
Polyethylene
Polypropylene
Ethylene Glycol
Aromatics (BTX)
Refined Products
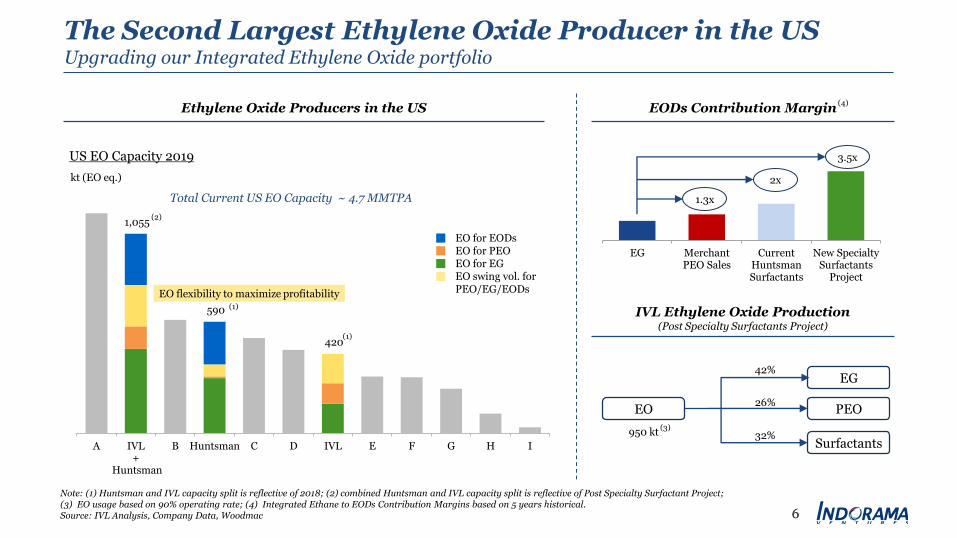
1,055
590
420
A IVL+
Huntsman
B Huntsman C D IVL E F G H I
Note: (1) Huntsman and IVL capacity split is reflective of 2018; (2) combined Huntsman and IVL capacity split is reflective of Post Specialty Surfactant Project; (3) EO usage based on 90% operating rate; (4) Integrated Ethane to EODs Contribution Margins based on 5 years historical.Source: IVL Analysis, Company Data, Woodmac
The Second Largest Ethylene Oxide Producer in the USUpgrading our Integrated Ethylene Oxide portfolio
Total Current US EO Capacity ~ 4.7 MMTPA
kt (EO eq.)
Ethylene Oxide Producers in the US
EO for EODsEO for PEOEO for EGEO swing vol. for PEO/EG/EODs
US EO Capacity 2019
6
EG MerchantPEO Sales
CurrentHuntsmanSurfactants
New SpecialtySurfactants
Project
EODs Contribution Margin
IVL Ethylene Oxide Production(Post Specialty Surfactants Project)
1.3x
2x
3.5x
EO flexibility to maximize profitability(1)
(1)
(2)
EO
EG
PEO
Surfactants
42%
26%
32%950 kt(3)
(4)
6
7Note: EODs excluding EG
Source: Woodmac, Valence Group, IVL Analysis
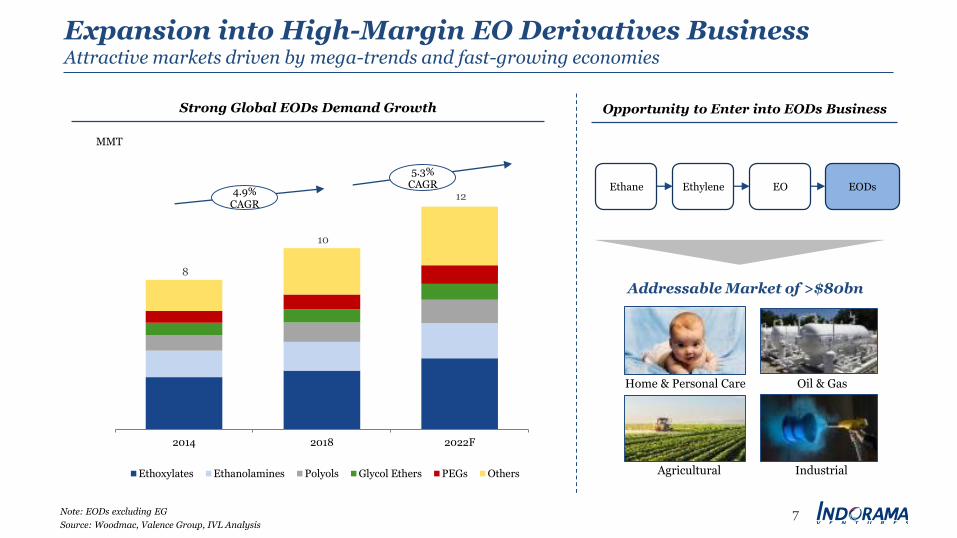
Expansion into High-Margin EO Derivatives BusinessAttractive markets driven by mega-trends and fast-growing economies
8
10
12
2014 2018 2022F
Ethoxylates Ethanolamines Polyols Glycol Ethers PEGs Others
4.9%CAGR
5.3%CAGR
Strong Global EODs Demand Growth
MMT
Opportunity to Enter into EODs Business
Ethane Ethylene EO EODs
Home & Personal Care
Agricultural
Oil & Gas
Industrial
Addressable Market of >$80bn
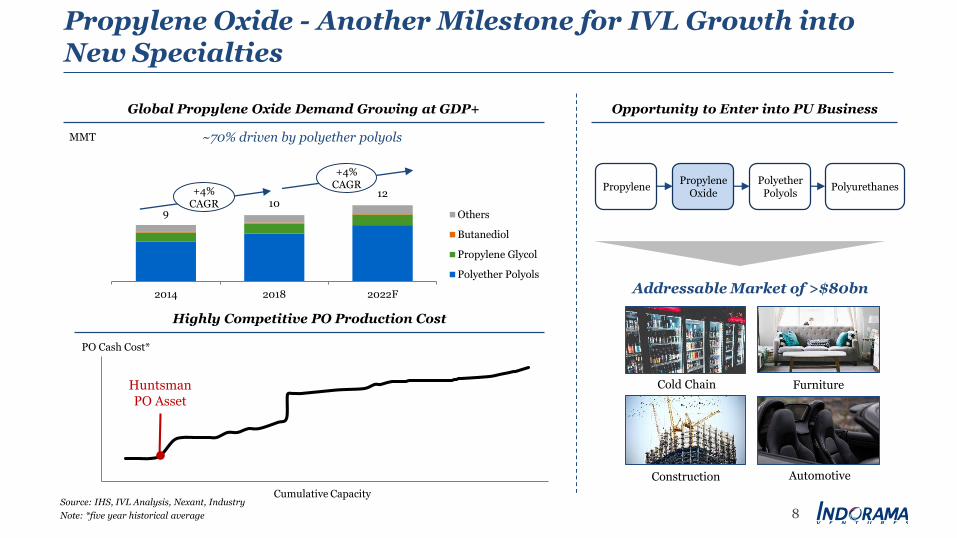
910
12
2014 2018 2022F
Others
Butanediol
Propylene Glycol
Polyether Polyols
8Source: IHS, IVL Analysis, Nexant, Industry
Note: *five year historical average
Propylene Oxide - Another Milestone for IVL Growth into New Specialties
Global Propylene Oxide Demand Growing at GDP+
MMT
Opportunity to Enter into PU Business
~70% driven by polyether polyols
PropylenePropylene
OxidePolyether
PolyolsPolyurethanes+4%
CAGR
+4%CAGR
Highly Competitive PO Production Cost
Cold Chain
Construction Automotive
Furniture
Addressable Market of >$80bn
0
500
1,000
1,500
2,000
0 1000 2000 3000 4000 5000 6000 7000 8000 9000 10000
PO Cash Cost*
Cumulative Capacity
HuntsmanPO Asset
9Source: Nexant, IHS, Platts, IVL Analysis
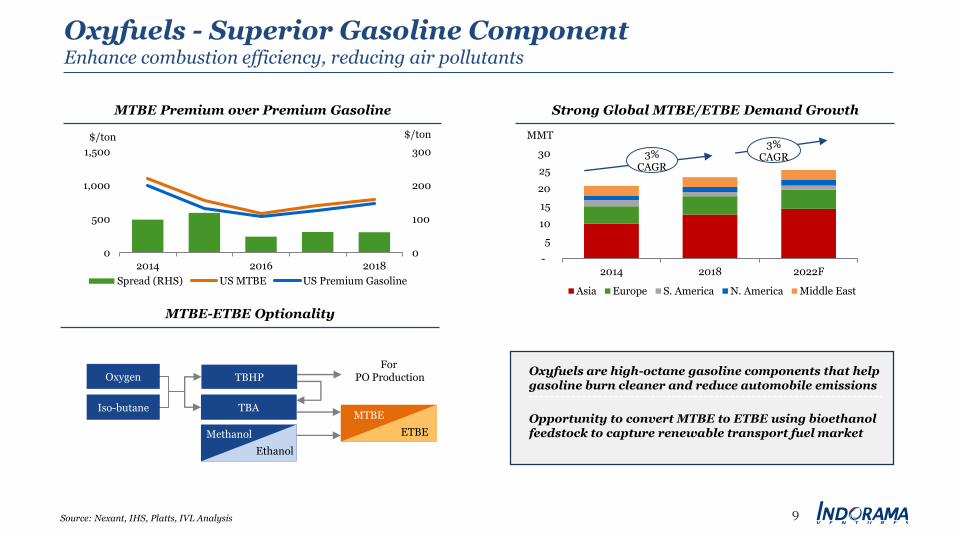
Oxyfuels - Superior Gasoline ComponentEnhance combustion efficiency, reducing air pollutants
MTBE Premium over Premium Gasoline Strong Global MTBE/ETBE Demand Growth
MTBE-ETBE Optionality
0
100
200
300
0
500
1,000
1,500
2014 2016 2018
Spread (RHS) US MTBE US Premium Gasoline
$/ton $/ton
-
5
10
15
20
25
30
2014 2018 2022F
Asia Europe S. America N. America Middle East
3%CAGR
3%CAGR
MMT
TBA
Methanol
Ethanol
MTBE
ETBE
TBHP
Iso-butane
OxygenFor
PO ProductionOxyfuels are high-octane gasoline components that help gasoline burn cleaner and reduce automobile emissions
Opportunity to convert MTBE to ETBE using bioethanolfeedstock to capture renewable transport fuel market
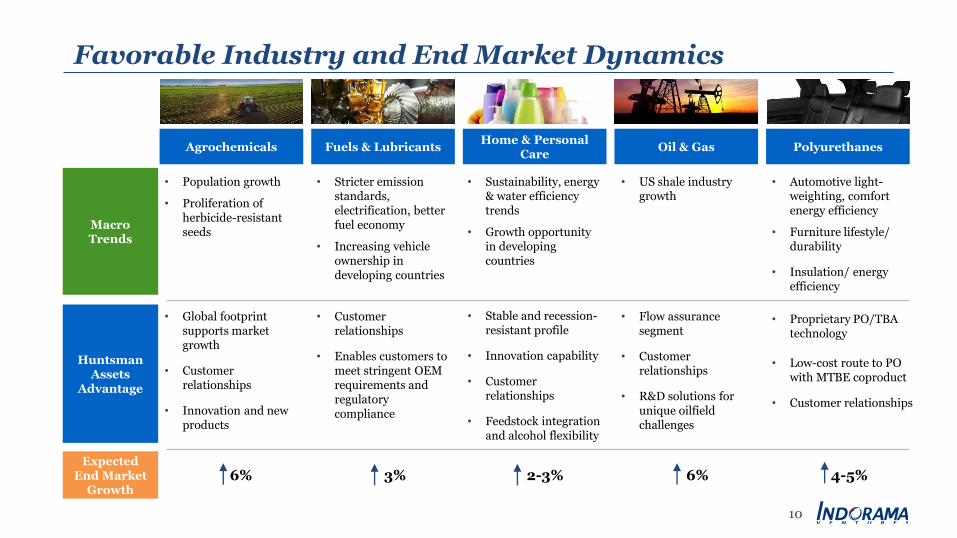
Favorable Industry and End Market Dynamics
• Population growth
• Proliferation of herbicide-resistant seeds
• Global footprint supports market growth
• Customerrelationships
• Innovation and new products
Huntsman Assets
Advantage
Macro Trends
Agrochemicals Fuels & LubricantsHome & Personal
CareOil & Gas Polyurethanes
• Stricter emission standards, electrification, better fuel economy
• Increasing vehicle ownership in developing countries
• Customerrelationships
• Enables customers to meet stringent OEM requirements and regulatory compliance
• Sustainability, energy & water efficiency trends
• Growth opportunity in developing countries
• Stable and recession-resistant profile
• Innovation capability
• Customerrelationships
• Feedstock integration and alcohol flexibility
• US shale industry growth
• Flow assurance segment
• Customerrelationships
• R&D solutions for unique oilfield challenges
• Automotive light-weighting, comfort energy efficiency
• Furniture lifestyle/ durability
• Insulation/ energy efficiency
• Proprietary PO/TBA technology
• Low-cost route to PO with MTBE coproduct
• Customer relationships
Expected End Market
Growth
10
6% 3% 2-3% 6% 4-5%
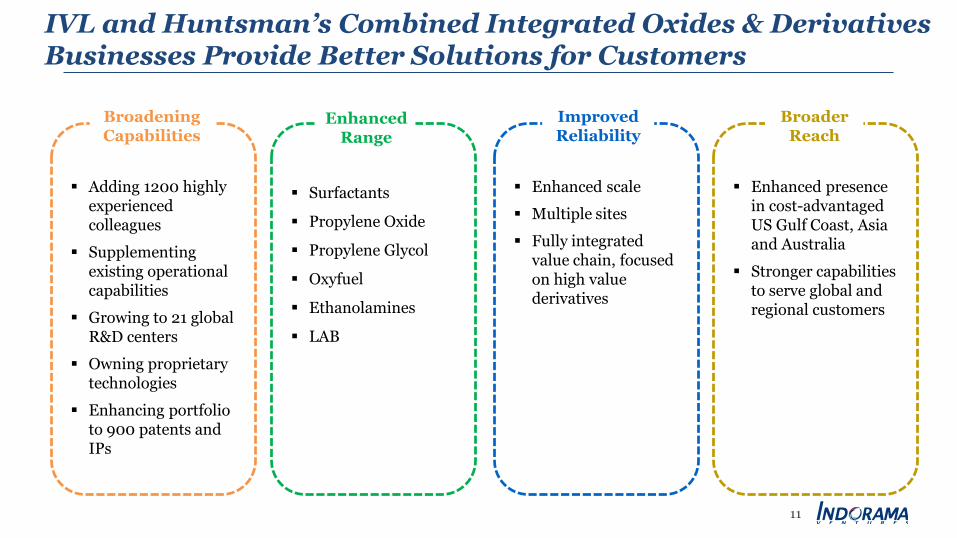
IVL and Huntsman’s Combined Integrated Oxides & Derivatives Businesses Provide Better Solutions for Customers
11
Surfactants
Propylene Oxide
Propylene Glycol
Oxyfuel
Ethanolamines
LAB
Enhanced Range
Enhanced scale
Multiple sites
Fully integrated value chain, focused on high value derivatives
Improved Reliability
Adding 1200 highly experienced colleagues
Supplementing existing operational capabilities
Growing to 21 global R&D centers
Owning proprietary technologies
Enhancing portfolio to 900 patents and IPs
Broadening Capabilities
Enhanced presence in cost-advantaged US Gulf Coast, Asia and Australia
Stronger capabilities to serve global and regional customers
Broader Reach
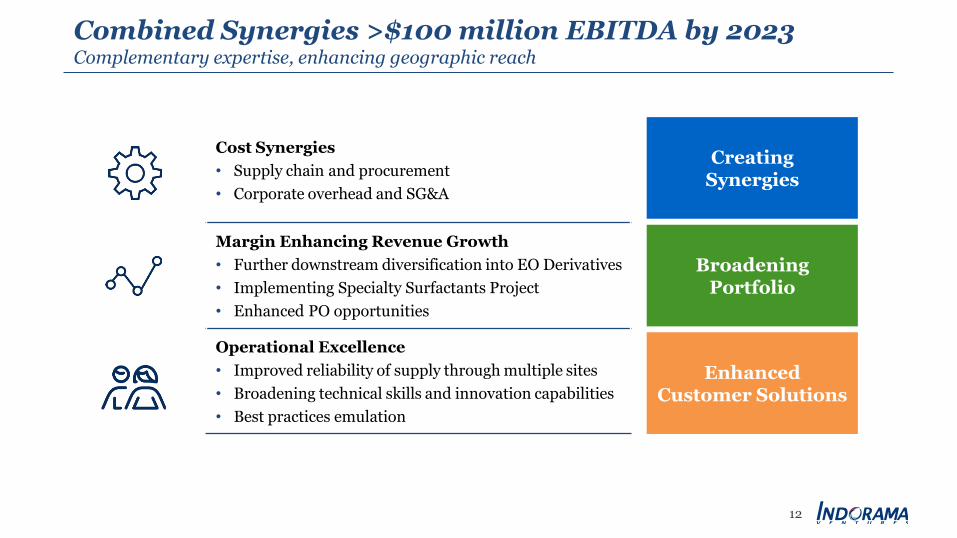
Cost Synergies
• Supply chain and procurement
• Corporate overhead and SG&A
Margin Enhancing Revenue Growth
• Further downstream diversification into EO Derivatives
• Implementing Specialty Surfactants Project
• Enhanced PO opportunities
Operational Excellence
• Improved reliability of supply through multiple sites
• Broadening technical skills and innovation capabilities
• Best practices emulation
Combined Synergies >$100 million EBITDA by 2023Complementary expertise, enhancing geographic reach
12
Creating Synergies
Broadening Portfolio
Enhanced Customer Solutions
13
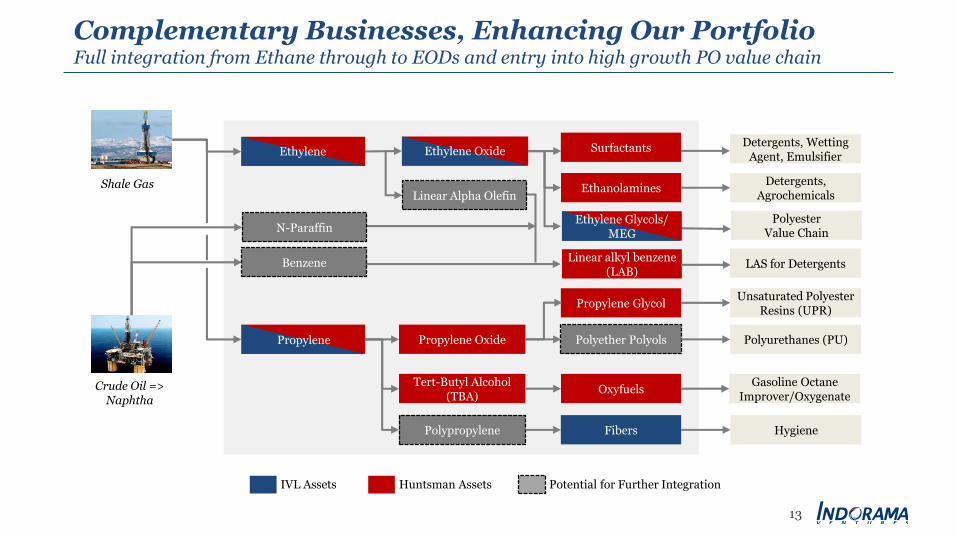
Complementary Businesses, Enhancing Our PortfolioFull integration from Ethane through to EODs and entry into high growth PO value chain
Shale Gas
Crude Oil => Naphtha
IVL Assets
Propylene Oxide Polyether Polyols Polyurethanes (PU)
Ethanolamines
Surfactants
Tert-Butyl Alcohol (TBA)
Oxyfuels
Linear alkyl benzene(LAB)
Gasoline Octane Improver/Oxygenate
Detergents, Wetting Agent, Emulsifier
Detergents, Agrochemicals
Huntsman Assets
Ethylene OxideEthylene
Ethylene Glycols/ MEG
Propylene
Polypropylene Fibers
Potential for Further Integration
Hygiene
Propylene GlycolUnsaturated Polyester
Resins (UPR)
Polyester Value Chain
LAS for Detergents
Linear Alpha Olefin
N-Paraffin
Benzene
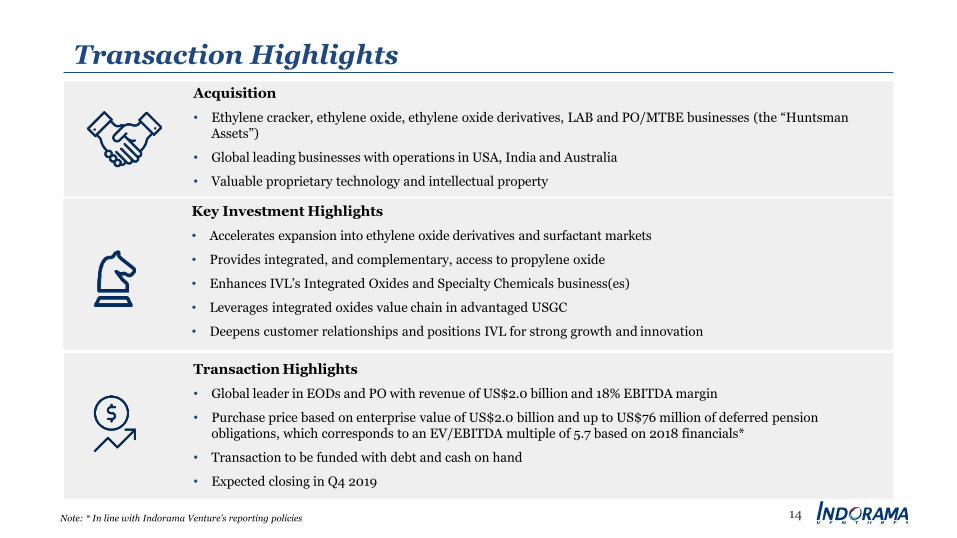
Acquisition
• Ethylene cracker, ethylene oxide, ethylene oxide derivatives, LAB and PO/MTBE businesses (the “Huntsman Assets”)
• Global leading businesses with operations in USA, India and Australia
• Valuable proprietary technology and intellectual property
Key Investment Highlights
• Accelerates expansion into ethylene oxide derivatives and surfactant markets
• Provides integrated, and complementary, access to propylene oxide
• Enhances IVL’s Integrated Oxides and Specialty Chemicals business(es)
• Leverages integrated oxides value chain in advantaged USGC
• Deepens customer relationships and positions IVL for strong growth and innovation
Transaction Highlights
• Global leader in EODs and PO with revenue of US$2.0 billion and 18% EBITDA margin
• Purchase price based on enterprise value of US$2.0 billion and up to US$76 million of deferred pension obligations, which corresponds to an EV/EBITDA multiple of 5.7 based on 2018 financials*
• Transaction to be funded with debt and cash on hand
• Expected closing in Q4 2019
14Note: * In line with Indorama Venture’s reporting policies
Transaction Highlights
15
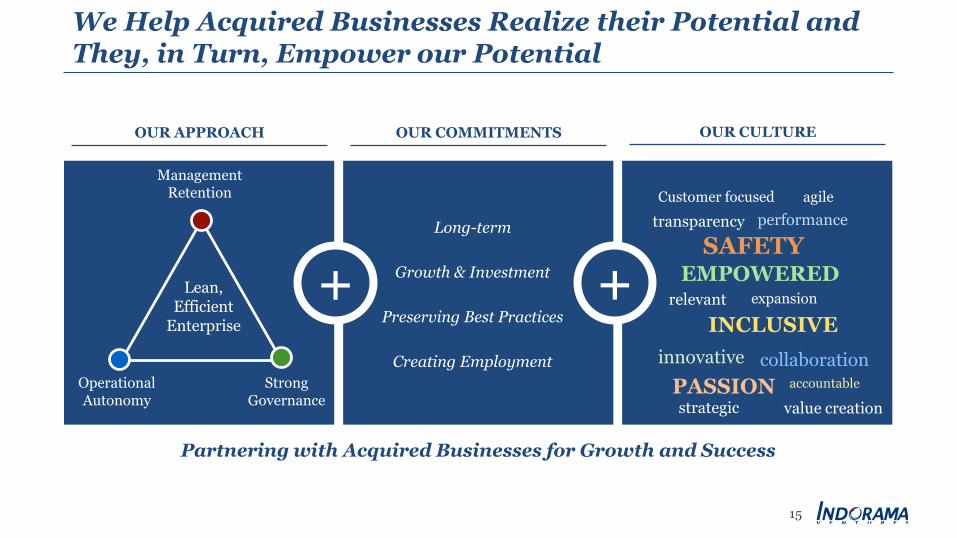
OUR APPROACH OUR COMMITMENTS OUR CULTURE
Long-term
Growth & Investment
Preserving Best Practices
Creating Employment
EMPOWERED
INCLUSIVE
strategic
PASSION
transparency
relevant
Customer focused
accountable
SAFETY
value creation
performance
expansion
innovative
agile
collaboration
Lean, Efficient
Enterprise
Management Retention
Strong Governance
Operational Autonomy
+ +
Partnering with Acquired Businesses for Growth and Success
We Help Acquired Businesses Realize their Potential and They, in Turn, Empower our Potential
This presentation contains “forward-looking” statements of Indorama Ventures Public Company Limited (the “Company”)1 that relate to future events, which are, by their nature, subject to significant risks and uncertainties. All statements, other than statements of historical fact contained herein, including, without limitation, those regarding the future financial position and results of operations, strategy, plans, objectives, goals and targets, future developments in the markets where the Company participates or is seeking to participate and anystatements preceded by, followed by or that include the words “target”, “believe”, “expect”, “aim”, “intend”, “will”, “may”, “anticipate”, “would”, “plan”, “could”, “should, “predict”, “project”, “estimate”, “foresee”, “forecast”, “seek” or similar words or expressions areforward-looking statements.
Such forward-looking statements involve known and unknown risks, uncertainties and other important factors beyond the Company’s control that could cause the actual results, performance or achievements of the Company to be materially different from the future results, performance or achievements expressed or implied by such forward-looking statements. These forward-looking statements are based onnumerous assumptions regarding the Company’s present and future business strategies and the environment in which the Company will operate in the future and are not a guarantee of future performance.
Such forward-looking statements speak only as at the date of this presentation, and the Company does not undertake any duty or obligation to supplement, amend, update or revise any such statements. The Company does not make any representation, warranty or prediction that the results anticipated by such forward-looking statements will be achieved.
1Where the context requires, it means the Company, its subsidiaries, joint ventures and associated companies as a group or as members of such group.
Disclaimer