Embed Size (px)
Citation preview

Investor Presentation
Bharti Airtel LimitedJune 2010

Disclaimer
The information contained in this presentation is only current as of its date. All actions and statements made herein or otherwise shall be subject to the applicable laws and regulations as amended from time to time. There is no representation that all information relating to the context has been taken care off in the presentation and neither we undertake any obligation as to the regular updating of the information as a result of new information, future events or otherwise. We will accept no liability whatsoever for any loss arising directly or indirectly from the use of, reliance of any information contained in this presentation or for any omission of the information. The information shall not be distributed or used by any person or entity in any jurisdiction or countries were such distribution or use would be contrary to the applicable laws or Regulations. It is advised that prior to acting upon this presentation independent consultation / advise may be obtained and necessary due diligence, investigation etc may be done at your end. You may also contact us directly for any questions or clarifications at our end.
This presentation contain certain statements of future expectations and other forward-looking statements, including those relating to our general business plans and strategy, our future financial condition and growth prospects, and future developments in our industry and our competitive and regulatory environment. In addition to statements which are forward looking by reason of context, the words ‘may, will, should, expects, plans, intends, anticipates, believes, estimates, predicts, potential or continue’ and similar expressions identify forward looking statements.
Actual results, performances or events may differ materially from these forward-looking statements including the plans, objectives, expectations, estimates and intentions expressed in forward looking statements due to a number of factors, including without limitation future changes or developments in our business, our competitive environment, telecommunications technology and application, and political, economic, legal and social conditions in India. It is cautioned that the foregoing list is not exhaustive
This presentation is not being used in connection with any invitation of an offer or an offer of securities and should not be used as a basis for any investment decision.
Investor Relations :- http://www.bhartiairtel.inFor any queries, write to: [email protected]
“The information contained herein does not constitute an offer of securities for sale in the United States. Securities may not be sold in the United States absent registration or an exemption from registration under the U.S. Securities Act of 1933, as amended. Any public offering of securities to be made in the United States will be made by means of a prospectus and will contain detailed information about the Company and its management, as well as financial statements. No money, securities or other consideration is being solicited, and, if sent in response to the information contained herein, will not be accepted.”

3
Mobile Services Telemedia Services Enterprise Services
Advantage India
Deep Domestic Demand…Huge Growth Potential
Population: 1.2 billion→ increasing urbanisation→ relatively large youth population
GDP Growth (Real) : ~8.6%→ second highest growing economy
GDP Size (PPP adjusted): US$ 3 trillion→ fourth largest economy in the world
Telecom penetration: 55.38% (653.92 mn telecom subs)
→ one of the lowest→ Govt. targets to reach 1 bn telecom
subs by 2015Broadband penetration: 0.78% (9.24mn)
→ one of the lowest→ Govt. target to reach 20 mn.
Broadband subs by 2010
Note: (1) *Telecom and Broadband penetration as at May 31th 2010 as per TRAI press release.
4
Mobile Services Telemedia Services Enterprise Services
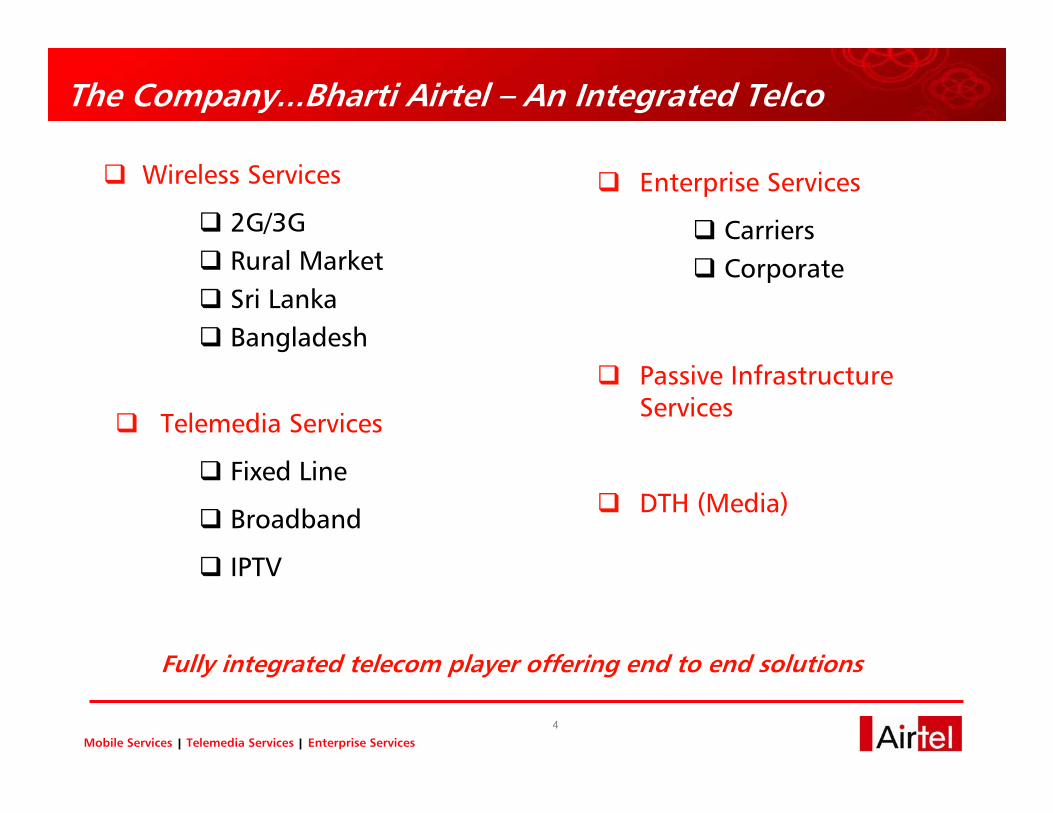
The Company...Bharti Airtel – An Integrated Telco
Wireless Services
2G/3GRural MarketSri LankaBangladesh
Telemedia Services
Fixed Line
Broadband
IPTV
Enterprise Services
CarriersCorporate
Passive Infrastructure Services
DTH (Media)
Fully integrated telecom player offering end to end solutions
5
Mobile Services Telemedia Services Enterprise Services
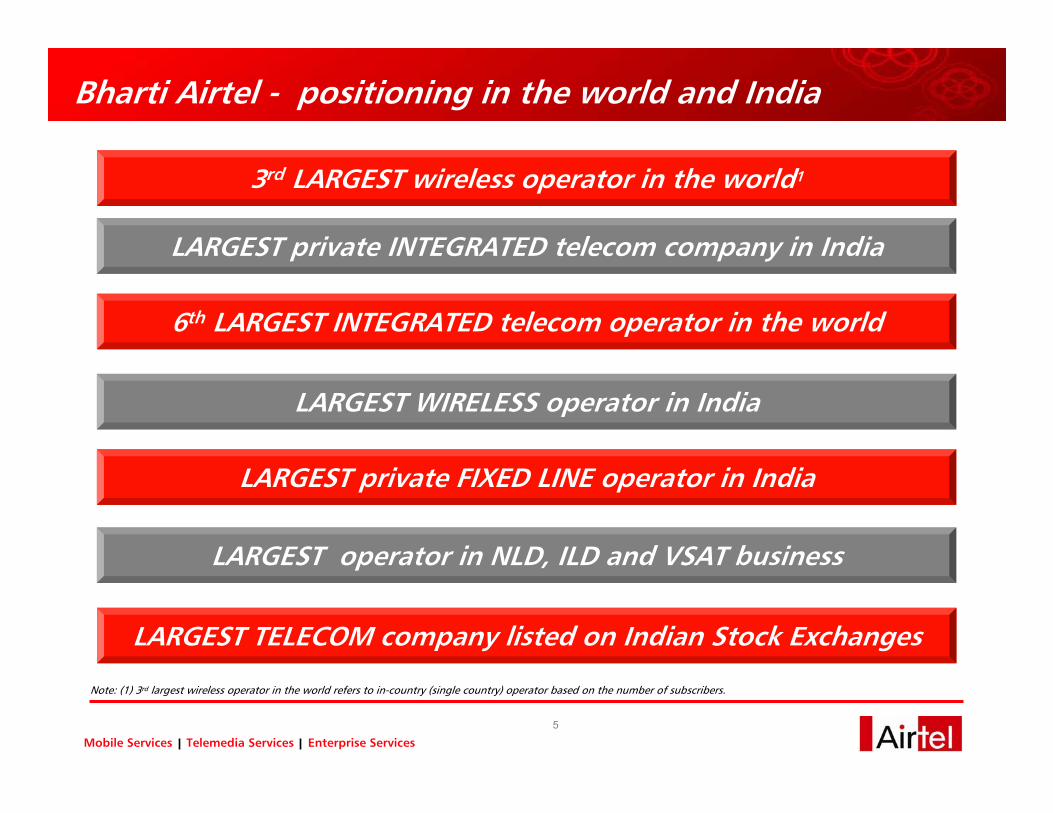
3rd LARGEST wireless operator in the world1
LARGEST operator in NLD, ILD and VSAT business
Bharti Airtel - positioning in the world and India
LARGEST private INTEGRATED telecom company in India
LARGEST WIRELESS operator in India
LARGEST private FIXED LINE operator in India
Note: (1) 3rd largest wireless operator in the world refers to in-country (single country) operator based on the number of subscribers.
LARGEST TELECOM company listed on Indian Stock Exchanges
6th LARGEST INTEGRATED telecom operator in the world
6
Mobile Services Telemedia Services Enterprise Services
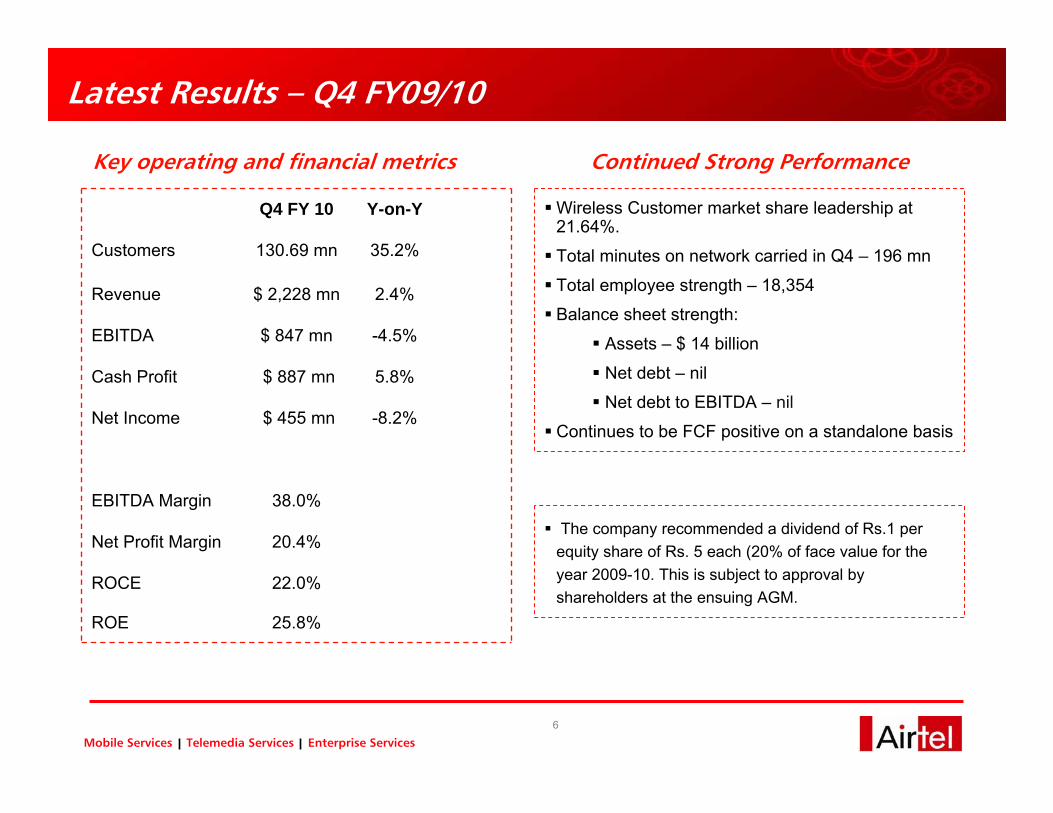
Latest Results – Q4 FY09/10
Key operating and financial metrics
25.8%ROE
22.0%ROCE
20.4%Net Profit Margin
38.0%EBITDA Margin
-8.2%$ 455 mnNet Income
5.8%$ 887 mnCash Profit
-4.5%$ 847 mnEBITDA
2.4%$ 2,228 mnRevenue
35.2%130.69 mnCustomers
Y-on-YQ4 FY 10
Continued Strong Performance
Wireless Customer market share leadership at 21.64%.
Total minutes on network carried in Q4 – 196 mn
Total employee strength – 18,354
Balance sheet strength:
Assets – $ 14 billion
Net debt – nil
Net debt to EBITDA – nil
Continues to be FCF positive on a standalone basis
The company recommended a dividend of Rs.1 per equity share of Rs. 5 each (20% of face value for the year 2009-10. This is subject to approval by shareholders at the ensuing AGM.

7
Mobile Services Telemedia Services Enterprise Services
Segment contribution…Rev, EBITDA and InvestmentREVENUE
82%8%
21%9% 2%
Mobile Services Telemedia ServicesEnterprise Services Passive Infrastructure ServicesOthers
EBITDA
63%
10%
26%
12% -8%
Mobile Services Telemedia ServicesEnterprise Services Passive Infrastructure ServicesOthers
Note: (1) Revenue and EBITDA is gross of inter segment eliminations.
INVESTMENTS
51%
11%14%
22%3%
Mobile Services Telemedia ServicesEnterprise Services Passive Infrastructure ServicesOthers
8
Mobile Services Telemedia Services Enterprise Services
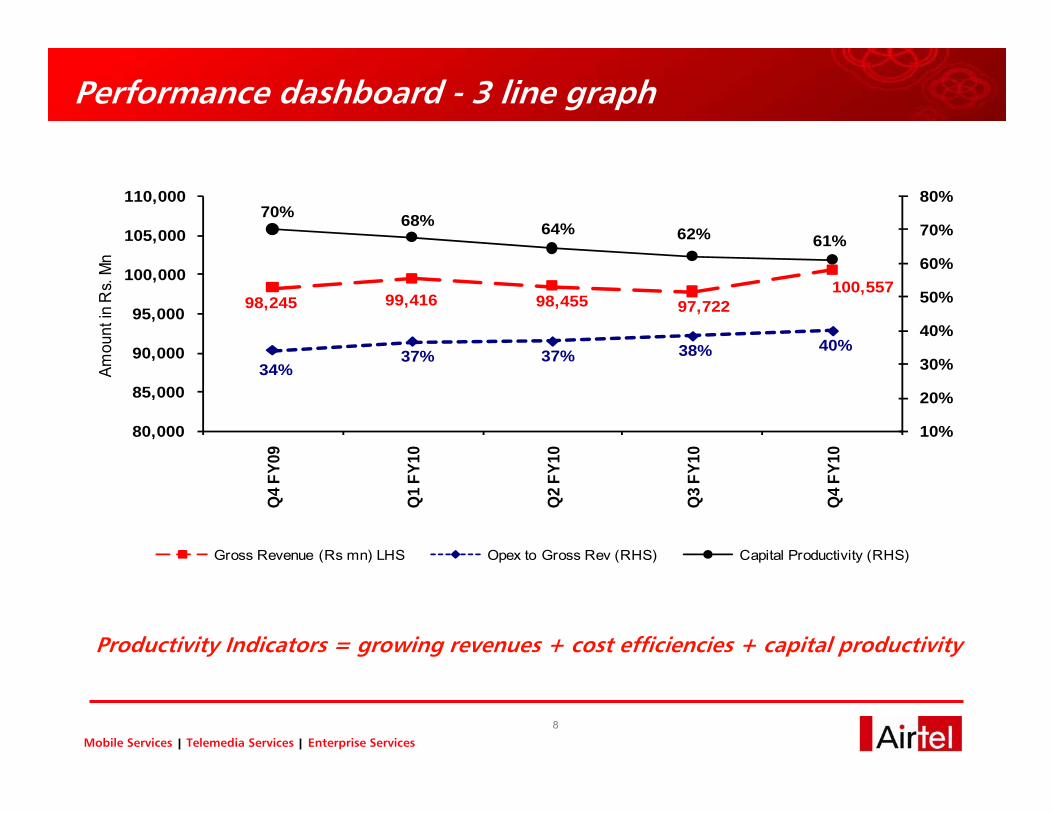
Performance dashboard - 3 line graph
Productivity Indicators = growing revenues + cost efficiencies + capital productivity
98,245 99,416 98,455 97,722 100,557
34%37% 37% 38% 40%
70% 68% 64% 62% 61%
10%
20%
30%
40%
50%
60%
70%
80%
80,000
85,000
90,000
95,000
100,000
105,000
110,000
Q4
FY09
Q1
FY10
Q2
FY10
Q3
FY10
Q4
FY10
Amou
nt in
Rs.
Mn
Gross Revenue (Rs mn) LHS Opex to Gross Rev (RHS) Capital Productivity (RHS)

9
Mobile Services Telemedia Services Enterprise Services
Wireless Services
10
Mobile Services Telemedia Services Enterprise Services
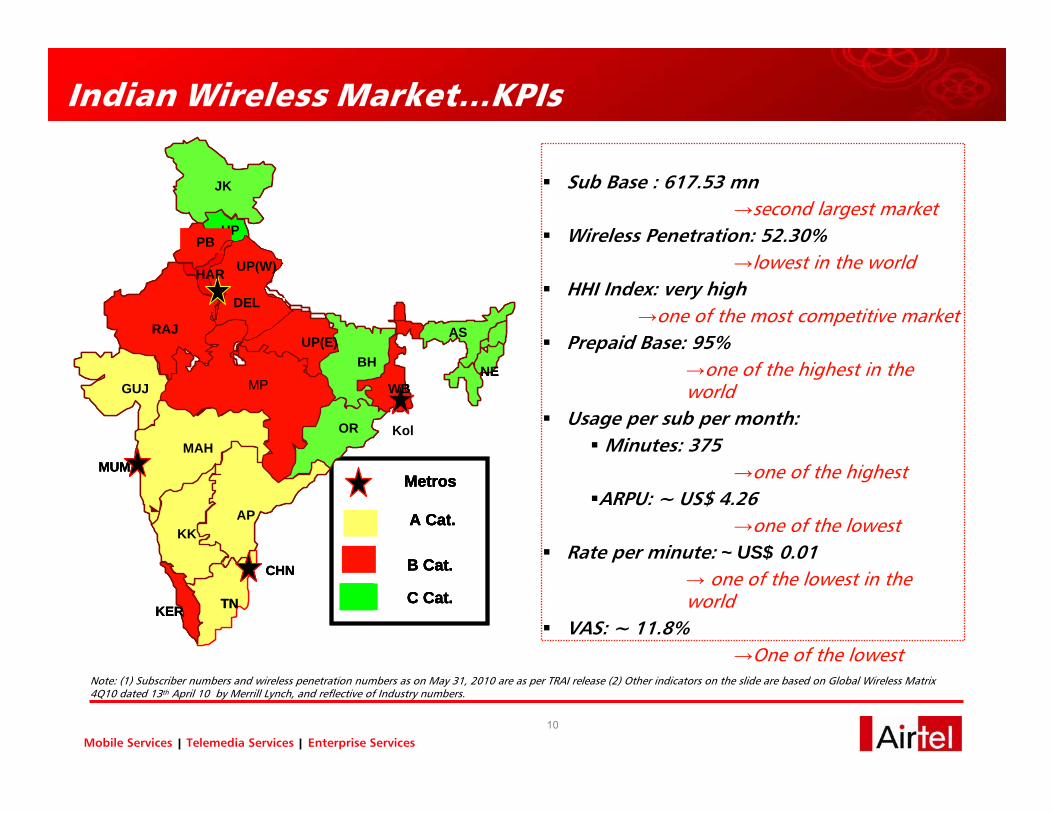
Sub Base : 617.53 mn→second largest market
Wireless Penetration: 52.30%→lowest in the world
HHI Index: very high→one of the most competitive market
Prepaid Base: 95%→one of the highest in the world
Usage per sub per month:Minutes: 375
→one of the highestARPU: ~ US$ 4.26
→one of the lowestRate per minute: ~ US$ 0.01
→ one of the lowest in the world
VAS: ~ 11.8%→One of the lowest
Indian Wireless Market…KPIs
MUM
HP
DELHI
AP
CHN
MADHYA PRADESH`
TNKER
PB
DEL
UP(W)
MP
RAJUP(E)
KK
OR
HAR
JK
BH
WBGUJ
MAH
AS
NE
Metros
A Cat.
B Cat.
C Cat.
MUM
HP
DELHI
AP
CHN
MADHYA PRADESH`
TNKER
PB
DEL
UP(W)
MP
RAJUP(E)
KK
OR
HAR
JK
BH
WBGUJ
MAH
AS
NE
Metros
A Cat.
B Cat.
C Cat.
MUM
HP
DELHI
AP
CHN
MADHYA PRADESH`
TNKER
PB
DEL
UP(W)
MP
RAJUP(E)
KK
OR
HAR
JK
BH
WBGUJ
MAH
AS
NE
Metros
A Cat.
B Cat.
C Cat.
Metros
A Cat.
B Cat.
C Cat.
Kol
Note: (1) Subscriber numbers and wireless penetration numbers as on May 31, 2010 are as per TRAI release (2) Other indicators on the slide are based on Global Wireless Matrix 4Q10 dated 13th April 10 by Merrill Lynch, and reflective of Industry numbers.
11
Mobile Services Telemedia Services Enterprise Services
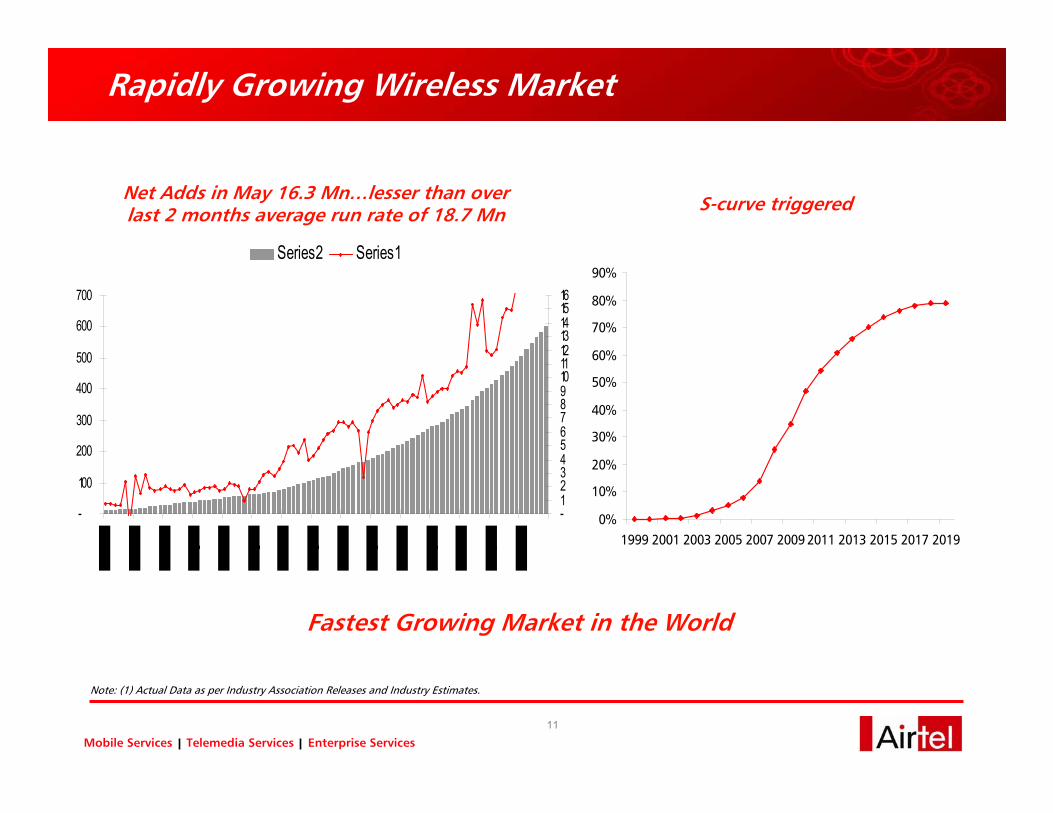
Net Adds in May 16.3 Mn…lesser than over last 2 months average run rate of 18.7 Mn S-curve triggered
Rapidly Growing Wireless Market
Note: (1) Actual Data as per Industry Association Releases and Industry Estimates.
Fastest Growing Market in the World
0%
10%
20%
30%
40%
50%
60%
70%
80%
90%
1999 2001 2003 2005 2007 2009 2011 2013 2015 2017 2019
-
100
200
300
400
500
600
700
-12345678910111213141516
Series2 Series1
12
Mobile Services Telemedia Services Enterprise Services
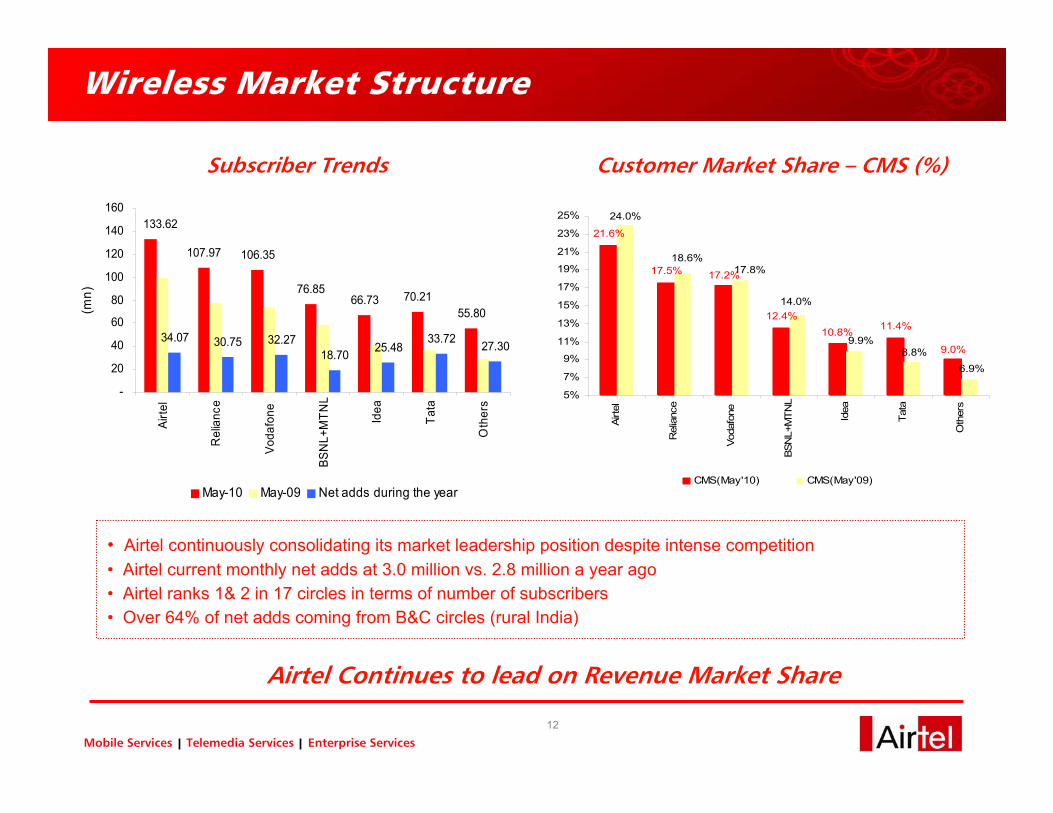
Wireless Market Structure
• Airtel continuously consolidating its market leadership position despite intense competition• Airtel current monthly net adds at 3.0 million vs. 2.8 million a year ago• Airtel ranks 1& 2 in 17 circles in terms of number of subscribers• Over 64% of net adds coming from B&C circles (rural India)
Airtel Continues to lead on Revenue Market Share
Subscriber Trends Customer Market Share – CMS (%)
107.97 106.35
76.8566.73 70.21
55.80
34.07 30.75 32.2718.70 25.48
33.72 27.30
133.62
-
20
40
60
80
100
120
140
160
Airte
l
Rel
ianc
e
Voda
fone
BSN
L+M
TNL
Idea
Tata
Oth
ers
(mn)
May-10 May-09 Net adds during the year
21.6%
17.5%
12.4%11.4%
9.0%
10.8%
17.2%
24.0%
18.6%17.8%
14.0%
9.9%8.8%
6.9%
5%
7%
9%
11%
13%
15%
17%
19%
21%
23%
25%
Airte
l
Rel
ianc
e
Voda
fone
BSN
L+M
TNL
Idea
Tata
Oth
ers
CMS(May'10) CMS(May'09)
13
Mobile Services Telemedia Services Enterprise Services
Company Highlights on Wireless Services
14
Mobile Services Telemedia Services Enterprise Services
14
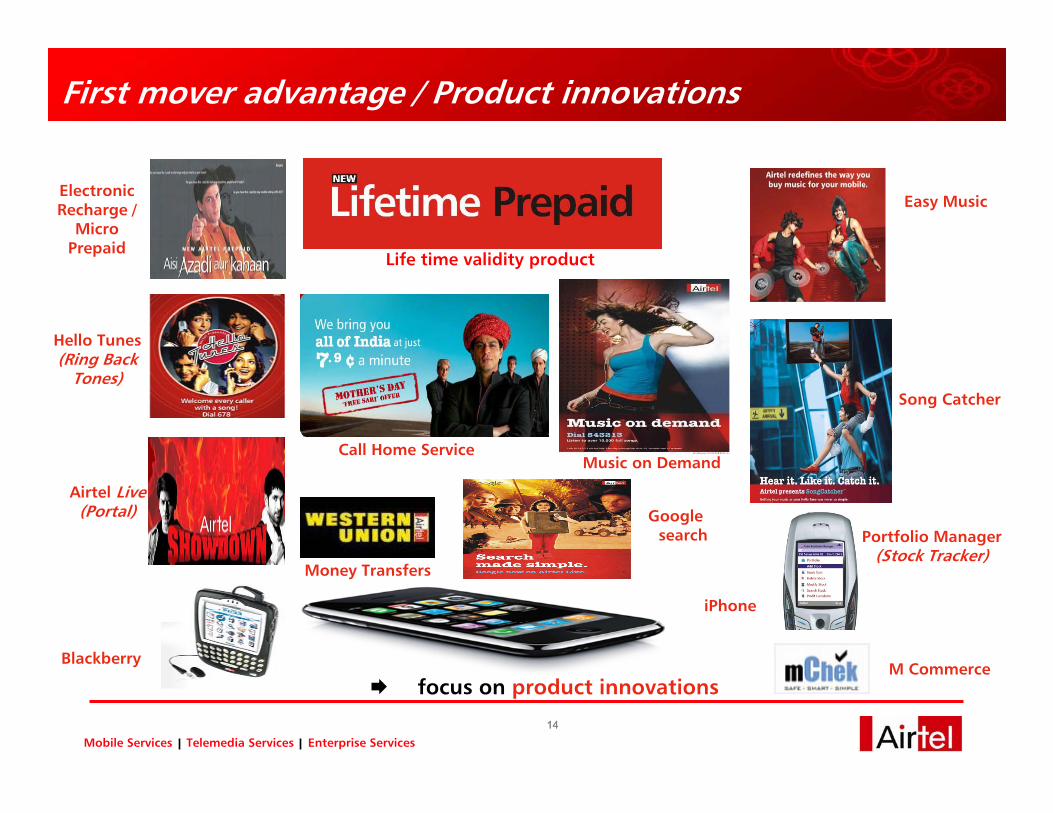
Hello Tunes(Ring Back
Tones)
Portfolio Manager(Stock Tracker)
Blackberry
Airtel Live(Portal)
First mover advantage / Product innovations
Life time validity product
Electronic Recharge /
Micro Prepaid
focus on product innovations
Easy Music
Song Catcher
Call Home Service
Money Transfers
Music on Demand
Google search
M Commerce
iPhone
15
Mobile Services Telemedia Services Enterprise Services
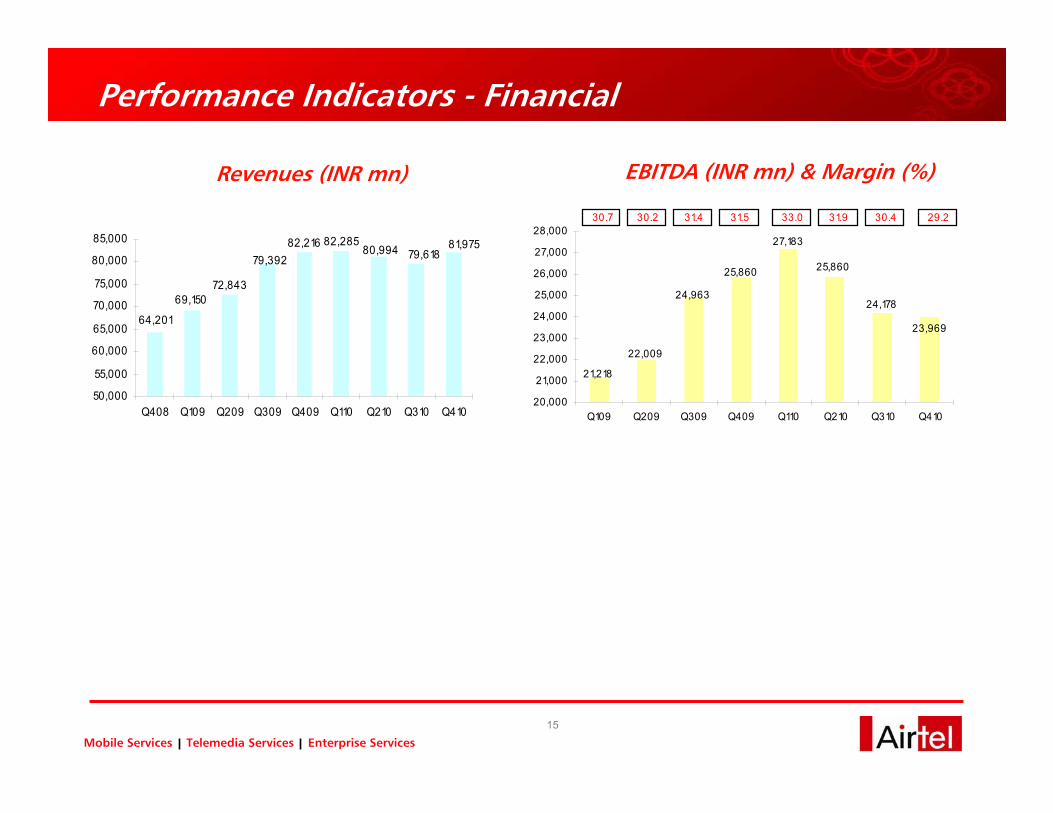
Performance Indicators - Financial
EBITDA (INR mn) & Margin (%)Revenues (INR mn)
23,969
21,218
24,178
25,860
27,183
22,009
24,963
25,860
20,000
21,000
22,000
23,000
24,000
25,000
26,000
27,000
28,000
Q109 Q209 Q309 Q409 Q110 Q210 Q310 Q410
30.7 30.2 31.4 31.5 33.0 31.9 30.4 29.2
81,97579,618
64,201
69,15072,843
79,39282,216 82,285
80,994
50,000
55,000
60,000
65,000
70,000
75,000
80,000
85,000
Q408 Q109 Q209 Q309 Q409 Q110 Q210 Q310 Q410

16
Mobile Services Telemedia Services Enterprise Services
Performance Indicators - Operational
95.8%95.3%95.2%94.7%94.2%93.5%92.9%92.3%91.6%91.0%
97.5%100.4%
101.1%
100.8%99.6%
98.4%95.4%96.3%
97.9%
101.70%
85%
90%
95%
100%
105%
Q308 Q408 Q109 Q209 Q309 Q409 Q110 Q210 Q310 Q410
Prepaid Subs Prepaid Net Adds
Customers & Market Share Prepaid/Postpaid
MoU/Sub/Month & MONARPU & RPM
474 505507 534 526 485 478 450 446 468
123,626115,834
105,21789,058
73,840
130,669140,713
143,680153,241
172,797
370
400
430
460
490
520
550
Q308 Q408 Q109 Q209 Q309 Q409 Q110 Q210 Q310 Q4100
40,000
80,000
120,000
160,000
200,000
MoU/Sub (Min) Total minutes on Network (Mn Min)
127.6118.969.462.0 77.5 85.7 93.9 102.4 110.5
24.0%
24.2%23.7%
23.4%
24.6%24.7%
24.0%
22.6%
21.80%
40.0
50.060.0
70.080.0
90.0
100.0110.0
120.0130.0
140.0
Q408 Q109 Q209 Q309 Q409 Q110 Q210 Q310 Q41020.0%
21.0%
22.0%
23.0%
24.0%
25.0%
26.0%
27.0%
28.0%
Customers (Mn) CMS (%)
0.63 0.580.630.64 0.560.650.700.76 0.52 0.47
358 357350
331 324305
278252
230220
-
0.25
0.50
0.75
1.00
1.25
1.50
Q308 Q408 Q109 Q209 Q309 Q409 Q110 Q210 Q310 Q410200
230
260
290
320
350
380
RPM (Rs .) ARPU (INR)
17
Mobile Services Telemedia Services Enterprise Services
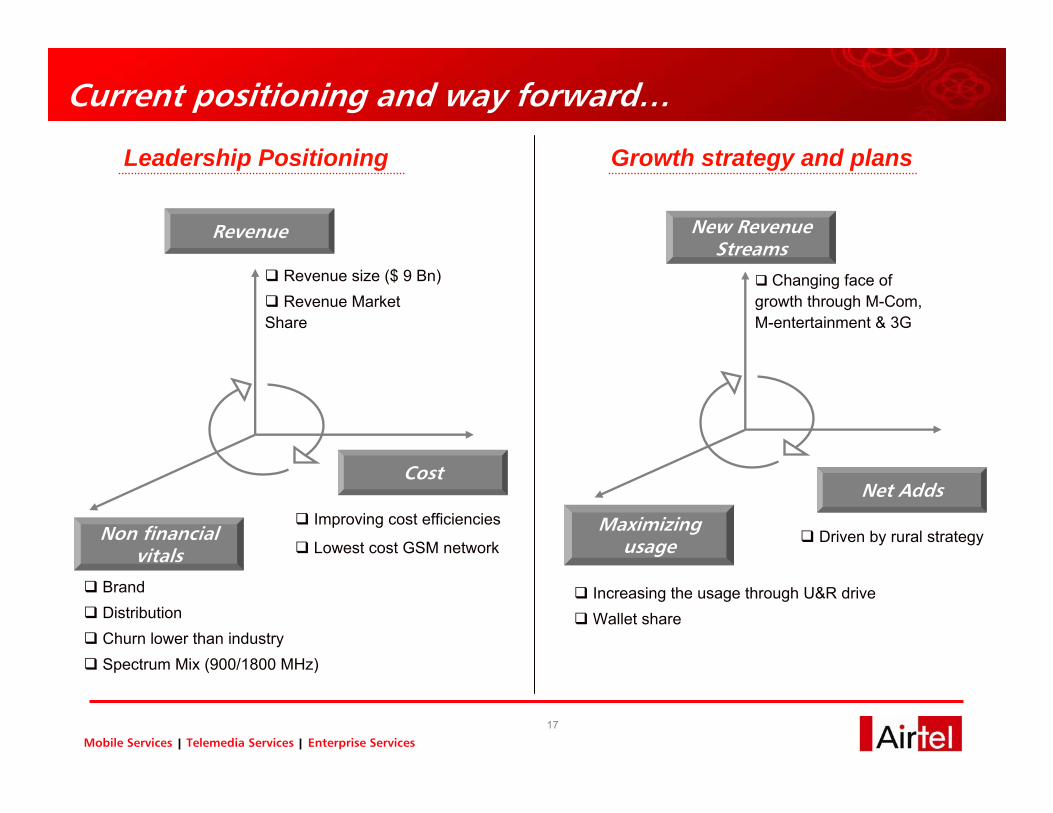
Current positioning and way forward…
BrandDistribution Churn lower than industrySpectrum Mix (900/1800 MHz)
Improving cost efficiencies
Lowest cost GSM network
Revenue size ($ 9 Bn)Revenue Market
Share
Increasing the usage through U&R driveWallet share
Driven by rural strategy
Changing face of growth through M-Com, M-entertainment & 3G
Leadership Positioning Growth strategy and plans
Revenue
Non financial vitals
Cost
New Revenue Streams
Net Adds
Maximizing usage

18
Mobile Services Telemedia Services Enterprise Services
Telemedia Services
19
Mobile Services Telemedia Services Enterprise Services
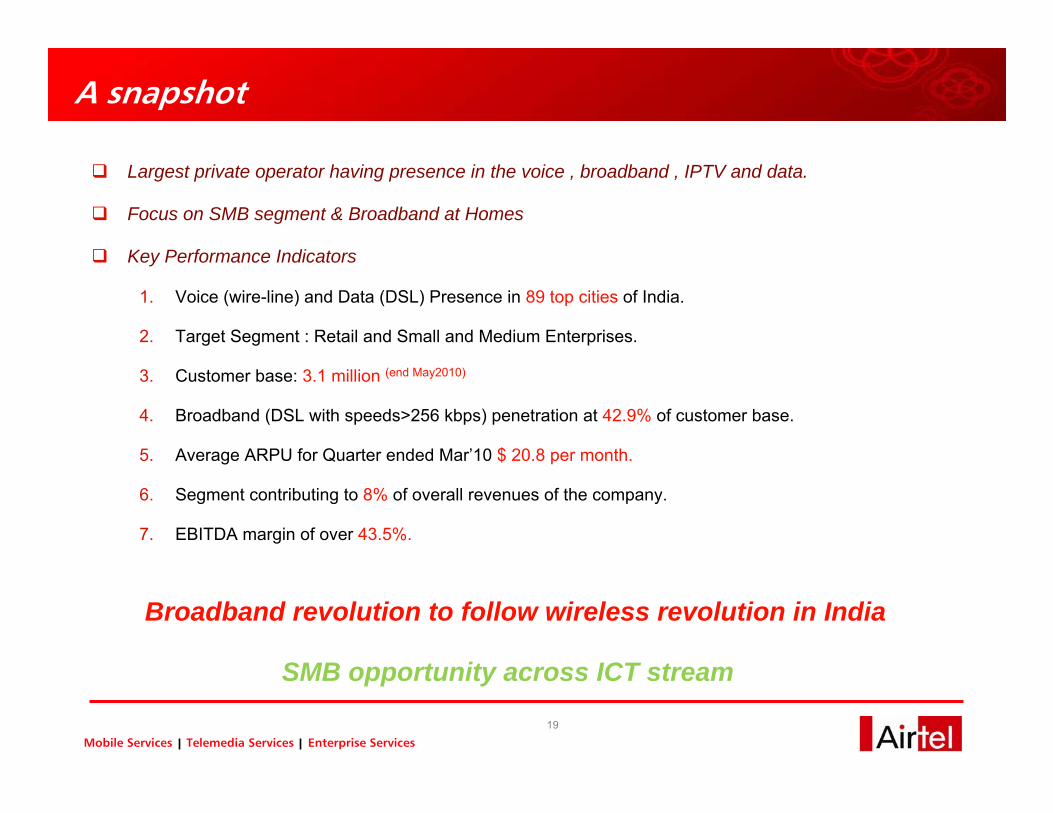
A snapshot
Largest private operator having presence in the voice , broadband , IPTV and data.
Focus on SMB segment & Broadband at Homes
Key Performance Indicators
1. Voice (wire-line) and Data (DSL) Presence in 89 top cities of India.
2. Target Segment : Retail and Small and Medium Enterprises.
3. Customer base: 3.1 million (end May2010)
4. Broadband (DSL with speeds>256 kbps) penetration at 42.9% of customer base.
5. Average ARPU for Quarter ended Mar’10 $ 20.8 per month.
6. Segment contributing to 8% of overall revenues of the company.
7. EBITDA margin of over 43.5%.
Broadband revolution to follow wireless revolution in India
SMB opportunity across ICT stream
20
Mobile Services Telemedia Services Enterprise Services
20
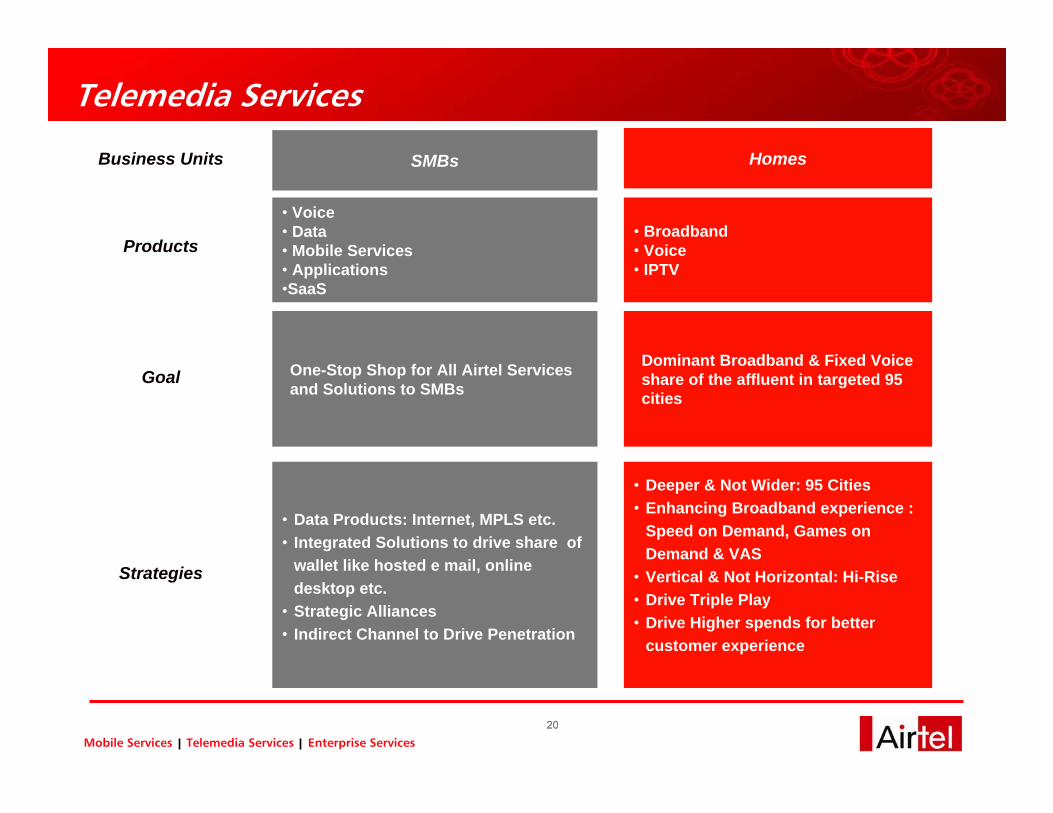
Telemedia Services
Business Units SMBs Homes
Products
• Voice• Data• Mobile Services• Applications•SaaS
• Broadband• Voice• IPTV
Goal One-Stop Shop for All Airtel Services and Solutions to SMBs
Dominant Broadband & Fixed Voice share of the affluent in targeted 95 cities
Strategies
• Data Products: Internet, MPLS etc.• Integrated Solutions to drive share of
wallet like hosted e mail, online desktop etc.
• Strategic Alliances• Indirect Channel to Drive Penetration
• Deeper & Not Wider: 95 Cities• Enhancing Broadband experience :
Speed on Demand, Games on Demand & VAS
• Vertical & Not Horizontal: Hi-Rise• Drive Triple Play• Drive Higher spends for better
customer experience

21
Mobile Services Telemedia Services Enterprise Services
21
Product Portfolio
22
Mobile Services Telemedia Services Enterprise Services
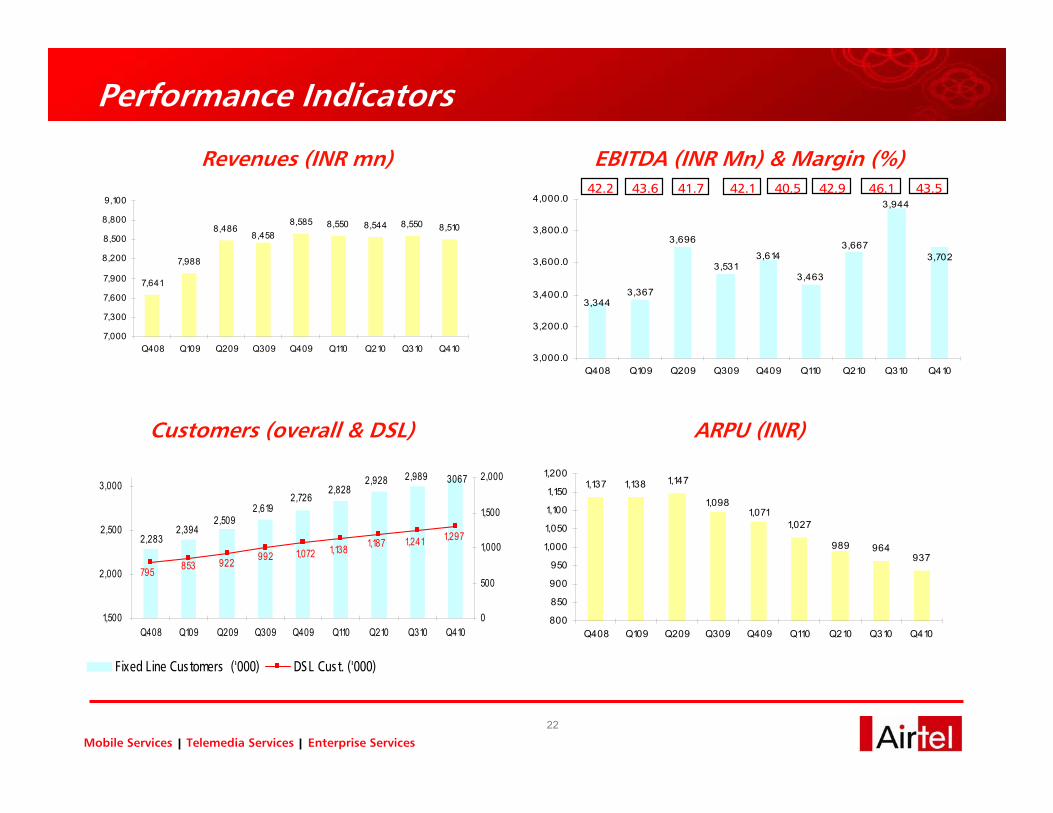
Performance Indicators
30672,9892,9282,828
2,3942,509
2,6192,726
2,283 1,2971,2411,1871,1381,072992922853795
1,500
2,000
2,500
3,000
Q408 Q109 Q209 Q309 Q409 Q110 Q210 Q310 Q4100
500
1,000
1,500
2,000
Fixed Line Customers ('000) DSL Cust. ('000)
1,137 1,138 1,147
1,027
964937
1,0981,071
989
800
850
900
950
1,000
1,050
1,100
1,150
1,200
Q408 Q109 Q209 Q309 Q409 Q110 Q210 Q310 Q410
3,702
3,3443,367
3,696
3,5313,614
3,463
3,667
3,944
3,000.0
3,200.0
3,400.0
3,600.0
3,800.0
4,000.0
Q408 Q109 Q209 Q309 Q409 Q110 Q210 Q310 Q410
42.2 43.6 41.7 42.1 40.5 42.9 46.1 43.5
Customers (overall & DSL) ARPU (INR)
Revenues (INR mn) EBITDA (INR Mn) & Margin (%)
7,641
7,988
8,4868,585 8,550 8,544 8,550 8,510
8,458
7,000
7,300
7,600
7,900
8,200
8,500
8,800
9,100
Q408 Q109 Q209 Q309 Q409 Q110 Q210 Q310 Q410

23
Mobile Services Telemedia Services Enterprise Services
Enterprise Services
24
Mobile Services Telemedia Services Enterprise Services
A snapshot
Enterprise Services provides a broad portfolio of services to large Enterprise and Carrier customers
Corporates: Single point of contact for all telecommunication needs for Top 2500 corporate
customers, providing full suite of voice, data, and managed communications solutions
Carriers: Wholesale voice and data services to over 30 domestic and 450 international
telecommunications carriers, as well as ILD and NLD carriage for Airtel’s own customers
Extensive national and international infrastructure
Pan-India network with 126,357 Route kms of optical fiber, over 4,150 MPLS and SDH POPs
Access network (terrestrial) in 89 cities, Wimax network in 143 cities, and over 1,500 local POIs
International network with 225,000 Route Kms, connecting over 50 countries
Key Performance Indicators (Q4 ‘10)
NLD Minutes Carried: 15.9 Billion ; ILD Minutes Carried: 3.2 Billion
Revenue: Rs.20,738 Million (21 % Segment Contribution Share)
EBITDA: Rs. 9,846 Million (47.5% EBITA Margin)
25
Mobile Services Telemedia Services Enterprise Services
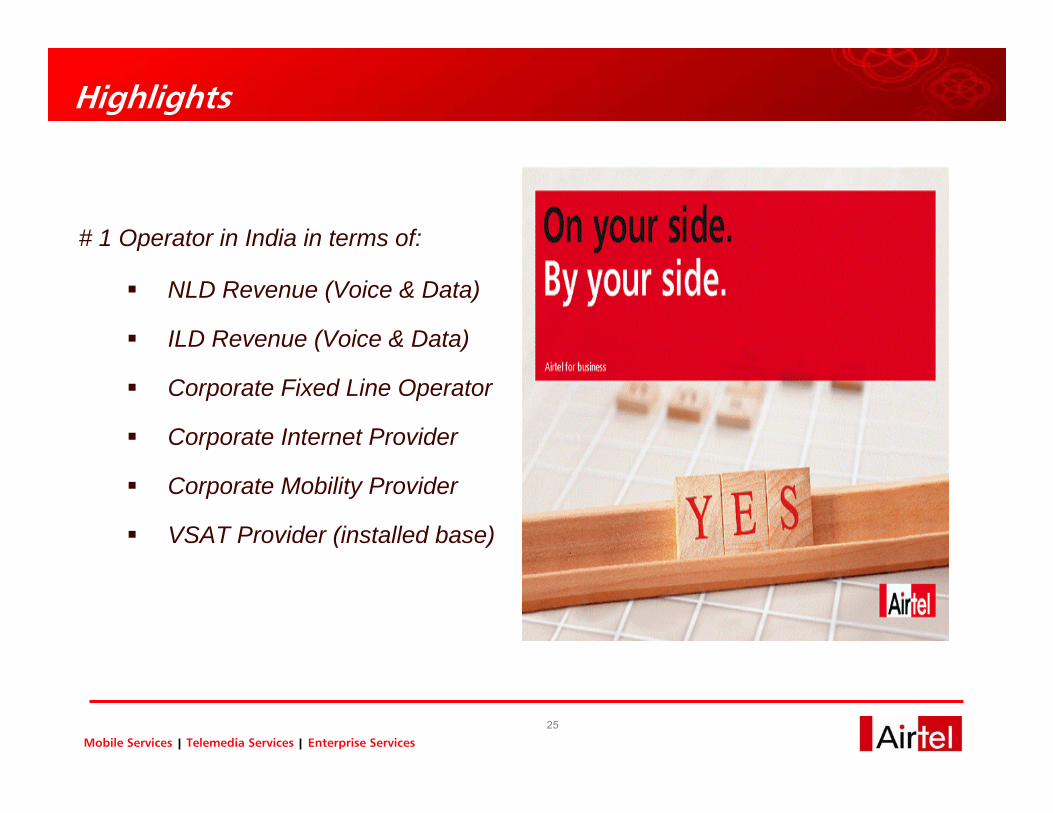
Highlights
# 1 Operator in India in terms of:
NLD Revenue (Voice & Data)
ILD Revenue (Voice & Data)
Corporate Fixed Line Operator
Corporate Internet Provider
Corporate Mobility Provider
VSAT Provider (installed base)
26
Mobile Services Telemedia Services Enterprise Services
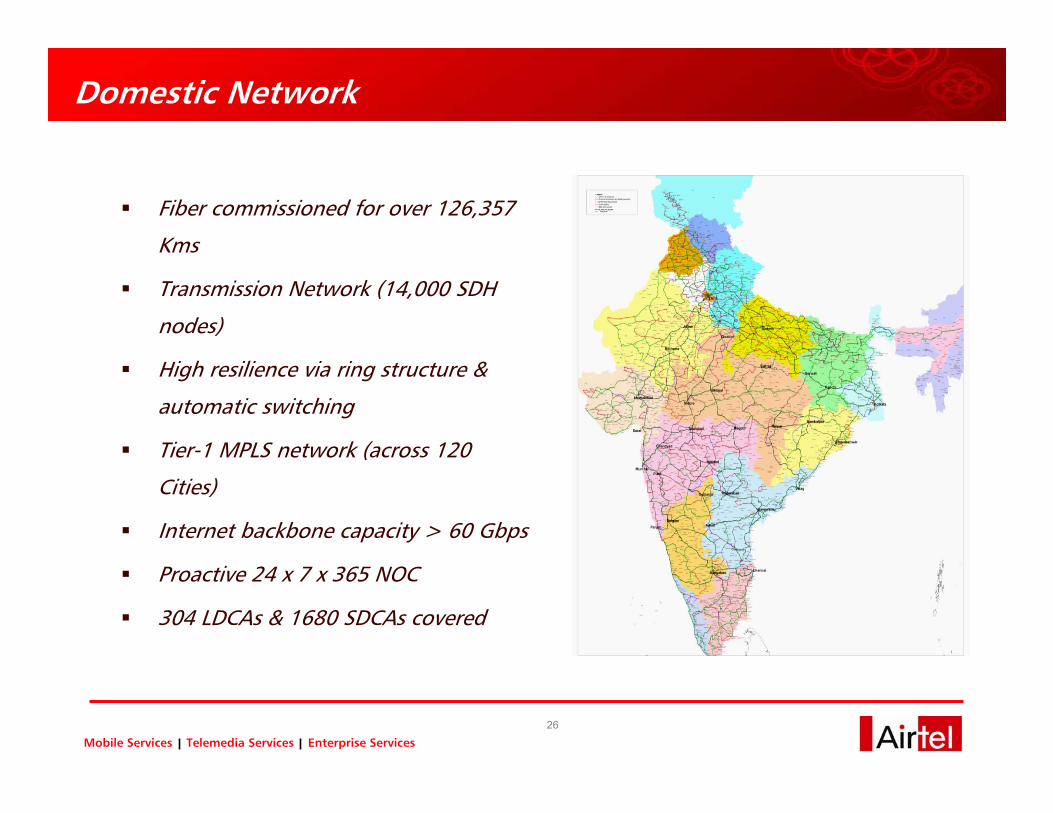
Domestic Network
Fiber commissioned for over 126,357
Kms
Transmission Network (14,000 SDH
nodes)
High resilience via ring structure &
automatic switching
Tier-1 MPLS network (across 120
Cities)
Internet backbone capacity > 60 Gbps
Proactive 24 x 7 x 365 NOC
304 LDCAs & 1680 SDCAs covered

27
Mobile Services Telemedia Services Enterprise Services
International Network 27
InfrastructureInterconnects with about 400 International Carriers
NGN with 4 Global Media Gateways
100% Ownership of i2i Cable system and landing station
Consortium ownership of Sea Me We 4 cable and landing station
IRU capacity on TAT-14, Apollo, EAC, APCN2, JUCN, etc.
Consortium partner in major cable systems under construction: IMEWE, EIG, AAG, Unity, EASSy
Coverage
TDM and IP Voice traffic termination in 230+ countries
Major International PoPs for carrier interconnect at Los Angeles, New York, London, Hong Kong & Singapore
Far-East Connect Platform to cater to high growth markets across Asia and the Pacific
Extensive MPLS Coverage across the globe - more than 70 countries, 700+ PoPs via carrier-grade NNI’s
28
Mobile Services Telemedia Services Enterprise Services
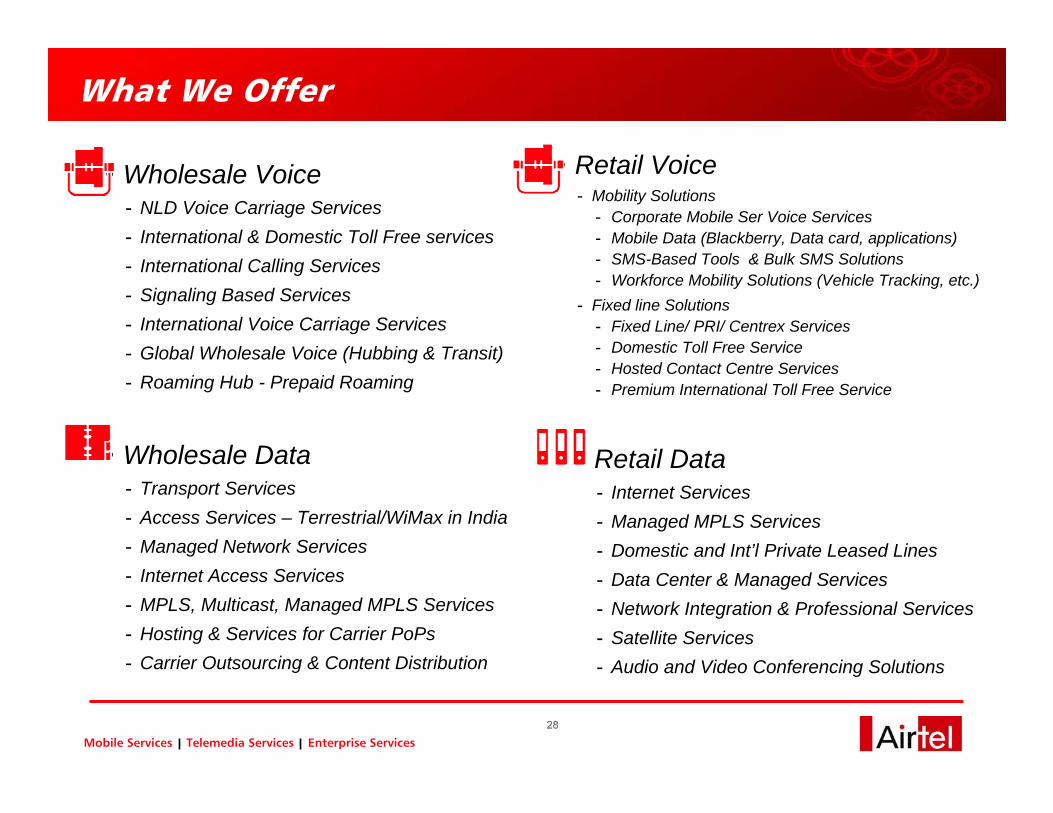
What We Offer
• Wholesale Voice - NLD Voice Carriage Services- International & Domestic Toll Free services- International Calling Services- Signaling Based Services- International Voice Carriage Services- Global Wholesale Voice (Hubbing & Transit)- Roaming Hub - Prepaid Roaming
• Wholesale Data- Transport Services- Access Services – Terrestrial/WiMax in India- Managed Network Services- Internet Access Services- MPLS, Multicast, Managed MPLS Services- Hosting & Services for Carrier PoPs - Carrier Outsourcing & Content Distribution
• Retail Voice - Mobility Solutions
- Corporate Mobile Ser Voice Services- Mobile Data (Blackberry, Data card, applications)- SMS-Based Tools & Bulk SMS Solutions- Workforce Mobility Solutions (Vehicle Tracking, etc.)
- Fixed line Solutions- Fixed Line/ PRI/ Centrex Services- Domestic Toll Free Service- Hosted Contact Centre Services- Premium International Toll Free Service
28
• Retail Data- Internet Services- Managed MPLS Services- Domestic and Int’l Private Leased Lines- Data Center & Managed Services- Network Integration & Professional Services- Satellite Services- Audio and Video Conferencing Solutions
29
Mobile Services Telemedia Services Enterprise Services
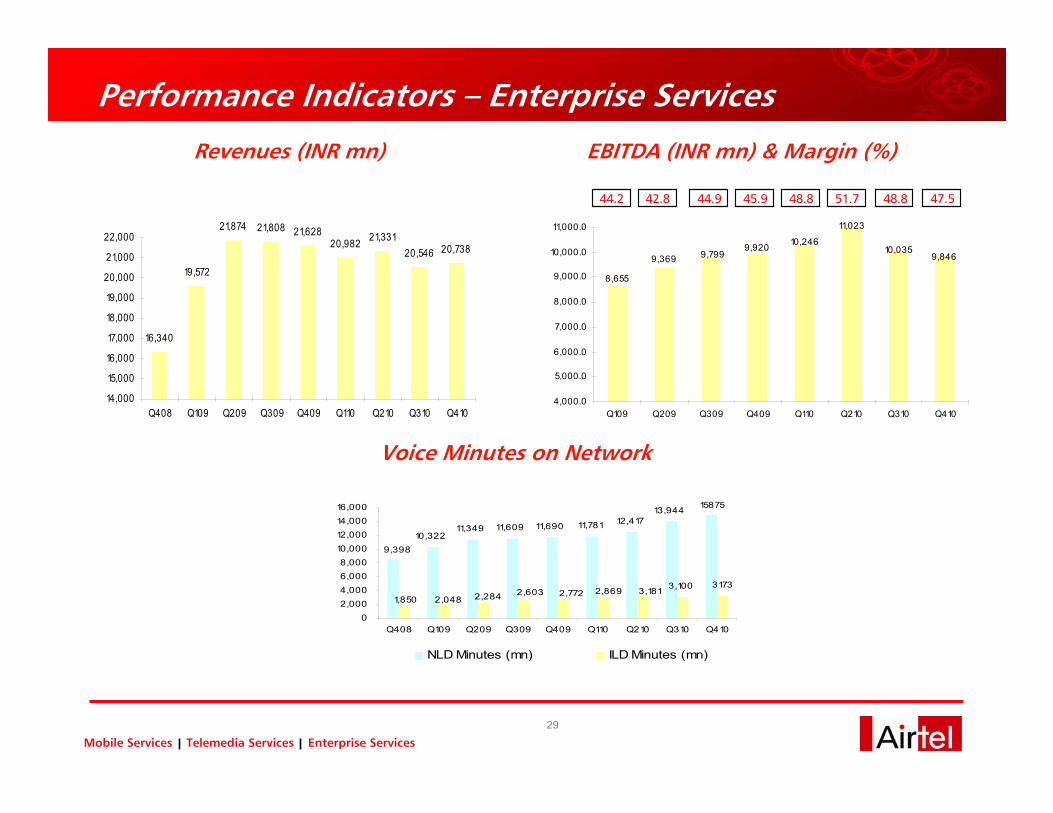
Performance Indicators – Enterprise Services
Voice Minutes on Network
Revenues (INR mn) EBITDA (INR mn) & Margin (%)
16,340
19,572
21,874 21,808 21,62820,982 21,331
20,546 20,738
14,000
15,000
16,000
17,000
18,000
19,000
20,000
21,000
22,000
Q408 Q109 Q209 Q309 Q409 Q110 Q210 Q310 Q410
8,655
9,369 9,7999,920 10,246
11,023
10,0359,846
4,000.0
5,000.0
6,000.0
7,000.0
8,000.0
9,000.0
10,000.0
11,000.0
Q109 Q209 Q309 Q409 Q110 Q210 Q310 Q410
44.2 42.8 44.9 45.9 48.8 51.7 48.8 47.5
10,32211,349 11,609 11,690 11,781 12,417
13,944
3,100 3173
9,398
15875
3,1812,8692,7722,6032,2842,0481,850
02,0004,0006,0008,000
10,00012,00014,00016,000
Q408 Q109 Q209 Q309 Q409 Q110 Q210 Q310 Q410
NLD Minutes (mn) ILD Minutes (mn)
30
Mobile Services Telemedia Services Enterprise Services
Passive Infrastructure Services
31
Mobile Services Telemedia Services Enterprise Services
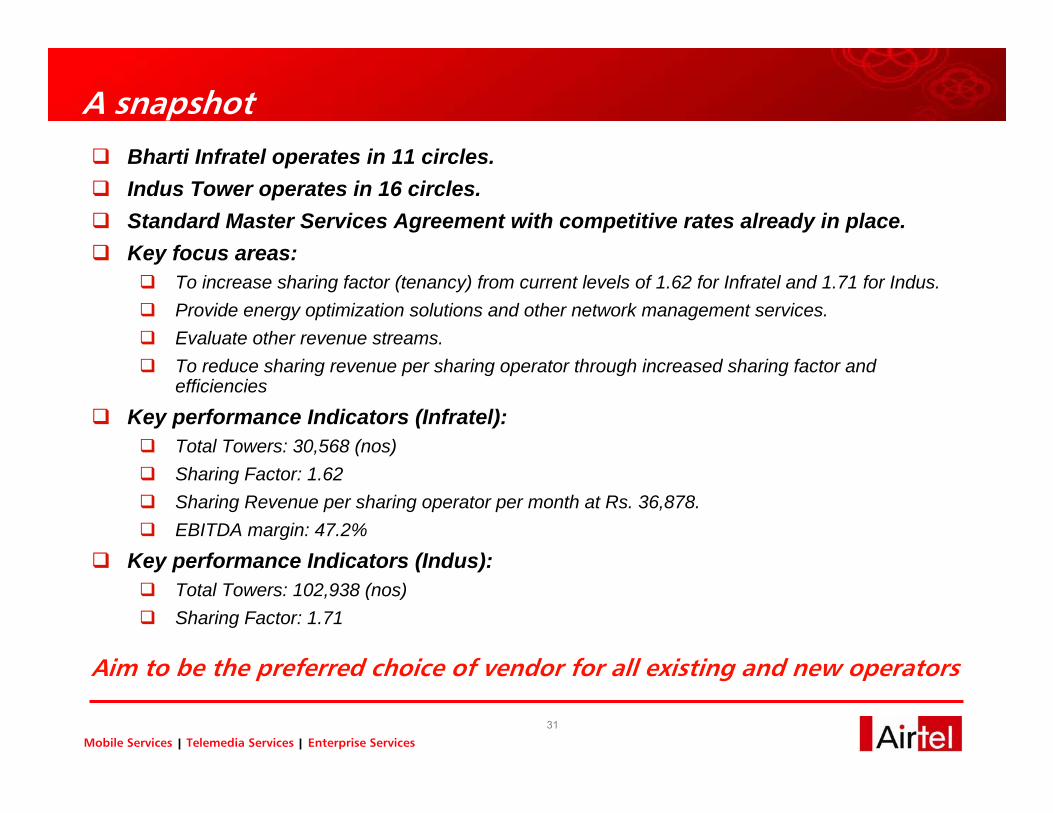
A snapshotBharti Infratel operates in 11 circles.Indus Tower operates in 16 circles.Standard Master Services Agreement with competitive rates already in place.Key focus areas:
To increase sharing factor (tenancy) from current levels of 1.62 for Infratel and 1.71 for Indus.Provide energy optimization solutions and other network management services.Evaluate other revenue streams.To reduce sharing revenue per sharing operator through increased sharing factor and efficiencies
Key performance Indicators (Infratel):Total Towers: 30,568 (nos)Sharing Factor: 1.62Sharing Revenue per sharing operator per month at Rs. 36,878.EBITDA margin: 47.2%
Key performance Indicators (Indus):Total Towers: 102,938 (nos)Sharing Factor: 1.71
Aim to be the preferred choice of vendor for all existing and new operators

32
Mobile Services Telemedia Services Enterprise Services
36,87838,107
36,69636,420
33,58632,17731,893 31,488
25,000
29,000
33,000
37,000
41,000
45,000
Q109 Q209 Q309 Q409 Q1 10 Q2 10 Q3 10 Q410
Sharing Revenue per Sharing Operator per month
58,013 59,966
27,548 28,078 29,11229,806
61,355
30,568
1.22 1.261.34
1.34
1.431.49
1.571.62
-
10,000
20,000
30,000
40,000
50,000
60,000
70,000
Q109 Q209 Q309 Q409 Q1 10 Q2 10 Q3 10 Q4101.00
1.10
1.20
1.30
1.40
1.50
1.60
1.70
No of tow ers Sharing Factor
4,5074,269
3,8703,991
4,258
2,903
3,557
4,020
1,000
1,500
2,000
2,500
3,000
3,500
4,000
4,500
5,000
Q109 Q209 Q309 Q409 Q110 Q210 Q310 Q410
36.6 33.3 33.5 40.1 44.4 46.8 46.1 47.2
Performance Indicators - Bharti Infratel
10,563
11,98312,702
7,2418,020
8,5869,267 9,552
5,000
7,000
9,000
11,000
13,000
Q109 Q209 Q309 Q409 Q110 Q210 Q310 Q410
Revenues (INR mn) EBITDA (INR mn) & Margin (%)
Towers (nos) & Sharing Factor Sharing Revenue per Sharing Operator per Month (Rs)
Note: Figures for revenue, EBITDA and number of towers for quarters ending 4Q09 and beyond have taken the impact of 35,066 towers transferred to Indus
33
Mobile Services Telemedia Services Enterprise Services
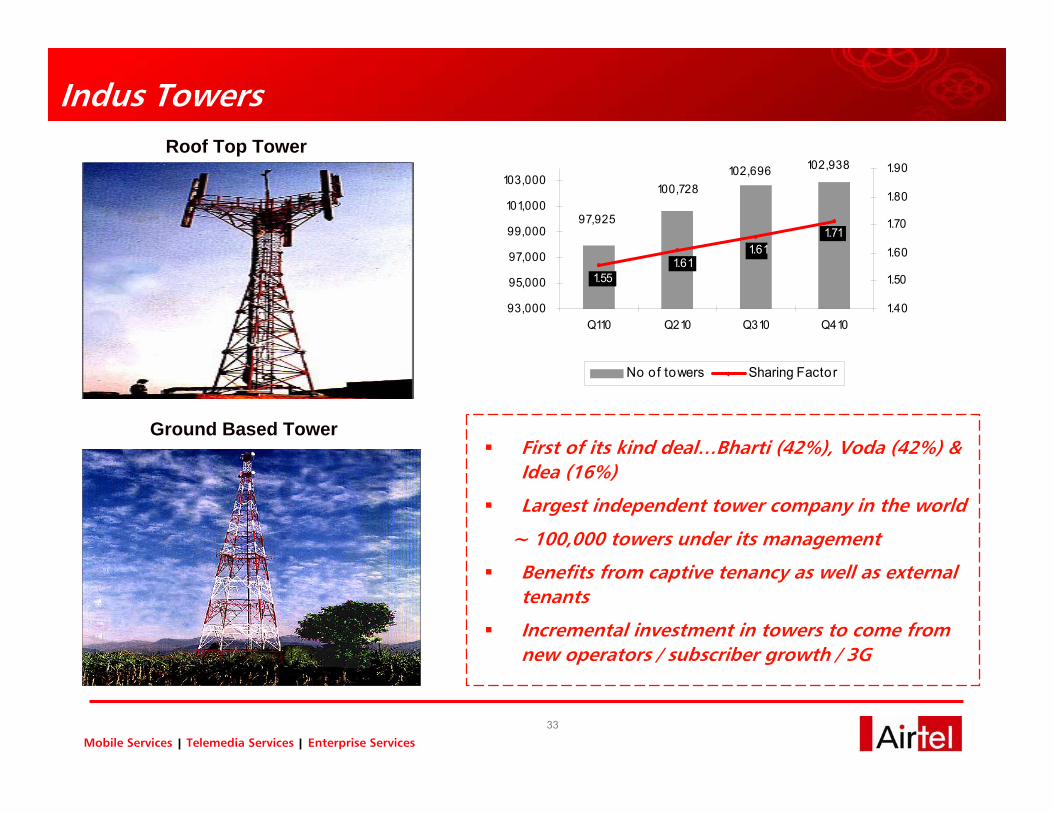
Indus TowersRoof Top Tower
Ground Based TowerFirst of its kind deal…Bharti (42%), Voda (42%) & Idea (16%)
Largest independent tower company in the world
~ 100,000 towers under its management
Benefits from captive tenancy as well as external tenants
Incremental investment in towers to come from new operators / subscriber growth / 3G
102,696 102,938
100,728
97,9251.71
1.61 1.61
1.55
93,000
95,000
97,000
99,000
101,000
103,000
Q110 Q210 Q310 Q4101.40
1.50
1.60
1.70
1.80
1.90
No of towers Sharing Factor

34
Mobile Services Telemedia Services Enterprise Services
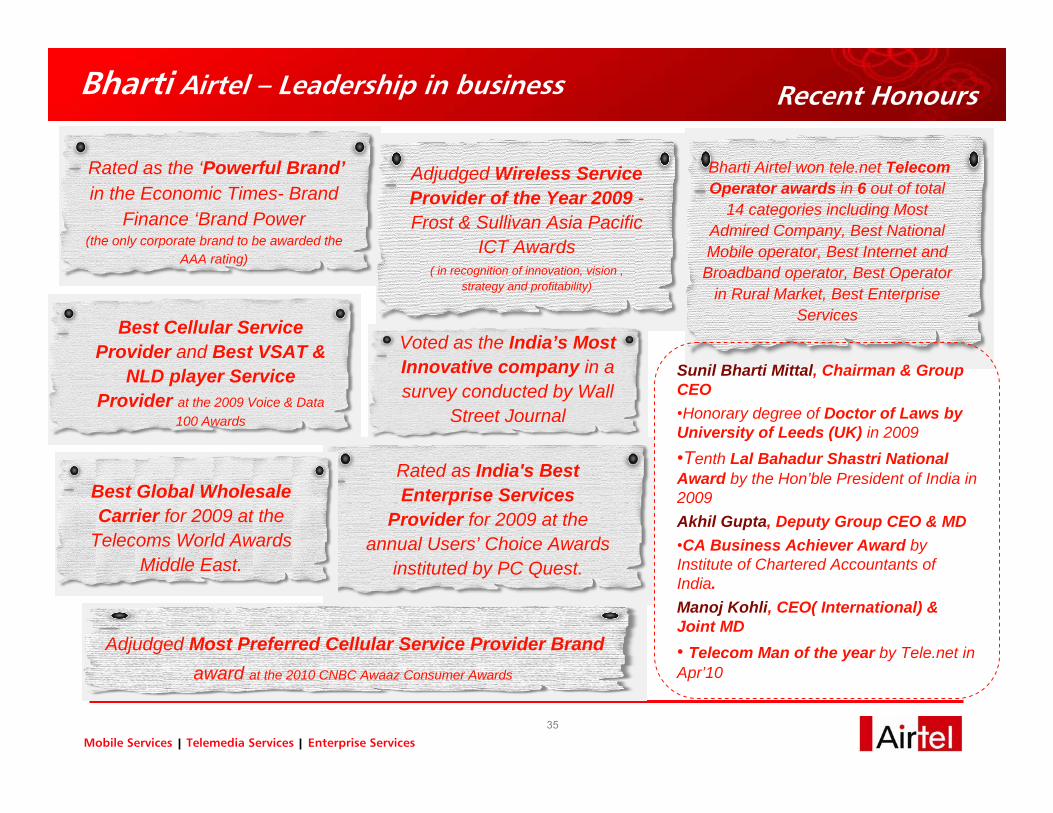
Recent Honours
35
Mobile Services Telemedia Services Enterprise Services
Rated as the ‘Powerful Brand’in the Economic Times- Brand
Finance ‘Brand Power (the only corporate brand to be awarded the
AAA rating)
Rated as India's Best Enterprise Services
Provider for 2009 at the annual Users’ Choice Awards
instituted by PC Quest.
Bharti Airtel – Leadership in business Recent Honours
Bharti Airtel won tele.net Telecom Operator awards in 6 out of total
14 categories including Most Admired Company, Best National Mobile operator, Best Internet and Broadband operator, Best Operator
in Rural Market, Best Enterprise Services
Sunil Bharti Mittal, Chairman & Group CEO•Honorary degree of Doctor of Laws by University of Leeds (UK) in 2009•Tenth Lal Bahadur Shastri National Award by the Hon’ble President of India in 2009 Akhil Gupta, Deputy Group CEO & MD•CA Business Achiever Award by Institute of Chartered Accountants of India. Manoj Kohli, CEO( International) & Joint MD• Telecom Man of the year by Tele.net in Apr’10
Best Cellular Service Provider and Best VSAT &
NLD player Service Provider at the 2009 Voice & Data
100 Awards
Adjudged Wireless Service Provider of the Year 2009 -Frost & Sullivan Asia Pacific
ICT Awards( in recognition of innovation, vision ,
strategy and profitability)
Best Global Wholesale Carrier for 2009 at the
Telecoms World Awards Middle East.
Voted as the India’s Most Innovative company in a survey conducted by Wall
Street Journal
Adjudged Most Preferred Cellular Service Provider Brandaward at the 2010 CNBC Awaaz Consumer Awards

Disclaimer
The information contained in this presentation is only current as of its date. All actions and statements made herein or otherwise shall be subject to the applicable laws and regulations as amended from time to time. There is no representation that all information relating to the context has been taken care off in the presentation and neither we undertake any obligation as to the regular updating of the information as a result of new information, future events or otherwise. We will accept no liability whatsoever for any loss arising directly or indirectly from the use of, reliance of any information contained in this presentation or for any omission of the information. The information shall not be distributed or used by any person or entity in any jurisdiction or countries were such distribution or use would be contrary to the applicable laws or Regulations. It is advised that prior to acting upon this presentation independent consultation / advise may be obtained and necessary due diligence, investigation etc may be done at your end. You may also contact us directly for any questions or clarifications at our end.
This presentation contain certain statements of future expectations and other forward-looking statements, including those relating to our general business plans and strategy, our future financial condition and growth prospects, and future developments in our industry and our competitive and regulatory environment. In addition to statements which are forward looking by reason of context, the words ‘may, will, should, expects, plans, intends, anticipates, believes, estimates, predicts, potential or continue’ and similar expressions identify forward looking statements.
Actual results, performances or events may differ materially from these forward-looking statements including the plans, objectives, expectations, estimates and intentions expressed in forward looking statements due to a number of factors, including without limitation future changes or developments in our business, our competitive environment, telecommunications technology and application, and political, economic, legal and social conditions in India. It is cautioned that the foregoing list is not exhaustive
This presentation is not being used in connection with any invitation of an offer or an offer of securities and should not be used as a basis for any investment decision.
Investor Relations :- http://www.bhartiairtel.inFor any queries, write to: [email protected]
“The information contained herein does not constitute an offer of securities for sale in the United States. Securities may not be sold in the United States absent registration or an exemption from registration under the U.S. Securities Act of 1933, as amended. Any public offering of securities to be made in the United States will be made by means of a prospectus and will contain detailed information about the Company and its management, as well as financial statements. No money, securities or other consideration is being solicited, and, if sent in response to the information contained herein, will not be accepted.”