Embed Size (px)
Citation preview
Investor Presentation
June 2021
Forward Looking Statements & Non-IFRS Measures
2
Notice to Reader: This presentation and the oral statements made during this meeting contain certain statements that constitute forward-looking information within the meaning of applicable securities laws ("forward-looking statements"). Such forward-looking statements involve known and unknown risks, uncertainties and other factors including those related to the COVID-19 pandemic that may cause the actual results, performance or achievements of ATS, or developments in ATS’ business or in its industry, to differ materially from the anticipated results, performance, achievements or developments expressed or implied by such forward-looking statements. Forward-looking statements include all disclosure regarding possible events, conditions or results of operations that is based on assumptions about future economic conditions and courses of action. Forward-looking statements may also include, without limitation, any statement relating to future events, conditions or circumstances. ATS cautions you not to place undue reliance upon any such forward-looking statements, which speak only as of the date they are made. Forward-looking statements relate to, among other things, the BioDot transaction. The risks and uncertainties that may affect forward-looking statements include, among others, the duration and impact of the COVID-19 pandemic, general market performance, performance of the Canadian dollar, performance of the market sectors that ATS serves, success and impact of the initiatives that ATS is undertaking, and other risks and uncertainties detailed from time to time in ATS’ filings with Canadian provincial securities regulators, including ATS’ Annual Report and Annual Information Form for the fiscal year ended March 31, 2020. Forward-looking statements are based on management's current plans, estimates, projections, beliefs and opinions, and ATS does not undertake any obligation to update forward-looking statements should assumptions related to these plans, estimates, projections, beliefs and opinions change.
Non-IFRS Measures: This presentation uses the non-IFRS measures adjusted EBITDA, and adjusted EBITDA margin. These terms do not have any standardized meanings prescribed within IFRS and therefore may not be comparable to similar measures presented by other companies. These measures should not be considered in isolation or as a substitute for measures of performance prepared in accordance with IFRS. Adjusted EBITDA is defined as earnings from operations excluding depreciation and amortization (which includes amortization of intangible assets and right-of-use assets) before items excluded from management’s internal analysis of operating results, such as amortization expense of acquisition-related intangible assets, acquisition-related transaction and integration costs, restructuring charges, and certain other adjustments which would be non-recurring in nature. Adjusted EBITDA margin is an expression of an entity’s adjusted EBITDA as a percentage of revenues. Adjusted EBITDA is used by the Company to evaluate the performance of operations. Management believes that adjusted EBITDA is an important indicator of the Company’s ability to generate operating cash flows to fund continued investment in operations. Management believes that ATS shareholders and potential investors in ATS use these non-IFRS financial measures in making investment decisions and measuring operational results.
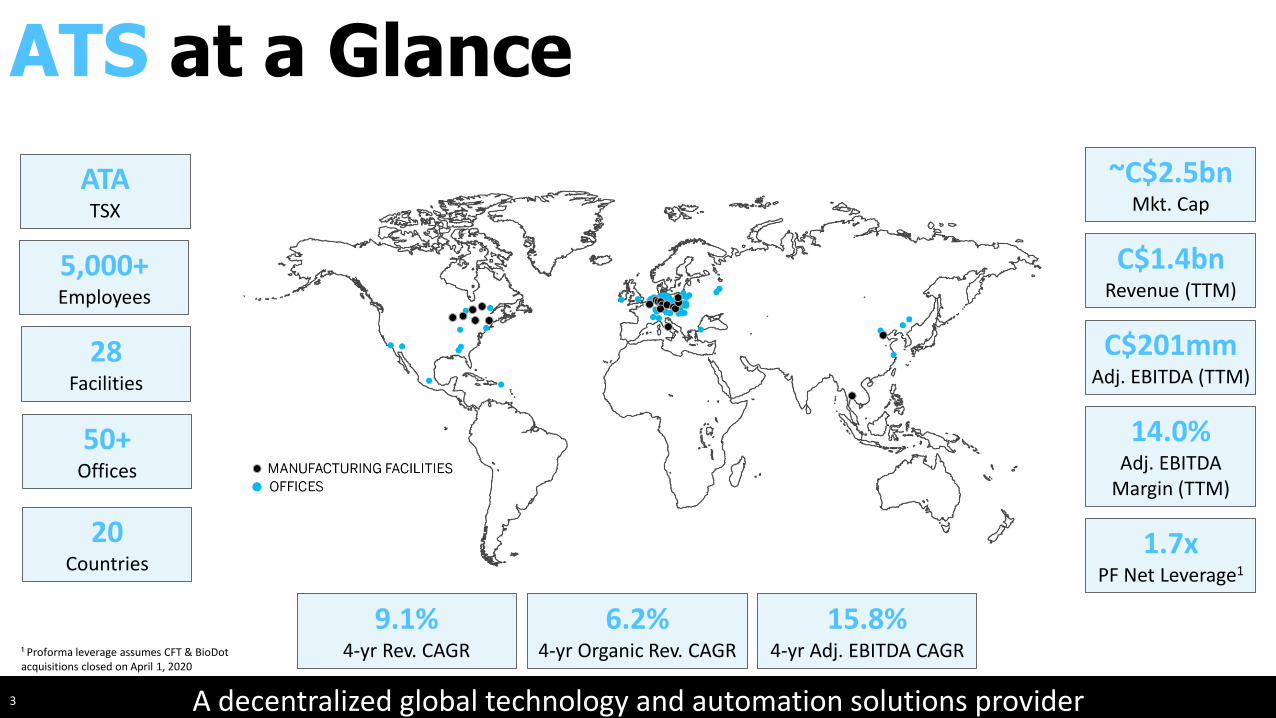
A decentralized global technology and automation solutions provider
ATATSX
C$1.4bnRevenue (TTM)
5,000+Employees
28Facilities
20Countries
50+ Offices
ATS at a Glance
3
v21
C$201mmAdj. EBITDA (TTM)
~C$2.5bnMkt. Cap
14.0%Adj. EBITDA
Margin (TTM)
1.7xPF Net Leverage1
9.1%4-yr Rev. CAGR
6.2%4-yr Organic Rev. CAGR
15.8%4-yr Adj. EBITDA CAGR¹ Proforma leverage assumes CFT & BioDot
acquisitions closed on April 1, 2020
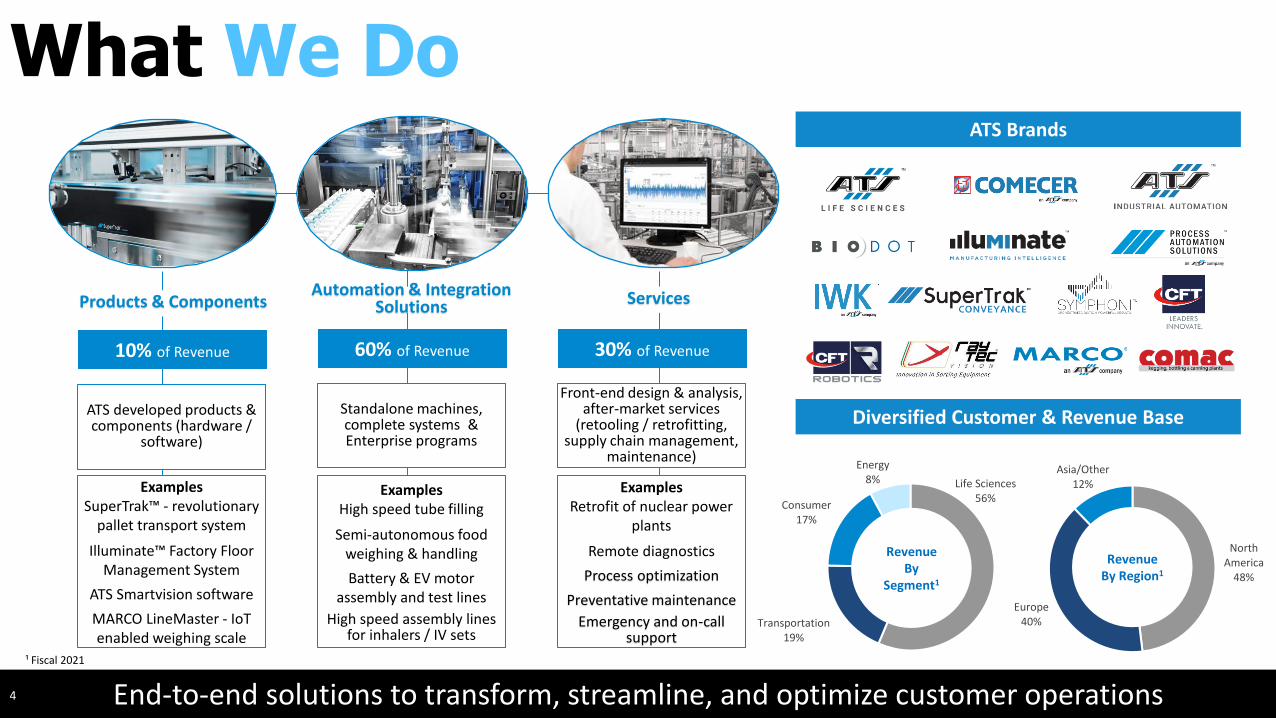
End-to-end solutions to transform, streamline, and optimize customer operations
What We Do
4
Products & ComponentsAutomation & Integration
Solutions Services
ATS developed products & components (hardware /
software)
ExamplesSuperTrak™ - revolutionary
pallet transport system
Illuminate™ Factory Floor Management System
ATS Smartvision software
MARCO LineMaster - IoT enabled weighing scale
10% of Revenue
Standalone machines, complete systems & Enterprise programs
ExamplesHigh speed tube filling
Semi-autonomous food weighing & handling
Battery & EV motor assembly and test lines
High speed assembly lines for inhalers / IV sets
60% of Revenue
Front-end design & analysis, after-market services
(retooling / retrofitting, supply chain management,
maintenance)
ExamplesRetrofit of nuclear power
plants
Remote diagnostics
Process optimization
Preventative maintenance
Emergency and on-call support
30% of Revenue
Diversified Customer & Revenue Base
ATS Brands
¹ Fiscal 2021
Life Sciences56%
Transportation19%
Consumer17%
Energy8%
Revenue By
Segment1
North America
48%
Europe40%
Asia/Other12%
Revenue By Region1
5
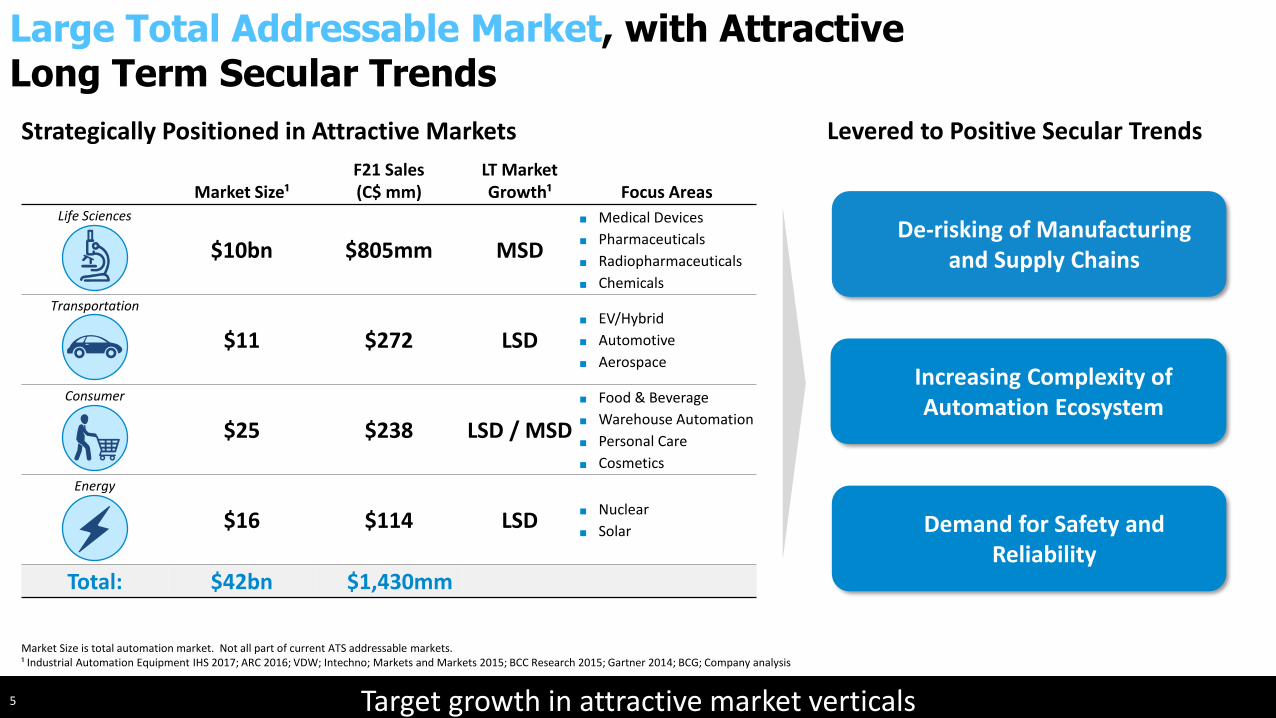
Strategically Positioned in Attractive Markets Levered to Positive Secular Trends
De-risking of Manufacturing and Supply Chains
Demand for Safety and Reliability
Increasing Complexity of Automation Ecosystem
Market Size is total automation market. Not all part of current ATS addressable markets.¹ Industrial Automation Equipment IHS 2017; ARC 2016; VDW; Intechno; Markets and Markets 2015; BCC Research 2015; Gartner 2014; BCG; Company analysis
Market Size¹F21 Sales (C$ mm)
LT Market Growth¹ Focus Areas
Life Sciences
$10bn $805mm MSD
■ Medical Devices
■ Pharmaceuticals
■ Radiopharmaceuticals
■ Chemicals
Transportation
$11 $272 LSD■ EV/Hybrid
■ Automotive
■ Aerospace
Consumer
$25 $238 LSD / MSD
■ Food & Beverage
■ Warehouse Automation
■ Personal Care
■ Cosmetics
Energy
$16 $114 LSD■ Nuclear
■ Solar
Total: $42bn $1,430mm
Target growth in attractive market verticals
Large Total Addressable Market, with Attractive Long Term Secular Trends
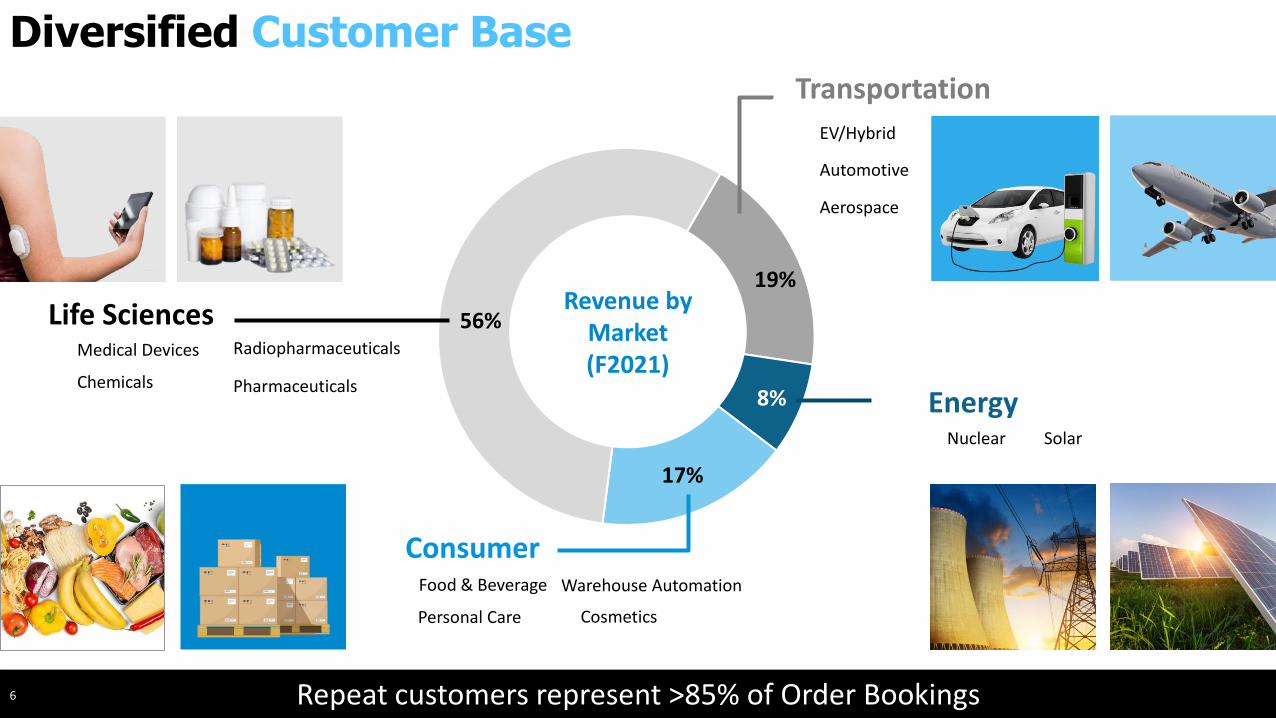
19%
17%
Revenue by Market(F2021)
56%
8%
Diversified Customer Base
Life SciencesMedical Devices
PharmaceuticalsChemicals
Transportation
EV/Hybrid
Automotive
Consumer
Cosmetics
Food & Beverage
EnergyNuclear Solar
Radiopharmaceuticals
Warehouse Automation
Repeat customers represent >85% of Order Bookings 6
Personal Care
Aerospace
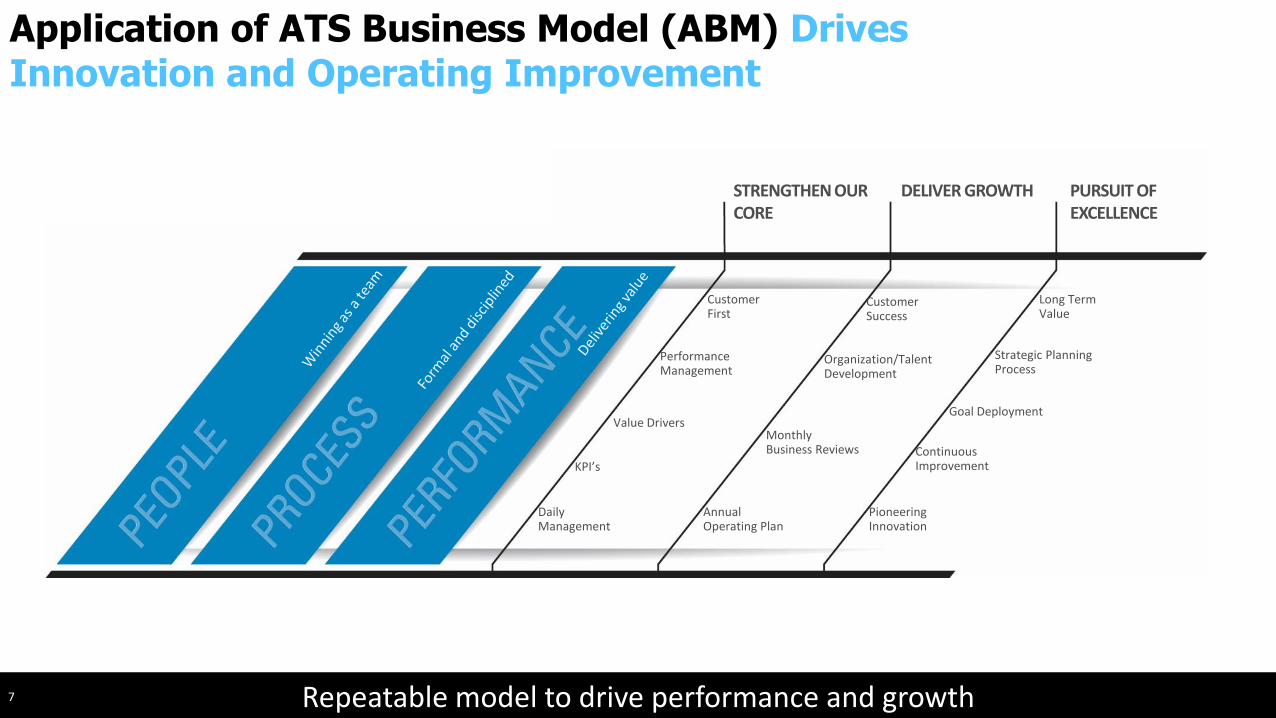
Repeatable model to drive performance and growth7
Daily Management
STRENGTHEN OUR CORE
DELIVER GROWTH PURSUIT OFEXCELLENCE
Long Term Value
Goal Deployment
Strategic Planning Process
Continuous Improvement
Pioneering Innovation
Customer Success
Organization/Talent Development
Monthly Business Reviews
Annual Operating Plan
Customer First
PerformanceManagement
KPI’s
Value Drivers
Application of ATS Business Model (ABM) Drives Innovation and Operating Improvement
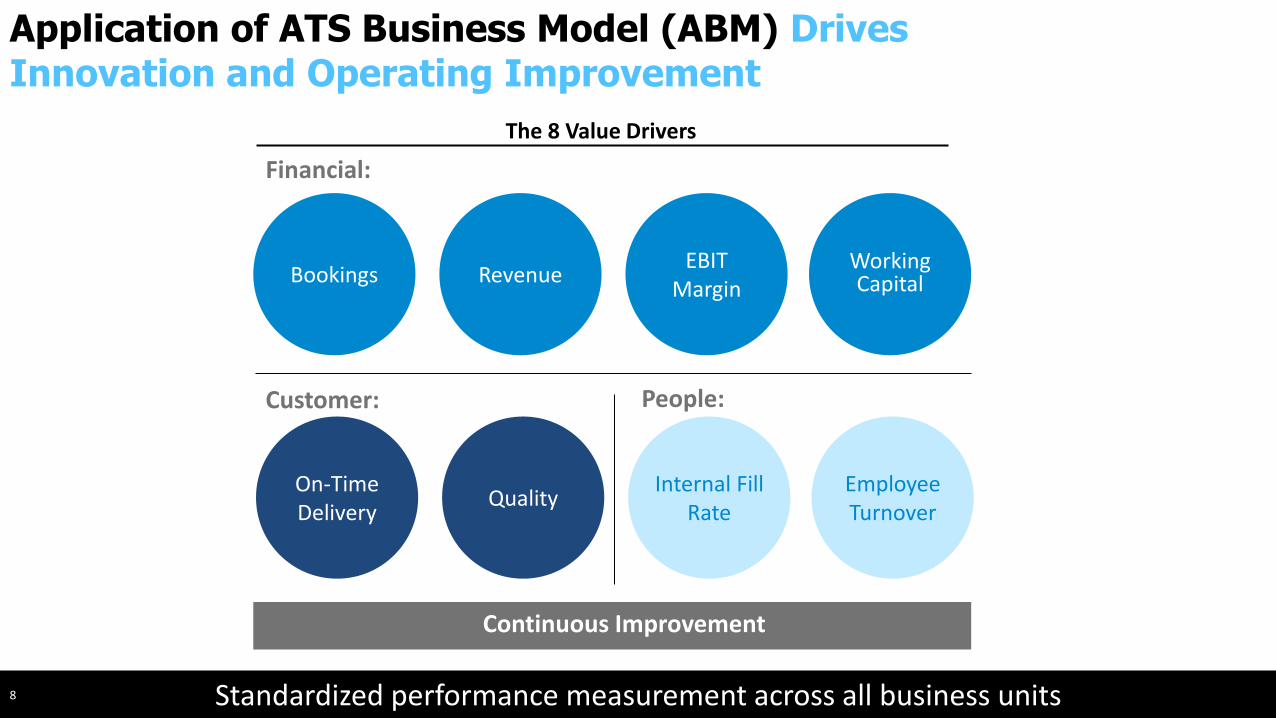
Financial:
Customer: People:
Bookings RevenueEBIT
MarginWorking Capital
On-Time Delivery
QualityInternal Fill
RateEmployee Turnover
Continuous Improvement
Standardized performance measurement across all business units8
The 8 Value Drivers
Application of ATS Business Model (ABM) Drives Innovation and Operating Improvement
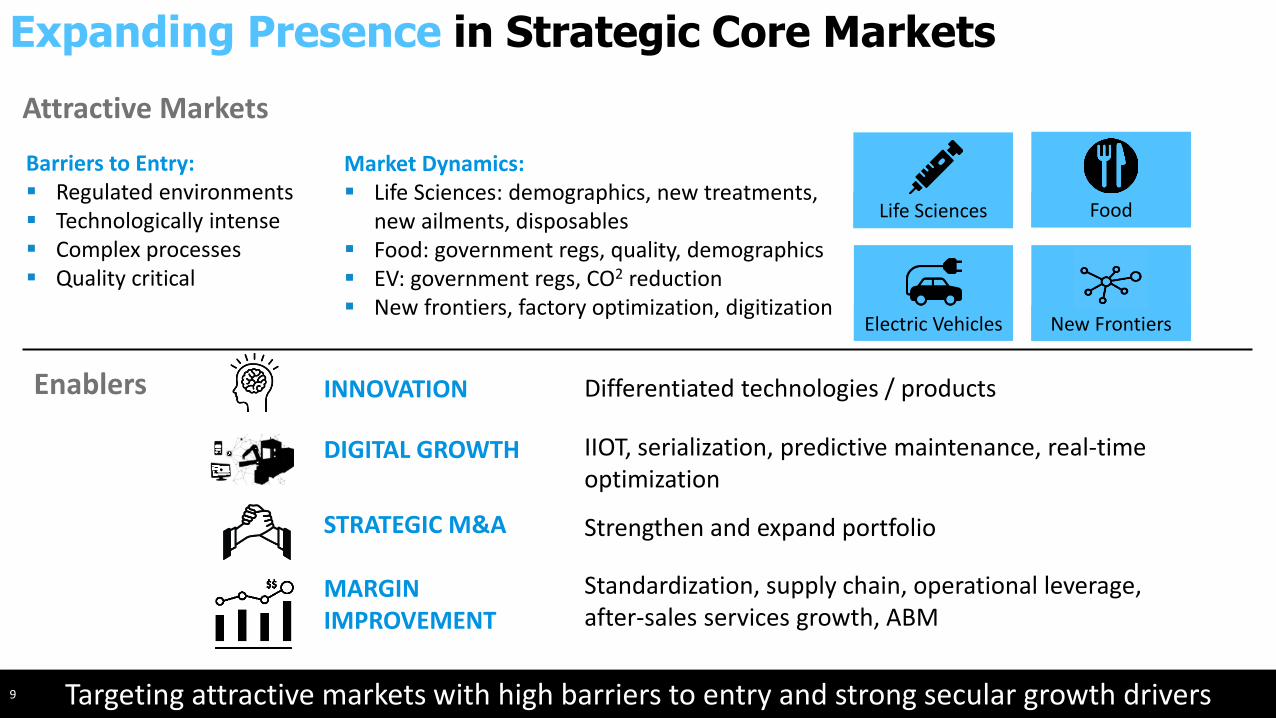
Targeting attractive markets with high barriers to entry and strong secular growth drivers
Expanding Presence in Strategic Core Markets
9
Life Sciences Food
New FrontiersElectric Vehicles
INNOVATION
DIGITAL GROWTH
STRATEGIC M&A
MARGIN IMPROVEMENT
Enablers Differentiated technologies / products
IIOT, serialization, predictive maintenance, real-time optimization
Strengthen and expand portfolio
Standardization, supply chain, operational leverage, after-sales services growth, ABM
Attractive Markets
Barriers to Entry:▪ Regulated environments▪ Technologically intense▪ Complex processes▪ Quality critical
Market Dynamics:▪ Life Sciences: demographics, new treatments,
new ailments, disposables ▪ Food: government regs, quality, demographics▪ EV: government regs, CO2 reduction ▪ New frontiers, factory optimization, digitization
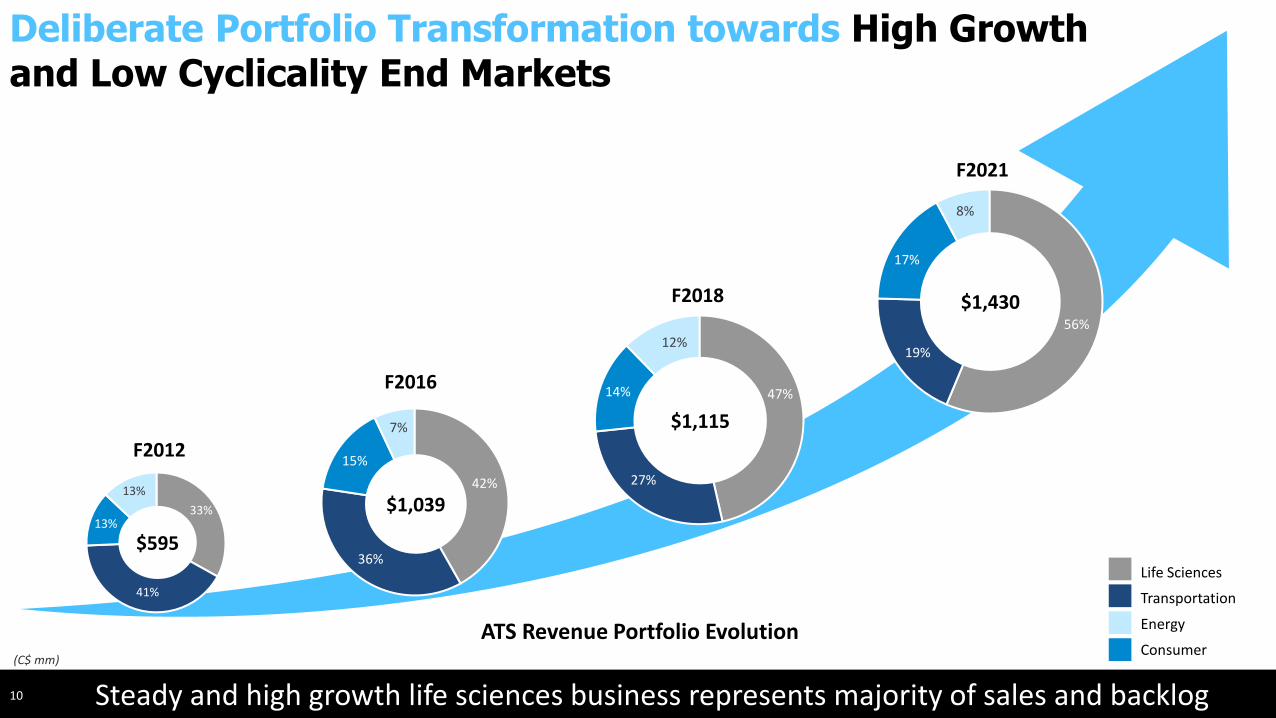
10 Steady and high growth life sciences business represents majority of sales and backlog
Deliberate Portfolio Transformation towards High Growth and Low Cyclicality End Markets
F2012
33%
41%
13%
13%
$595
42%
36%
15%
7%
$1,039
F201647%
27%
14%
12%
$1,115
F2018
56%
19%
17%
8%
$1,430
F2021
(C$ mm)
ATS Revenue Portfolio Evolution
Life Sciences
Transportation
Energy
Consumer
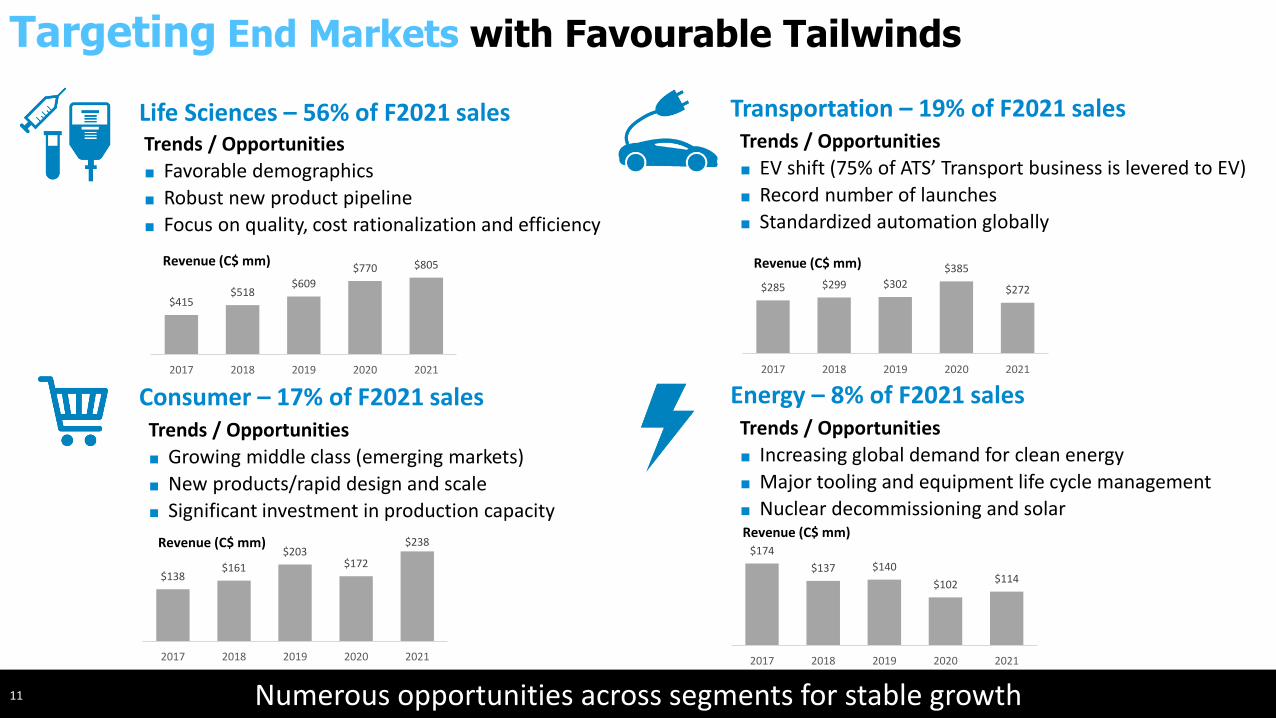
11
Life Sciences – 56% of F2021 sales Transportation – 19% of F2021 sales
Consumer – 17% of F2021 sales Energy – 8% of F2021 sales
Revenue (C$ mm)
Revenue (C$ mm)
Revenue (C$ mm)
Revenue (C$ mm)
Trends / Opportunities
■ Favorable demographics
■ Robust new product pipeline
■ Focus on quality, cost rationalization and efficiency
Trends / Opportunities
■ EV shift (75% of ATS’ Transport business is levered to EV)
■ Record number of launches
■ Standardized automation globally
Trends / Opportunities
■ Growing middle class (emerging markets)
■ New products/rapid design and scale
■ Significant investment in production capacity
Trends / Opportunities
■ Increasing global demand for clean energy
■ Major tooling and equipment life cycle management
■ Nuclear decommissioning and solar
Numerous opportunities across segments for stable growth
Targeting End Markets with Favourable Tailwinds
$415$518
$609
$770 $805
2017 2018 2019 2020 2021
$285 $299 $302
$385
$272
2017 2018 2019 2020 2021
$138$161
$203$172
$238
2017 2018 2019 2020 2021
$174
$137 $140
$102 $114
2017 2018 2019 2020 2021
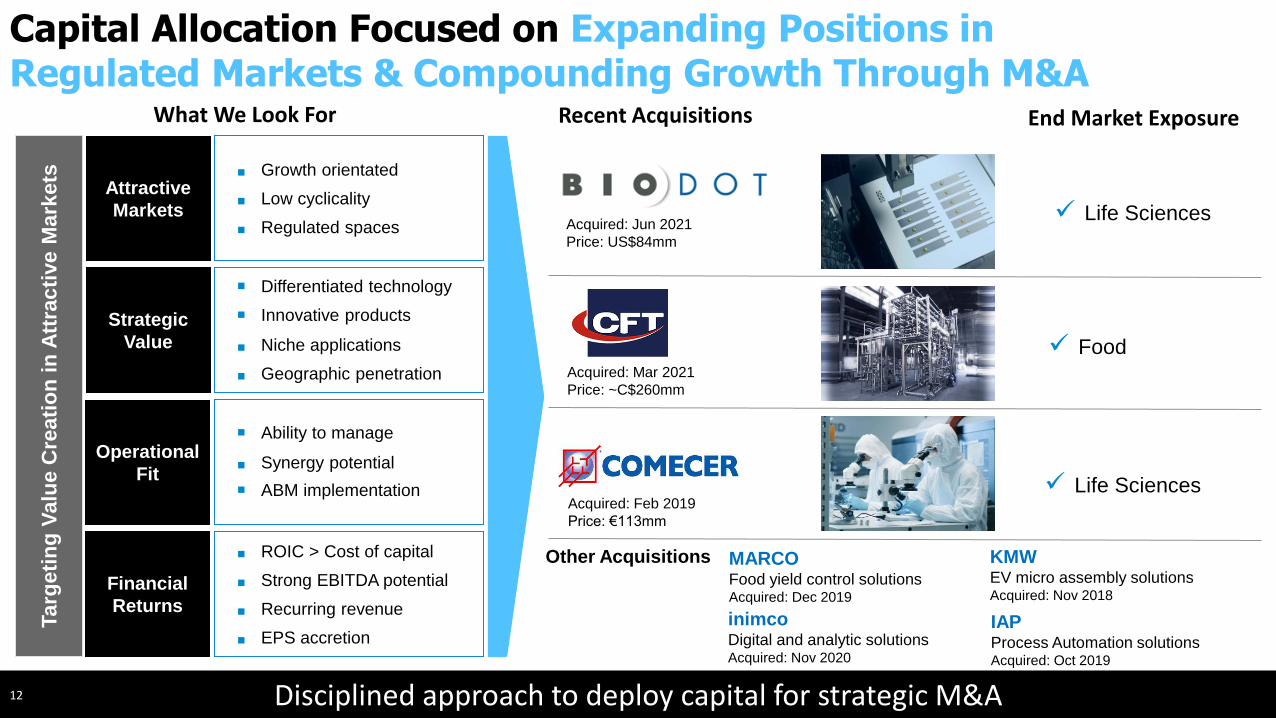
Disciplined approach to deploy capital for strategic M&A
Targ
eti
ng
Valu
e C
reati
on
in
Att
rac
tive M
ark
ets
What We Look For
Attractive
Markets
Strategic
Value
Operational
Fit
Financial
Returns
■ Growth orientated
■ Low cyclicality
■ Regulated spaces
■ Differentiated technology
■ Innovative products
■ Niche applications
■ Geographic penetration
■ Ability to manage
■ Synergy potential
■ ABM implementation
■ ROIC > Cost of capital
■ Strong EBITDA potential
■ Recurring revenue
■ EPS accretion
Recent Acquisitions
Acquired: Mar 2021
Price: ~C$260mm
Acquired: Jun 2021
Price: US$84mm
Other Acquisitions KMWEV micro assembly solutionsAcquired: Nov 2018
End Market Exposure
✓ Life Sciences
✓ Food
✓ Life Sciences
12
Capital Allocation Focused on Expanding Positions in Regulated Markets & Compounding Growth Through M&A
MARCOFood yield control solutionsAcquired: Dec 2019
Acquired: Feb 2019
Price: €113mm
inimcoDigital and analytic solutionsAcquired: Nov 2020
IAPProcess Automation solutionsAcquired: Oct 2019
Building a track record of successfully integrating acquisitions
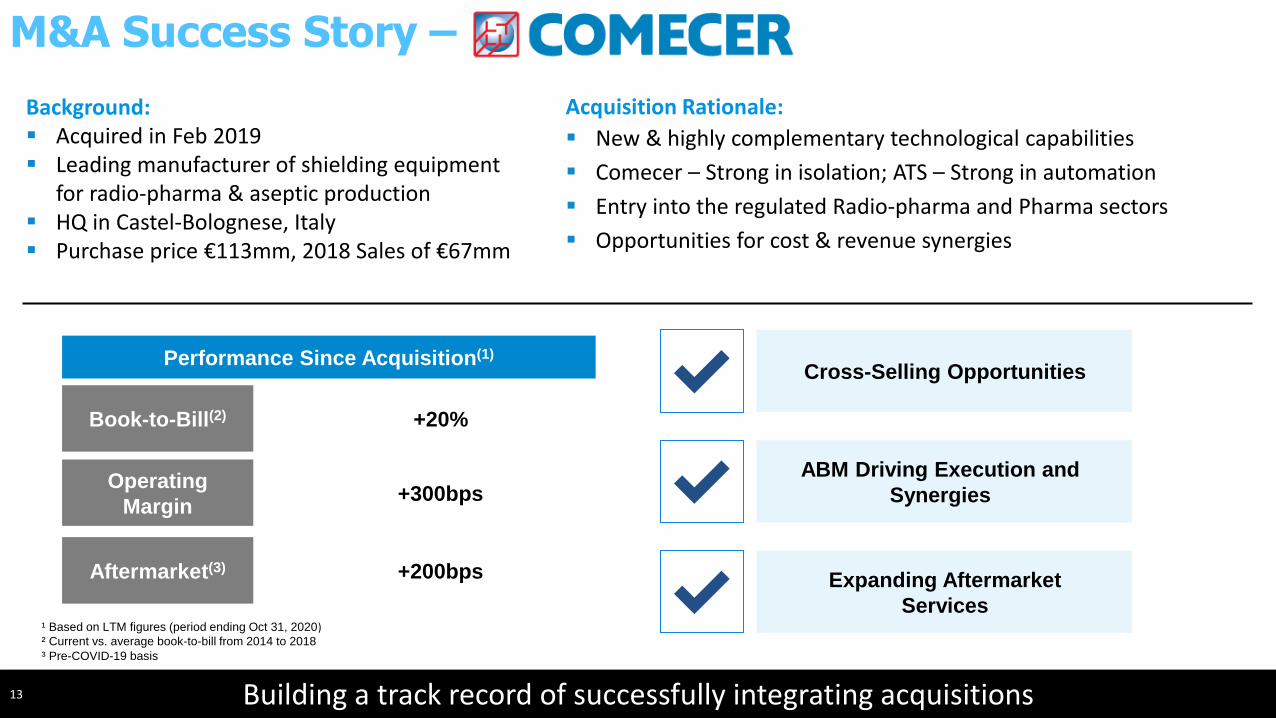
M&A Success Story –
13
Background:▪ Acquired in Feb 2019 ▪ Leading manufacturer of shielding equipment
for radio-pharma & aseptic production ▪ HQ in Castel-Bolognese, Italy ▪ Purchase price €113mm, 2018 Sales of €67mm
Acquisition Rationale:
▪ New & highly complementary technological capabilities
▪ Comecer – Strong in isolation; ATS – Strong in automation
▪ Entry into the regulated Radio-pharma and Pharma sectors
▪ Opportunities for cost & revenue synergies
¹ Based on LTM figures (period ending Oct 31, 2020)² Current vs. average book-to-bill from 2014 to 2018
³ Pre-COVID-19 basis
Performance Since Acquisition(1)
Cross-Selling Opportunities
ABM Driving Execution and
Synergies
Expanding Aftermarket
Services
✔
✔
✔
Book-to-Bill(2)
Operating
Margin
Aftermarket(3)
+20%
+300bps
+200bps
Platform acquisition in the highly regulated Food & Beverage market
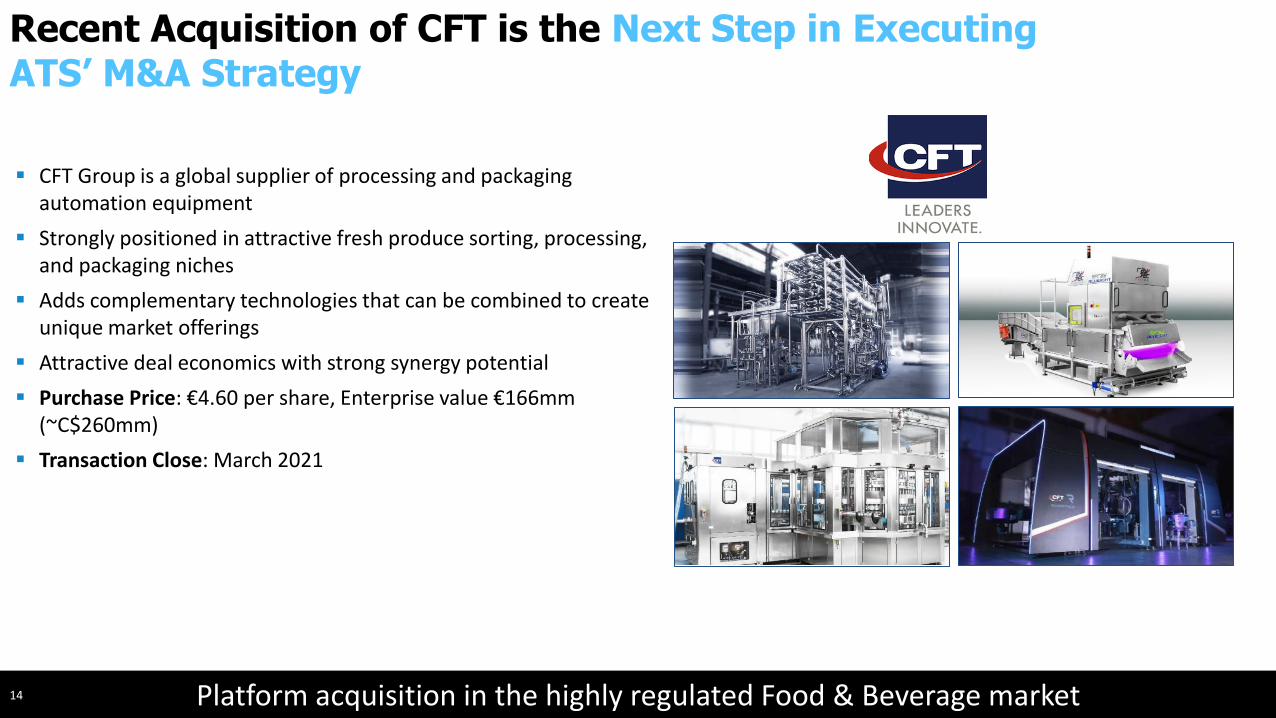
Recent Acquisition of CFT is the Next Step in Executing ATS’ M&A Strategy
14
Linear Motion
SymphoniTM
IIOT
COVID-19
ATS Innovation Centre
Advisory Council oversight
▪ CFT Group is a global supplier of processing and packaging automation equipment
▪ Strongly positioned in attractive fresh produce sorting, processing, and packaging niches
▪ Adds complementary technologies that can be combined to create unique market offerings
▪ Attractive deal economics with strong synergy potential
▪ Purchase Price: €4.60 per share, Enterprise value €166mm (~C$260mm)
▪ Transaction Close: March 2021
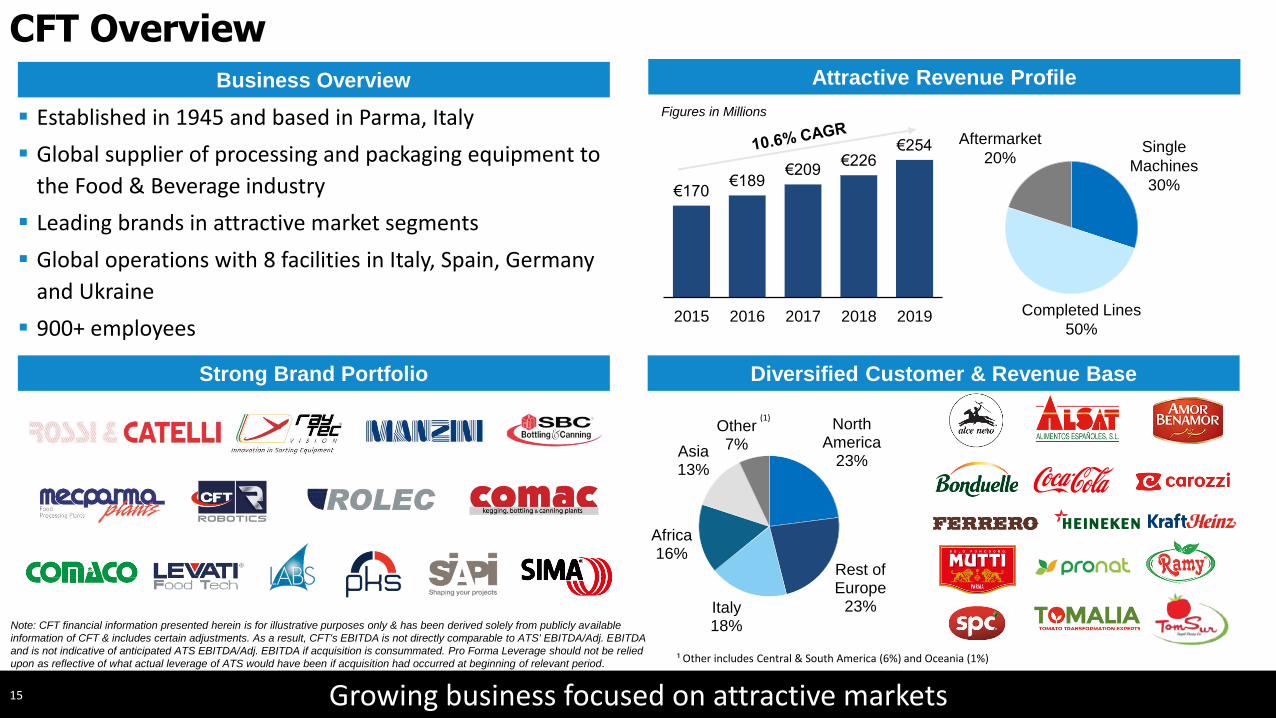
Growing business focused on attractive markets
CFT Overview
15
▪ Established in 1945 and based in Parma, Italy
▪ Global supplier of processing and packaging equipment to
the Food & Beverage industry
▪ Leading brands in attractive market segments
▪ Global operations with 8 facilities in Italy, Spain, Germany
and Ukraine
▪ 900+ employees
€170 €189
€209 €226
€254
2015 2016 2017 2018 2019
North America
23%
Rest of Europe
23%Italy18%
Africa16%
Asia13%
Other7%
(1)
Diversified Customer & Revenue Base
Attractive Revenue Profile
Figures in Millions
Single
Machines
30%
Completed Lines
50%
Aftermarket
20%
Business Overview
¹ Other includes Central & South America (6%) and Oceania (1%)
Strong Brand Portfolio
Note: CFT financial information presented herein is for illustrative purposes only & has been derived solely from publicly available
information of CFT & includes certain adjustments. As a result, CFT's EBITDA is not directly comparable to ATS' EBITDA/Adj. EBITDA
and is not indicative of anticipated ATS EBITDA/Adj. EBITDA if acquisition is consummated. Pro Forma Leverage should not be relied
upon as reflective of what actual leverage of ATS would have been if acquisition had occurred at beginning of relevant period.
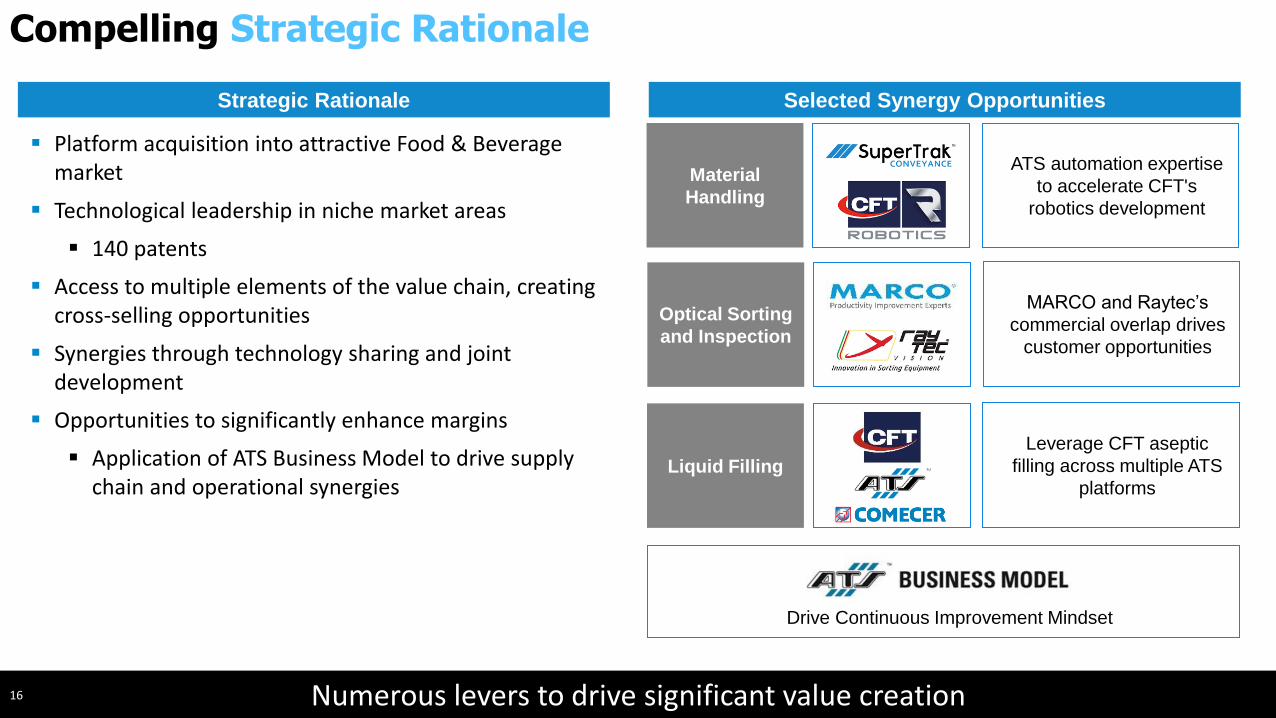
Numerous levers to drive significant value creation
Compelling Strategic Rationale
16
▪ Platform acquisition into attractive Food & Beverage market
▪ Technological leadership in niche market areas
▪ 140 patents
▪ Access to multiple elements of the value chain, creating cross-selling opportunities
▪ Synergies through technology sharing and joint development
▪ Opportunities to significantly enhance margins
▪ Application of ATS Business Model to drive supply chain and operational synergies
Strategic Rationale Selected Synergy Opportunities
Material
Handling
ATS automation expertise
to accelerate CFT's
robotics development
Optical Sorting
and Inspection
MARCO and Raytec’s
commercial overlap drives
customer opportunities
Liquid Filling
Leverage CFT aseptic
filling across multiple ATS
platforms
Drive Continuous Improvement Mindset
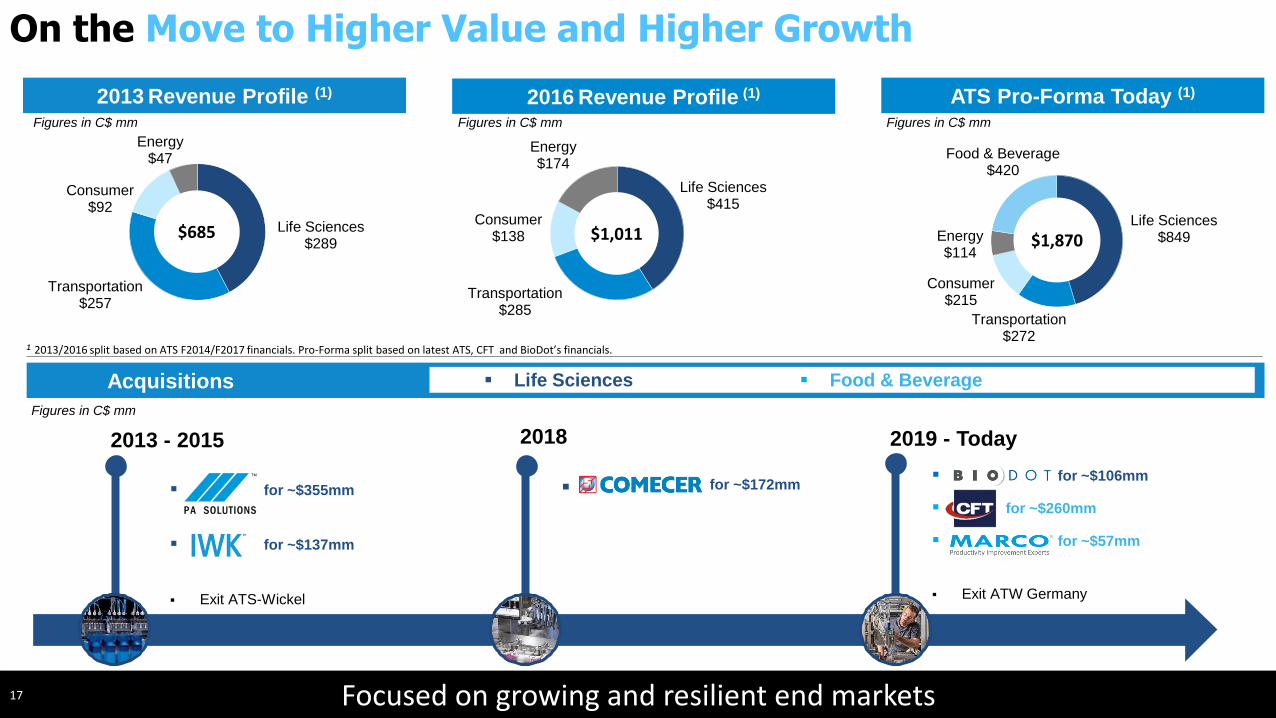
2013 Revenue Profile (1) 2016 Revenue Profile (1) ATS Pro-Forma Today (1)
Figures in C$ mmFigures in C$ mmFigures in C$ mm
Focused on growing and resilient end markets
On the Move to Higher Value and Higher Growth
17
▪ for ~$355mm
▪ for ~$137mm
▪ Exit ATS-Wickel
■ for ~$172mm▪ for ~$106mm
▪ for ~$260mm
▪ for ~$57mm
▪ Exit ATW Germany
2013 - 2015 2018
¹ 2013/2016 split based on ATS F2014/F2017 financials. Pro-Forma split based on latest ATS, CFT and BioDot’s financials.
2019 - Today
Acquisitions ▪ Life Sciences ▪ Food & Beverage
Life Sciences$289
Transportation$257
Consumer$92
Energy$47
$685
Life Sciences$415
Transportation$285
Consumer$138
Energy$174
$1,011Life Sciences
$849
Transportation$272
Consumer$215
Energy$114
Food & Beverage$420
$1,870
Figures in C$ mm
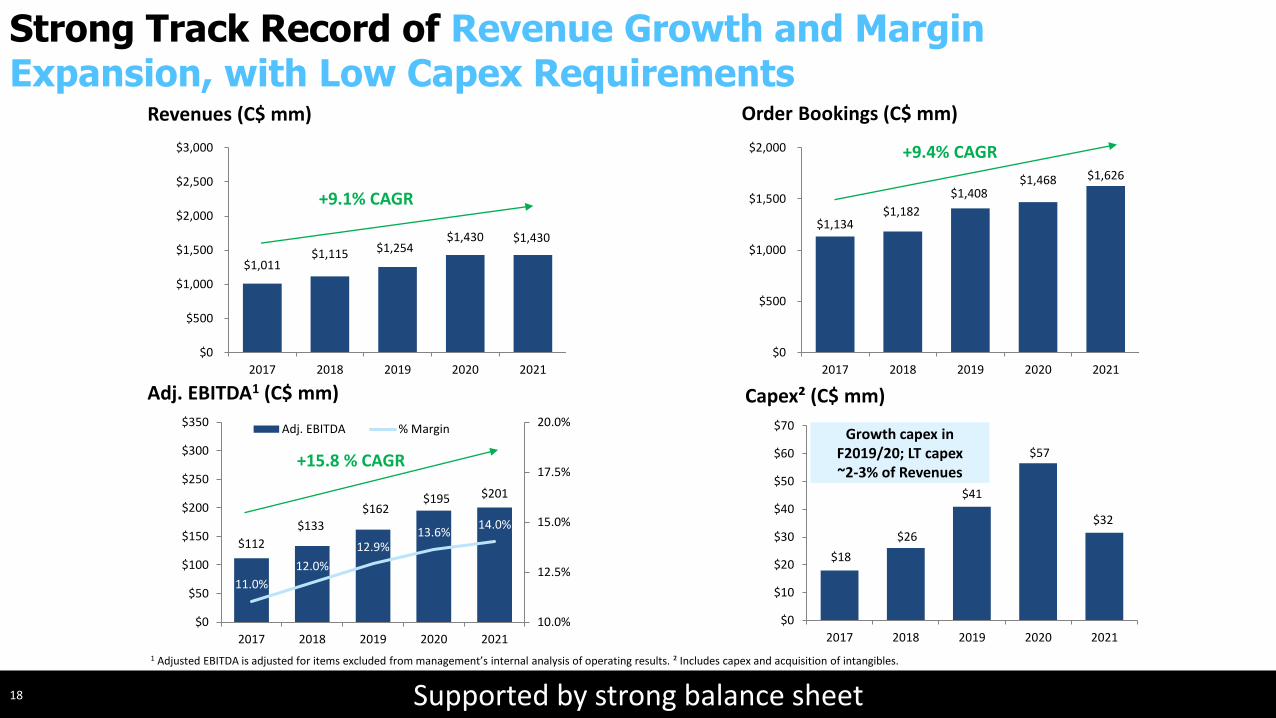
$1,011$1,115 $1,254
$1,430 $1,430
$0
$500
$1,000
$1,500
$2,000
$2,500
$3,000
2017 2018 2019 2020 2021
$1,134$1,182
$1,408$1,468 $1,626
$0
$500
$1,000
$1,500
$2,000
2017 2018 2019 2020 2021
$112
$133
$162$195 $201
11.0%
12.0%
12.9%13.6%
14.0%
10.0%
12.5%
15.0%
17.5%
20.0%
$0
$50
$100
$150
$200
$250
$300
$350
2017 2018 2019 2020 2021
Adj. EBITDA % Margin
Supported by strong balance sheet
Strong Track Record of Revenue Growth and Margin Expansion, with Low Capex Requirements
18
1 Adjusted EBITDA is adjusted for items excluded from management’s internal analysis of operating results. ² Includes capex and acquisition of intangibles.
Revenues (C$ mm) Order Bookings (C$ mm)
Capex² (C$ mm)Adj. EBITDA1 (C$ mm)
+9.1% CAGR
+15.8 % CAGR
+9.4% CAGR
$18
$26
$41
$57
$32
$0
$10
$20
$30
$40
$50
$60
$70
2017 2018 2019 2020 2021
Growth capex in F2019/20; LT capex ~2-3% of Revenues
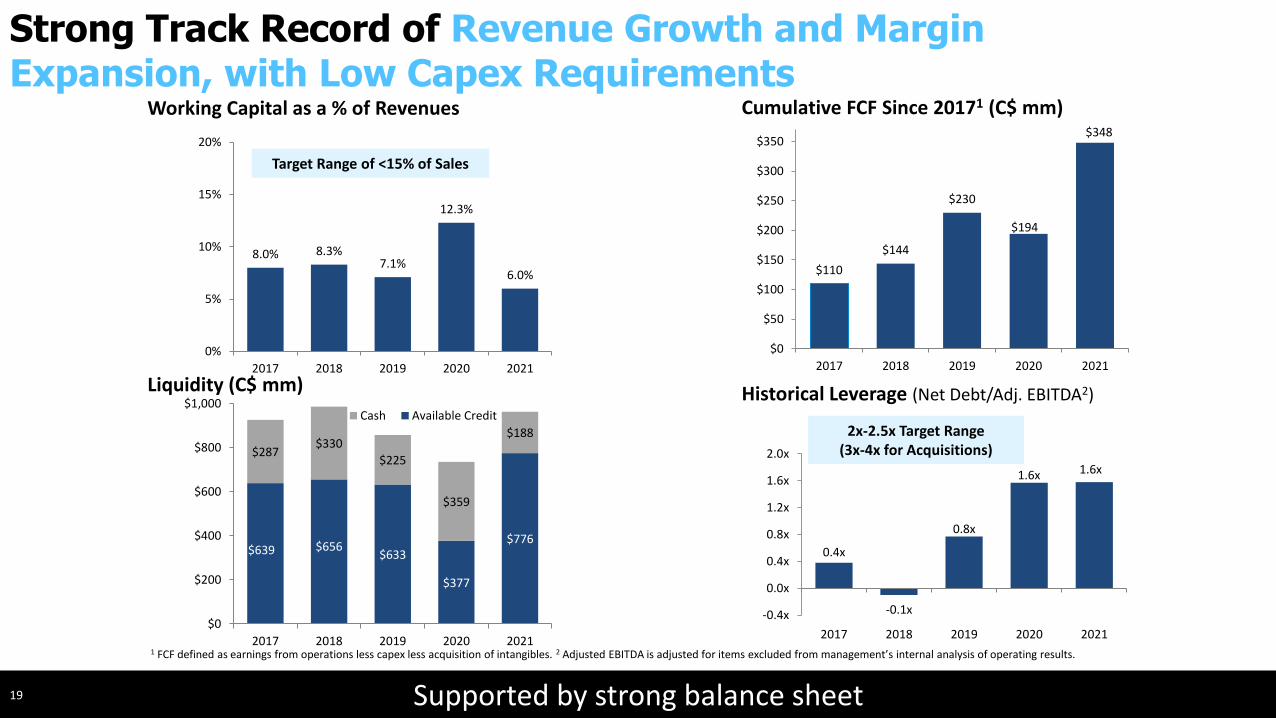
$639 $656 $633
$377
$776
$287$330
$225
$359
$188
$0
$200
$400
$600
$800
$1,000
2017 2018 2019 2020 2021
Cash Available Credit
$110
$144
$230
$194
$348
$0
$50
$100
$150
$200
$250
$300
$350
2017 2018 2019 2020 2021
8.0% 8.3%7.1%
12.3%
6.0%
0%
5%
10%
15%
20%
2017 2018 2019 2020 2021
Supported by strong balance sheet19
0.4x
-0.1x
0.8x
1.6x 1.6x
-0.4x
0.0x
0.4x
0.8x
1.2x
1.6x
2.0x
2017 2018 2019 2020 20211 FCF defined as earnings from operations less capex less acquisition of intangibles. 2 Adjusted EBITDA is adjusted for items excluded from management’s internal analysis of operating results.
2x-2.5x Target Range (3x-4x for Acquisitions)
Working Capital as a % of Revenues Cumulative FCF Since 20171 (C$ mm)
Historical Leverage (Net Debt/Adj. EBITDA2)Liquidity (C$ mm)
Strong Track Record of Revenue Growth and Margin Expansion, with Low Capex Requirements
Target Range of <15% of Sales
Appendix: Reconciliation of Non-IFRS Measures to IFRS Measures
20
Notice to reader: Non-IFRS measures and additional IFRS measuresThroughout this presentation management uses certain non-IFRS measures to evaluate the performance of the Company. The terms “adjusted EBITDA”, “adjusted EBITDA margin”, “non-cash working capital”, “Order Bookings” and “Order Backlog” do not have any standardized meaning prescribed within IFRS and therefore may not be comparable to similar measures presented by other companies. Such measures should not be considered in isolation or as a substitute for measures of performance prepared in accordance with IFRS. Adjusted EBITDA is defined as earnings from operations excluding depreciation and amortization (which includes amortization of intangible assets and right-of-use assets) before items excluded from management’s internal analysis of operating results, such as amortization expense of acquisition-related intangible assets, acquisition-related transaction and integration costs, restructuring charges, and certain other adjustments which would be non-recurring in nature (“adjustment items”). Adjusted EBITDA margin is an expression of the Company’s adjusted EBITDA as a percentage of revenues. Non-cash working capital is defined as the sum of accounts receivable, costs and earnings in excess of billing on contracts in progress, inventories, deposits, prepaids and other assets, less accounts payable, accrued liabilities, provisions and billings in excess of costs and earnings on contracts in progress. Order Bookings represent new orders for the supply of automation systems, services and products that management believes are firm. Order Backlog is the estimated unearned portion of revenues on customer contracts that are in process and have not been completed at the specified date.
Adjusted EBITDA and adjusted EBITDA margin are used by the Company to evaluate the performance of its operations. Management believes that adjusted EBITDA is an important indicator of the Company’s ability to generate operating cash flows to fund continued investment in its operations. The adjustment items used by management to arrive at these metrics are not considered to be indicative of the business’ ongoing operating performance. Management uses the measure non-cash working capital as a percentage of revenues to evaluate the Company’s management of its investment in non-cash working capital. Management calculates non-cash working capital as a percentage of revenues using period-end non-cash working capital divided by trailing two fiscal quarter revenues annualized. Order Bookings provide an indication of the Company’s ability to secure new orders for work during a specified period, while Order Backlog provides a measure of the value of Order Bookings that have not been completed at a specified point in time. Both Order Bookings and Order Backlog are indicators of future revenues the Company expects to generate based on contracts that management believes to be firm. Management believes that ATS shareholders and potential investors in ATS use these additional IFRS measures and non-IFRS financial measures in making investment decisions and measuring operational results.
A reconciliation of Order Bookings and Order Backlog to total Company revenues are contained in this presentation. A reconciliation of adjusted EBITDA to net income, is contained in this presentation.
Appendix: Reconciliation of Non-IFRS Measures to IFRS Measures
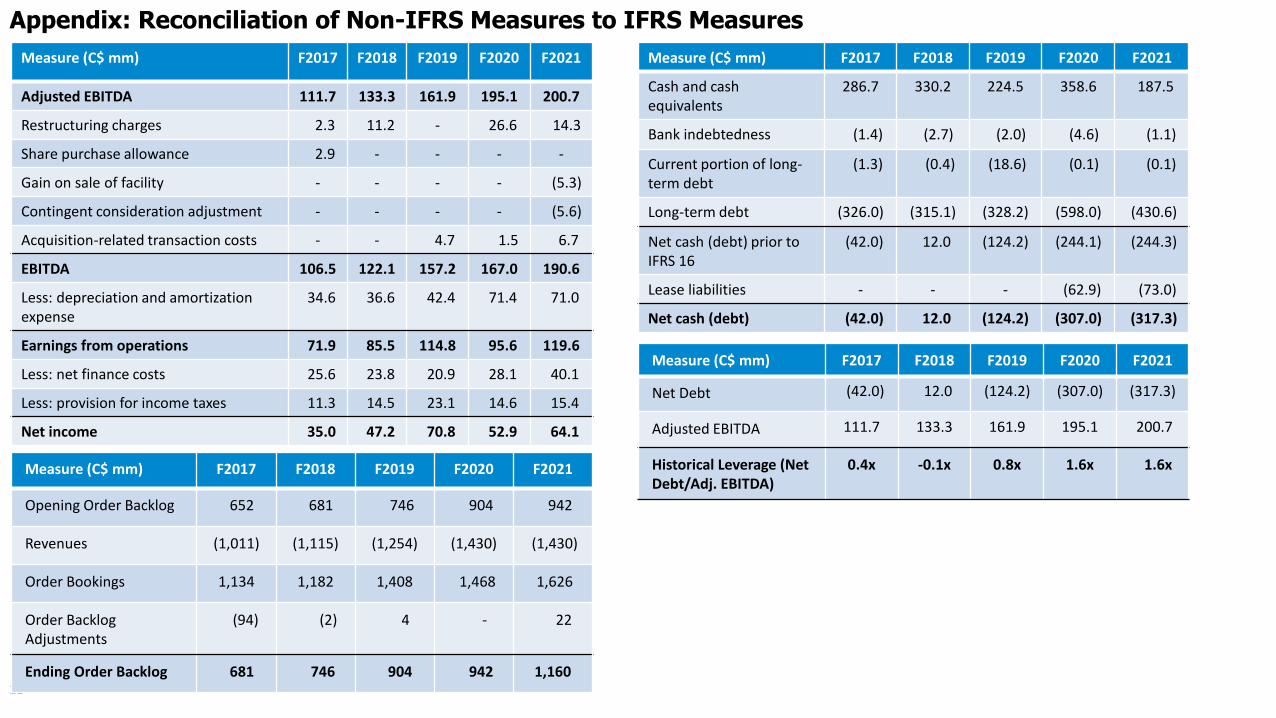
Measure (C$ mm) F2017 F2018 F2019 F2020 F2021
Adjusted EBITDA 111.7 133.3 161.9 195.1 200.7
Restructuring charges 2.3 11.2 - 26.6 14.3
Share purchase allowance 2.9 - - - -
Gain on sale of facility - - - - (5.3)
Contingent consideration adjustment - - - - (5.6)
Acquisition-related transaction costs - - 4.7 1.5 6.7
EBITDA 106.5 122.1 157.2 167.0 190.6
Less: depreciation and amortization expense
34.6 36.6 42.4 71.4 71.0
Earnings from operations 71.9 85.5 114.8 95.6 119.6
Less: net finance costs 25.6 23.8 20.9 28.1 40.1
Less: provision for income taxes 11.3 14.5 23.1 14.6 15.4
Net income 35.0 47.2 70.8 52.9 64.1
21
Measure (C$ mm) F2017 F2018 F2019 F2020 F2021
Opening Order Backlog 652 681 746 904 942
Revenues (1,011) (1,115) (1,254) (1,430) (1,430)
Order Bookings 1,134 1,182 1,408 1,468 1,626
Order Backlog Adjustments
(94) (2) 4 - 22
Ending Order Backlog 681 746 904 942 1,160
Measure (C$ mm) F2017 F2018 F2019 F2020 F2021
Cash and cash equivalents
286.7 330.2 224.5 358.6 187.5
Bank indebtedness (1.4) (2.7) (2.0) (4.6) (1.1)
Current portion of long-term debt
(1.3) (0.4) (18.6) (0.1) (0.1)
Long-term debt (326.0) (315.1) (328.2) (598.0) (430.6)
Net cash (debt) prior to IFRS 16
(42.0) 12.0 (124.2) (244.1) (244.3)
Lease liabilities - - - (62.9) (73.0)
Net cash (debt) (42.0) 12.0 (124.2) (307.0) (317.3)
Measure (C$ mm) F2017 F2018 F2019 F2020 F2021
Net Debt (42.0) 12.0 (124.2) (307.0) (317.3)
Adjusted EBITDA 111.7 133.3 161.9 195.1 200.7
Historical Leverage (Net Debt/Adj. EBITDA)
0.4x -0.1x 0.8x 1.6x 1.6x
22
Appendix: Reconciliation of Non-IFRS Measures to IFRS Measures
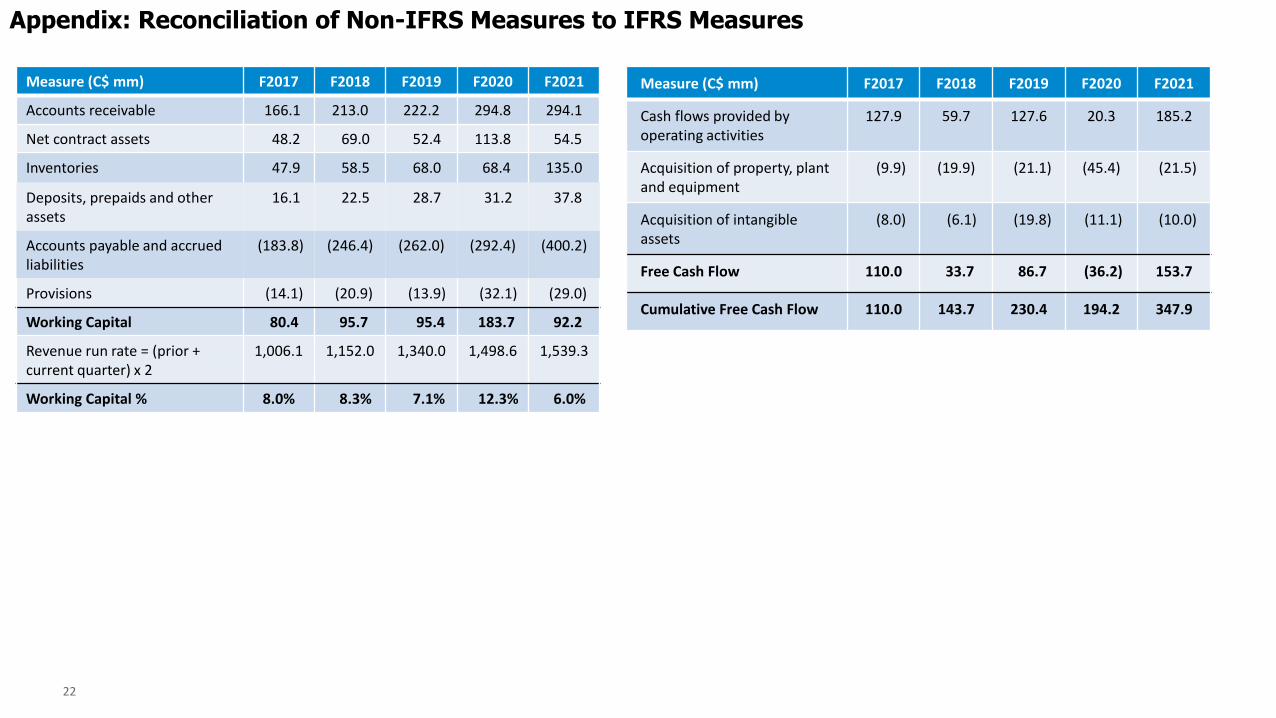
Measure (C$ mm) F2017 F2018 F2019 F2020 F2021
Cash flows provided by operating activities
127.9 59.7 127.6 20.3 185.2
Acquisition of property, plant and equipment
(9.9) (19.9) (21.1) (45.4) (21.5)
Acquisition of intangible assets
(8.0) (6.1) (19.8) (11.1) (10.0)
Free Cash Flow 110.0 33.7 86.7 (36.2) 153.7
Cumulative Free Cash Flow 110.0 143.7 230.4 194.2 347.9
Measure (C$ mm) F2017 F2018 F2019 F2020 F2021
Accounts receivable 166.1 213.0 222.2 294.8 294.1
Net contract assets 48.2 69.0 52.4 113.8 54.5
Inventories 47.9 58.5 68.0 68.4 135.0
Deposits, prepaids and other assets
16.1 22.5 28.7 31.2 37.8
Accounts payable and accrued liabilities
(183.8) (246.4) (262.0) (292.4) (400.2)
Provisions (14.1) (20.9) (13.9) (32.1) (29.0)
Working Capital 80.4 95.7 95.4 183.7 92.2
Revenue run rate = (prior + current quarter) x 2
1,006.1 1,152.0 1,340.0 1,498.6 1,539.3
Working Capital % 8.0% 8.3% 7.1% 12.3% 6.0%