Embed Size (px)
Citation preview

INVESTOR PRESENTATION JUNE 2017

2
Company Overview

3
Executive Summary
• Product Mix can be divided into three broad categories:- i. Polyethylene Terephthalate (PET) Chips: Textile Grade and Bottle Grade ii. Polyester Yarn: Partially Oriented Yarn, Full Drawn Yarn etc. iii. Biaxially-Oriented Polyethylene Terephthalate (BOPET) Films: Thin, Thick, Metallized iv. FY 17 Sales Mix (By Value) :-Chips – 66%, Polyester Yarn – 20%, BOPET Films – 14%
• JBF continues to be a leading player in the global polyester value chain and over time, has gained significant market share in areas where it has had its presence – India, UAE (Ras-Al-Khaimah), Bahrain, Belgium.
• JBF is setting up a 1.25 MMT Purified Terephthalic Acid (PTA) plant at Mangalore SEZ thereby will become an integrated petrochemical company. • JBF also enjoys a preferred supplier status in the regions across the world where it has got its presence. • Each facility enjoys strategic advantages such as location, close proximity to suppliers and customers.
• Some of JBF’s marquee clients include: i. Textile-grade chips & Yarn: Welspun, Jiwarajka, Deepak Polyester ii. Bottle-grade chips: Coca Cola, Pepsi, Nestle, Masafi iii. BoPET films: Amcor, Isovolta, Coveme
• JBF Industries is a global company engaged in the production of polyester value chain • Current polymerisation capacity of 1.43 MMT p.a. and downstream capacity of 544 KMT p.a. • Operates out of 3 domestic facilities, 1 in Gujarat and 2 in Silvassa, and 3 overseas facility in UAE, Belgium and Bahrain. • Promoted by Mr. Bhagirath C. Arya, a technocrat entrepreneur. • Listed on the BSE and NSE with a market cap of INR 22,478 Mn (as on March 31, 2017).
Overview
Products & Business
Mix
Markets
Marquee Clients
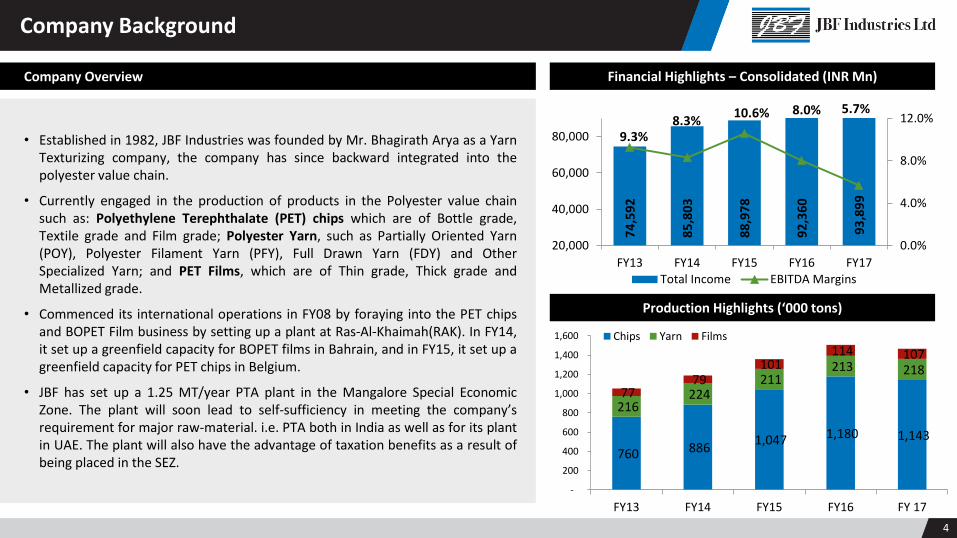
• Established in 1982, JBF Industries was founded by Mr. Bhagirath Arya as a Yarn Texturizing company, the company has since backward integrated into the polyester value chain.
• Currently engaged in the production of products in the Polyester value chain such as: Polyethylene Terephthalate (PET) chips which are of Bottle grade, Textile grade and Film grade; Polyester Yarn, such as Partially Oriented Yarn (POY), Polyester Filament Yarn (PFY), Full Drawn Yarn (FDY) and Other Specialized Yarn; and PET Films, which are of Thin grade, Thick grade and Metallized grade.
• Commenced its international operations in FY08 by foraying into the PET chips and BOPET Film business by setting up a plant at Ras-Al-Khaimah(RAK). In FY14, it set up a greenfield capacity for BOPET films in Bahrain, and in FY15, it set up a greenfield capacity for PET chips in Belgium.
• JBF has set up a 1.25 MT/year PTA plant in the Mangalore Special Economic Zone. The plant will soon lead to self-sufficiency in meeting the company’s requirement for major raw-material. i.e. PTA both in India as well as for its plant in UAE. The plant will also have the advantage of taxation benefits as a result of being placed in the SEZ.
4
Company Background
Financial Highlights – Consolidated (INR Mn)
Production Highlights (‘000 tons)
Company Overview
74
,59
2
85
,80
3
88
,97
8
92
,36
0
93
,89
9
9.3% 8.3%
10.6% 8.0% 5.7%
0.0%
4.0%
8.0%
12.0%
20,000
40,000
60,000
80,000
FY13 FY14 FY15 FY16 FY17Total Income EBITDA Margins
760 886 1,047 1,180 1,143
216 224
211 213 218
77 79
101 114 107
-
200
400
600
800
1,000
1,200
1,400
1,600
FY13 FY14 FY15 FY16 FY 17
Chips Yarn Films

Mr. Bhagirath C Arya
Executive Chairman
• Qualified with a Bachelor’s Degree in Electrical Engineering • Equipped with over 35 years experience in the Polyester industry particularly in the field of synthetic yarn • Presently acting as Executive Chairman, handles all management and operating affairs of the Company.
• B. Tech, MS & MBA degree holder; associated with the Company since January 1997 • Equipped with over 35 years of experience; worked as Vice President (Marketing) at J.K. Synthetics Ltd and Nirlon Ltd • Presently acting as Managing Director with a particular focus on production and marketing functions
Mr. Rakesh Gothi
Managing Director & CEO
• Qualified science graduate; associated with the Company since 1992 • Over 25 years of experience; previously Manager in the Production Department of Armour Chemicals • Presently acting as Commercial Director and responsible for managing material procurement, inventories management, excise and other
commercial tax related matters etc.
Mr. Nilesh K. Shah
Director - Commercial
• Associated with textile sector for over 25 years; Served in a senior role with Pioneer Embroideries, Gini & Jony, Allied Digital and Ginja Industries • Responsible for turning around Ginja Industries (unlisted) from default rating to A- credit rating • Presently acting as Chief Financial Officer and responsible for handling finance function
Mr. Ajay Agrawal
Chief Financial Officer
• Chemical Engineer with a Diploma in Marketing with rich & varied experience of more than 19 years in petrochemical industry. • His prior work experience includes stints in polyester industry of both India & China, providing in-depth business understanding of the two
largest polyester industry hubs.
Mr. Rohit Maindwal
COO & Director
• Management graduate with in-depth understanding of global petrochemical industry & polyester businesses. • Under his leadership JBF RAK LLC has scaled new heights continuously during last six years of operations in UAE. • All the overseas expansion projects of JBF Group are being executed under his supervision
Mr. Cheerag B Arya
CEO & Director
• Charted Accountant by qualification with more than 31 Years of experience in Corporate Finance and Accounting. • He had joined JBF RAK since inception in 2006 & is currently overseeing all financial & regulatory compliance functions in the company as its Chief
Financial Officer.
Mr. Gangadhara S. Poojary
CFO
• B.Tech in Chemical Engineering and Post Graduation in Diploma in Business Management with over 29 years experience in mega industries like
MCF, MRPL, & MSEZL. • He had joined in November 2011 and currently is the CEO of the PTA plant (JBF Petrochemicals Ltd) in Mangalore.
Mr. A Gopalkrishna Pai
CEO – JBF Petrochemicals
Ltd (PTA)
5
Key Managerial Personnel JB
F IN
DIA
JB
F R
AK

Marquee Investors % Holding
KKR 20.00%
New Horizon Opportunities Master Fund 3.94%
Life Insurance Corporation of India 2.59%
Jupiter India Fund 2.33%
Cresta Fund Ltd 2.07%
Eriska Investment Fund 1.55%
TOTAL 32.48%
Shareholding Pattern (as on March 31st , 2017)
Source: BSE India, Company data 6
Facilities & Shareholding Pattern
JBF Industries Ltd
SILVASSA Plants
JBF Global Pte. (Singapore)
JBF Ras Al-Khaimah
100%
43% 20% 37%
100%
Existing Projects
100%
100%
100%
JBF Belgium
JBF Bahrain
SARIGAM Plant
Proposed Project
JBF Petrochemicals Ltd. (Mangalore SEZ)
Promoters Public Institutions
Promoter 43%
KKR 20%
FII 14%
DII 3%
Public 20%

2012-present 2008-2011 2006-2007 2003-2005 2000-2002 1995-1999 1982-1994
7
Key Milestones
• Incorporated in 1982, established itself as one of India’s Leading Polyester Texturisers
• Entered yarn manufacturing in 1996, capacity 18,000 MT/ Expanded to 36,000 in 1999
• Backward integration into chips production with 36,000 MT in Mar 01/ Expanded to 72,000 in Nov. 01
• Expansion: Chips – 108 KTA, Yarns – 144 KTA Setup Sarigam facility; 216 KTA textile grade chips
• Commissioned Ras Al Khaima UAE plant; Capacity: 216 KTA grade chips and BOPET Film capacity of 48 KTA
• Increased India Textile chips capacity to 460 KTA, RAK Bottle grade chips capacity to 390 KTA and BOPET Film capacity of 66 KTA at RAK
• Set up greenfield capacities in Belgium for PET Chips, in Bahrain for BOPET Film.
• Backward integrated by setting up a PTA plant.
Ability to grow continuously through backward integration and scale...

8
Our Production Facilities & Capacity
Geel, Belgium: PET Chips (Bottle-grade) - 390,000 MT p.a.
Sarigam, Gujarat: PET Chips (Yarn & Bottle-grade)- 608,000 MT p.a.
Athola and Saily, Silvassa: Polyester Yarn - 262,000 MT p.a. Texturized Yarn - 90,000 MT p.a.
Mangalore: PTA - 1,250,000 MT p.a.
Ras Al-Khaimah - UAE:
PET Chips (Bottle & film-grade) - 432,000 MT p.a.
BOPET Films - 102,000 MT p.a.
Bahrain : BOPET Films - 90,000 MT p.a.

9
Strategic Advantages of Plant Locations
• Manufacturing units are strategically located - customers (of polyester chips and POY located within 25-km radius of its plants and key raw material suppliers (RIL, Mitsubishi, IOC) located within 150-km radius of its plants.
• Both the plants at Gujarat at located in close proximity to each other and close to the textile hub of Surat. • Backward Integration by setting up a PTA facility in SEZ zone with a capacity of 1.25 million for production; technology licensed from British
Petroleum – operations to commence by end of FY17.
India
• Co-located on the British Petroleum Site at Geel next to British Petroleum’s (BP) PTA facility – this ensures a continuous supply of PTA. • All customers are located within a 100-km radius of the Geel plant. • State-of-the-art technology by Uhde Inventa-Fischer’s Melt-To-Resin (MTR) technology which enables JBF Industries to produce top-quality PET
chips at lower cost.
Belgium
• Tax free and no export duty zone. • Easy availability of raw material, moreover, having status of preferred supplier in the region. • Located near a major port, giving easy access for exporting to USA and Europe.
UAE
• Plant located at free trade zone with significant support from the Bahrain Government. • Further, Bahrain has a free trade agreement with the US (50% of the US BOPET films requirement is met through imports), the company’s facility
would improve its competitiveness resulting in higher business from the US. • State of the art BOPET film machinery from Dornier of Germany.
Bahrain

10
Business Overview

Basic Petrochemicals Polyester Value Chain Applications
Purified Terephthalic Acid (PTA)
Mono Ethylene Glycol
(MEG)
Textile Grade Chips
Partially Oriented yarn (POY)
Specialized yarn (FDY/Micro POY)
Film Grade chips
BoPET Films
Yarn manufacturers
Weaving-Fabric, Garment
Value Chain segments covered by JBF Industry application
Solar Industry, FMCG & Other
Applications
1MT of Polyester melt
0.86 CF
0.34 CF
Bottle Grade chips (PET)
Application in FMCG industry
Condensate / Naphtha
Paraxylene
0.65 CF
CF- Conversion factor
11
Business Value Chain

Textile Grade Chips & Yarn
Bottle Grade Chips
Film
12
Clientele Mix

…..Ensures acceleration into higher value added products
~Delta is calculated as Revenue (Less) Raw Material
FY 17 FY 11
India 54%
Outside India 46%
Outside India 57%
India 43%
13
Revenue Mix
Historical Product Deltas
FY 11 FY 17 *India and RAK Sales
Product Mix* (By Volume in ‘000)
Chips India 28%
POY 26%
PET Chips RAK 28%
Films 18%
FY 11 FY 17 ^ Includes Speciality Yarn
^
^
Product Mix (By Value)
Sales Mix (By Geography)
Product Delta Range ~
Chips – India (INR/Kg) 3-12
POY (INR/Kg) 8-24
Chips – RAK (USD/MT) 133-300
PET Film (USD/MT) 556-2,223
Well Diversified Business Model
Chips India 23%
POY 20%
PET Chips Intl
43%
Films 14%
CHIPS India 276
POY 207
Chips RAK 278
Film 76 Chips
India 321
POY 216
PET Chips Intl 591
Films 112

23
,02
0
24
,08
0
20
,85
0
18
,59
0
20
,83
2
2,74,095 2,66,550
2,55,631 2,91,059
3,21,448
1,00,000
1,50,000
2,00,000
2,50,000
3,00,000
3,50,000
0
5,000
10,000
15,000
20,000
25,000
30,000
FY 13 FY 14 FY 15 FY 16 FY 17Revenues Volume
• Polyethylene Terephthalate (PET) chips is one of the major and most common polymer resin of the polyester family. PET is the condensation product of Purified Terephthalic Acid (PTA) and Mono Ethylene Glycol (MEG) using the polymerization process.
• PET chips can be used in fibres for clothing in the textile industry, to make bottles for drinking water, carbonated drinks, beverages, edible oils and other liquids and also to make PET films. As a raw material, PET is globally recognized as a safe, non-toxic, strong, lightweight, flexible material that is 100% recyclable.
• JBF’s PET Chips are categorised into three grades – Textile grade, Bottle grade and Film grade.
a) Textile Grade: Textile-grade polyester chips are used for making partially oriented yarn, fully drawn yarn and texturized yarn. The Yarn grade (Textile grade) chips are available in Super Bright, Semi Dull, Cationic Semi Dull & Cationic Super Bright PET chips.
b) Bottle Grade: Various types of bottle grade chips are produced depending on the intrinsic viscosity, melting point, color value, etc. The Bottle grade chips are used in making bottles for mineral water carbonated drinks, beverages, edible oils, flavouring and candy containers, etc.
c) Film Grade: High quality chips without Silica & CiO2 contents are used to make PET Films. Types of films manufactured include super clear, optical, transparent, hazy, matte, etc. These films are widely used in the packaging industry such as food packaging, packaging of soaps, detergents, tea, etc.
Belgium plant commenced operations in FY15 14
INR
(in
Mill
ion
s) V
olu
me (M
T) PET Chips
Net Sales and Volume – Domestic
Net Sales and Volume – Overseas
33
2
49
2
62
7
65
2
57
6
2,48,625
3,38,912
5,24,339 6,62,043 5,91,431
1,00,000
2,00,000
3,00,000
4,00,000
5,00,000
6,00,000
7,00,000
0
100
200
300
400
500
600
700
FY 13 FY 14 FY 15 FY 16 FY 17
Revenues
Volume
Vo
lum
e (MT)
USD
(in
Mill
ion
s)

15
• JBF is one of the largest Partially Oriented Yarn(POY) producers in India and is recognized for its quality, commitment and service.
• The types of yarn produced by JBF include:
a) Partially Oriented Yarn (POY): • Partially oriented yarn is produced from the melting and extrusion (melt spinning) of
the polyester chips. • During the spinning process, the filaments are stretched as much as five times their
original size to meet the desired evenness, strength and elongation properties. • The filament is only partially stretched, hence, the term partially oriented yarn. • POY is mainly used in texturizing to make textured yarn and can also be used in draw
warping for weaving and warp knitting of fabrics.
b) Fully Drawn Yarn (FDY): • Fully drawn yarn is produced by a process similar to POY manufacturing except that the
yarn is produced at even higher spinning speeds coupled with intermediate drawing integrated in the process itself thus giving stabilization.
• FDY is mainly used as weft or warp in making fabrics. It can be knitted or woven with any other filament yarn to get fabric of various different varieties.
c) Texturized Yarn: • POY is further processed and is then available in various deniers and in black, optical
white and dope dyed colors. • Texturizing is the smoothening treatment which is given to partially oriented yarn or other
such filaments after which the yarn acquires some form of loops, curls, coils or crimps. • Texturizing makes the yarn look denser, bulky and more stretchable.
Polyester Yarn
Net Sales and Volume – POY
Net Sales and Volume – Processed Yarn
INR
(in
Mill
ion
s) V
olu
me (M
T)
INR
(in
Mill
ion
s) V
olu
me (M
T)
18
,20
0
18
,85
0
14
,24
0
10
,72
7
10
,49
5
1,83,849 1,83,776
1,49,414
1,33,051 1,25,578
60,000
80,000
1,00,000
1,20,000
1,40,000
1,60,000
1,80,000
2,00,000
0
2,000
4,000
6,000
8,000
10,000
12,000
14,000
16,000
18,000
20,000
FY 13 FY 14 FY 15 FY 16 FY 17
Revenues Volume
INR
(in
Mill
ion
s)
Vo
lum
e (MT)
INR
(in
Mill
ion
s)
3,7
20
4,7
79
6,1
30
6,8
50
7,6
48
33,062
41,264
58,421 79,436
90,844
10, 000
20, 000
30, 000
40, 000
50, 000
60, 000
70, 000
80, 000
90, 000
1,0 0,000
1,000
2,000
3,000
4,000
5,000
6,000
7,000
8,000
FY 13 FY 14 FY 15 FY 16 FY 17
Revenues Volume
Vo
lum
e (MT)

• BoPET (Biaxially-oriented polyethylene terephthalate) film is a polyester film made from stretched polyethylene terephthalate (PET) and is used successfully in a wide range of application, due to its excellent combination of optical, physical, mechanical, thermal characteristics.
• The traditional segmentation of PET films has been thin and thick films based on distinct applications and lack of supply side substitutability.
a) Thin Films: Films below 50 microns are characterized as thin film. End applications include food packaging, insulating material, cosmetics etc.
b) Thick Films: Thick films have a thickness range of 50–350 microns and have higher end applications like solar panels, LCD (Liquid crystal display). Electrical and industrials are the key end-users in the thick film industry.
16
Bahrain plant commenced operations in FY15
USD
(in
Mill
ion
s)
BOPET Films
Net Sales & Volume – Overseas
16
1
15
5
21
7
20
6
19
3
77,010 69,788
1,04,023 1,08,065
1,12,481
20, 000
30, 000
40, 000
50, 000
60, 000
70, 000
80, 000
90, 000
1,0 0,000
1,1 0,000
1,2 0,000
0
50
100
150
200
250
FY 13 FY 14 FY 15 FY 16 FY 17
Revenues Volume
Vo
lum
e (MT)

• PTA is the key raw material for the manufacture of polyester fiber, resins, and films. PTA is used to produce polyethylene terephthalate (PET), which flows into the production of goods such as textiles, food and beverage containers, etc.
• PTA is produced by the oxidation of Paraxylene (Px) in acetic acid, in the presence of air.
• JBF currently consumes ~800-900 KT p.a. of PTA at India and RAK and maintains an average of 10-15 days of inventory, this is anticipated to reduce to less than 5 days. The PTA plant will entirely suffice to meet this requirement.
• Imports to JBF RAK and India take ~3-4 weeks delivery time currently, which is anticipated to reduce to 3-5 days to RAK and 1-2 days to India.
• JBF expects to save approx. $40-$50 per ton in freight for its RAK facility, due to reduction in logistical costs that it incurs currently by procuring PTA from South East Asia.
17
Purified Terephthalic Acid
PTA-Px Delta
11
0
18
0
14
3
82
53
50
12
4
14
1
12
4
12
6
13
3
11
9
14
0
13
6
13
1
14
6
12
8
13
9
13
1
12
4
11
2
12
2
12
1
14
1
14
3
020406080
100120140160180200
Apr-15 Jul-15 Oct-15 Jan-16 Apr-16 Jul-16 Oct-16 Jan-17 Apr-17
($/M
T)

• JBF has set up a 1.25 MMT p.a capacity PTA plant, which will be amongst the largest of its kind in India.
• The plant will be located in the Mangalore SEZ, for which 114 acres of land has been allotted.
• Raw material [Paraxylene (Px)] tie-up has been completed with OMPL (a subsidiary of MRPL) which is only 1 km away within the same SEZ.
• JBF also has the ability to import Px as the plant is 7 kms from the Mangalore Port.
18
Expansion Plans – Mangalore PTA Project
Mangalore, Karnataka Purified Terephthalic Acid (PTA) – 1,250,000 p.a.
Timeline: Completed at FY17 year end • Expected Total Project Cost: $700mn • Funding: Debt financing of $464mn via ECB is underwritten by IDBI Bank. • KKR has invested $150mn equity to complete the project.
Kateel Moodbidri
MSEZ
Nellithirtha
Mulki
Panambur
MANGALORE
Bajpe Airport
Polali
Nandavara
Naraharibetta
Karimanjeshwar
NH 48
NH
13
KARKALA
Venooru
BANTWAL • All necessary permits, clearances have been received to begin plant construction.
• Leveling of Land, Boundary Wall construction, peripheral drain, road development all have been completed.
• The site has been handed over to the EPC contractor Technip and the Technology provider British Petroleum.
• Plant has been completed and will commence commercial operations shortly.
Project Update

19
BP-PTA Technology - Advantages
• British Petroleum’s First Third Party, Non-Affiliate, Licensing of latest generation PTA technology, BP PTA+.
• Originally developed in the 1950’s, improved through successful iterations.
• BP PTA technology is based on a track record of successful technology development, commercialisation and flawless project execution - deployed at BP sites, most recently Zhuhai 3, China (running at 99.2% reliability).
• Relies on proprietary technology to deliver 75% lower water discharge, 65% lower GHG emissions, and 95% lower solid waste generation than conventional PTA plants.
• Technip, being a BP preferred EPC contractor, and having an alliance with BP since 1999, allows for schedule and cost advantages, technical integrity assurance and risk management.
• The PTA plant will have an exothermic heat recovery and integration system which allows for significantly lower operating costs compared to conventional PTA plants. The plant will be a net generator of electricity.
• Based on BP experience and industry data, new technology will have a $15/ton higher VC for at least 3 years until new technology issues are resolved.
BP Proven Technology Competitor New/Unproven Technology
Start-up Duration (Median) 1 month 4 months
Start-up Duration Variability 85% within 6 months 85% within 14 months
Initial Operability After Start-up 93+% 60%
Source: Internal Research, BP
-10
0
10
20
30
40
50
60
70
80
80s 90s BP (2015) BP PTA+ ExistingCompetitors
Competitornew
(unproven)
Energy Costs Variable Costs
Substantial lead over best demonstrated competitor technology

20
Industry Overview

When you drink When you sleep When you cook When you need surgery
When you play When you drive When you celebrate When it’s time for adventures
When you need safety When you need to stay dry When you dress up When you need to be responsible
21
Global Polyester Demand Drivers
Day-to-day Applications

Beer Bottles LCD/LED Screens Mobile Phones
Shoes Solar Power Plant Bottle
22
Future Polyester Demand Drivers

0
20
40
60
80
100
0
10
20
30
40
50
60
70
2010 2011 2012 2013 2014 2015 2016 2017 2018 2019 2020
Capacity Consumption Utilization rate
Source: Internal Research, IHS 23
0
20
40
60
80
100
0
10
20
30
40
2010 2011 2012 2013 2014 2015 2016 2017 2018 2019 2020
Capacity Consumption Utilization Rate
Global Paraxylene and Mono-Ethylene Glycol (MEG) Market
• The global paraxylene (Px) market was valued at $34,745.7 million in 2015 and reached approx. 38 million tons driven by the markets for PET resin and polyester fibre. It is anticipated to witness an growth rate of approx. 5% during the forecasted period 2015-2020.
• The rising demand for PTA from such applications is expected to significantly influence the demand for paraxylene during the forecasted period.
• Moreover, the increasing production of PET for packaging and film applications is anticipated the drive the demand for PTA which in turn boosts the paraxylene market growth.
• 2015 global demand for monoethylene glycol (MEG) was an estimated 25.7 million mt. and is likely to increase at 4% CAGR during the forecast period.
• India and China, being major consumer markets, which require significant amounts of MEG feedstock to produce polyester fibres and PET resins, will continue to be the main drivers of growth.
• China accounted for around 12.85 million mt. or about half of the 2015 global demand.
• Indian MEG scenario will continue to remain oversupplied with a capacity of over 5 MMT pa in 2016 and an estimated demand of 2.1 MMT pa in 2016.
Global Px Supply Capacity & Utilization (2010-2020)
Global MEG Capacity & Utilization (2010-2020)
% U
tilization
Mill
ion
met
ric
ton
nes
% U
tilization
Mill
ion
met
ric
ton
nes

• The global Purified Terephthalic Acid (PTA) market reached approximately 55 MMT in 2015 and is expected to grow at a CAGR of 5% for the forecast period of 2015-2020.
• The market is segmented on the basis of applications including textiles, bottling & packaging and furnishing.
• High consumption of PTA in polyester component and unsaturated polyester resins is expected to propel market growth. Textiles were the largest market followed by bottling & packaging and furnishing.
• Asia Pacific was the largest market on account of high concentration of manufacturing industries particularly in China and India.
• Moreover, Asia Pacific is expected to witness fastest growth over the forecast period owing to increasing disposable income and improving consumer standard of living. Europe and North America followed Asia Pacific in terms of market volume share.
Source: Internal Research
0
10
20
30
40
50
60
70
80
90
100
0
10
20
30
40
50
60
70
80
90
100
2010 2011 2012 2013 2014 2015 2016 2017 2018 2019 2020
Capacity Consumption Utilization Rate
% U
tilization
24
• Global PTA utilisation rates in 2016 begin to recover to 76%.
• China with existing overcapacity for PTA will continue to remain oversupplied.
• Capacity to remain flat going forward while older plants phase out.
• India will see declining import dependency for PTA owing to recent large plants start ups.
Global Purified Terephthalic Acid Market
Global PTA Capacity & Utilization (2010-2020)
Mill
ion
met
ric
ton
nes

• The global PET Resin consumption was 20.2 million tons in 2015 and is expected to grow at a CAGR of 6.1% to reach 26.6 million tons by 2020.
• PET Resin production is driven by a large demand from the use of PET resins in bottle, film and food packaging. PET is the most widely used and fastest growing polymer for plastic jars and bottles. With the growth in population, urbanization in developing countries and increasing disposable income tends to drive the demand for bottled beverages.
• Moreover, PET is the only polyester which is recyclable among the competing thermosetting material available in the market. It is also replacing traditional packaging material such as glass, paper, metal, and aluminium due to its high strength, light weight, clarity and long-term durability.
Source: Internal Research/Petrochemical Conclave/PlasticsInsight 25
Global PET Resin Demand
Global PET Resin Consumption (2015-2020)
Global PET Resin Consumption - 2015
Mill
ion
met
ric
ton
nes
20
,18
2
21
,03
1
22
,25
8
23
,61
4
25
,05
4
26
,58
3
2015 2016 2017 2018 2019 2020
India 7%
China 27%
Europe 17%
North America
17%
Asia (except India & China)
16%
Middle East & Africa
9%
South America 7% • PET resin growth to outpace rate of polyester fibre and film.
• China is not only the largest producer of PET Resin but also the largest consumer of PET bottles.
• Asia is the largest consumer of PET resin with a greater than 50% market share.

Source: Wazir Advisors/Internal Research
• Global cotton and man-made fibre production was estimated to be 88.5 million tonnes in 2015. Man made fibres accounted for 66.8 million tonnes, a growth of 6% over 2014 whereas cotton production declined by 16.6% from 26.0 million tonnes to 21.7 million tonnes. The man made fibre production accounts for nearly 75% share.
• Globally polyester consumption and market share registered a 9% growth over 2014 and is expected to grow at a 4.4% CAGR till 2020.
• The Indian fibre industry demand was estimated at 9.14 million tonnes in 2015-16 whereas the estimated production was 10.4 million tonnes.
• In India, cotton fibre production is estimated at 6.0 million tonnes, registering a 9.5% decline whereas polyester fibre production is estimated at 3.87 million tonnes, up by 0.5%.
• The Indian textile industry is still cotton focused. However, consumption of polyester fibre is gaining momentum due to factors like fluctuation of cotton prices, increased presence & sourcing by global brands within India. Volatility and upward trend of cotton price has already pushed the fibre mix in favour of Polyester for major apparel and home textile products.
37% 36% 36% 35% 33% 31% 31% 31% 31% 30% 27%
36% 43% 44% 46% 48% 50% 50% 51% 51% 52% 59%
27% 21% 20% 19% 19% 19% 18% 18% 18% 18%
14% 0%
20%
40%
60%
80%
2000 2007 2008 2009 2010 2011 2012 2013 2014 2020 2030
Cotton Polyester Others
Global Fibre Consumption Trend (2000-2030)
Polyester 55%
Cotton
25%
Others
21% Polyes
ter 37%
Cotton 58%
Others 5%
Global Fibre Production Breakup 2015
26
Global Polyester Market
India Fibre Production Breakup 2015

• Bi-oriented polyethylene terephthalate (BOPET) film is among the most rapidly increasing polymer substrates on the market. BOPET film demand is projected to exceed 4M tonnes in 2016, up by over 1M tonnes since 2010 due to strong consumption in packaging and technical uses.
• It is predicted that total BOPET film demand will grow at a CAGR of 6% to reach 5.2 M tonnes by 2020.
• The major leading consumers of BOPET films include China (37%), Northeast Asia (18%) and North America and Europe together (23%). The remaining 22% is distributed among Southeast Asia, South America, the Indian subcontinent and Middle East and Africa. These four regions, along with China, will witness the most rapid growth in the next five years due to accelerating industrial industries and expanding organized retail sector.
• Traditional segmentation of PET films has been between thin and thick film based on their application.
• The largest application of thin film is flexible packaging, which accounts for 74% of thin film usage. Packaging demand is resilient as it is driven by the consumption of food products and consumer staples and has resulted in steady demand growth, despite economic slowdown.
• Electrical and industrials are the key end-users in the thick film industry. Major innovative applications in the future for thick films include for flat screen panels and photovoltaics.
73%
20%
6% 1%
74%
17%
8% 1% Packaging andmetallized film
Other Industrial
Electrical
Magnetic Media andImaging
2010 – 2,166 KMT
2015 – 3,217 KMT
Global Thin PET Film Demand by end users
Global Thick PET Film Demand by end users
8%
12%
58%
22%
8%
11%
67%
14% Packaging and metallizedfilm
Other Industrial
Electrical
Magnetic Media andImaging
2010 – 713 KMT
2015 – 883 KMT
Source: AMI Consulting/Internal Research 27
Global BOPET Market

28
Financial Performance
Particulars FY12 FY13 FY14 FY15 FY16
(“Ind AS”) FY17
(“Ind AS”)
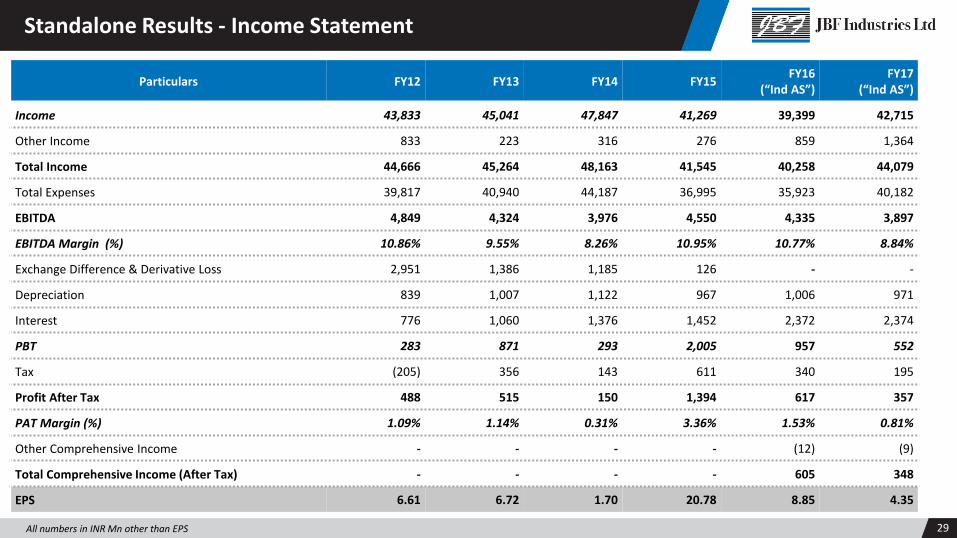
Income 43,833 45,041 47,847 41,269 39,399 42,715
Other Income 833 223 316 276 859 1,364
Total Income 44,666 45,264 48,163 41,545 40,258 44,079
Total Expenses 39,817 40,940 44,187 36,995 35,923 40,182
EBITDA 4,849 4,324 3,976 4,550 4,335 3,897
EBITDA Margin (%) 10.86% 9.55% 8.26% 10.95% 10.77% 8.84%
Exchange Difference & Derivative Loss 2,951 1,386 1,185 126 - -
Depreciation 839 1,007 1,122 967 1,006 971
Interest 776 1,060 1,376 1,452 2,372 2,374
PBT 283 871 293 2,005 957 552
Tax (205) 356 143 611 340 195
Profit After Tax 488 515 150 1,394 617 357
PAT Margin (%) 1.09% 1.14% 0.31% 3.36% 1.53% 0.81%
Other Comprehensive Income - - - - (12) (9)
Total Comprehensive Income (After Tax) - - - - 605 348
EPS 6.61 6.72 1.70 20.78 8.85 4.35
All numbers in INR Mn other than EPS 29
Standalone Results - Income Statement

EQUITIES & LIABILITIES FY14 FY15 FY16
(“Ind AS”) FY17
(“Ind AS”) ASSETS FY14 FY15
FY16 (“Ind AS”)
FY17 (“Ind AS”)
Shareholder Funds Non Current Assets
(A) Share Capital 802 804 819 819 (A) Property, plant, Equipment's 15,470 16,264 15,465 15,208
(B) Reserves& Surplus 9,153 10,218 14,771 15,099 (B) Capital work-in-progress - - 26 116
Total - Shareholder Funds 9,955 11,022 15,590 15,918 (C) Investment Property - - 2 2
(D) Other Intangible Assets - - 22 16
Non Current Liabilities (E) Financial Investments 4,238 4,235 3,993 4,091
(A) Long Term Borrowings 6,696 8,250 5,884 6,085 (F) Other Financial Assets 1,046 1,132 768 1,021
(B) Other Financial Liabilities - - 920 959 (G) Other Non - Current Assets - 463 642 798
(C) Long Term provisions 236 125 62 80 Total – Non – Current Assets 20,754 22,094 20,918 21,252
(D) Deferred Tax Liabilities (Net) 1,705 2,242 2,231 2,309 Current Assets
Total - Non – Current Liabilities 8,637 10,617 9,097 9,433 (A) Inventories 4,405 3,353 3,634 4,497
(B) Current Investments 7 2 2 2
Current Liabilities (C) Trade Receivables 6,123 5,647 9,048 8,936
(A) Short term Borrowings 5,341 7,047 9,000 8,090 (D) Cash and cash Equivalents 425 2,147 258 298
(B) Trade Payables 6,149 3,088 4,801 8,776 (E) Bank Balances 2,984 3,550
(C) Other Financial Liabilities - - 3,036 2,772 (E) Short-term loans and advances
1,591 2,061 4,162 4,766
(D) Other Current Liabilities 3,226 3,033 983 123 (F) Other Financial Assets - 775 913
(E) Provisions 511 609 179 248 (G) Current Tax Assets (Net) - 367 388
Total – Current Liabilities 15,227 13,777 17,999 20,009 (H) Other current assets 514 112 538 758
Total - Current Assets 13,065 13,322 21,768 24,108
GRAND TOTAL - EQUITIES & LIABILITIES
33,819 35,416 42,686 45,360 GRAND TOTAL – ASSETS 33,819 35,416 42,686 45,360
All numbers in INR Mn
Standalone Results - Balance Sheet
Particulars FY12 FY13 FY14 FY15 FY16
(“Ind AS”) FY17
(“Ind AS”)
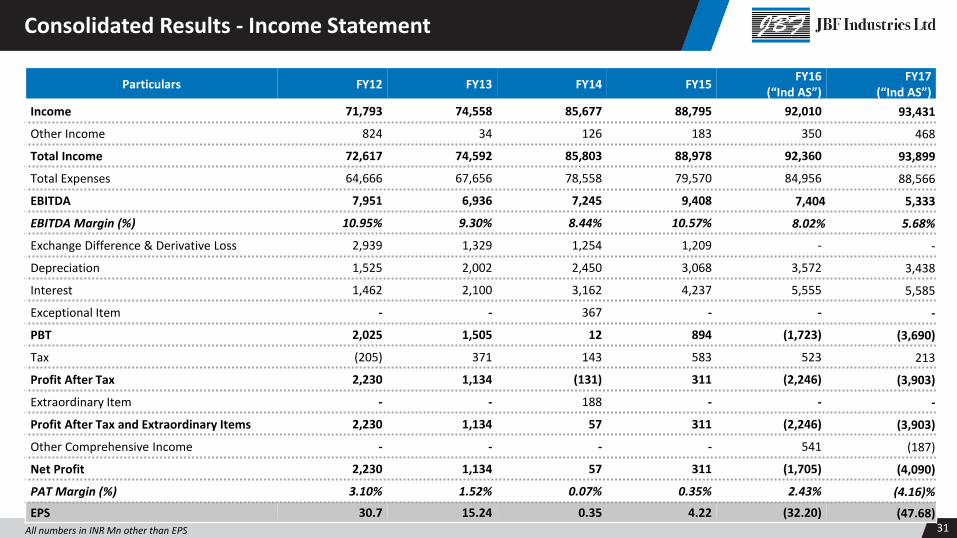
Income 71,793 74,558 85,677 88,795 92,010 93,431
Other Income 824 34 126 183 350 468
Total Income 72,617 74,592 85,803 88,978 92,360 93,899
Total Expenses 64,666 67,656 78,558 79,570 84,956 88,566
EBITDA 7,951 6,936 7,245 9,408 7,404 5,333
EBITDA Margin (%) 10.95% 9.30% 8.44% 10.57% 8.02% 5.68%
Exchange Difference & Derivative Loss 2,939 1,329 1,254 1,209 - -
Depreciation 1,525 2,002 2,450 3,068 3,572 3,438
Interest 1,462 2,100 3,162 4,237 5,555 5,585
Exceptional Item - - 367 - - -
PBT 2,025 1,505 12 894 (1,723) (3,690)
Tax (205) 371 143 583 523 213
Profit After Tax 2,230 1,134 (131) 311 (2,246) (3,903)
Extraordinary Item - - 188 - - -
Profit After Tax and Extraordinary Items 2,230 1,134 57 311 (2,246) (3,903)
Other Comprehensive Income - - - - 541 (187)
Net Profit 2,230 1,134 57 311 (1,705) (4,090)
PAT Margin (%) 3.10% 1.52% 0.07% 0.35% 2.43% (4.16)%
EPS 30.7 15.24 0.35 4.22 (32.20) (47.68) All numbers in INR Mn other than EPS 31
Consolidated Results - Income Statement

All numbers in INR Mn
EQUITIES & LIABILITIES FY14 FY 15 FY16
(“Ind AS”) FY17
(“Ind AS”) ASSETS FY14 FY15
FY16 (“Ind AS”)
FY17 (“Ind AS”)
Non Current Assets
Shareholder Funds (A) Fixed Assets 62,372 84,651 - - (A) Share Capital 802 804 819 819 (B) Property, Plant , Equipment's - - 62,453 58,605
(B) Reserves& Surplus 18,045 17,551 23,424 19,811 (C) Capital work-in-progress - - 40,232 48,104 Total -Shareholder Funds 18,847 18,355 24,243 20,630 (D) Investment Property - - 2 2
Minority Interest - - 2,217 1,709 (E) Goodwill on Consolidation 1,048 1,092 1,180 1,156
(F) Other Tangible Assets - - 231 289 Non Current Liabilities (G) Financial Investments 26 24 7 7 (A) Long Term Borrowings 45,587 61,672 71,872 71,593 (H) Other Financial Assets - - 80 709
(B) Other Financial Liabilities - - 921 959 (I) Long Term Loans & Advances 6,624 2,236 - -
(C) Provisions 403 342 349 347 (J) Deferred Tax Assets - - 2 278
(D) Deferred Tax Liabilities (Net) 1,705 2,242 2,261 2,374 (K) Other Non-Current Assets 6 6 755 887
(E) Other Long Term liabilities 352 255 252 224 Total - Non – Current Assets 70,076 88,009 1,04,942 1,10,037
Total - Non – Current Liabilities 48,047 64,511 75,655 75,497 Current Assets
(A) Inventories 10,440 10,550 10,894 11,070
Current Liabilities (B) Financial Assets (A) Short term Borrowings 13,923 20,645 30,928 30,542 Investments - - 2 2 (B) Trade Payables 11,841 18,233 17,671 20,130 Trade Receivables 11,504 14,508 19,276 20,433 (C) Other Financial Liabilities - - 11,729 15,187 Cash Balances 4,870 4,735 2,911 1,274 (D) Other Current Liabilities - - 298 320 Bank Balances 8,903 8,638 (E) Provisions 727 997 352 416 Loans 4,768 13,503 1,572 1,463 (F) Current Tax Liabilities (Net) 68 36 207 32 Others - - 10,234 7,606 Total – Current Liabilities 34,931 48,554 61,185 66,627 (C) Current Tax Asset (Net) - - 367 442
(D) Other Current Assets 160 113 4,199 3,498
Total – Current Assets 31,749 43,411 58,358 54,426
GRAND TOTAL - EQUITIES & LIABILITIES
1,01,825 1,31,420 1,63,300 1,64,463 GRAND TOTAL – ASSETS 1,01,825 1,31,420 1,63,300 1,64,463
Consolidated Results – Balance Sheet

Share Price Performance
Source: Bloomberg, Capitaline, BSE India
Face Value (INR) 10
Market Price (INR) 277.85
52 week H/L (INR) 283.75/ 183.00
Market Cap (INR Mn) 22,748.10
Equity Shares Outstanding (Mn) 81.9
Free Float (Mn) 12,927
1 Year Avg. Trading Volume (‘000) 158.33
Shareholding Pattern (as on 31st March, 2017)
33
Market Data (Bloomberg – JBF IN, Reuters – JBFI.BO)
Price Data (as on 31st March, 2017)
Promoter 43%
KKR 20%
FII 14%
DII 3%
Public 20%
-10%
0%
10%
20%
30%
40%
50%
60% JBF Sensex

For further details please contact our Investor Relations Representatives:
JBF Industries Ltd. Express Towers, 8th Floor, Nariman Point, Mumbai – 400 021
Anuj Sonpal Valorem Advisors Tel: +91-22-3006-7521/22 Email: [email protected]
JBF Industries Ltd. Disclaimer:
No representation or warranty, express or implied, is made as to, and no reliance should be placed on, the fairness, accuracy, completeness or correctness of the information or opinions contained in this presentation. Such information and opinions are in all events not current after the date of this presentation. Certain statements made in this presentation may not be based on historical information or facts and may be "forward looking statements" based on the currently held beliefs and assumptions of the management of JBF Industries Ltd. (“Company” or “JBF Industries Ltd”), which are expressed in good faith and in their opinion reasonable, including those relating to the Company’s general business plans and strategy, its future financial condition and growth prospects and future developments in its industry and its competitive and regulatory environment.
Forward-looking statements involve known and unknown risks, uncertainties and other factors, which may cause the actual results, financial condition, performance or achievements of the Company or industry results to differ materially from the results, financial condition, performance or achievements expressed or implied by such forward-looking statements, including future changes or developments in the Company’s business, its competitive environment and political, economic, legal and social conditions. Further, past performance is not necessarily indicative of future results. Given these risks, uncertainties and other factors, viewers of this presentation are cautioned not to place undue reliance on these forward-looking statements. The Company disclaims any obligation to update these forward-looking statements to reflect future events or developments.
This presentation is for general information purposes only, without regard to any specific objectives, financial situations or informational needs of any particular person. This presentation does not constitute an offer or invitation to purchase or subscribe for any securities in any jurisdiction, including the United States. No part of it should form the basis of or be relied upon in connection with any investment decision or any contract or commitment to purchase or subscribe for any securities. None of our securities may be offered or sold in the United States, without registration under the U.S. Securities Act of 1933, as amended, or pursuant to an exemption from registration there from.
This presentation is confidential and may not be copied or disseminated, in whole or in part, and in any manner.
Valorem Advisors Disclaimer:
Valorem Advisors is an Independent Investor Relations Management Service company. This Presentation has been prepared by Valorem Advisors based on information and data which the Company considers reliable, but Valorem Advisors and the Company makes no representation or warranty, express or implied, whatsoever, and no reliance shall be placed on, the truth, accuracy, completeness, fairness and reasonableness of the contents of this Presentation. This Presentation may not be all inclusive and may not contain all of the information that you may consider material. Any liability in respect of the contents of, or any omission from, this Presentation is expressly excluded. Valorem Advisors also hereby certifies that the directors or employees of Valorem Advisors do not own any stock in personal or company capacity of the Company under review.
34
Disclaimer