Embed Size (px)
Citation preview

Investor Presentation July - September 2015

Forward looking statements
This document may contain forward-looking statements that may or may not prove accurate. For example, statements regarding expected revenue growth and trading margins, market trends and our product pipeline are forward-looking statements. Phrases such as "aim", "plan", "intend", "anticipate", "well-placed", "believe", "estimate", "expect", "target", "consider" and similar expressions are generally intended to identify forward-looking statements. Forward-looking statements involve known and unknown risks, uncertainties and other important factors that could cause actual results to differ materially from what is expressed or implied by the statements. For Smith & Nephew, these factors include: economic and financial conditions in the markets we serve, especially those affecting health care providers, payers and customers; price levels for established and innovative medical devices; developments in medical technology; regulatory approvals, reimbursement decisions or other government actions; product defects or recalls; litigation relating to patent or other claims; legal compliance risks and related investigative, remedial or enforcement actions; strategic actions, including acquisitions and dispositions, our success in performing due diligence, valuing and integrating acquired businesses; disruption that may result from transactions or other changes we make in our business plans or organisation to adapt to market developments; and numerous other matters that affect us or our markets, including those of a political, economic, business, competitive or reputational nature. Please refer to the documents that Smith & Nephew has filed with the U.S. Securities and Exchange Commission under the U.S. Securities Exchange Act of 1934, as amended, including Smith & Nephew's most recent annual report on Form 20-F, for a discussion of certain of these factors.
Any forward-looking statement is based on information available to Smith & Nephew as of the date of the statement. All written or oral forward-looking statements attributable to Smith & Nephew are qualified by this caution. Smith & Nephew does not undertake any obligation to update or revise any forward-looking statement to reflect any change in circumstances or in Smith & Nephew's expectations.
2

About Smith & Nephew
• Global medical devices company
‐ Headquartered in UK, operates more than 100 countries
‐ Sales of over $4.6 billion in 2014
‐ Around 14,000 employees worldwide
‐ $9.6 billion market capitalisation (30 June 2015)
• History
‐ Founded in Hull, UK in 1856 by Thomas James Smith
‐ Pioneering healthcare company, supporting healthcare professionals for over 150 years
‐ FTSE 100 member, listed 1937
3

Our business
Advanced Wound Management
Knee Implants
Hip Implants
Trauma & Extremities Sports Medicine Joint Repair
Arthroscopic Enabling Technologies
Other Surgical Businesses
FAST FIX 360™ Meniscal Repair System
DYONICS™ PLATINUM Shaver Blades
SUTUREFIX Ultra Suture Anchor
PICO™ Negative Pressure Wound Therapy
ANTHOLOGY™ Primary Hip System
VERILAST™
30-year wear claim
VISIONAIRE™ Patient Matched Instrumentation
PERI-LOC™ Periarticular Locked Plating System
TRIGEN™ INTERTAN Intertrochanteric Antegrade Nail
4
$4.6bn revenues
(2014)
Collagenase SANTYL Ointment Enzymatic debrider
Q-FIX All-Suture Implants
ALLEVYN™ Life Wound Dressings

Emerging/International Markets (15%)
Established OUS (42%)
US (43%)
Established markets
Emerging and International markets
2014 Revenue
A global business
5
Source: 2014 Split of revenues, Smith & Nephew

Our position – leading share and a diversified business
Arthrex
29%
Zimmer
Biomet
4% DePuy
Mitek**
15% Linvatec
5%
24%
Stryker
11%
Others
12%
Segment Size: $14bn Growth: +3%
Hip & Knee Implants
Segment Size: $5bn Growth: +8%
Segment Size: $5bn Growth: +6%
Sports Medicine*
Trauma & Extremities
Advanced Wound
Management
Segment Size: $7bn Growth: +4%
Data: 2014 Estimates generated by Smith & Nephew based upon public sources and internal analysis *Representing access, resection and repair products. ** A division of Johnson & Johnson
6
Zimmer
Biomet
35%
DePuy
Synthes
21%
11%
Stryker
19%
Other,
15%
Zimmer
Biomet
12%
DePuy
Synthes
47% 10%
Stryker
23%
Other
9%
Convatec
8%
Acelity
20%
Molnlycke
13%
Coloplast
4% 19%
Other
36%
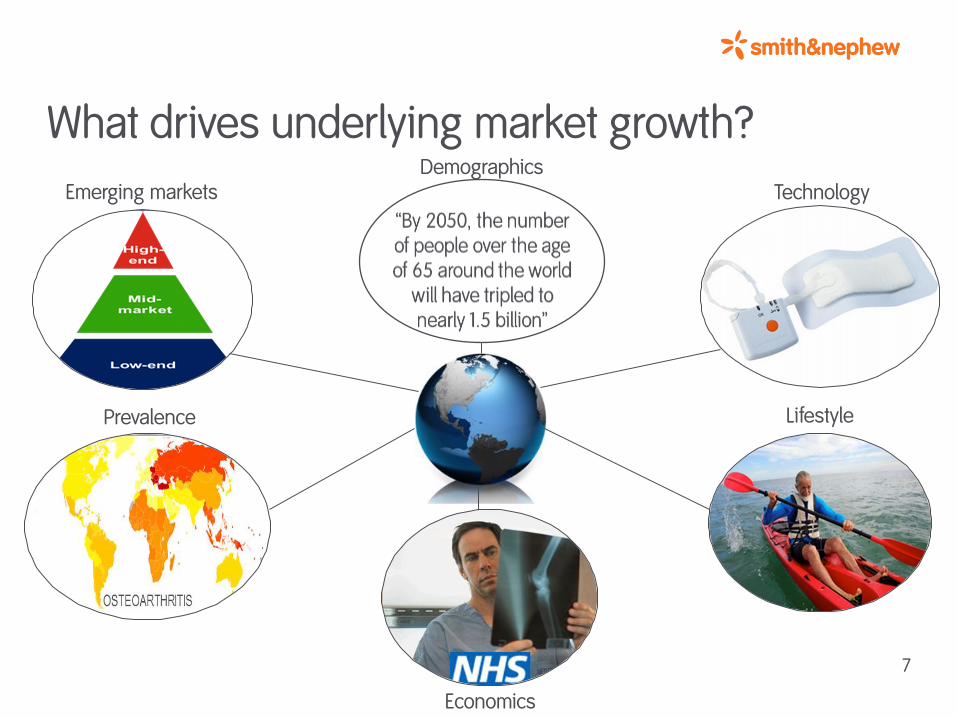
What drives underlying market growth?
Prevalence Lifestyle
Economics
Emerging markets Demographics
7
Technology

Market realities and opportunities
• Procedure demand continues to increase – demographic and disease led – fuelled by expanded access in emerging markets
• Still room for innovation – demonstrate clinical benefit or cost reduction
• Ability to pay continues to decrease in established markets – austerity, reduced prices – alternative, less costly solutions
• New business models slowly emerging, but fragmented – Syncera value solutions – pioneering model – mid-tier model to access emerging markets
• Environment Complexities
– regulatory, clinical data, manufacturing know-how, patents – customer relationships, distribution channels, capital 8
JOURNEY II ™ CR Knee System
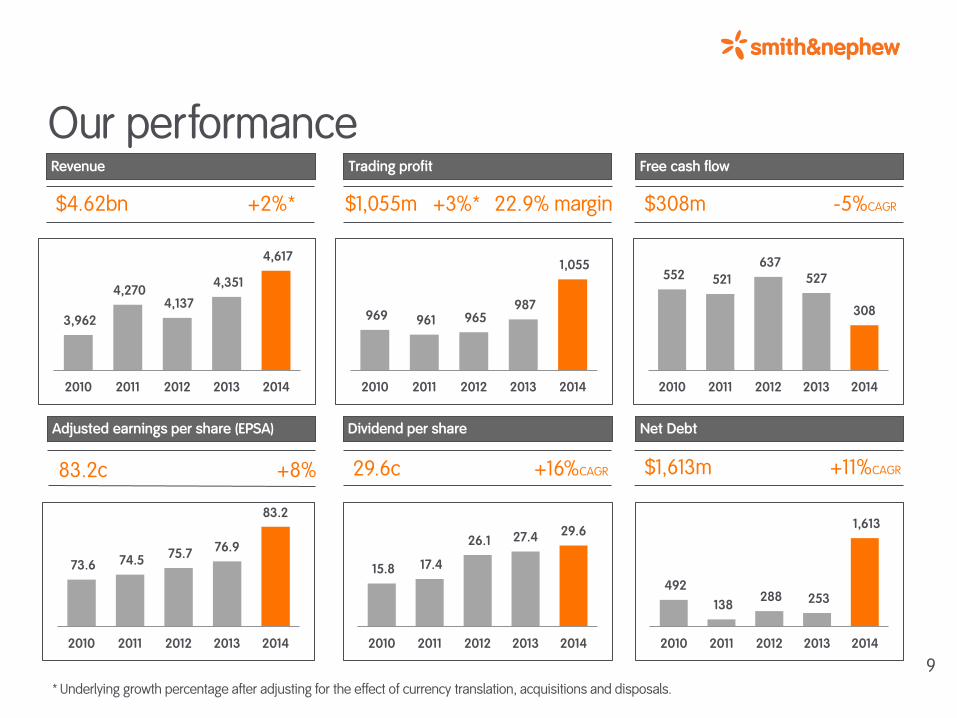
Our performance Trading profit Revenue
$4.62bn +2%* $1,055m +3%* 22.9% margin
Free cash flow
Net Debt
$1,613m +11%CAGR
Adjusted earnings per share (EPSA)
83.2c +8%
$308m -5%CAGR
* Underlying growth percentage after adjusting for the effect of currency translation, acquisitions and disposals.
Dividend per share
29.6c +16%CAGR
9
4,617
3,962
4,270 4,137
4,351
2010 2011 2012 2013 2014
1,055
969 961 965 987
2010 2011 2012 2013 2014
83.2
73.6 74.5 75.7
76.9
2010 2011 2012 2013 2014
29.6
15.8 17.4
26.1 27.4
2010 2011 2012 2013 2014
1,613
492
138 288 253
2010 2011 2012 2013 2014
308
552 521
637 527
2010 2011 2012 2013 2014
Adjusted earnings per share (EPSA) Dividend per share

Strategic Priorities
• Winning in Established Markets
• Accelerating development in Emerging Markets
• Innovating for value
• Simplifying and improving our operating model
• Supplement organic growth through acquisitions
10

Capital allocation framework
11
Reinvest for organic growth
Progressive dividend policy
Acquisitions in line with strategy
Return excess to shareholders
Maintain strong balance sheet to ensure solid investment grade credit
metrics
1 2 3 4
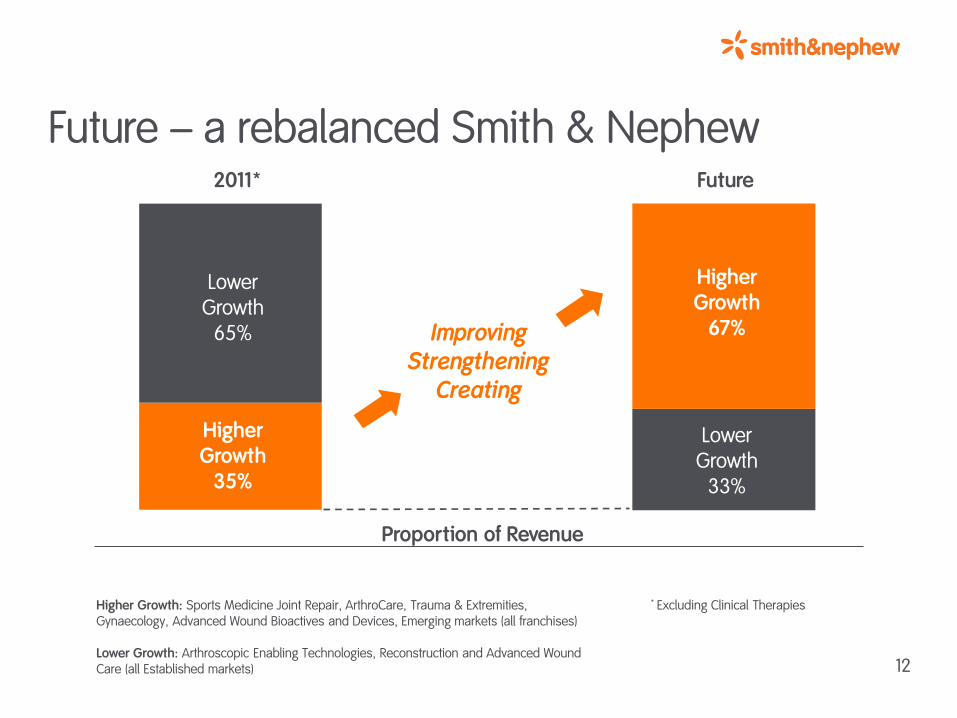
Future – a rebalanced Smith & Nephew
12
* Excluding Clinical Therapies
2011* Future
Lower Growth
65%
Higher Growth: Sports Medicine Joint Repair, ArthroCare, Trauma & Extremities, Gynaecology, Advanced Wound Bioactives and Devices, Emerging markets (all franchises) Lower Growth: Arthroscopic Enabling Technologies, Reconstruction and Advanced Wound Care (all Established markets)
Higher Growth
35%
Higher Growth
67%
Lower Growth
33%
Proportion of Revenue
Improving Strengthening
Creating

Simplify our management structure
Drive savings and capability investments Driving
Procurement Savings
Optimising Functions
Develop best in class global support functions
Simplifying Operating Model
• Increasing overall efficiency / agility
• Liberating resources to re-invest in critical areas to drive growth
Rationalise property portfolio Optimising Locations
13
Group optimisation plan – four levers

• Benefits
– generate annual savings of at least $120 million
– a four year plan, with half of benefits achieved by end of 2015
• Restructuring costs
– about $150 million costs over four years
– about 85% incurred by end of 2015
14
Group optimisation plan – financial implications

Q2 Revenue and H1 Results
15

H1 2015 highlights
Key Comments
• H1 revenues +4% underlying (+2% reported)
‐ Advanced Wound Care +11% ‐ strong Emerging Markets +18% ‐ Recon improvement led by Knees ‐ Sports Medicine Joint Repair +8%
• Technology and distribution acquisitions
• Trading profit margin 22.5%
• EPSA 39.1¢ (up 3%)
• Interim dividend 11.8¢ (2014 11.0¢)
First Half
2015 2014 Underlying
growth
$m $m %
Revenue 2,272 2,220 4
Trading profit 512 484 6
Trading Profit Margin 22.5% 21.8%
EPSA 39.1¢ 38.1¢
16

EPSA growth at CER
Trading margin improvement
Established Markets
Revenue growth
17
Emerging Markets
Innovation
Simplification
Acquisitions
Optimising Cash
Delivering returns through capital
allocation
Our guidance
Higher underlying growth than 2014
Improving operational efficiency
Year-on-year improvement in margin

Emerging
Est OUS
US
AWD
AWB
AWC
Hips
Knees
Arthroscopic Enabling Tech
Sports Medicine Joint Repair
Trauma & Extremities
Other Surgical
11%
6%
12%
1%
7%
7%
2%
1%
7%
-10% 0% 10%
Q2 revenue growth of 5% underlying
18
Geographical growth Product franchise growth Revenue split
Underlying change (%) Underlying change (%)
3%
4%
0% 5% 10% 15%
Note: ‘Est OUS’ is Australia, Canada, Europe, Japan and New Zealand, ‘Other Surgical’ includes Gynaecology and ENT.
-9% 14%

19
Strategic Updates: Recon, Syncera and Emerging Markets

Reconstruction – focused on areas of growth
• Pioneering products – VERILAST◊ is a unique bearing surface – JOURNEY◊ II is designed to provide higher levels of
patient satisfaction
• Differentiated marketing – speaking to surgeons and their patients – US marketing campaigns with measurable returns
• Widening access – strong Established Market business supporting
Emerging Markets
• Disruptive model – Syncera
JOURNEY◊ II
Active Knee Solutions
Growing above the market in the US last 12 months 20

Implant systems OR and inventory efficiency
REDAPT™ hip revision
Innovative product development
21
Bearing surfaces Augmented instrumentation
VERASENSETM Sensor Technology OXINIUM™-on-OXINIUM
VISIONAIRE™ Disposable Instruments JOURNEY™ II Knee REDAPT™ hip revision
NavioTM Surgical System

The Syncera solution
22
Hip/Knee implant solutions for progressive customers
Products from Smith & Nephew addressing the vast majority of primary joint procedures
Customer interfaces using innovative technology to reduce cost while improving efficiency
High levels of service and support
Transparent prices driving substantial benefit for providers Attractive economics
Value
Clinically proven
Automation
Full support
1
2
3
4
5

Milestones reached
• Moved from pilot to full launch
• Reference sites trained and fully operational with Syncera
• Customer accounts doing > 3,000 annualised procedures
• Material US pipeline and OUS plans ongoing
• Technology platform: S2 software acquired, reviewing additions
Early experiences
• Targeting of accounts
• Collaboration
• Opportunities for cross-selling
• Bundled payments
23
Successful first 12 months for Syncera
We have the right innovation at the right time

0%
5%
10%
15%
20%
25%
30%
Accelerating development in Emerging Markets
Quarterly revenue development
SUPPORTIVE MARKET CONTEXT: • economic growth • higher healthcare spending OUR ACTIONS: • expansion of premium product
range • mid-tier strategy • medical education • further acquisitions
8%
16%
24
Rev
en
ue
as
pro
po
rtio
n o
f g
rou
p (
%)
2010 2011 2012 2013 2014 2015
Today
Q1 2010

Leading in the Emerging Markets
25 25
Direct Presence
Mid-tier presence
Strategic milestones
2011 Today 2011 Today
✓ ✓ ✓ ✓ Leading position, continued strong growth
✓ ✓ X ✓ Acquisition of Sushrut-Adler, new factory in 2016
X ✓ X X Acquisition of Politec Saude (AWM) and PCE (ASD), improved revenue growth
X ✓ X ✓ Acquisition of DeOst and DC (distribution and manufacturing)
✓ ✓ X ✓ Well established with strong market position
X ✓ X X Acquisition of Plato, accelerated market share gains
✓ ✓ X X Government partnership to improve wound treatment
✓ ✓ X X Expanded share in regional tenders
China
India
Brazil
Russia
South Africa
Mexico
Turkey
Saudi Arabia

Mid-tier – new emerging markets business model…
26
Independent Mid-tier sales organisation
Dedicated leadership
Different business model
Separate sales channels
Collaboration with premium-tier organisation
Different brand
Common shared
services
Mid-tier commercial model
Good quality products at lower prices
Manufacturing & design efficiency
Streamlined sales & marketing
Different service model

Appendices
27

Sports Medicine, Trauma & OSB
• Q2 Revenue performance
‐ Sports Medicine Joint Repair +7% ($150m)
‐ Arthroscopic Enabling Technologies (AET) +1% ($142m)
‐ Trauma & Extremities +2% ($125m)
‐ Other Surgical Businesses* +7% ($52m)
• Commentary
‐ one year since the ArthroCare acquisition
‐ Sports Medicine Joint Repair and AET benefitting from ArthroCare integration
‐ ENT business generating good growth and improving outlook
28
EVAC◊ 70 XTRA Adenotonsillectomy Wand
* ‘Other Surgical Businesses’ includes Gynaecology and ENT

• Q2 Revenue performance
‐ Knees: global +7%, US +7%, OUS +7% ($221m)
‐ Hips: global +1%, US +3%, OUS -1% ($153m)
• Commentary
‐ global Reconstruction sequentially improved to +4%
‐ US VERILAST◊ Technology for Hips and Knees campaign starting to benefit sales
‐ ZUK acquisition for US market
‐ first patients implanted with new ANTHEM◊ Knee System
Reconstruction
29
ANTHEM◊ Knee System

Advanced Wound Management
• Q2 Revenue performance
‐ Advanced Wound Care +12% ($193m)
‐ Advanced Wound Bioactives +6% ($89m)
‐ Advanced Wound Devices -9% ($43m)
• Commentary
‐ AWM at +7% returned to above market growth
‐ improving AWC trend sustained
‐ AWB: SANTYL◊ growth partially off-set by OASIS◊
‐ AWD dynamic unchanged: expect to re-enter US traditional market during 2016 with next generation products
30
PICO◊ Single Use Negative Pressure Wound
Therapy

Franchise revenue analysis
31 All revenue growth rates are on an underlying basis * ‘Other Surgical Businesses’ includes Gynaecology and ENT
2014 2015
Q1 Q2 Q3 Q4 Full Year
Q1 Q2
Growth Growth Growth Growth Growth Growth Revenue Growth
% % % % % % $m %
Sports Medicine, Trauma & OSB 2 6 7 5 5 5 469 4
Sports Medicine Joint Repair 5 9 11 8 8 9 150 7
Arthroscopic Enabling Technologies (2) (1) 3 2 1 (2) 142 1
Trauma & Extremities (1) 7 8 3 4 5 125 2
Other Surgical Businesses* 23 18 6 6 10 11 52 7
Reconstruction - 3 1 2 2 1 374 4
Knee Implants - 2 1 3 2 2 221 7
Hip Implants - 3 1 2 1 (1) 153 1
Advanced Wound Management - - (1) (2) (1) 1 325 7
Advanced Wound Care (6) (8) (3) (1) (4) 9 193 12
Advanced Wound Bioactives 8 21 14 16 15 5 89 6
Advanced Wound Devices 13 1 (17) (27) (9) (27) 43 (9)
Group 1 3 3 2 2 3 1,168 5

Regional revenue analysis
32
‘Other Established Markets’ is Australia, Canada, Europe, Japan and New Zealand. All revenue growth rates are on an underlying basis
2014 2015
Q1 Q2 Q3 Q4 Full Year
Q1 Q2
Growth Growth Growth Growth Growth Growth Revenue Growth
% % % % % % $m %
Geographic regions
US (2) 4 2 - 1 1 549 4
Other Established Markets 1 (3) (2) (1) (1) (2) 426 3
Established Markets (1) 1 - - - - 975 3
Emerging Markets 9 17 20 18 17 22 193 14
Group 1 3 3 2 2 3 1,168 5

H1 income statement
33
H1
2015 2014
$m $m
Revenue 2,272 2,220
Trading profit 512 484
Restructuring and rationalisation costs (19) (19)
Acquisition and integration costs (13) (58)
Amortisation of acquisition intangibles (78) (54)
Legal and other 37 10
Operating profit 439 363
Net interest (costs)/income (18) (7)
Other finance costs (7) (5)
Profit before taxation and associates 414 351
Ad
just
ing
ite
ms

H1 income statement (continued)
34
H1
2015 2014
$m $m
Profit before taxation and associates 414 351
Associate (3) (2)
Profit before taxation 411 349
Taxation (116) (110) Tax rate* 27.2%
Attributable profit 295 239
Add back:
Adjusting items from earlier slide 73 121
Adjusting items reported in interest (3) 3
Taxation on excluded items (15) (23)
Adjusted attributable profit 350 340
Adjusted earnings per share ("EPSA") 39.1¢ 38.1¢
Earnings per share ("EPS") 33.0¢ 26.8¢
* Forecast full year rate on Trading results

2015 Technical guidance
35
Guidance Full year
Restructuring costs1 c. $80m
Acquisition and integration costs1 $13m+
Non-recurring charges (RENASYS and HP802) 1 $15m
Amortisation of acquisition intangibles ~ $150m
Interest payable 1,2 $45m - $50m
Other finance costs1 < $15m
Bioventus loan note interest receivable None
Associate: Bioventus contribution1 Slightly negative
Tax rate on Trading result Slightly above 27% (27.2%)
1 updated since 2015 guidance given at Q4 2014 Results 2 assuming no future acquisitions

H1 Free cash flow
36
H1
2015 2014
$m $m
Trading profit 512 484
Share based payment 13 16
Depreciation and amortisation 148 140
Capital expenditure (161) (161)
Movements in working capital and provisions (130) (222)
Trading cash flow 382 257
Trading cash conversion 75% 53%
Restructuring, rationalisation, acquisition & other 36 (37)
Operating cash flow 418 220
Net interest paid (17) (12)
Taxation paid (72) (136)
Free cash flow 329 72

Management
37
Olivier Bohuon Chief Executive Officer Olivier joined the Board and was appointed Chief Executive Officer in April 2011. Olivier has had extensive international experience within a number of pharmaceutical and healthcare companies. Prior to joining Smith & Nephew, he was President of Abbott Pharmaceuticals, a division of Abbott Laboratories based in the US, where he was responsible for the entire business, including R&D, Global Manufacturing and global support functions. He is Non-Executive Director of Virbac Group.
Julie Brown Chief Financial Officer Julie joined the Board as Chief Financial Officer in February 2013. Julie is a Chartered Accountant and Fellow of the Institute of Taxation with international experience and a deep understanding of the healthcare sector. She trained with KPMG and then worked for AstraZeneca plc, where she served as Vice President Group Finance and more recently, as Interim Chief Financial Officer. She has previously held positions of Regional Vice President Latin America, Marketing Company President AstraZeneca Portugal and Vice President Corporate Strategy and Research and Development Chief Financial Officer.

Investor Relations Contacts
38
Phil Cowdy
SVP, Corporate Affairs and Strategic Planning
T: +44 (0) 207 960 2296
Ingeborg Øie
VP, Investor Relations
T: +44 (0) 207 960 2285
Kate Gibbon
Investor Relations Manager
T: +44 (0) 207 960 2339
Charles Reynolds
Director of Corporate Communications
T: +44 (0) 207 960 2212
Smith & Nephew plc
15 Adam Street
London
WC2N 6LA
T: +44 (0) 207 401 7646