Embed Size (px)
Citation preview

Investor Presentation January 2016
Table of Contents
Executive Summary
Company Overview
Business Overview
Industry Overview
Financial Overview

3
Executive Summary

Executive Summary
4
• Mangalam Drugs & Organics Ltd. (Mangalam) was incorporated in 1972 and is one of the largest suppliers and manufacturers of Anti-Malarial Active Pharmaceuticals Ingredients (API) in the world.
• The company’s headquarter is in Mumbai, with two manufacturing facilites at Vapi, Gujarat.
• Mangalam was incorporated by Mr. G. M. Dhoot, who has been the visionary behind the success and diversification of the company from a chemical company to become a global API supplier.
Overview
• Anti Malarial API’s like Arthemether, Lumefrantine, Artesunate , Amodiaquine Hydrochloride, Dihydroartemisinin, Piperaquine phosphate, Chloroquine Phosphate, Hydroxychloroquine Sulphate, Pyronaridine tetraphosphate
• Anti Retroviral API’s – The company has recently forayed into Anti Retroviral API’s and has received approval and is manufacturing Tenofovir Disoproxyl Fumarate, 2 other products are at validation stage and 5 more in R&D phase.
• Others - Uricosuric Agent : Allopurinol, Analgesic: Nimesulide and Anti Hypertensive: Bisoprolol Fumerate
Business Mix
• Domestic Clients: Ajanta Pharma, CIPLA, IPCA, Sun Pharma, Dr. Reddy’s.
• International Clients: Sanofi, Guilin, Mylan, MERCK
Clients
• Revenue at INR 2,207mn; 3 year CAGR of 12.8%
• EBITDA at INR 204 mn; 3 year CAGR of 11.6%
• Net Profit at 61mn; 3 year CAGR of 113.2%
FY2015 Financials

5
Company Overview

Company Overview
6
1,541 1,288 1,228
2,207
FY12 FY13 FY14 FY15
Revenue Growth (INR Mn)
Mangalam Drugs & Organics LTD. was incorporated in 1972, commenced operations in 1977, and was listed on BSE and NSE in 2005-06. The Company has a market capitalization of around Rs. 2,570 Mn (as of 31st December 2015)
Well established player in an Industry with strong entry barriers .
The company is one of the largest and most preferred API supplier for Anti-Malaria drug manufacturing companies in the regulatory market across the world.
The company’s APIs have received certifications from World Health Organization(WHO), European Directorate for Quality of Medicines (EDQM) and European Medicines Agency(EMA).
Mangalam is one of the 5 companies globally to qualify under the Bill Clinton Foundation for supply of Anti-Malarial drugs worldwide.
The company has diversified its product range over the last few years from Intermediates and Specialty Chemicals to API’s like Anti Malarial, Anti Retroviral, Uricosuric Agent, Analgesic and Anti Hypertensive.
26.23%
73.77%
FY15 Segmental Revenue Break-up
Exports Domestic
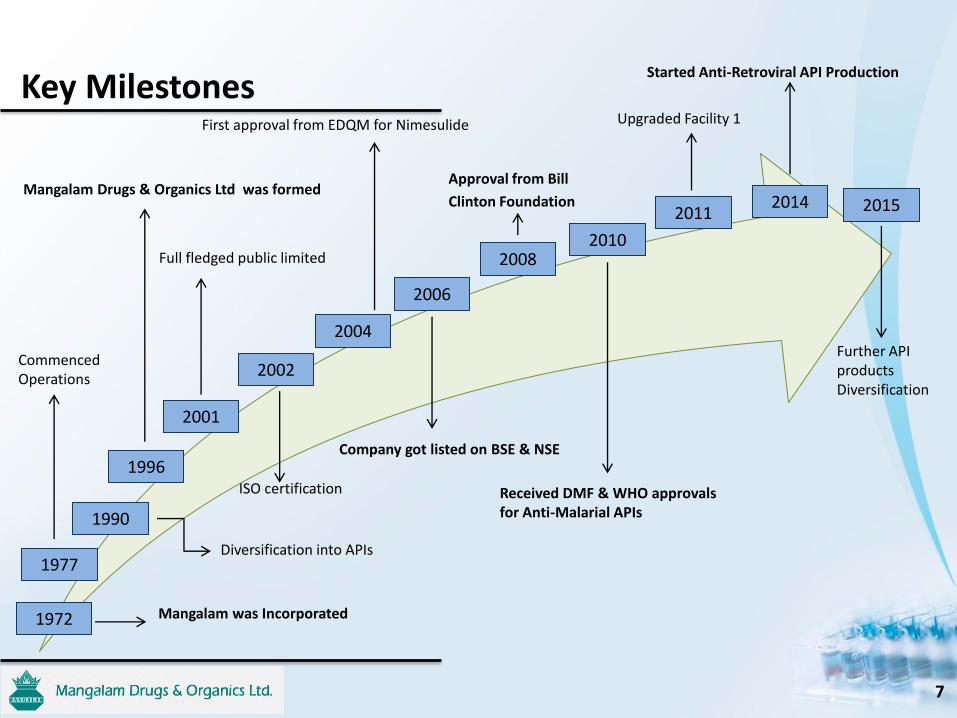
Key Milestones
7
Full fledged public limited
Approval from Bill
Clinton Foundation
1977
1990
1996
2001
2002
2004
2008
2006
1972 Mangalam was Incorporated
Commenced Operations
Diversification into APIs
Mangalam Drugs & Organics Ltd was formed
ISO certification
First approval from EDQM for Nimesulide
Company got listed on BSE & NSE
2014 2011
2010
Received DMF & WHO approvals for Anti-Malarial APIs
Upgraded Facility 1
Started Anti-Retroviral API Production
2015
Further API products Diversification

Key Strengths
8
Entry Barrier
2-3 years on an average for a new entrant to start manufacturing API
High quality standard for approvals
Well established large players in the market
Competitive Position
Largest manufacturer of Anti-malarial APIs in the world
One of the lowest cost producer
Top revenue products are best selling combination for Anti-Malaria formulations
Presence in Regulatory Market
India’s major Anti-malarial API manufacturer to have premier certifications
Products under regulated market command premium pricing
Standalone Supplier for Anti-Malarial APIs in the regulatory market
Focus on R&D & Diversification
10% of the total work force are involved in R&D
Strong focus on R&D
Diversifying from Generic API to Anti-malarial API’s & Anti Retroviral API’s
Premier Certifications
WHO approvals for 7 Anti-malarial APIs.
EDQM approval for 2 APIs
Clinton foundation approval to supply Anti-malarial APIs worldwide
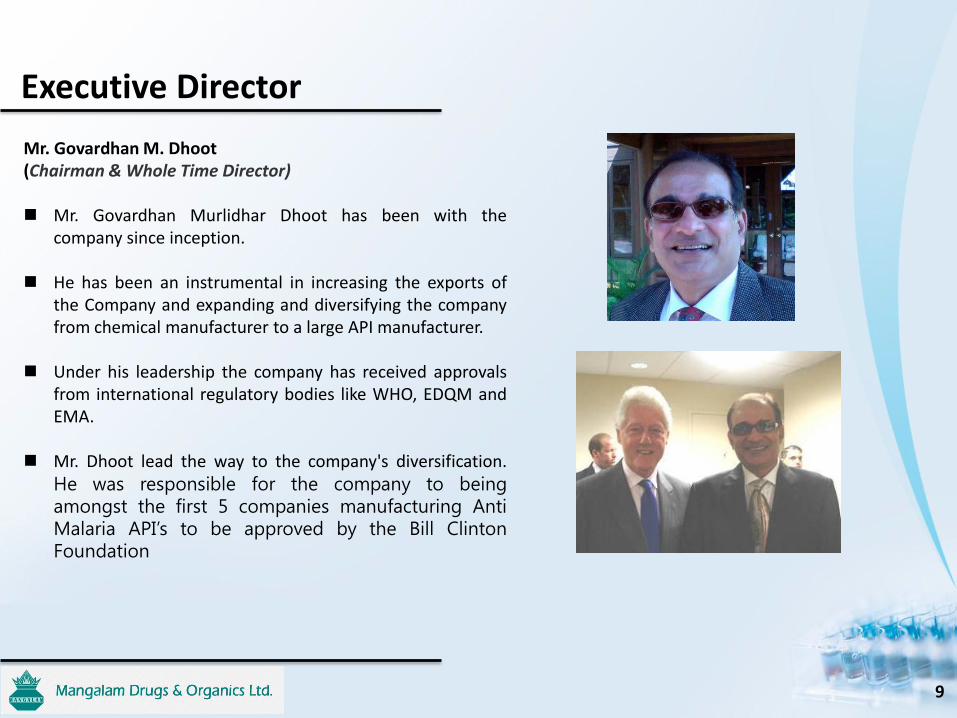
Executive Director
9
Mr. Govardhan M. Dhoot (Chairman & Whole Time Director)
Mr. Govardhan Murlidhar Dhoot has been with the
company since inception. He has been an instrumental in increasing the exports of
the Company and expanding and diversifying the company from chemical manufacturer to a large API manufacturer.
Under his leadership the company has received approvals
from international regulatory bodies like WHO, EDQM and EMA.
Mr. Dhoot lead the way to the company's diversification.
He was responsible for the company to being amongst the first 5 companies manufacturing Anti Malaria API’s to be approved by the Bill Clinton Foundation

Manufacturing Facilities at Vapi, Gujarat
10
Total Production area: 3272 Sq. m 2 API manufacturing and 1 solvent
recovery block APIs Manufacturing Capacity: 720 TPA
Facility 1 (WHO approved)
Total Production area: 3059 Sq. m Total 1 API manufacturing, 1
intermediate manufacturing, 1 pilot plant & 1 recovery blocks
Manufacturing capacity: APIs 360 TPA Intermediates : 1,000 TPA
Facility 2
Unit 1 Vapi, Gujarat Lab, Unit 2 Vapi, Gujarat

Research & Development
11
The company has a strong focus on R&D on new products and therapeutic segments.
There is a highly qualified team of 20+ research scientists
World class laboratory with state of the art technology.
Non-infringing process > Patentable process
The laboratory has been approved by the Department of Scientific and Industrial Research, Government of India
R&D team currently focused on developing and approval qualification process of Anti-Retroviral APIs
− 1 successfully launched API - Tenofovir Disoproxyl Fumarate
− 2 APIs under validation phase
− 5 under development
Business Overview

Malaria: Global Phenomenon
13
♦ Elevated occurrence of chloroquine- or multi-resistant malaria
♦ Occurrence of chloroquine-resistant malaria ♦ No Plasmodium falciparum or chloroquine-resistance ♦ No malaria
In 2014, 97 countries and territories had on-going malaria transmission
− Malaria is presently endemic in a broad band around the equator, in areas of the Americas, many parts of Asia, and much of Africa
An estimated 3.3 billion people are at risk of malaria, of whom 1.2 billion are at high risk
− In 2013, 90% of the world’s malaria deaths occurred in Africa
The two most common strains of malaria are P. falciparum (Pf) and P. Vivax (Pv)
Plasmodium falciparum (Pf) is the worst strain of malaria − PF causes the most acute and severe form of malaria;
most of the cases registered under WHO are PF malarial cases .
Plasmodium Vivax (Pv) is a protozoal parasite and a human pathogen. P.v malaria is the most frequent and widely distributed cause of recurring malaria. It is less virulent than P.Falciparum malaria.
The Anti-Malarial market is been growing from 219Mn treatments in 2010 to 367Mn. treatments in 2014
Malaria Prevalence
Source: WHO

Addressing Malaria With Multiple Products
14
33%
43%
24%
LUMEFANTRINE ARTEMETHER Other
There are no permanent preventions or vaccines against malaria as of today.
Following Anti-Malarial APIs are produced by the company: − Arthemether − Lumefantine − Artesunate − Amodiaquine Hydrochloride − Dihydroartemisinin − Piperaquine phosphate − Chloroquine Phosphate − Hydroxychloroquine Sulphate − Pyronaridine tetraphosphate
Arthemether and Lumefantrine (A&L) is a WHO approved best combination to cure Plasmodium falciparum (Pf) Malaria.
Arthemether (A) is an Anti-Malarial for the treatment of multiple drug resistant strains of Pf malaria.
Lumefantrine (L) is an Anti-Malarial drug. It can only be used in combination with arthemether, it is also known as co-Arthemether.
AL combination is the preferred combination to cure PF malaria., with a global market share of 74% vs. other combinations.
ACT Share of Global Market (2014)
AL 74.1%
AS-AQ 24.2%
DHA-PPQ 1.2%
AS-PY 0%
Revenue Split (%) of Mangalam for FY14-15
Global Anti-Malarial API Mix
Source: (PDF Artemether Market)

Going beyond Malaria: Anti-Retroviral
15
Current production of ARV drugs meets only 50% of total demand
Strong focus on increasing available of medication to infected population
R&D team working on ARV APIs since 3years; 1 API under production
2 product in validation stage and 5 under R&D
Approval in place from the Clinton foundation and WHO for production of ARV drugs
Targeting only the regulatory market
Life time long treatment
Higher demand, volume and funding for ARV drugs higher
Experienced and efficient R&D team.
Cost advantage over competitors
API Name Status
Tenofovir Disoproxyl Commercialized
Emtricitabine Under process validation on pilot
scale
Efavirenz Under process validation on pilot
scale
Lamevudine Under development in R&D
Tenofovir Alafenamide Fu
marate
Under development in R&D
Atazanavire Sulphate Under development in R&D
Nevirapine Under development in R&D
Sobusofovir Under development in R&D
ARV APIs
Anti-retroviral: Tenofovir Disoproxyl Tenofovir disoperoxil belongs to a class of
antiretroviral drugs known as nucleotide analogue reverse transcriptase inhinitiors.
It blocks reverse transcriptase, a crucial viral enzyme in HIV-1 and hepatitis B virus infections.
Tenofovir disoperoxil is on the WHO list of drugs recommended for HIV_1 treatment.
Strong Market Requirement
Strong Skill sets and established facilities
ARV Market

Other Products
16
Used in treatment of gout or kidney stone
Reduces the production of uric acid in the body, primary cause for gout or kidney stones
WHO essential medicines for basic health system
Used in medication for ischemic reperfusion injury, poor kidney function and protozoal infections
Used in treatment of acute pain, the symptomatic treatment of osteoarthritis
Available in a variety of forms: tablets, powder for dissolution in water, gel etc.
It is marketed by the name Nise Gel by Dr. Reddy’s in India
Used in Treatment for Cardiovascular Diseases.
Mainly for High Blood Pressure, reduced blood flow to the heart congestive heart failure.
WHO essential medicines for basic health system
Mylan manufactures formulations of Bisoprolol Fumerate
Uricosuric Agent :Allopurinol
Analgesic: Nimesulide
Anti Hypertensive: Bisoprolol Fumerate

Global Customer Base
17
DOMESTIC:
INTERNATIONAL:

18
Industry Overview
Overview: Indian Pharma Market
19
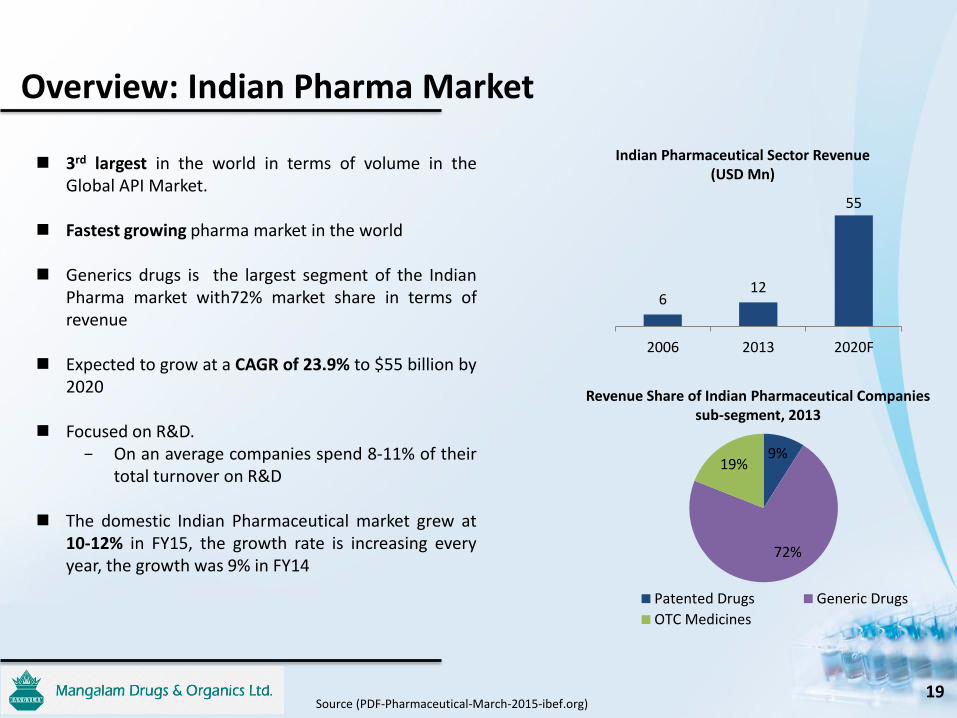
3rd largest in the world in terms of volume in the Global API Market.
Fastest growing pharma market in the world Generics drugs is the largest segment of the Indian
Pharma market with72% market share in terms of revenue
Expected to grow at a CAGR of 23.9% to $55 billion by
2020 Focused on R&D.
− On an average companies spend 8-11% of their total turnover on R&D
The domestic Indian Pharmaceutical market grew at
10-12% in FY15, the growth rate is increasing every year, the growth was 9% in FY14
9%
72%
19%
Patented Drugs Generic Drugs
OTC Medicines
6 12
55
2006 2013 2020F
Indian Pharmaceutical Sector Revenue (USD Mn)
Revenue Share of Indian Pharmaceutical Companies sub-segment, 2013
Source (PDF-Pharmaceutical-March-2015-ibef.org)

Key Growth Drivers: Indian Pharma Market
20
Cost efficiency: The Indian Pharma cost is almost 60% less compared to USA
and half of the cost in Europe Economic Growth: Drug affordability, penetration in healthcare sector and
Chemists penetration in the rural areas of the country are the major reasons for the economic growth of the sector.
Government: The government aims at making the Indian pharma market
a world leader by 2020. The government has reduced the time required for
approvals for new facilites to attract more investments. The government also allows 100% FDI inflows under
automatic route Diversified Portfolio: The Indian Pharma industry contributes to 10% of the global
volume of pharmaceuticals. The sector manufactures over 500 different APIs. Over
60,000 generic brands are present in the Indian pharma market.
49% of the Indian pharma master filling are registered in the USA.
Growth Drivers
Cost efficiency
Policies
Diversified Portfolio
Economic
100 85
40
USA Europe India
Relative Cost of Production with USA cost as base as on March 2014
Source( PDF-Pharmaceutical-March-2015-ibef.org)

Overview: Indian API Market
21
Expected to be the 3rd largest API merchant market by the end of 2016 with a market share of 7.2% in the world.
The Indian API industry has the second most largest number of
Abbreviated New Drug Applications (ANDAs) API Industry of India is a world leader in Drug Master files(DMFs)
application with the USA API manufacturers in India are trying to strengthen their marketing
in regulated markets by different means viz., by focusing on the improvement of production yields; especially of critical products, through process modification, by increasing the productivity of high volume products through capacity re-balancing, by increasing sales in international market
China and India are driving the market growth through their cost
advantages and have emerged as manufacturing hubs for the APIs With government support, improving IP systems and manufacturing
standards in India, the generic as well as innovator APIs market in India is expected to grow steadily in the coming years.
27.7%
18.2%
7.2%
46.9%
China USA India others
Market Share of API: 2016 (E)
Source: Pharmabiz.com &(PDF-Pharmaceutical-March-2015-ibef.org)

22
Financial Overview

Profit and Loss Statement
23
Income Statement (INR Mn) FY12 FY13 FY14 FY15 9M-FY16
Total Income 1,538 1,253 1,227 2,207 2,245
Expenses 1,391 1,297 1,129 2,003 2,012
EBITDA 147 (44) 98 204 233
EBITDA Margin 9.6% (3.5%) 8.0% 9.2% 10.4%
Depreciation 37 39 40 42 33
Finance Cost 102 100 97 103 65
Other Income 3 16 1 1 7
PBT 11 (168) (39) 60 142
Tax 5 (50) (9) -1 38
PAT 6 (118) (30) 61 105
PAT% 0.4% (9.4%) (2.5%) 2.8% 4.7%
EPS 0.48 (8.95) (2.31) 4.66 6.63

Balance Sheet
24
Equity and Liabilities (INR Mn.) FY13 FY14 FY15 H1-FY16
Shareholders Fund
Share Capital 132 132 132 132
Reserves and Surplus 131 100 162 227 Money Received - - - 155
Net worth 263 232 294 514
Non Current Liabilities
Long Term borrowings 439 402 394 236
Deferred tax liabilities 15 6 17 34
Total non current liabilities 454 408 411 270
Current Liabilities
Short Term Borrowings 287 314 318 346
Trades payables 107 209 548 337
Other Current Liabilities 37 92 128 113
Total current liabilities 431 615 994 796
Grand Total 1,148 1,255 1,699 1,580
Assets (INR Mn.) FY13 FY14 FY15 H1-FY16
Fixed assets
Total Fixed Assets 551 534 530 525
Non Current Assets
Long Term Loan & Advances 22 6 9 10
Current Assets
Inventories 311 365 573 645
Investments 2 2 2 2
Trades Receivables 239 297 443 236
Short term Loan & Advances 22 50 135 156
Cash and Cash Equivalents 1 1 7 6
Total current Assets 575 715 1,160 1,045
Grand Total 1,148 1,255 1,699 1,580

Financial Charts: A Turnaround Story
25
1,541 1,268 1,228
2,207
FY12 FY13 FY14 FY15
Total Revenue
Total Revenue
1.4
2.8 3.1
2.4
FY12 FY13 FY14 FY15
Net D/E (x)
Net D/E (x)
116 127
139
78
FY12 FY13 FY14 FY15
Working Capital Days
Working Capital Days
9.6%
-3.5%
8.0% 9.2%
-6.0%
-4.0%
-2.0%
0.0%
2.0%
4.0%
6.0%
8.0%
10.0%
12.0%
-100
-50
-
50
100
150
200
250
FY12 FY13 FY14 FY15
EBITDA & EBITDA Margin %
EBITDA EBITDA margin (%)
6
-118
-30
61
0.41%
-9.42%
-2.48%
2.78%
-12.00%
-10.00%
-8.00%
-6.00%
-4.00%
-2.00%
0.00%
2.00%
4.00%
-140
-120
-100
-80
-60
-40
-20
0
20
40
60
80
FY12 FY13 FY14 FY15
PAT & PAT Margins %
PAT PAT margin (%)
1.7%
-44.9%
-13.1%
20.9%
11.6%
-8.4%
6.1%
16.2%
FY12 FY13 FY14 FY15
Effeciency Ratios
RoE (%) RoCE (%)

Capital Market
26
Price Data (As of 31st December 2015) INR
Face Value 10
Market Price 195
52 Week H/L 441.5/17.4
Market Cap (INR Mn) 2,570
Equity Shares Outstanding (Mn) 14.38
1 Year Avg. Trading Volume ('000) 139
Shareholding Structure (as on 31st Jan 2015)
-500%
0%
500%
1000%
1500%
2000%
2500%
Manglam
Sensex
Promoters
, 45.80%
Public,
54.20%
Disclaimer
27
Mangalam Drugs and Organics Ltd No representation or warranty, express or implied, is made as to, and no reliance should be placed on, the fairness, accuracy, completeness or correctness of the information or opinions contained in this presentation. Such information and opinions are in all events not current after the date of this presentation. Certain statements made in this presentation may not be based on historical information or facts and may be "forward looking statements" based on the currently held beliefs and assumptions of the management of Mangalam Drugs & Organics Limited (“Company” or “Mangalam” ), which are expressed in good faith and in their opinion reasonable, including those relating to the Company’s general business plans and strategy, its future financial condition and growth prospects and future developments in its industry and its competitive and regulatory environment. Forward-looking statements involve known and unknown risks, uncertainties and other factors, which may cause the actual results, financial condition, performance or achievements of the Company or industry results to differ materially from the results, financial condition, performance or achievements expressed or implied by such forward-looking statements, including future changes or developments in the Company’s business, its competitive environment and political, economic, legal and social conditions. Further, past performance is not necessarily indicative of future results. Given these risks, uncertainties and other factors, viewers of this presentation are cautioned not to place undue reliance on these forward-looking statements. The Company disclaims any obligation to update these forward-looking statements to reflect future events or developments. This presentation is for general information purposes only, without regard to any specific objectives, financial situations or informational needs of any particular person. This presentation does not constitute an offer or invitation to purchase or subscribe for any securities in any jurisdiction, including the United States. No part of it should form the basis of or be relied upon in connection with any investment decision or any contract or commitment to purchase or subscribe for any securities. None of our securities may be offered or sold in the United States, without registration under the U.S. Securities Act of 1933, as amended, or pursuant to an exemption from registration there from. This presentation is confidential and may not be copied or disseminated, in whole or in part, and in any manner. Valorem Advisors Disclaimer:
Valorem Advisors is an Independent Investor Relations Management Service company. This Presentation has been prepared by Valorem Advisors based on information and data which the Company considers reliable, but Valorem Advisors and the Company makes no representation or warranty, express or implied, whatsoever, and no reliance shall be placed on, the truth, accuracy, completeness, fairness and reasonableness of the contents of this Presentation. This Presentation may not be all inclusive and may not contain all of the information that you may consider material. Any liability in respect of the contents of, or any omission from, this Presentation is expressly excluded. Valorem Advisors also hereby certifies that the directors or employees of Valorem Advisors do not own any stock in personal or company capacity of the Company under review
For further information please contact our Investor Relations Representative:
Mr. Anuj Sonpal Valorem Advisors Tel: +91-22-3006-7521/22/23/24 Email: [email protected]