Embed Size (px)
Citation preview
www.ipgphotonics.com
Investor Presentation March 2017
Tim Mammen
Chief Financial Officer
The statements in this presentation that relate to future plans, market forecasts, events or performance are
forward-looking statements. These statements involve risks and uncertainties, including, risks associated with
the strength or weakness of the business conditions in industries and geographic markets that IPG serves,
particularly the effect of downturns in the markets IPG serves; uncertainties and adverse changes in the
general economic conditions of markets; IPG's ability to penetrate new applications for fiber lasers and
increase market share; the rate of acceptance and penetration of IPG's products; inability to manage risks
associated with international customers and operations; foreign currency fluctuations; high levels of fixed
costs from IPG's vertical integration; the appropriateness of IPG's manufacturing capacity for the level of
demand; competitive factors, including declining average selling prices; the effect of acquisitions and
investments; inventory write-downs; intellectual property infringement claims and litigation; interruption in
supply of key components; manufacturing risks; government regulations and trade sanctions; and other risks
identified in the Company's SEC filings. Readers are encouraged to refer to the risk factors described in the
Company's Annual Report on Form 10-K and its periodic reports filed with the SEC, as applicable. Actual
results, events and performance may differ materially. Readers are cautioned not to rely on the forward-
looking statements, which speak only as of the date hereof. The Company undertakes no obligation to
release publicly the result of any revisions to these forward-looking statements that may be made to reflect
events or circumstances after the date hereof or to reflect the occurrence of unanticipated events.
Safe Harbor Statement
2
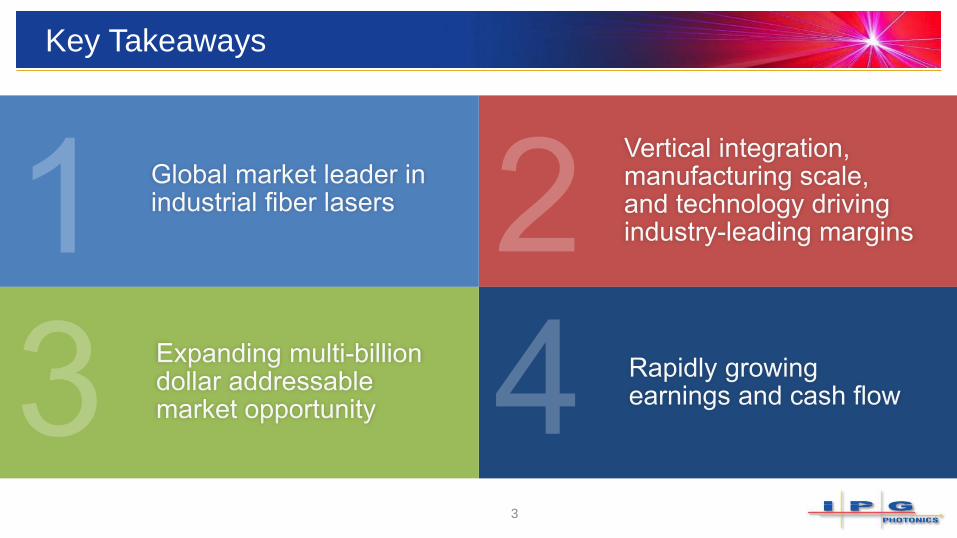
Key Takeaways
3
Our Mission
4
Making fiber lasers the tool
of choice in mass production
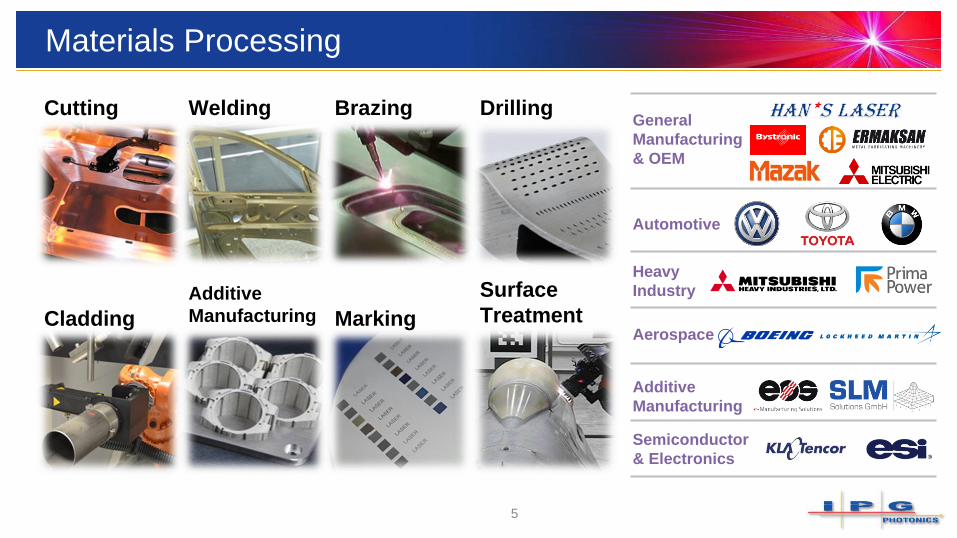
Materials Processing
5
Cutting Welding Brazing Drilling
Cladding
Additive
Manufacturing Marking
Surface
Treatment
Semiconductor
& Electronics
Additive
Manufacturing
Aerospace
Automotive
General
Manufacturing
& OEM
Heavy
Industry
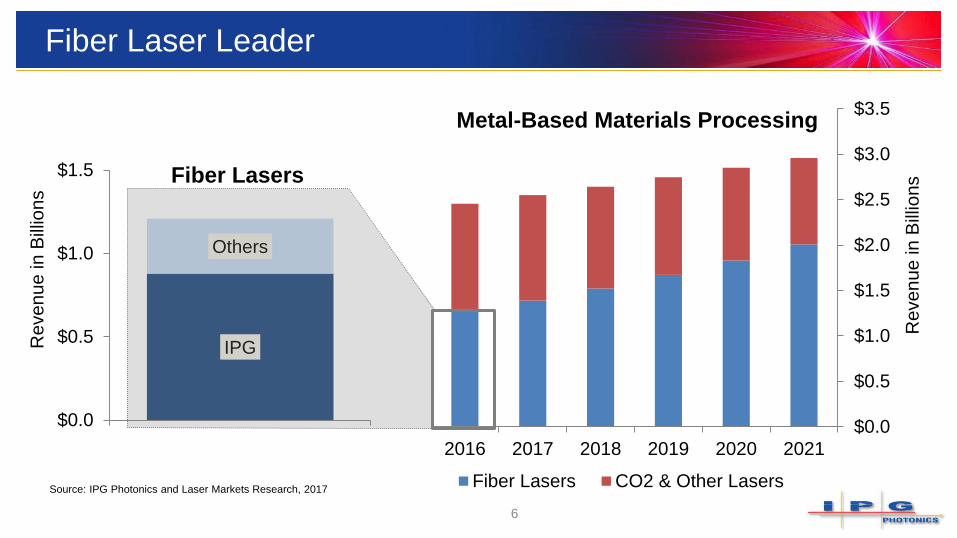
IPG
Others
$0.0
$0.5
$1.0
$1.5
Reven
ue
in
Bill
ions Fiber Lasers
Fiber Laser Leader
6
$0.0
$0.5
$1.0
$1.5
$2.0
$2.5
$3.0
$3.5
2016 2017 2018 2019 2020 2021
Reven
ue
in
Bill
ions
Fiber Lasers CO2 & Other Lasers
Metal-Based Materials Processing
Source: IPG Photonics and Laser Markets Research, 2017
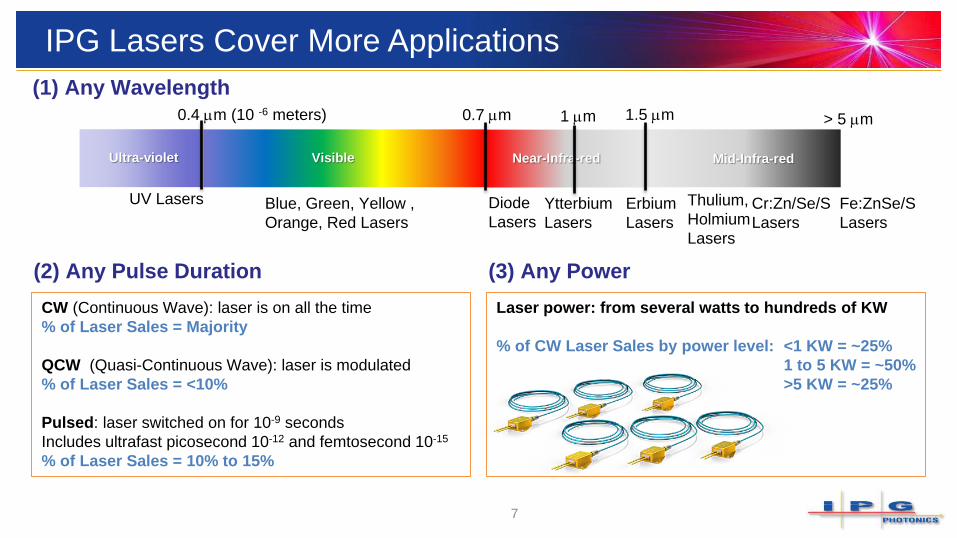
IPG Lasers Cover More Applications
7
(1) Any Wavelength
Fe:ZnSe/S
Lasers
UV Lasers
Ultra-violet
Blue, Green, Yellow ,
Orange, Red Lasers
Ytterbium
Lasers
Visible Near-Infra-red
0.4 mm (10 -6 meters) 0.7 mm 1.5 mm
Diode
Lasers Erbium
Lasers
Thulium,
Holmium
Lasers
Cr:Zn/Se/S
Lasers
> 5 mm
Mid-Infra-red
(2) Any Pulse Duration (3) Any Power
CW (Continuous Wave): laser is on all the time
% of Laser Sales = Majority
QCW (Quasi-Continuous Wave): laser is modulated
% of Laser Sales = <10%
Pulsed: laser switched on for 10-9 seconds
Includes ultrafast picosecond 10-12 and femtosecond 10-15
% of Laser Sales = 10% to 15%
Laser power: from several watts to hundreds of KW
% of CW Laser Sales by power level: <1 KW = ~25%
1 to 5 KW = ~50%
>5 KW = ~25%
1 mm
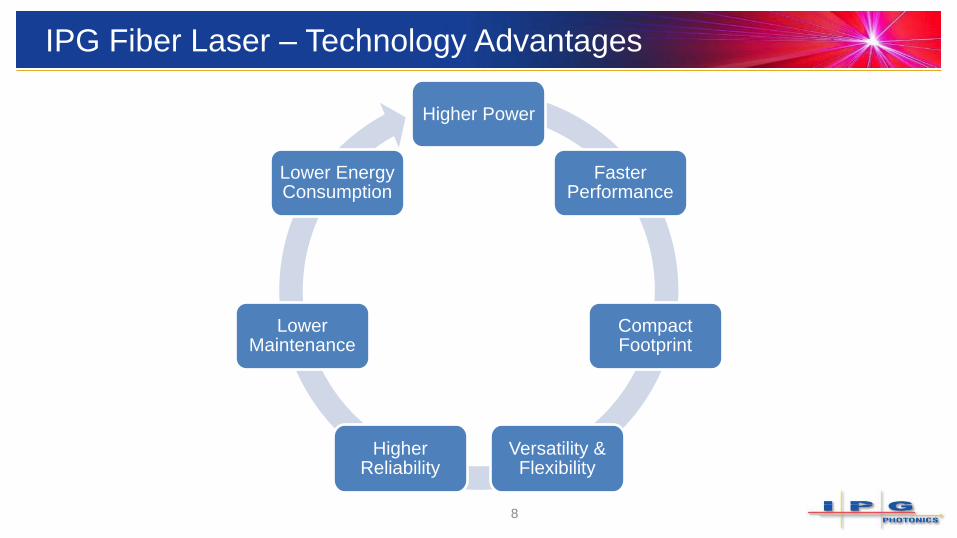
Higher Power
Faster Performance
Compact Footprint
Versatility & Flexibility
Higher Reliability
Lower Maintenance
Lower Energy Consumption
IPG Fiber Laser – Technology Advantages
8
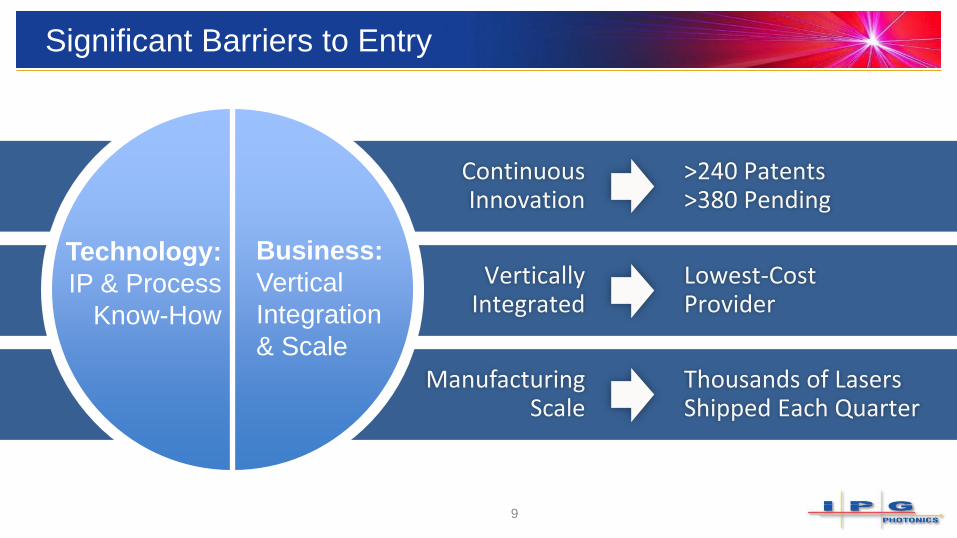
Significant Barriers to Entry
9
Technology:
IP & Process
Know-How
Business:
Vertical
Integration
& Scale
-40%
-20%
0%
20%
40%
60%
80%
100%
120%
0
2,000,000
4,000,000
6,000,000
8,000,000
10,000,000
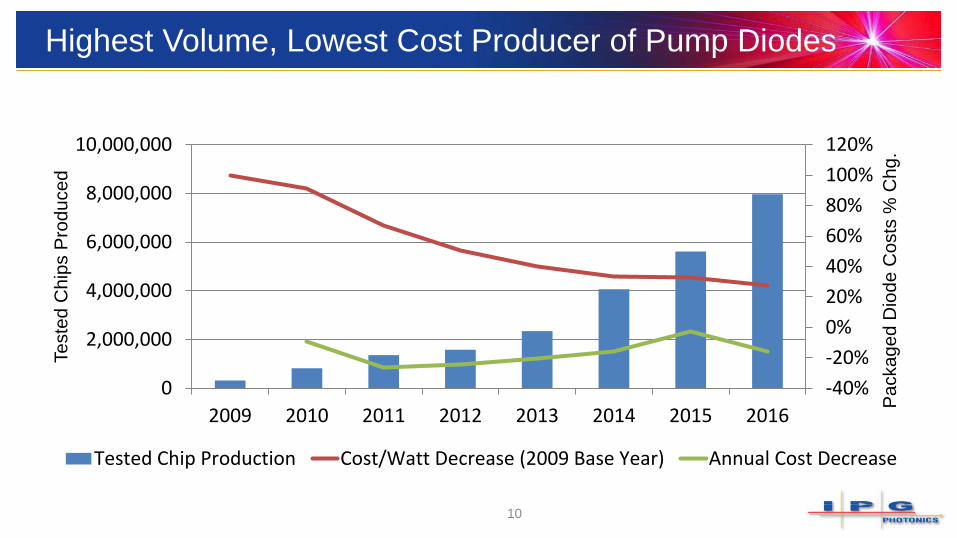
2009 2010 2011 2012 2013 2014 2015 2016
Packag
ed
Dio
de C
osts
% C
hg.
Teste
d C
hip
s P
rod
uced
Tested Chip Production Cost/Watt Decrease (2009 Base Year) Annual Cost Decrease
Highest Volume, Lowest Cost Producer of Pump Diodes
10
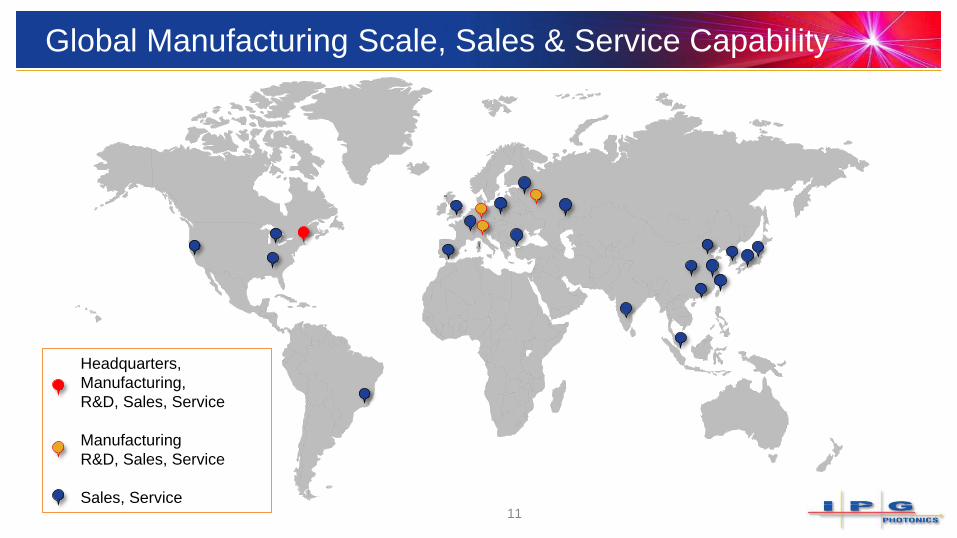
Headquarters,
Manufacturing,
R&D, Sales, Service
Manufacturing
R&D, Sales, Service
Sales, Service
Global Manufacturing Scale, Sales & Service Capability
11
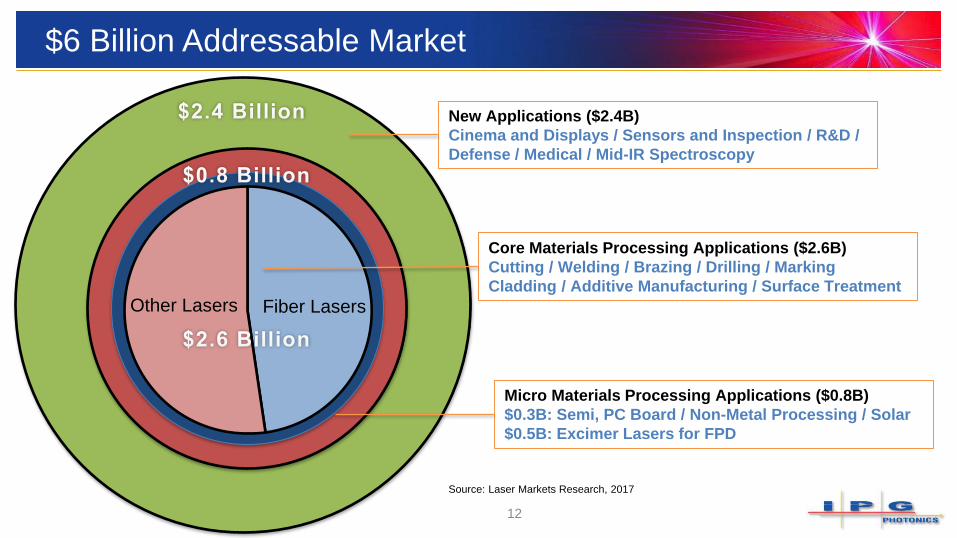
$6 Billion Addressable Market
12
Core Materials Processing Applications ($2.6B)
Cutting / Welding / Brazing / Drilling / Marking
Cladding / Additive Manufacturing / Surface Treatment
Micro Materials Processing Applications ($0.8B)
$0.3B: Semi, PC Board / Non-Metal Processing / Solar
$0.5B: Excimer Lasers for FPD
New Applications ($2.4B)
Cinema and Displays / Sensors and Inspection / R&D /
Defense / Medical / Mid-IR Spectroscopy
Source: Laser Markets Research, 2017
Fiber Lasers Other Lasers
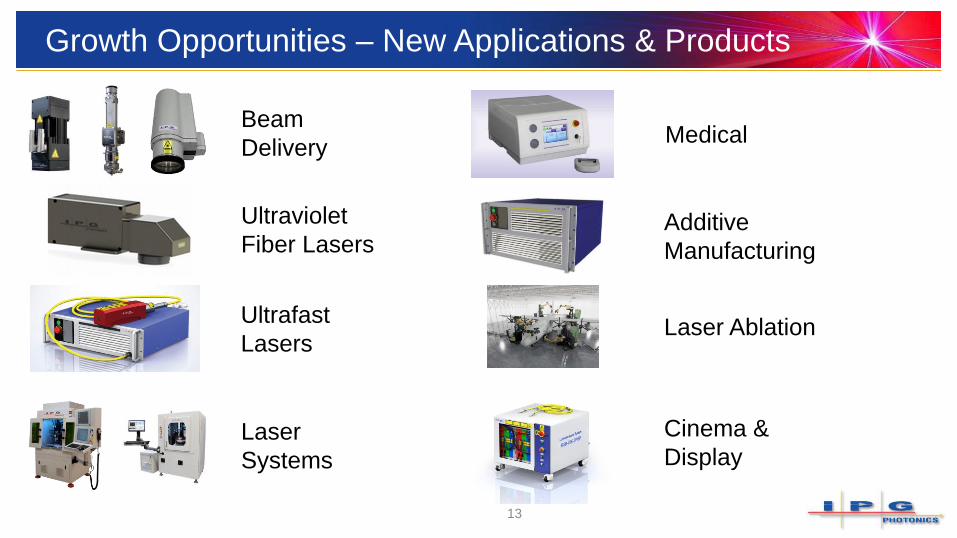
Growth Opportunities – New Applications & Products
13
Beam
Delivery
Ultraviolet
Fiber Lasers
Ultrafast
Lasers
Laser
Systems
Medical
Additive
Manufacturing
Laser Ablation
Cinema &
Display
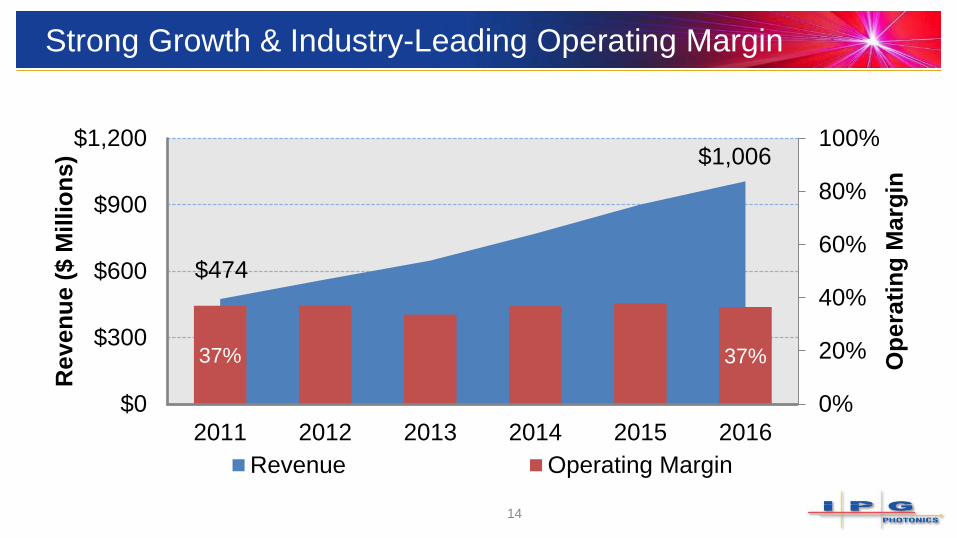
Strong Growth & Industry-Leading Operating Margin
14
$474
$1,006
37% 37%
0%
20%
40%
60%
80%
100%
$0
$300
$600
$900
$1,200
2011 2012 2013 2014 2015 2016
Op
era
tin
g M
arg
in
Reve
nu
e (
$ M
illio
ns)
Revenue Operating Margin
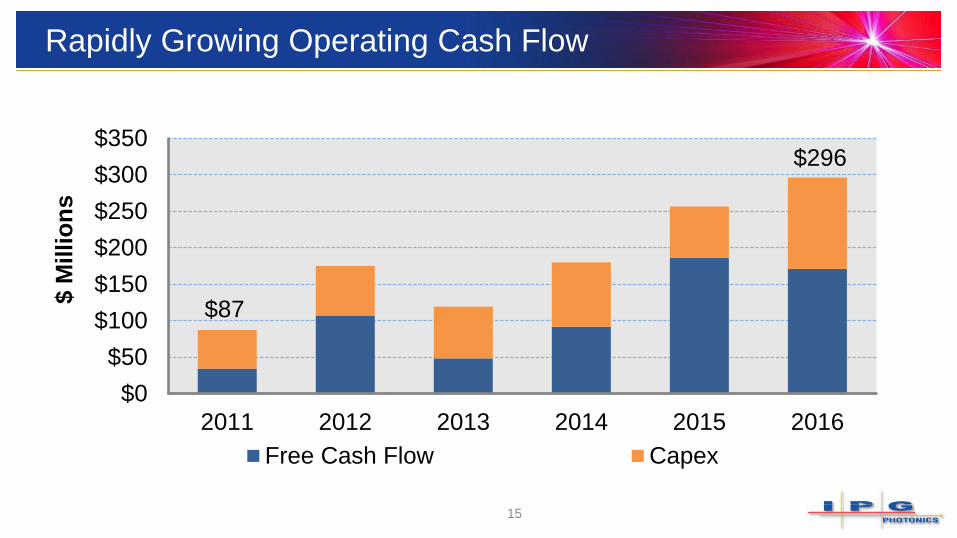
Rapidly Growing Operating Cash Flow
15
$87
$296
$0
$50
$100
$150
$200
$250
$300
$350
2011 2012 2013 2014 2015 2016
$ M
illio
ns
Free Cash Flow Capex
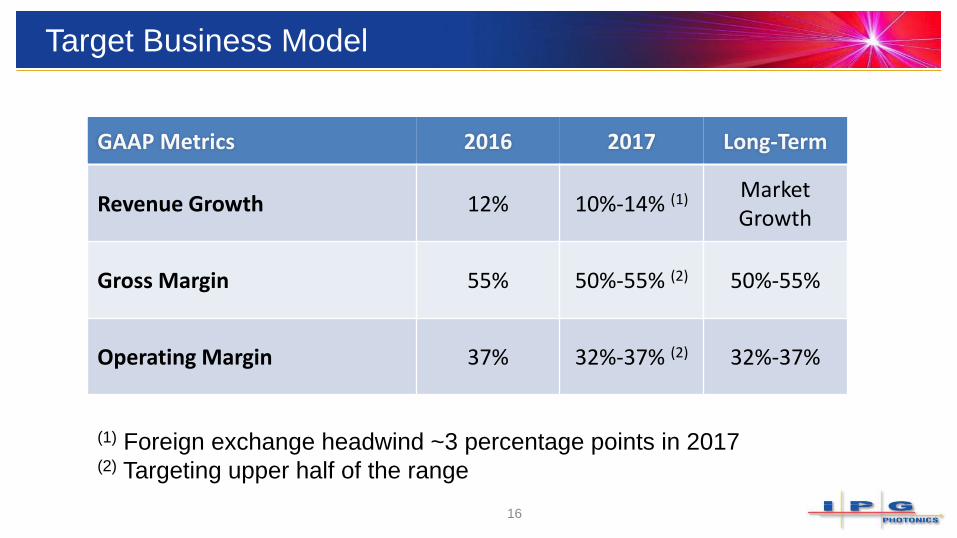
Target Business Model
16
Revenue Growth 12% 10%-14% (1) Market Growth
Gross Margin 55% 50%-55% (2) 50%-55%
Operating Margin 37% 32%-37% (2) 32%-37%
(1) Foreign exchange headwind ~3 percentage points in 2017 (2) Targeting upper half of the range
www.ipgphotonics.com
Thank You
NASDAQ: IPGP
Questions? Contact Investor Relations:
Web: investor.ipgphotonics.com
Email: [email protected]
Phone: (508) 373-1467