Embed Size (px)
Citation preview
Headings and Fonts
000
155
071
Chart Colours
192
192
192
122
098
166
000
110
038
213
234
192
000
155
071
Investor presentation
October 2013

Headings and Fonts
000
155
071
Chart Colours
192
192
192
122
098
166
000
110
038
213
234
192
000
155
071
2
Certain statements and/or other information included in this document may not be historical facts and may constitute “forward
looking statements” within the meaning of Section 27A of the U.S. Securities Act and Section 2(1)(e) of the U.S. Securities Exchange
Act of 1934, as amended. The words “believe”, “expect”, “anticipate”, “intend”, “estimate”, “plans”, “forecast”, “project”, “will”,
“may”, “should” and similar expressions may identify forward looking statements but are not the exclusive means of identifying
such statements. Forward looking statements include statements concerning our plans, expectations, projections, objectives,
targets, goals, strategies, future events, future revenues, operations or performance, capital expenditures, financing needs, our
plans or intentions relating to the expansion or contraction of our business as well as specific acquisitions and dispositions, our
competitive strengths and weaknesses, our plans or goals relating to forecasted production, reserves, financial position and future
operations and development, our business strategy and the trends we anticipate in the industry and the political, economic, social
and legal environment in which we operate, and other information that is not historical information, together with the assumptions
underlying these forward looking statements. By their very nature, forward looking statements involve inherent risks, uncertainties
and other important factors that could cause our actual results, performance or achievements to be materially different from results,
performance or achievements expressed or implied by such forward-looking statements. Such forward-looking statements are
based on numerous assumptions regarding our present and future business strategies and the political, economic, social and legal
environment in which we will operate in the future. We do not make any representation, warranty or prediction that the results
anticipated by such forward-looking statements will be achieved, and such forward-looking statements represent, in each case, only
one of many possible scenarios and should not be viewed as the most likely or standard scenario. We expressly disclaim any
obligation or undertaking to update any forward-looking statements to reflect actual results, changes in assumptions or in any other
factors affecting such statements.
Disclaimer
Headings and Fonts
000
155
071
Chart Colours
192
192
192
122
098
166
000
110
038
213
234
192
000
155
071
Co
rpo
rate
an
d
Fin
an
cia
l Hig
hli
gh
ts
Q2
20
13
Fin
an
cia
l an
d
Op
era
tin
g R
esu
lts
Q2
20
13
Acq
uis
itio
n
of
Sca
rte
l/Y
ota
O
utl
oo
k
for
20
13
W
ha
t Is
M
eg
aFo
n
01 What is MegaFon
02 Corporate and Financial Highlights Q2 2013
03 Financial and Operating Results Q2 2013
04 Acquisition of Scartel / Yota
05 Outlook for 2013
Agenda
Headings and Fonts
000
155
071
Chart Colours
192
192
192
122
098
166
000
110
038
213
234
192
000
155
071
Co
rpo
rate
an
d
Fin
an
cia
l Hig
hli
gh
ts
Q2
20
13
Fin
an
cia
l an
d
Op
era
tin
g R
esu
lts
Q2
20
13
Acq
uis
itio
n
of
Sca
rte
l/Y
ota
O
utl
oo
k
for
20
13
W
ha
t Is
M
eg
aFo
n
What is MegaFon 01
Headings and Fonts
000
155
071
Chart Colours
192
192
192
122
098
166
000
110
038
213
234
192
000
155
071
5
Co
rpo
rate
an
d
Fin
an
cia
l Hig
hli
gh
ts
Q2
20
13
Fin
an
cia
l an
d
Op
era
tin
g R
esu
lts
Q2
20
13
Acq
uis
itio
n
of
Sca
rte
l/Y
ota
O
utl
oo
k
for
20
13
W
ha
t Is
M
eg
aFo
n
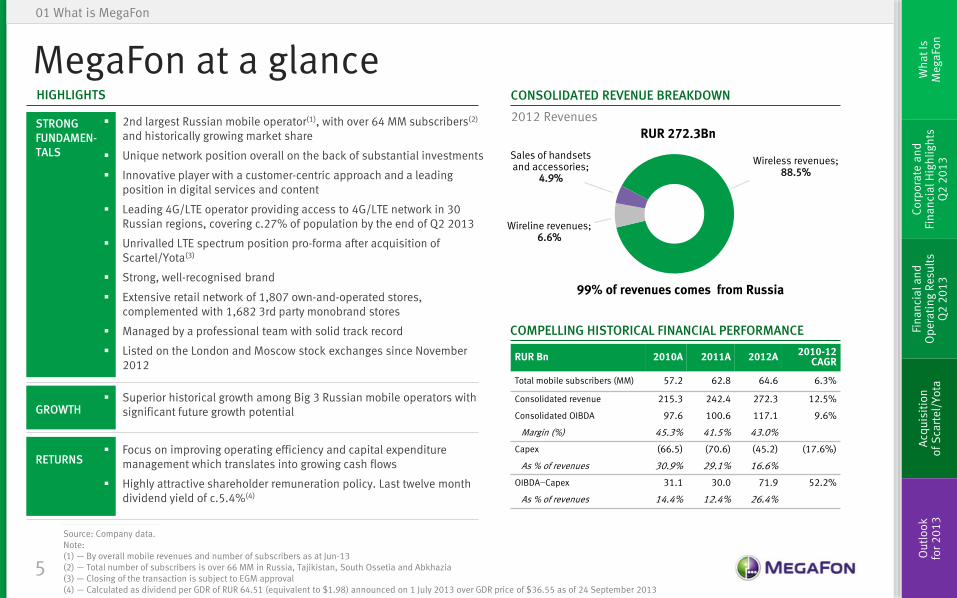
99% of revenues comes from Russia
Wireless revenues; 88.5%
Wireline revenues; 6.6%
Sales of handsets and accessories;
4.9%
RUR 272.3Bn
MegaFon at a glance HIGHLIGHTS
01 What is MegaFon
CONSOLIDATED REVENUE BREAKDOWN
Source: Company data. Note: (1) — By overall mobile revenues and number of subscribers as at Jun-13 (2) — Total number of subscribers is over 66 MM in Russia, Tajikistan, South Ossetia and Abkhazia (3) — Closing of the transaction is subject to EGM approval (4) — Calculated as dividend per GDR of RUR 64.51 (equivalent to $1.98) announced on 1 July 2013 over GDR price of $36.55 as of 24 September 2013
2nd largest Russian mobile operator(1), with over 64 MM subscribers(2) and historically growing market share
Unique network position overall on the back of substantial investments
Innovative player with a customer-centric approach and a leading position in digital services and content
Leading 4G/LTE operator providing access to 4G/LTE network in 30 Russian regions, covering c.27% of population by the end of Q2 2013
Unrivalled LTE spectrum position pro-forma after acquisition of Scartel/Yota(3)
Strong, well-recognised brand
Extensive retail network of 1,807 own-and-operated stores, complemented with 1,682 3rd party monobrand stores
Managed by a professional team with solid track record
Listed on the London and Moscow stock exchanges since November 2012
RUR Bn 2010A 2011A 2012A 2010-12 CAGR
Total mobile subscribers (MM) 57.2 62.8 64.6 6.3%
Consolidated revenue 215.3 242.4 272.3 12.5%
Consolidated OIBDA 97.6 100.6 117.1 9.6%
Margin (%) 45.3% 41.5% 43.0%
Capex (66.5) (70.6) (45.2) (17.6%)
As % of revenues 30.9% 29.1% 16.6%
OIBDA−Capex 31.1 30.0 71.9 52.2%
As % of revenues 14.4% 12.4% 26.4%
2012 Revenues
COMPELLING HISTORICAL FINANCIAL PERFORMANCE
STRONG FUNDAMEN- TALS
GROWTH
RETURNS
Superior historical growth among Big 3 Russian mobile operators with significant future growth potential
Focus on improving operating efficiency and capital expenditure management which translates into growing cash flows
Highly attractive shareholder remuneration policy. Last twelve month dividend yield of c.5.4%(4)
Headings and Fonts
000
155
071
Chart Colours
192
192
192
122
098
166
000
110
038
213
234
192
000
155
071
6
Co
rpo
rate
an
d
Fin
an
cia
l Hig
hli
gh
ts
Q2
20
13
Fin
an
cia
l an
d
Op
era
tin
g R
esu
lts
Q2
20
13
Acq
uis
itio
n
of
Sca
rte
l/Y
ota
O
utl
oo
k
for
20
13
W
ha
t Is
M
eg
aFo
n
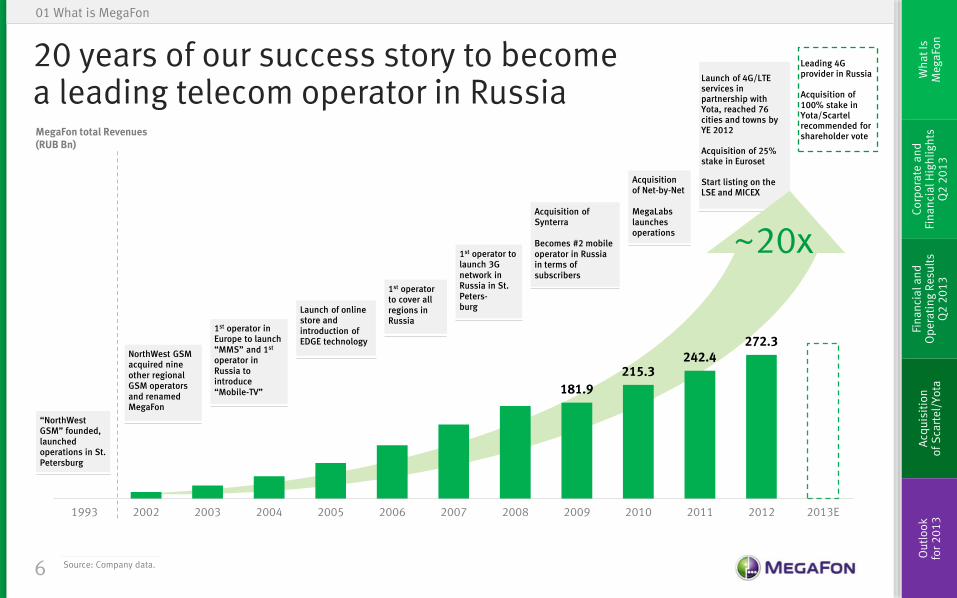
Launch of 4G/LTE services in partnership with Yota, reached 76 cities and towns by YE 2012 Acquisition of 25% stake in Euroset Start listing on the LSE and MICEX
20 years of our success story to become a leading telecom operator in Russia
01 What is MegaFon
Source: Company data.
181.9
215.3 242.4
272.3
1993 2002 2003 2004 2005 2006 2007 2008 2009 2010 2011 2012 2013E
“NorthWest GSM” founded, launched operations in St. Petersburg
1st operator in Europe to launch “MMS” and 1st operator in Russia to introduce “Mobile-TV”
1st operator to cover all regions in Russia
1st operator to launch 3G network in Russia in St. Peters- burg
Acquisition of Synterra Becomes #2 mobile operator in Russia in terms of subscribers
Acquisition of Net-by-Net MegaLabs launches operations
NorthWest GSM acquired nine other regional GSM operators and renamed MegaFon
MegaFon total Revenues (RUB Bn)
Launch of online store and introduction of EDGE technology
Leading 4G provider in Russia Acquisition of 100% stake in Yota/Scartel recommended for shareholder vote
~20x
Headings and Fonts
000
155
071
Chart Colours
192
192
192
122
098
166
000
110
038
213
234
192
000
155
071
7
Co
rpo
rate
an
d
Fin
an
cia
l Hig
hli
gh
ts
Q2
20
13
Fin
an
cia
l an
d
Op
era
tin
g R
esu
lts
Q2
20
13
Acq
uis
itio
n
of
Sca
rte
l/Y
ota
O
utl
oo
k
for
20
13
W
ha
t Is
M
eg
aFo
n
01 What is MegaFon
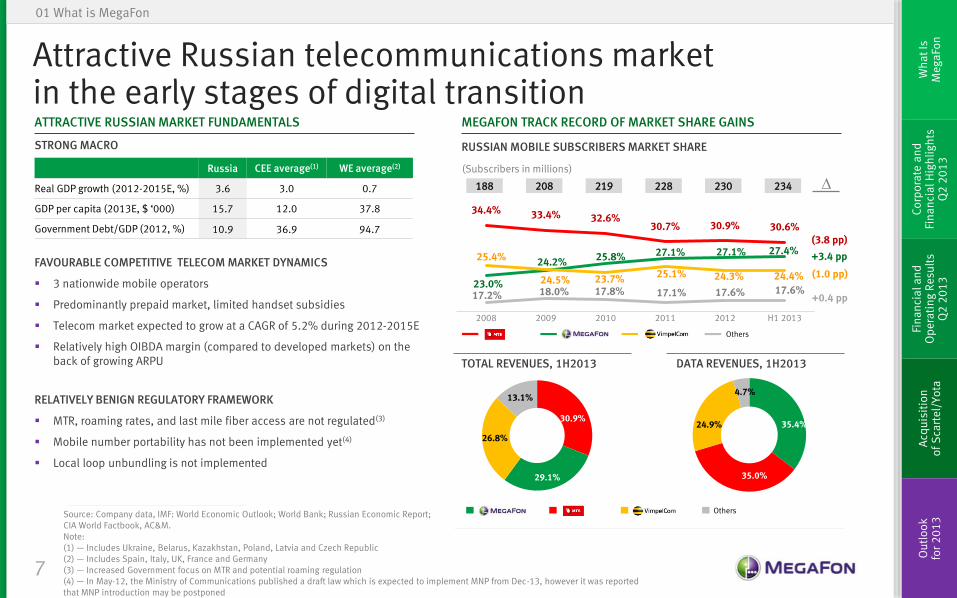
Source: Company data, IMF: World Economic Outlook; World Bank; Russian Economic Report; CIA World Factbook, AC&M. Note: (1) — Includes Ukraine, Belarus, Kazakhstan, Poland, Latvia and Czech Republic (2) — Includes Spain, Italy, UK, France and Germany (3) — Increased Government focus on MTR and potential roaming regulation (4) — In May-12, the Ministry of Communications published a draft law which is expected to implement MNP from Dec-13, however it was reported that MNP introduction may be postponed
Attractive Russian telecommunications market in the early stages of digital transition ATTRACTIVE RUSSIAN MARKET FUNDAMENTALS
STRONG MACRO
FAVOURABLE COMPETITIVE TELECOM MARKET DYNAMICS
3 nationwide mobile operators
Predominantly prepaid market, limited handset subsidies
Telecom market expected to grow at a CAGR of 5.2% during 2012-2015E
Relatively high OIBDA margin (compared to developed markets) on the back of growing ARPU
RELATIVELY BENIGN REGULATORY FRAMEWORK
MTR, roaming rates, and last mile fiber access are not regulated(3)
Mobile number portability has not been implemented yet(4)
Local loop unbundling is not implemented
Russia CEE average(1) WE average(2)
Real GDP growth (2012-2015E, %) 3.6 3.0 0.7
GDP per capita (2013E, $ ‘000) 15.7 12.0 37.8
Government Debt/GDP (2012, %) 10.9 36.9 94.7
MEGAFON TRACK RECORD OF MARKET SHARE GAINS
35.4%
35.0%
24.9%
4.7%
30.9%
29.1%
26.8%
13.1%
34.4% 33.4% 32.6% 30.7% 30.9% 30.6%
23.0%
24.2% 25.8% 27.1% 27.1% 27.4% 25.4%
24.5% 23.7% 25.1% 24.3% 24.4%
17.2% 18.0% 17.8% 17.1% 17.6% 17.6%
2008 2009 2010 2011 2012 H1 2013
(Subscribers in millions)
(1.0 pp)
+3.4 pp
+0.4 pp
(3.8 pp)
∆ 188 208 219 228 230 234
Others
RUSSIAN MOBILE SUBSCRIBERS MARKET SHARE
TOTAL REVENUES, 1H2013 DATA REVENUES, 1H2013
Others
Headings and Fonts
000
155
071
Chart Colours
192
192
192
122
098
166
000
110
038
213
234
192
000
155
071
8
Co
rpo
rate
an
d
Fin
an
cia
l Hig
hli
gh
ts
Q2
20
13
Fin
an
cia
l an
d
Op
era
tin
g R
esu
lts
Q2
20
13
Acq
uis
itio
n
of
Sca
rte
l/Y
ota
O
utl
oo
k
for
20
13
W
ha
t Is
M
eg
aFo
n
126 148 164 156 167
256
628
1,068 975 1,264
2010 2011 2012 H1 2012 H1 2013
Data ARPU, RUR per month DSU, Mb/month
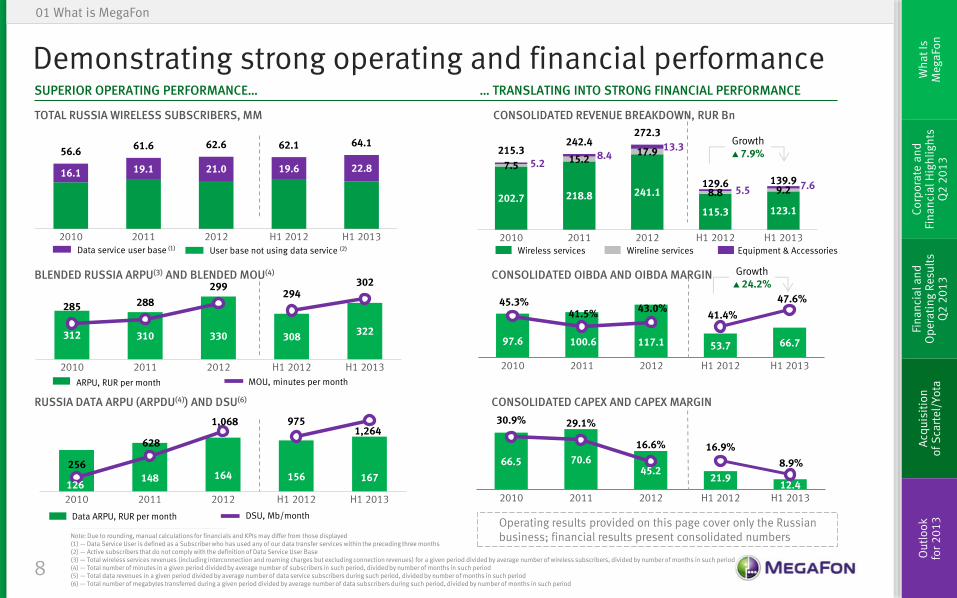
Demonstrating strong operating and financial performance
Note: Due to rounding, manual calculations for financials and KPIs may differ from those displayed (1) — Data Service User is defined as a Subscriber who has used any of our data transfer services within the preceding three months (2) — Active subscribers that do not comply with the definition of Data Service User Base (3) — Total wireless services revenues (including interconnection and roaming charges but excluding connection revenues) for a given period divided by average number of wireless subscribers, divided by number of months in such period (4) — Total number of minutes in a given period divided by average number of subscribers in such period, divided by number of months in such period (5) — Total data revenues in a given period divided by average number of data service subscribers during such period, divided by number of months in such period (6) — Total number of megabytes transferred during a given period divided by average number of data subscribers during such period, divided by number of months in such period
01 What is MegaFon
SUPERIOR OPERATING PERFORMANCE…
Operating results provided on this page cover only the Russian business; financial results present consolidated numbers
… TRANSLATING INTO STRONG FINANCIAL PERFORMANCE
202.7 218.8 241.1
115.3 123.1
7.5 15.2
17.9
8.8 9.2
5.2 8.4
13.3
5.5 7.6
215.3 242.4
272.3
129.6 139.9
2010 2011 2012 H1 2012 H1 2013
97.6 100.6 117.1 53.7 66.7
45.3% 41.5%
43.0% 41.4%
47.6%
2010 2011 2012 H1 2012 H1 2013
66.5 70.6 45.2
21.9 12.4
30.9% 29.1%
16.6% 16.9%
8.9%
2010 2011 2012 H1 2012 H1 2013
16.1 19.1 21.0 19.6 22.8
56.6 61.6 62.6 62.1 64.1
2010 2011 2012 H1 2012 H1 2013Data service user base (1) User base not using data service (2)
312 310 330 308 322
285 288
299 294
302
2010 2011 2012 H1 2012 H1 2013
Wireless services Wireline services Equipment & Accessories
ARPU, RUR per month MOU, minutes per month
Growth ▲ 7.9%
Growth ▲ 24.2%
BLENDED RUSSIA ARPU(3) AND BLENDED MOU(4)
TOTAL RUSSIA WIRELESS SUBSCRIBERS, MM
RUSSIA DATA ARPU (ARPDU(4)) AND DSU(6)
CONSOLIDATED REVENUE BREAKDOWN, RUR Bn
CONSOLIDATED OIBDA AND OIBDA MARGIN
CONSOLIDATED CAPEX AND CAPEX MARGIN
Headings and Fonts
000
155
071
Chart Colours
192
192
192
122
098
166
000
110
038
213
234
192
000
155
071
9
Co
rpo
rate
an
d
Fin
an
cia
l Hig
hli
gh
ts
Q2
20
13
Fin
an
cia
l an
d
Op
era
tin
g R
esu
lts
Q2
20
13
Acq
uis
itio
n
of
Sca
rte
l/Y
ota
O
utl
oo
k
for
20
13
W
ha
t Is
M
eg
aFo
n
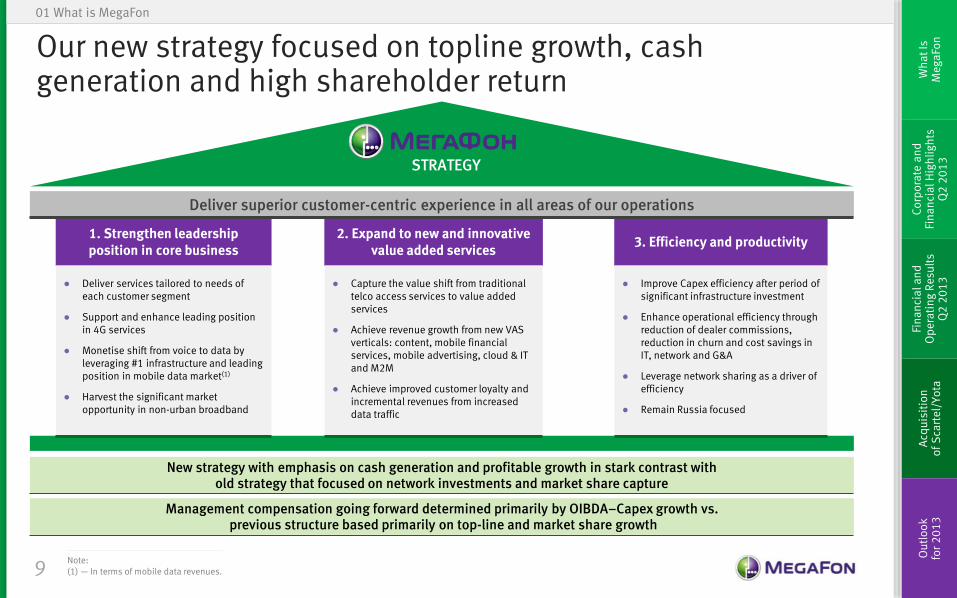
Our new strategy focused on topline growth, cash generation and high shareholder return
01 What is MegaFon
Deliver superior customer-centric experience in all areas of our operations
STRATEGY
1. Strengthen leadership position in core business
● Deliver services tailored to needs of each customer segment
● Support and enhance leading position in 4G services
● Monetise shift from voice to data by leveraging #1 infrastructure and leading position in mobile data market(1)
● Harvest the significant market opportunity in non-urban broadband
2. Expand to new and innovative value added services
● Capture the value shift from traditional telco access services to value added services
● Achieve revenue growth from new VAS verticals: content, mobile financial services, mobile advertising, cloud & IT and M2M
● Achieve improved customer loyalty and incremental revenues from increased data traffic
3. Efficiency and productivity
● Improve Capex efficiency after period of significant infrastructure investment
● Enhance operational efficiency through reduction of dealer commissions, reduction in churn and cost savings in IT, network and G&A
● Leverage network sharing as a driver of efficiency
● Remain Russia focused
New strategy with emphasis on cash generation and profitable growth in stark contrast with old strategy that focused on network investments and market share capture
Management compensation going forward determined primarily by OIBDA–Capex growth vs. previous structure based primarily on top-line and market share growth
Note: (1) — In terms of mobile data revenues.
Headings and Fonts
000
155
071
Chart Colours
192
192
192
122
098
166
000
110
038
213
234
192
000
155
071
10
Co
rpo
rate
an
d
Fin
an
cia
l Hig
hli
gh
ts
Q2
20
13
Fin
an
cia
l an
d
Op
era
tin
g R
esu
lts
Q2
20
13
Acq
uis
itio
n
of
Sca
rte
l/Y
ota
O
utl
oo
k
for
20
13
W
ha
t Is
M
eg
aFo
n
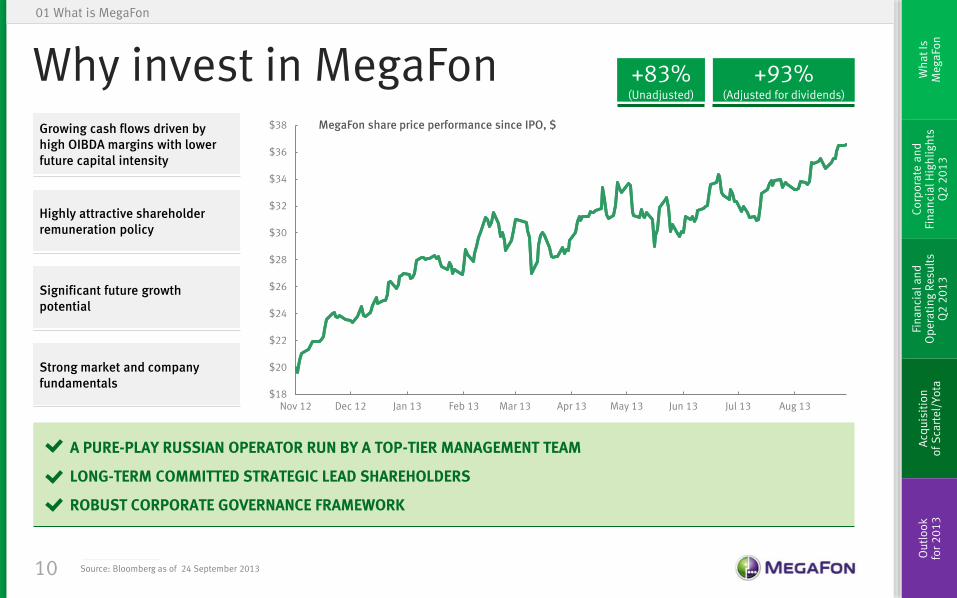
Why invest in MegaFon
01 What is MegaFon
$18
$20
$22
$24
$26
$28
$30
$32
$34
$36
$38
Nov 12 Dec 12 Jan 13 Feb 13 Mar 13 Apr 13 May 13 Jun 13 Jul 13 Aug 13
MegaFon share price performance since IPO, $
+83% (Unadjusted)
+93% (Adjusted for dividends)
Significant future growth potential
Strong market and company fundamentals
Highly attractive shareholder remuneration policy
Growing cash flows driven by high OIBDA margins with lower future capital intensity
A PURE-PLAY RUSSIAN OPERATOR RUN BY A TOP-TIER MANAGEMENT TEAM
LONG-TERM COMMITTED STRATEGIC LEAD SHAREHOLDERS
ROBUST CORPORATE GOVERNANCE FRAMEWORK
Source: Bloomberg as of 24 September 2013

Headings and Fonts
000
155
071
Chart Colours
192
192
192
122
098
166
000
110
038
213
234
192
000
155
071
Co
rpo
rate
an
d
Fin
an
cia
l Hig
hli
gh
ts
Q2
20
13
Fin
an
cia
l an
d
Op
era
tin
g R
esu
lts
Q2
20
13
Acq
uis
itio
n
of
Sca
rte
l/Y
ota
O
utl
oo
k
for
20
13
W
ha
t Is
M
eg
aFo
n
Corporate and Financial Highlights Q2 2013
02
Headings and Fonts
000
155
071
Chart Colours
192
192
192
122
098
166
000
110
038
213
234
192
000
155
071
12
Co
rpo
rate
an
d
Fin
an
cia
l Hig
hli
gh
ts
Q2
20
13
Fin
an
cia
l an
d
Op
era
tin
g R
esu
lts
Q2
20
13
Acq
uis
itio
n
of
Sca
rte
l/Y
ota
O
utl
oo
k
for
20
13
W
ha
t Is
M
eg
aFo
n
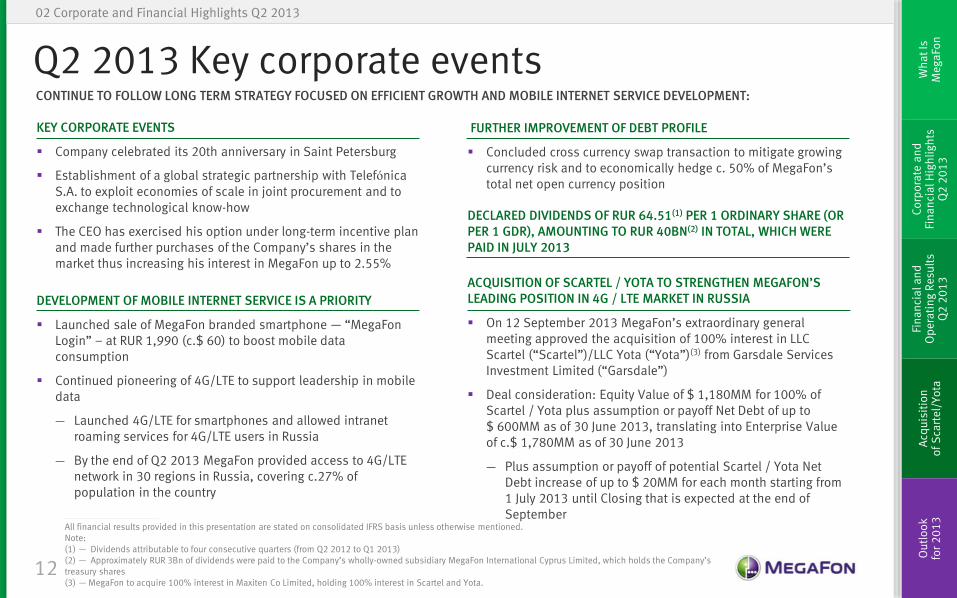
Q2 2013 Key corporate events
KEY CORPORATE EVENTS
Company celebrated its 20th anniversary in Saint Petersburg
Establishment of a global strategic partnership with Telefónica S.A. to exploit economies of scale in joint procurement and to exchange technological know-how
The CEO has exercised his option under long-term incentive plan and made further purchases of the Company’s shares in the market thus increasing his interest in MegaFon up to 2.55%
02 Corporate and Financial Highlights Q2 2013
DEVELOPMENT OF MOBILE INTERNET SERVICE IS A PRIORITY
Launched sale of MegaFon branded smartphone — “MegaFon Login” – at RUR 1,990 (c.$ 60) to boost mobile data consumption
Continued pioneering of 4G/LTE to support leadership in mobile data
― Launched 4G/LTE for smartphones and allowed intranet roaming services for 4G/LTE users in Russia
― By the end of Q2 2013 MegaFon provided access to 4G/LTE network in 30 regions in Russia, covering c.27% of population in the country
FURTHER IMPROVEMENT OF DEBT PROFILE
Concluded cross currency swap transaction to mitigate growing currency risk and to economically hedge c. 50% of MegaFon’s total net open currency position
DECLARED DIVIDENDS OF RUR 64.51(1) PER 1 ORDINARY SHARE (OR PER 1 GDR), AMOUNTING TO RUR 40BN(2) IN TOTAL, WHICH WERE PAID IN JULY 2013
All financial results provided in this presentation are stated on consolidated IFRS basis unless otherwise mentioned. Note: (1) — Dividends attributable to four consecutive quarters (from Q2 2012 to Q1 2013) (2) — Approximately RUR 3Bn of dividends were paid to the Company’s wholly-owned subsidiary MegaFon International Cyprus Limited, which holds the Company’s treasury shares (3) — MegaFon to acquire 100% interest in Maxiten Co Limited, holding 100% interest in Scartel and Yota.
ACQUISITION OF SCARTEL / YOTA TO STRENGTHEN MEGAFON’S LEADING POSITION IN 4G / LTE MARKET IN RUSSIA
On 12 September 2013 MegaFon’s extraordinary general meeting approved the acquisition of 100% interest in LLC Scartel (“Scartel”)/LLC Yota (“Yota”)(3) from Garsdale Services Investment Limited (“Garsdale”)
Deal consideration: Equity Value of $ 1,180MM for 100% of Scartel / Yota plus assumption or payoff Net Debt of up to $ 600MM as of 30 June 2013, translating into Enterprise Value of c.$ 1,780MM as of 30 June 2013
― Plus assumption or payoff of potential Scartel / Yota Net Debt increase of up to $ 20MM for each month starting from 1 July 2013 until Closing that is expected at the end of September
CONTINUE TO FOLLOW LONG TERM STRATEGY FOCUSED ON EFFICIENT GROWTH AND MOBILE INTERNET SERVICE DEVELOPMENT:
Headings and Fonts
000
155
071
Chart Colours
192
192
192
122
098
166
000
110
038
213
234
192
000
155
071
13
Co
rpo
rate
an
d
Fin
an
cia
l Hig
hli
gh
ts
Q2
20
13
Fin
an
cia
l an
d
Op
era
tin
g R
esu
lts
Q2
20
13
Acq
uis
itio
n
of
Sca
rte
l/Y
ota
O
utl
oo
k
for
20
13
W
ha
t Is
M
eg
aFo
n
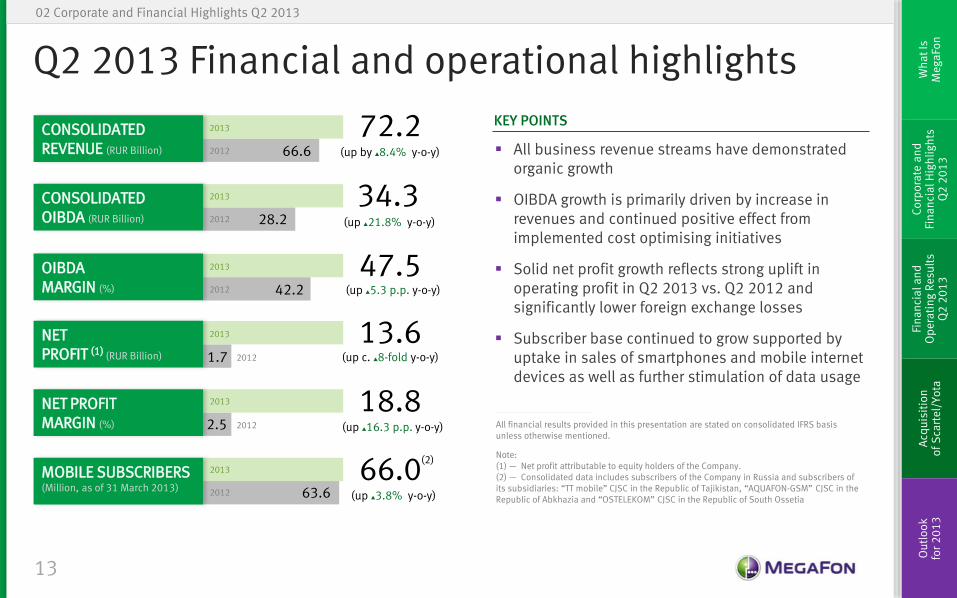
Q2 2013 Financial and operational highlights
02 Corporate and Financial Highlights Q2 2013
All business revenue streams have demonstrated organic growth
OIBDA growth is primarily driven by increase in revenues and continued positive effect from implemented cost optimising initiatives
Solid net profit growth reflects strong uplift in operating profit in Q2 2013 vs. Q2 2012 and significantly lower foreign exchange losses
Subscriber base continued to grow supported by uptake in sales of smartphones and mobile internet devices as well as further stimulation of data usage
CONSOLIDATED REVENUE (RUR Billion)
72.2 (up by ▲8.4% y-o-y)
All financial results provided in this presentation are stated on consolidated IFRS basis unless otherwise mentioned.
Note: (1) — Net profit attributable to equity holders of the Company. (2) — Consolidated data includes subscribers of the Company in Russia and subscribers of its subsidiaries: “TT mobile” CJSC in the Republic of Tajikistan, “AQUAFON-GSM” CJSC in the Republic of Abkhazia and “OSTELEKOM” CJSC in the Republic of South Ossetia
34.3
47.5
13.6
(up ▲21.8% y-o-y)
(up ▲5.3 p.p. y-o-y)
(up c. ▲8-fold y-o-y)
18.8 (up ▲16.3 p.p. y-o-y)
66.0 (up ▲3.8% y-o-y)
(2)
66.6
28.2
42.2
1.7
2.5
63.6
2012
2012
2012
2012
2013
2013
2013
2013
2013
2013
KEY POINTS
CONSOLIDATED OIBDA (RUR Billion)
OIBDA MARGIN (%)
NET PROFIT (1) (RUR Billion)
NET PROFIT MARGIN (%)
MOBILE SUBSCRIBERS (Million, as of 31 March 2013)
2012
2012
Headings and Fonts
000
155
071
Chart Colours
192
192
192
122
098
166
000
110
038
213
234
192
000
155
071
14
Co
rpo
rate
an
d
Fin
an
cia
l Hig
hli
gh
ts
Q2
20
13
Fin
an
cia
l an
d
Op
era
tin
g R
esu
lts
Q2
20
13
Acq
uis
itio
n
of
Sca
rte
l/Y
ota
O
utl
oo
k
for
20
13
W
ha
t Is
M
eg
aFo
n
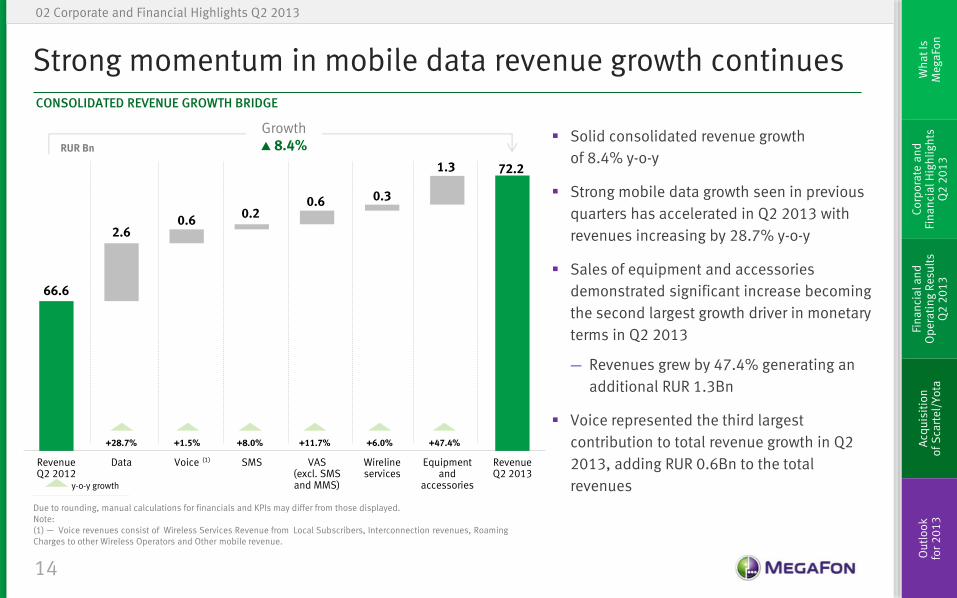
Strong momentum in mobile data revenue growth continues
Due to rounding, manual calculations for financials and KPIs may differ from those displayed. Note: (1) — Voice revenues consist of Wireless Services Revenue from Local Subscribers, Interconnection revenues, Roaming Charges to other Wireless Operators and Other mobile revenue.
02 Corporate and Financial Highlights Q2 2013
CONSOLIDATED REVENUE GROWTH BRIDGE
Solid consolidated revenue growth
of 8.4% y-o-y
Strong mobile data growth seen in previous
quarters has accelerated in Q2 2013 with
revenues increasing by 28.7% y-o-y
Sales of equipment and accessories
demonstrated significant increase becoming
the second largest growth driver in monetary
terms in Q2 2013
― Revenues grew by 47.4% generating an
additional RUR 1.3Bn
Voice represented the third largest
contribution to total revenue growth in Q2
2013, adding RUR 0.6Bn to the total
revenues
RUR Bn
y-o-y growth
66.6
2.6 0.6
0.2 0.6 0.3
1.3 72.2
RevenueQ2 2012
Data Voice SMS VAS(excl. SMSand MMS)
Wirelineservices
Equipmentand
accessories
RevenueQ2 2013
+1.5% +28.7% +8.0% +11.7% +6.0% +47.4%
(1)
Growth ▲ 8.4%
Headings and Fonts
000
155
071
Chart Colours
192
192
192
122
098
166
000
110
038
213
234
192
000
155
071
15
Co
rpo
rate
an
d
Fin
an
cia
l Hig
hli
gh
ts
Q2
20
13
Fin
an
cia
l an
d
Op
era
tin
g R
esu
lts
Q2
20
13
Acq
uis
itio
n
of
Sca
rte
l/Y
ota
O
utl
oo
k
for
20
13
W
ha
t Is
M
eg
aFo
n
Acquisition of Scartel / Yota to strengthen MegaFon’s leading position in 4G / LTE market in Russia
02 Corporate and Financial Highlights Q2 2013
ON 12 SEPTEMBER 2013 MEGAFON’S EXTRAORDINARY GENERAL MEETING APPROVED THE ACQUISITION OF 100% INTEREST IN SCARTEL / YOTA FROM GARSDALE, THE CONTROLLING SHAREHOLDER OF MEGAFON. ONLY NON-INTERESTED SHAREHOLDERS VOTED
— Scartel owns 2x30 MHz nationwide 4G / LTE spectrum in the 2.5-2.6 GHz frequency band and a 4G / LTE network covering over 30 regions in Russia or 27% of the Russian population (as of June 2013)
— Yota provides 4G / LTE mobile internet services to 605k B2C and 43k B2B retail customers using Scartel’s network (as of June 2013)
— Morgan Stanley advised MegaFon on the transaction and provided a Financial Opinion to the members of MegaFon’s Board of Directors, representing non-controlling shareholders
COMPELLING ACQUISITION RATIONALE
Significant increase in network capacity and quality, that will strengthen MegaFon’s leadership position in the fast growing mobile data market through enhanced overall service offering and customer experience
Ability to carry out 4G / LTE rollout with reduced capex and opex per Mbps of data transmission capacity because of enhanced spectrum position
Considerable cash flow savings in network rollout and maintenance driven principally by elimination of significant current and future operating costs
TOTAL CONSIDERATION OF $1.78 BN ON AN ENTERPRISE VALUE BASIS AS OF 30 JUNE 2013
Equity Consideration of $ 1,180MM, paid on a deferred basis as follows: 50% of the consideration ($ 590MM) plus interest at 6% p.a. from closing until payment date will be paid on the 1st anniversary of closing while the remaining consideration ($ 590MM) plus interest at 6% p.a. from closing until payment date will be paid on the 2nd anniversary of closing
Net Debt of the Target capped at $ 600MM as at 30 June 2013 plus increase of $ 20MM per month from 1 July 2013 until closing
IMPACT ON MEGAFON’S FINANCIAL PROFILE
No change on 2013 guidance on revenue growth, OIBDA margin or capex
No change in dividend policy

Headings and Fonts
000
155
071
Chart Colours
192
192
192
122
098
166
000
110
038
213
234
192
000
155
071
Co
rpo
rate
an
d
Fin
an
cia
l Hig
hli
gh
ts
Q2
20
13
Fin
an
cia
l an
d
Op
era
tin
g R
esu
lts
Q2
20
13
Acq
uis
itio
n
of
Sca
rte
l/Y
ota
O
utl
oo
k
for
20
13
W
ha
t Is
M
eg
aFo
n
Financial and Operating Results Q2 2013
03
Headings and Fonts
000
155
071
Chart Colours
192
192
192
122
098
166
000
110
038
213
234
192
000
155
071
17
Co
rpo
rate
an
d
Fin
an
cia
l Hig
hli
gh
ts
Q2
20
13
Fin
an
cia
l an
d
Op
era
tin
g R
esu
lts
Q2
20
13
Acq
uis
itio
n
of
Sca
rte
l/Y
ota
O
utl
oo
k
for
20
13
W
ha
t Is
M
eg
aFo
n
1.7
14.9 18.6
12.6 13.6
2.5%
20.9% 25.9%
18.6% 18.8%
Q2 2012 Q3 2012 Q4 2012 Q1 2013 Q2 2013
66.6 71.1 71.6 67.7 72.2
Q2 2012 Q3 2012 Q4 2012 Q1 2013 Q2 2013
53.7 66.7
41.4%
47.6%
H1 2012 H1 2013
Growth ▲ 24.2%
Growth ▲ 139.9%
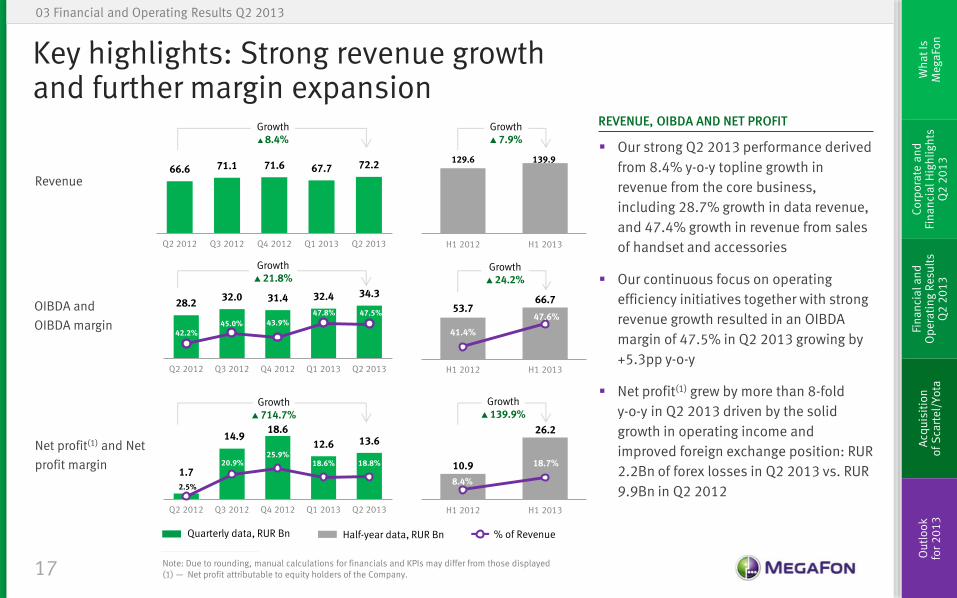
Key highlights: Strong revenue growth and further margin expansion
Note: Due to rounding, manual calculations for financials and KPIs may differ from those displayed (1) — Net profit attributable to equity holders of the Company.
03 Financial and Operating Results Q2 2013
Our strong Q2 2013 performance derived
from 8.4% y-o-y topline growth in
revenue from the core business,
including 28.7% growth in data revenue,
and 47.4% growth in revenue from sales
of handset and accessories
Our continuous focus on operating
efficiency initiatives together with strong
revenue growth resulted in an OIBDA
margin of 47.5% in Q2 2013 growing by
+5.3pp y-o-y
Net profit(1) grew by more than 8-fold
y-o-y in Q2 2013 driven by the solid
growth in operating income and
improved foreign exchange position: RUR
2.2Bn of forex losses in Q2 2013 vs. RUR
9.9Bn in Q2 2012
REVENUE, OIBDA AND NET PROFIT
Revenue
OIBDA and
OIBDA margin
Net profit(1) and Net
profit margin
28.2 32.0 31.4 32.4 34.3
42.2% 45.0% 43.9%
47.8% 47.5%
Q2 2012 Q3 2012 Q4 2012 Q1 2013 Q2 2013
Growth ▲ 21.8%
Growth ▲ 714.7%
129.6 139.9
H1 2012 H1 2013
10.9
26.2
8.4%
18.7%
H1 2012 H1 2013
Growth ▲ 8.4%
Growth ▲ 7.9%
Quarterly data, RUR Bn % of Revenue Half-year data, RUR Bn
Headings and Fonts
000
155
071
Chart Colours
192
192
192
122
098
166
000
110
038
213
234
192
000
155
071
18
Co
rpo
rate
an
d
Fin
an
cia
l Hig
hli
gh
ts
Q2
20
13
Fin
an
cia
l an
d
Op
era
tin
g R
esu
lts
Q2
20
13
Acq
uis
itio
n
of
Sca
rte
l/Y
ota
O
utl
oo
k
for
20
13
W
ha
t Is
M
eg
aFo
n
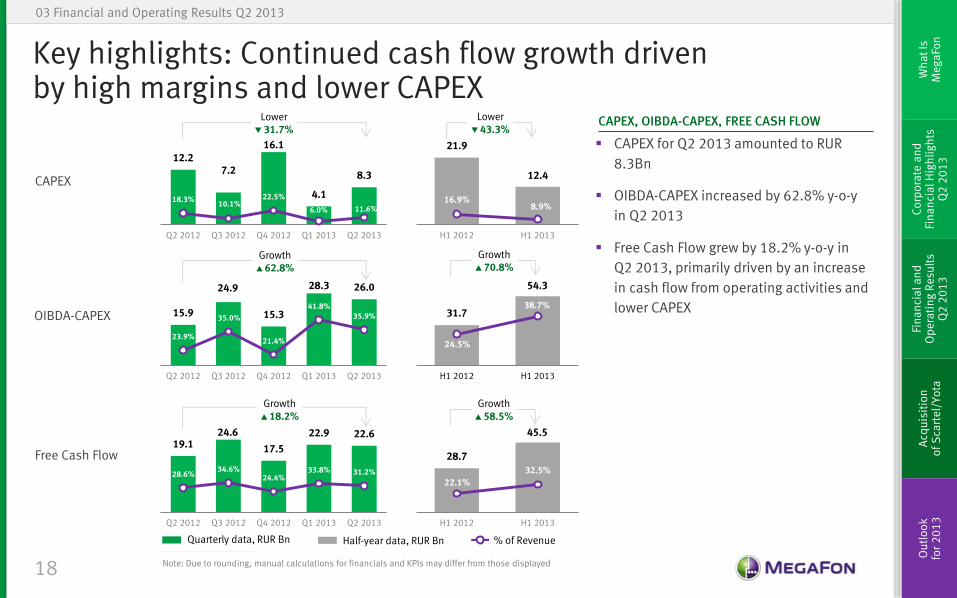
Key highlights: Continued cash flow growth driven by high margins and lower CAPEX
Note: Due to rounding, manual calculations for financials and KPIs may differ from those displayed
03 Financial and Operating Results Q2 2013
CAPEX for Q2 2013 amounted to RUR
8.3Bn
OIBDA-CAPEX increased by 62.8% y-o-y
in Q2 2013
Free Cash Flow grew by 18.2% y-o-y in
Q2 2013, primarily driven by an increase
in cash flow from operating activities and
lower CAPEX
CAPEX, OIBDA-CAPEX, FREE CASH FLOW
CAPEX
OIBDA-CAPEX
Free Cash Flow
12.2 7.2
16.1
4.1
8.3
18.3% 10.1%
22.5%
6.0% 11.6%
Q2 2012 Q3 2012 Q4 2012 Q1 2013 Q2 2013
Lower ▼ 31.7%
19.1 24.6
17.5
22.9 22.6
28.6% 34.6%
24.4% 33.8% 31.2%
Q2 2012 Q3 2012 Q4 2012 Q1 2013 Q2 2013
Growth ▲ 18.2%
15.9
24.9
15.3
28.3 26.0
23.9%
35.0%
21.4%
41.8% 35.9%
Q2 2012 Q3 2012 Q4 2012 Q1 2013 Q2 2013
Growth ▲ 62.8%
21.9
12.4
16.9% 8.9%
H1 2012 H1 2013
28.7
45.5
22.1%
32.5%
H1 2012 H1 2013
31.7
54.3
24.5%
38.7%
H1 2012 H1 2013
Lower ▼ 43.3%
Growth ▲ 70.8%
Growth ▲ 58.5%
Quarterly data, RUR Bn % of Revenue Half-year data, RUR Bn
Headings and Fonts
000
155
071
Chart Colours
192
192
192
122
098
166
000
110
038
213
234
192
000
155
071
19
Co
rpo
rate
an
d
Fin
an
cia
l Hig
hli
gh
ts
Q2
20
13
Fin
an
cia
l an
d
Op
era
tin
g R
esu
lts
Q2
20
13
Acq
uis
itio
n
of
Sca
rte
l/Y
ota
O
utl
oo
k
for
20
13
W
ha
t Is
M
eg
aFo
n
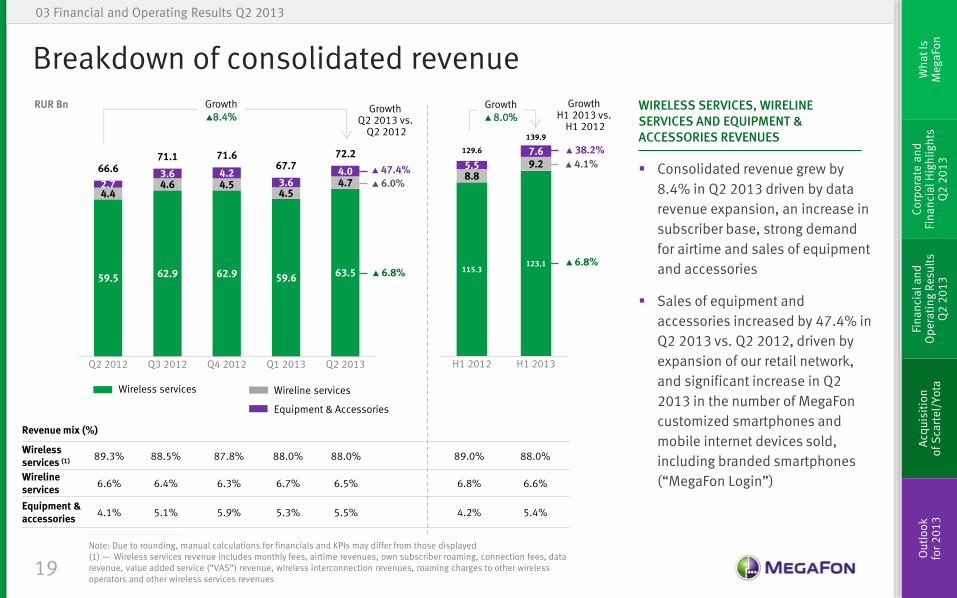
Breakdown of consolidated revenue
03 Financial and Operating Results Q2 2013
Consolidated revenue grew by
8.4% in Q2 2013 driven by data
revenue expansion, an increase in
subscriber base, strong demand
for airtime and sales of equipment
and accessories
Sales of equipment and
accessories increased by 47.4% in
Q2 2013 vs. Q2 2012, driven by
expansion of our retail network,
and significant increase in Q2
2013 in the number of MegaFon
customized smartphones and
mobile internet devices sold,
including branded smartphones
(“MegaFon Login”)
WIRELESS SERVICES, WIRELINE SERVICES AND EQUIPMENT & ACCESSORIES REVENUES
Revenue mix (%)
Wireless services (1)
89.3% 88.5% 87.8% 88.0% 88.0% 89.0% 88.0%
Wireline services 6.6% 6.4% 6.3% 6.7% 6.5% 6.8% 6.6%
Equipment & accessories
4.1% 5.1% 5.9% 5.3% 5.5% 4.2% 5.4%
59.5 62.9 62.9 59.6 63.5
4.4 4.6 4.5
4.5 4.7 2.7
3.6 4.2 3.6
4.0 66.6 71.1 71.6
67.7 72.2
Q2 2012 Q3 2012 Q4 2012 Q1 2013 Q2 2013
Growth ▲8.4%
Growth Q2 2013 vs.
Q2 2012
▲ 6.8%
▲ 6.0%
▲ 47.4%
Growth H1 2013 vs.
H1 2012
▲ 6.8%
▲ 4.1%
▲ 38.2%
115.3 123,1
8.8 9.2 5.5
7.6 129.6
139.9
H1 2012 H1 2013
Growth ▲ 8.0%
Wireless services
Equipment & Accessories
Wireline services
RUR Bn
Note: Due to rounding, manual calculations for financials and KPIs may differ from those displayed (1) — Wireless services revenue includes monthly fees, airtime revenues, own subscriber roaming, connection fees, data revenue, value added service (“VAS”) revenue, wireless interconnection revenues, roaming charges to other wireless operators and other wireless services revenues
Headings and Fonts
000
155
071
Chart Colours
192
192
192
122
098
166
000
110
038
213
234
192
000
155
071
20
Co
rpo
rate
an
d
Fin
an
cia
l Hig
hli
gh
ts
Q2
20
13
Fin
an
cia
l an
d
Op
era
tin
g R
esu
lts
Q2
20
13
Acq
uis
itio
n
of
Sca
rte
l/Y
ota
O
utl
oo
k
for
20
13
W
ha
t Is
M
eg
aFo
n
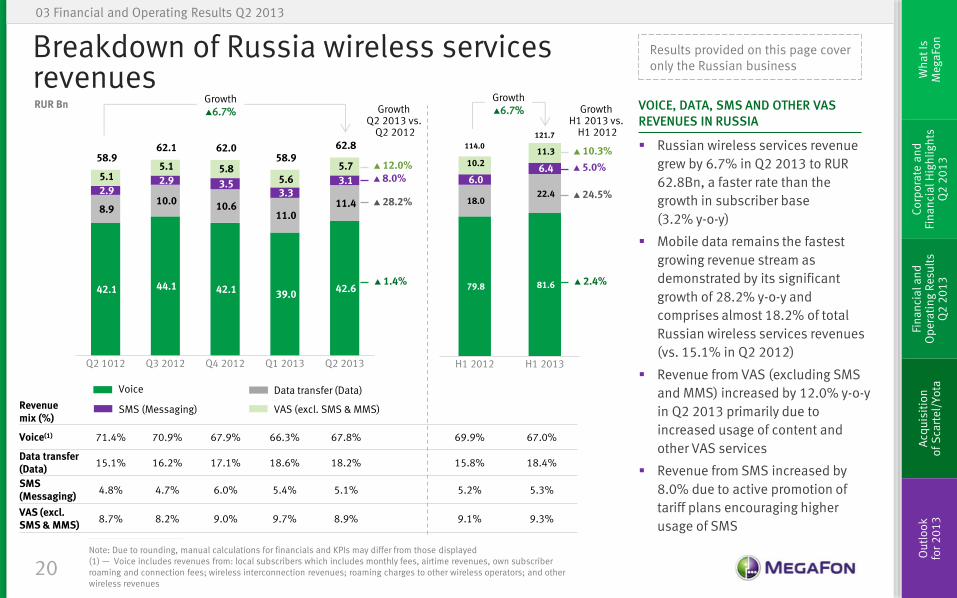
Breakdown of Russia wireless services revenues
03 Financial and Operating Results Q2 2013
Russian wireless services revenue
grew by 6.7% in Q2 2013 to RUR
62.8Bn, a faster rate than the
growth in subscriber base
(3.2% y-o-y)
Mobile data remains the fastest
growing revenue stream as
demonstrated by its significant
growth of 28.2% y-o-y and
comprises almost 18.2% of total
Russian wireless services revenues
(vs. 15.1% in Q2 2012)
Revenue from VAS (excluding SMS
and MMS) increased by 12.0% y-o-y
in Q2 2013 primarily due to
increased usage of content and
other VAS services
Revenue from SMS increased by
8.0% due to active promotion of
tariff plans encouraging higher
usage of SMS
VOICE, DATA, SMS AND OTHER VAS REVENUES IN RUSSIA
RUR Bn
Revenue mix (%)
Voice(1) 71.4% 70.9% 67.9% 66.3% 67.8% 69.9% 67.0%
Data transfer (Data)
15.1% 16.2% 17.1% 18.6% 18.2% 15.8% 18.4%
SMS (Messaging)
4.8% 4.7% 6.0% 5.4% 5.1% 5.2% 5.3%
VAS (excl. SMS & MMS)
8.7% 8.2% 9.0% 9.7% 8.9% 9.1% 9.3%
Growth H1 2013 vs.
H1 2012
Growth Q2 2013 vs.
Q2 2012
42.1 44.1 42.1 39.0 42.6
8.9 10.0
10.6 11.0
11.4 2.9
2.9 3.5 3.3
3.1 5.1 5.1 5.8
5.6 5.7
58.9 62.1 62.0
58.9 62.8
Q2 1012 Q3 2012 Q4 2012 Q1 2013 Q2 2013
79.8 81.6
18.0 22.4
6.0 6.4
10.2 11.3
114.0
121.7
H1 2012 H1 2013
Voice
VAS (excl. SMS & MMS)
Data transfer (Data)
SMS (Messaging)
Growth ▲6.7%
Growth ▲6.7%
▲ 1.4%
▲ 28.2%
▲ 8.0% ▲ 12.0%
▲ 2.4%
▲ 24.5%
▲ 5.0%
▲ 10.3%
Note: Due to rounding, manual calculations for financials and KPIs may differ from those displayed (1) — Voice includes revenues from: local subscribers which includes monthly fees, airtime revenues, own subscriber roaming and connection fees; wireless interconnection revenues; roaming charges to other wireless operators; and other wireless revenues
Results provided on this page cover only the Russian business
Headings and Fonts
000
155
071
Chart Colours
192
192
192
122
098
166
000
110
038
213
234
192
000
155
071
21
Co
rpo
rate
an
d
Fin
an
cia
l Hig
hli
gh
ts
Q2
20
13
Fin
an
cia
l an
d
Op
era
tin
g R
esu
lts
Q2
20
13
Acq
uis
itio
n
of
Sca
rte
l/Y
ota
O
utl
oo
k
for
20
13
W
ha
t Is
M
eg
aFo
n
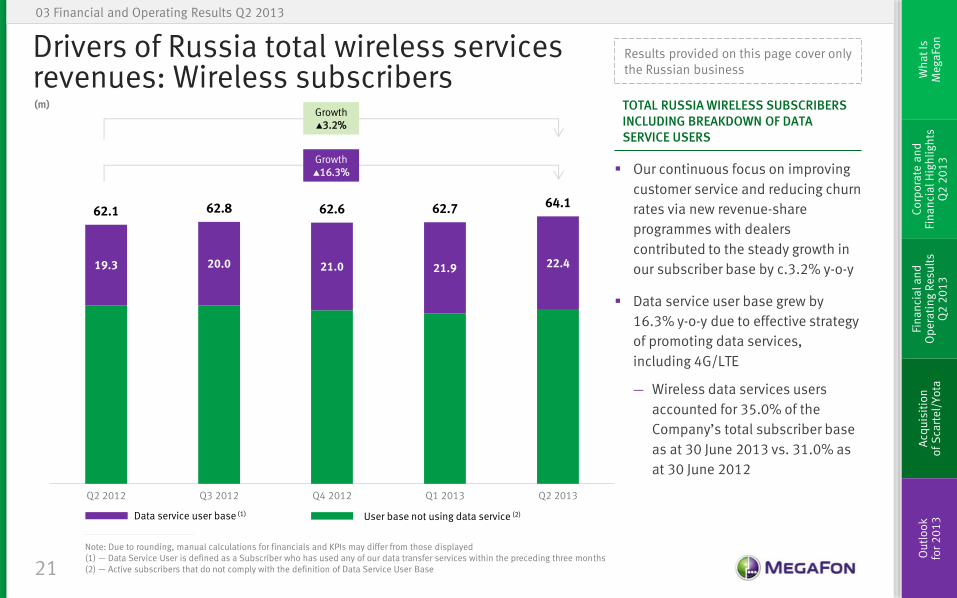
Drivers of Russia total wireless services revenues: Wireless subscribers
03 Financial and Operating Results Q2 2013
Our continuous focus on improving
customer service and reducing churn
rates via new revenue-share
programmes with dealers
contributed to the steady growth in
our subscriber base by c.3.2% y-o-y
Data service user base grew by
16.3% y-o-y due to effective strategy
of promoting data services,
including 4G/LTE
― Wireless data services users
accounted for 35.0% of the
Company’s total subscriber base
as at 30 June 2013 vs. 31.0% as
at 30 June 2012
TOTAL RUSSIA WIRELESS SUBSCRIBERS INCLUDING BREAKDOWN OF DATA SERVICE USERS
Results provided on this page cover only the Russian business
(m)
19.3 20.0 21.0 21.9 22.4
62.1 62.8 62.6 62.7 64.1
Q2 2012 Q3 2012 Q4 2012 Q1 2013 Q2 2013
Growth ▲16.3%
Data service user base (1) User base not using data service (2)
Note: Due to rounding, manual calculations for financials and KPIs may differ from those displayed (1) — Data Service User is defined as a Subscriber who has used any of our data transfer services within the preceding three months (2) — Active subscribers that do not comply with the definition of Data Service User Base
Growth ▲3.2%
Headings and Fonts
000
155
071
Chart Colours
192
192
192
122
098
166
000
110
038
213
234
192
000
155
071
22
Co
rpo
rate
an
d
Fin
an
cia
l Hig
hli
gh
ts
Q2
20
13
Fin
an
cia
l an
d
Op
era
tin
g R
esu
lts
Q2
20
13
Acq
uis
itio
n
of
Sca
rte
l/Y
ota
O
utl
oo
k
for
20
13
W
ha
t Is
M
eg
aFo
n
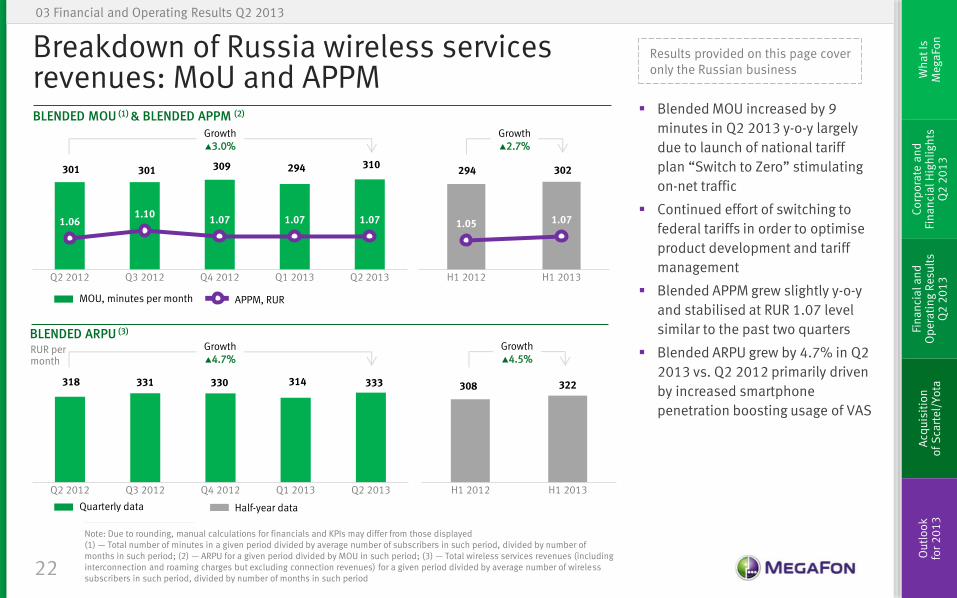
Breakdown of Russia wireless services revenues: MoU and APPM
03 Financial and Operating Results Q2 2013
Blended MOU increased by 9
minutes in Q2 2013 y-o-y largely
due to launch of national tariff
plan “Switch to Zero” stimulating
on-net traffic
Continued effort of switching to
federal tariffs in order to optimise
product development and tariff
management
Blended APPM grew slightly y-o-y
and stabilised at RUR 1.07 level
similar to the past two quarters
Blended ARPU grew by 4.7% in Q2
2013 vs. Q2 2012 primarily driven
by increased smartphone
penetration boosting usage of VAS
BLENDED MOU (1) & BLENDED APPM (2)
Results provided on this page cover only the Russian business
318 331 330 314 333
Q2 2012 Q3 2012 Q4 2012 Q1 2013 Q2 2013
301 301 309 294 310
1.06 1.10
1.07 1.07 1.07
Q2 2012 Q3 2012 Q4 2012 Q1 2013 Q2 2013
294 302
1.05 1.07
H1 2012 H1 2013
308 322
H1 2012 H1 2013
Growth ▲3.0%
Growth ▲4.7%
Growth ▲2.7%
Growth ▲4.5%
Quarterly data Half-year data
BLENDED ARPU (3)
Note: Due to rounding, manual calculations for financials and KPIs may differ from those displayed (1) — Total number of minutes in a given period divided by average number of subscribers in such period, divided by number of months in such period; (2) — ARPU for a given period divided by MOU in such period; (3) — Total wireless services revenues (including interconnection and roaming charges but excluding connection revenues) for a given period divided by average number of wireless subscribers in such period, divided by number of months in such period
RUR per month
MOU, minutes per month APPM, RUR
Headings and Fonts
000
155
071
Chart Colours
192
192
192
122
098
166
000
110
038
213
234
192
000
155
071
23
Co
rpo
rate
an
d
Fin
an
cia
l Hig
hli
gh
ts
Q2
20
13
Fin
an
cia
l an
d
Op
era
tin
g R
esu
lts
Q2
20
13
Acq
uis
itio
n
of
Sca
rte
l/Y
ota
O
utl
oo
k
for
20
13
W
ha
t Is
M
eg
aFo
n
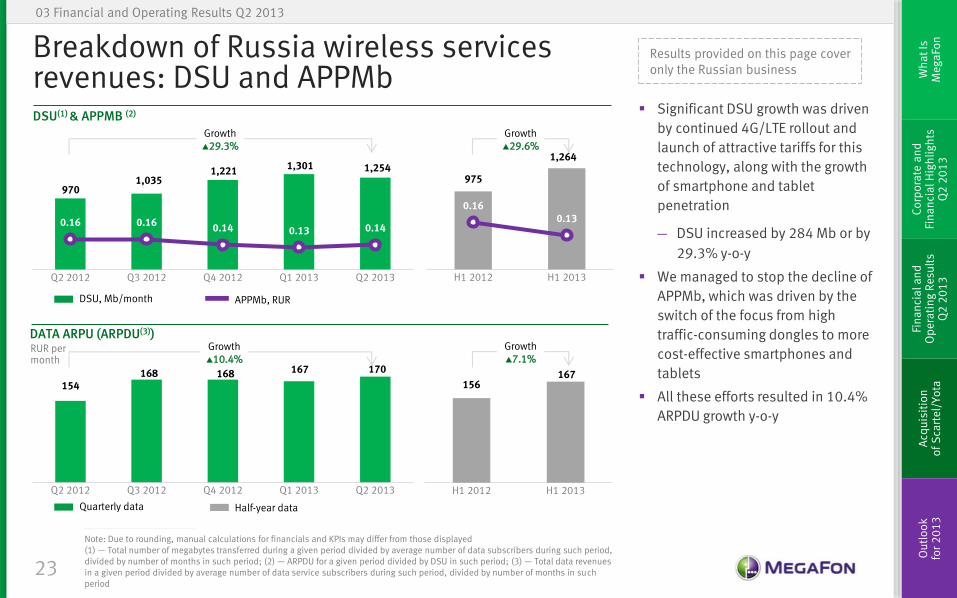
154 168 168 167 170
Q2 2012 Q3 2012 Q4 2012 Q1 2013 Q2 2013
970 1,035
1,221 1,301 1,254
0.16 0.16 0.14 0.13 0.14
Q2 2012 Q3 2012 Q4 2012 Q1 2013 Q2 2013
975
1,264
0.16 0.13
H1 2012 H1 2013
156 167
H1 2012 H1 2013
Breakdown of Russia wireless services revenues: DSU and APPMb
03 Financial and Operating Results Q2 2013
Significant DSU growth was driven
by continued 4G/LTE rollout and
launch of attractive tariffs for this
technology, along with the growth
of smartphone and tablet
penetration
― DSU increased by 284 Mb or by
29.3% y-o-y
We managed to stop the decline of
APPMb, which was driven by the
switch of the focus from high
traffic-consuming dongles to more
cost-effective smartphones and
tablets
All these efforts resulted in 10.4%
ARPDU growth y-o-y
DSU(1) & APPMB (2)
Results provided on this page cover only the Russian business
Growth ▲29.3%
Growth ▲10.4%
Growth ▲29.6%
Growth ▲7.1%
Quarterly data Half-year data
DSU, Mb/month APPMb, RUR
DATA ARPU (ARPDU(3))
Note: Due to rounding, manual calculations for financials and KPIs may differ from those displayed (1) — Total number of megabytes transferred during a given period divided by average number of data subscribers during such period, divided by number of months in such period; (2) — ARPDU for a given period divided by DSU in such period; (3) — Total data revenues in a given period divided by average number of data service subscribers during such period, divided by number of months in such period
RUR per month
Headings and Fonts
000
155
071
Chart Colours
192
192
192
122
098
166
000
110
038
213
234
192
000
155
071
24
Co
rpo
rate
an
d
Fin
an
cia
l Hig
hli
gh
ts
Q2
20
13
Fin
an
cia
l an
d
Op
era
tin
g R
esu
lts
Q2
20
13
Acq
uis
itio
n
of
Sca
rte
l/Y
ota
O
utl
oo
k
for
20
13
W
ha
t Is
M
eg
aFo
n
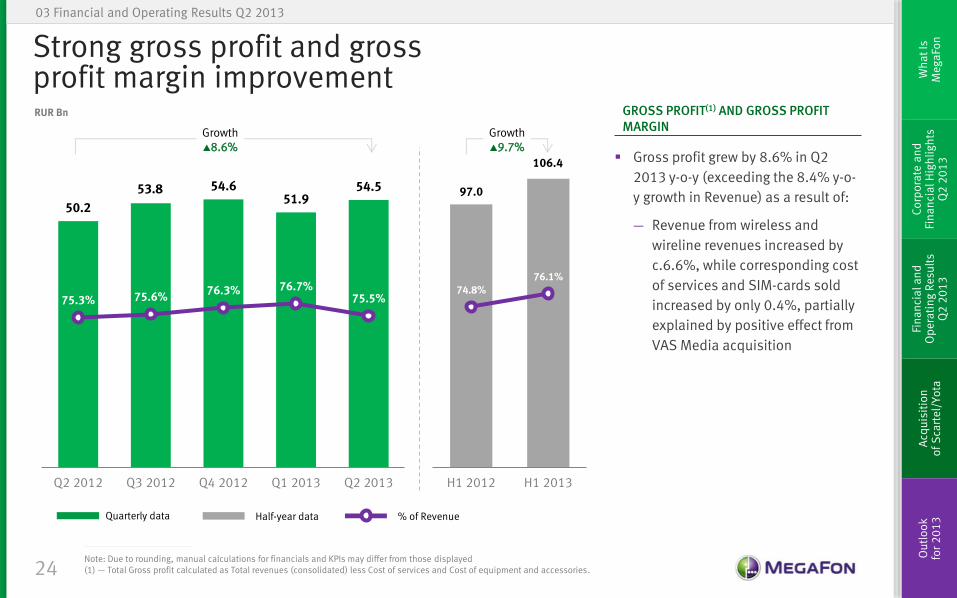
Strong gross profit and gross profit margin improvement
03 Financial and Operating Results Q2 2013
Gross profit grew by 8.6% in Q2
2013 y-o-y (exceeding the 8.4% y-o-
y growth in Revenue) as a result of:
― Revenue from wireless and
wireline revenues increased by
c.6.6%, while corresponding cost
of services and SIM-cards sold
increased by only 0.4%, partially
explained by positive effect from
VAS Media acquisition
GROSS PROFIT(1) AND GROSS PROFIT MARGIN
Note: Due to rounding, manual calculations for financials and KPIs may differ from those displayed (1) — Total Gross profit calculated as Total revenues (consolidated) less Cost of services and Cost of equipment and accessories.
RUR Bn
50.2
53.8 54.6 51.9
54.5
75.3% 75.6% 76.3% 76.7%
75.5%
Q2 2012 Q3 2012 Q4 2012 Q1 2013 Q2 2013
97.0
106.4
74.8% 76.1%
H1 2012 H1 2013
Growth ▲8.6%
Growth ▲9.7%
Quarterly data Half-year data % of Revenue
Headings and Fonts
000
155
071
Chart Colours
192
192
192
122
098
166
000
110
038
213
234
192
000
155
071
25
Co
rpo
rate
an
d
Fin
an
cia
l Hig
hli
gh
ts
Q2
20
13
Fin
an
cia
l an
d
Op
era
tin
g R
esu
lts
Q2
20
13
Acq
uis
itio
n
of
Sca
rte
l/Y
ota
O
utl
oo
k
for
20
13
W
ha
t Is
M
eg
aFo
n
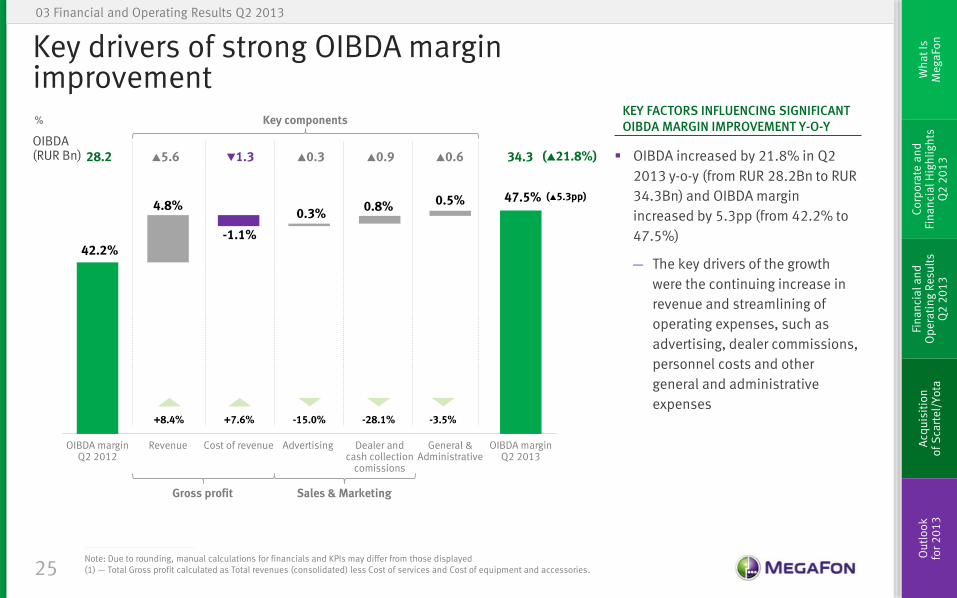
Key drivers of strong OIBDA margin improvement
03 Financial and Operating Results Q2 2013
Note: Due to rounding, manual calculations for financials and KPIs may differ from those displayed (1) — Total Gross profit calculated as Total revenues (consolidated) less Cost of services and Cost of equipment and accessories.
%
OIBDA increased by 21.8% in Q2
2013 y-o-y (from RUR 28.2Bn to RUR
34.3Bn) and OIBDA margin
increased by 5.3pp (from 42.2% to
47.5%)
― The key drivers of the growth
were the continuing increase in
revenue and streamlining of
operating expenses, such as
advertising, dealer commissions,
personnel costs and other
general and administrative
expenses
42.2%
4.8%
-1.1%
0.3% 0.8% 0.5% 47.5%
OIBDA marginQ2 2012
Revenue Cost of revenue Advertising Dealer andcash collection
comissions
General &Administrative
OIBDA marginQ2 2013
+7.6% +8.4% -3.5% -15.0%
Gross profit Sales & Marketing
28.2 34.3 OIBDA (RUR Bn) ▲5.6 ▼1.3 ▲0.3 ▲0.9 ▲0.6
Key components
(▲21.8%)
(▲5.3pp)
-28.1%
KEY FACTORS INFLUENCING SIGNIFICANT OIBDA MARGIN IMPROVEMENT Y-O-Y
Headings and Fonts
000
155
071
Chart Colours
192
192
192
122
098
166
000
110
038
213
234
192
000
155
071
26
Co
rpo
rate
an
d
Fin
an
cia
l Hig
hli
gh
ts
Q2
20
13
Fin
an
cia
l an
d
Op
era
tin
g R
esu
lts
Q2
20
13
Acq
uis
itio
n
of
Sca
rte
l/Y
ota
O
utl
oo
k
for
20
13
W
ha
t Is
M
eg
aFo
n
12.2
7.2
16.1
4.1
8.3
18.3% 10.1% 22.5%
6.0% 11.6%
Q2 2012 Q3 2012 Q4 2012 Q1 2013 Q2 2013
21.9
12.4
16.9%
8.9%
H1 2012 H1 2013
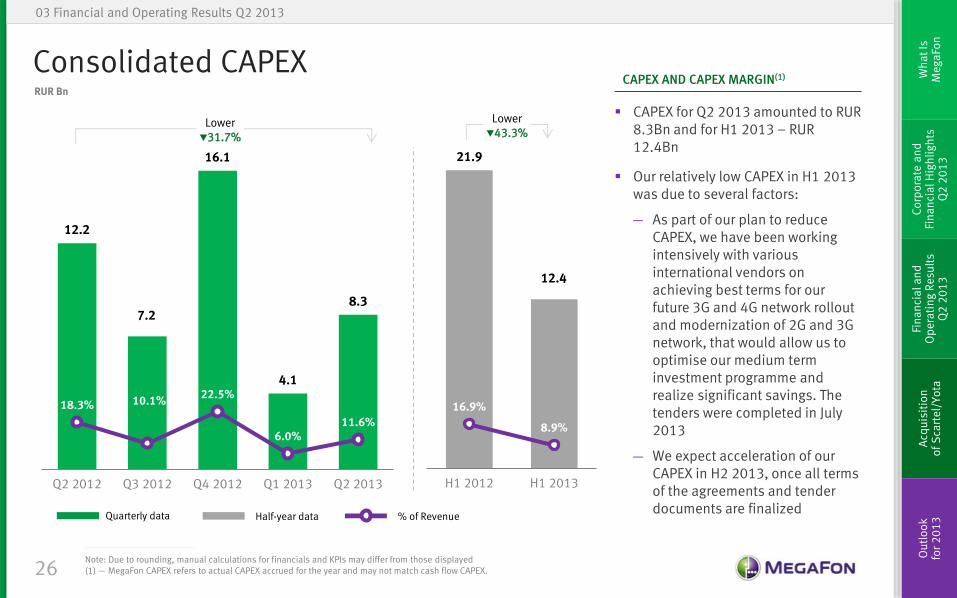
Consolidated CAPEX
03 Financial and Operating Results Q2 2013
CAPEX for Q2 2013 amounted to RUR 8.3Bn and for H1 2013 – RUR 12.4Bn
Our relatively low CAPEX in H1 2013 was due to several factors:
― As part of our plan to reduce CAPEX, we have been working intensively with various international vendors on achieving best terms for our future 3G and 4G network rollout and modernization of 2G and 3G network, that would allow us to optimise our medium term investment programme and realize significant savings. The tenders were completed in July 2013
― We expect acceleration of our CAPEX in H2 2013, once all terms of the agreements and tender documents are finalized
CAPEX AND CAPEX MARGIN(1)
% of Revenue
Note: Due to rounding, manual calculations for financials and KPIs may differ from those displayed (1) — MegaFon CAPEX refers to actual CAPEX accrued for the year and may not match cash flow CAPEX.
RUR Bn
Lower ▼31.7%
Lower ▼43.3%
Quarterly data Half-year data
Headings and Fonts
000
155
071
Chart Colours
192
192
192
122
098
166
000
110
038
213
234
192
000
155
071
27
Co
rpo
rate
an
d
Fin
an
cia
l Hig
hli
gh
ts
Q2
20
13
Fin
an
cia
l an
d
Op
era
tin
g R
esu
lts
Q2
20
13
Acq
uis
itio
n
of
Sca
rte
l/Y
ota
O
utl
oo
k
for
20
13
W
ha
t Is
M
eg
aFo
n
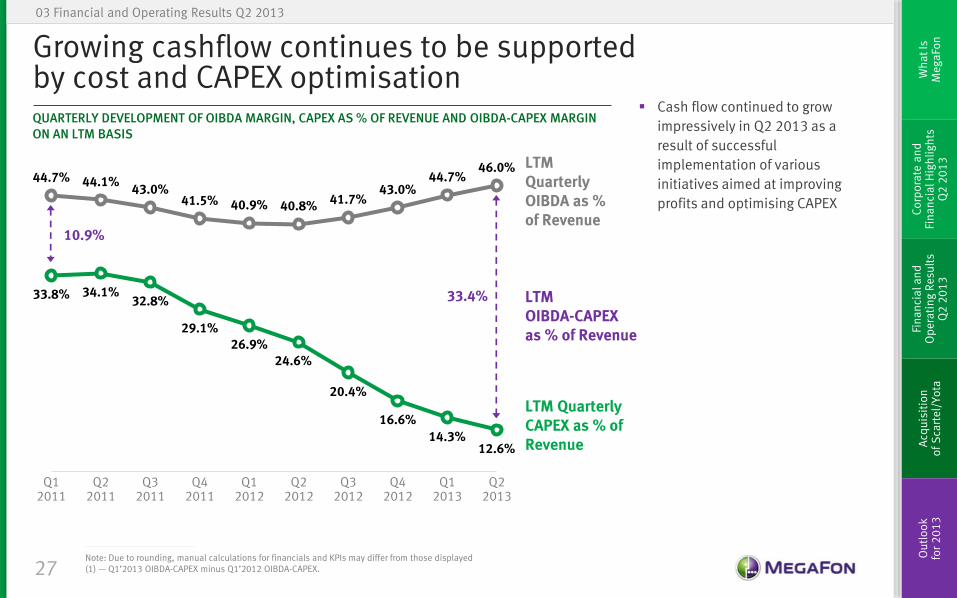
Growing cashflow continues to be supported by cost and CAPEX optimisation
03 Financial and Operating Results Q2 2013
Cash flow continued to grow
impressively in Q2 2013 as a
result of successful
implementation of various
initiatives aimed at improving
profits and optimising CAPEX
QUARTERLY DEVELOPMENT OF OIBDA MARGIN, CAPEX AS % OF REVENUE AND OIBDA-CAPEX MARGIN ON AN LTM BASIS
Note: Due to rounding, manual calculations for financials and KPIs may differ from those displayed (1) — Q1’2013 OIBDA-CAPEX minus Q1’2012 OIBDA-CAPEX.
44.7% 44.1% 43.0%
41.5% 40.9% 40.8% 41.7% 43.0%
44.7% 46.0%
33.8% 34.1% 32.8%
29.1% 26.9%
24.6%
20.4%
16.6%
14.3% 12.6%
Q12011
Q22011
Q32011
Q42011
Q12012
Q22012
Q32012
Q42012
Q12013
Q22013
10.9%
33.4%
LTM Quarterly OIBDA as % of Revenue
LTM Quarterly CAPEX as % of Revenue
LTM OIBDA-CAPEX as % of Revenue
Headings and Fonts
000
155
071
Chart Colours
192
192
192
122
098
166
000
110
038
213
234
192
000
155
071
28
Co
rpo
rate
an
d
Fin
an
cia
l Hig
hli
gh
ts
Q2
20
13
Fin
an
cia
l an
d
Op
era
tin
g R
esu
lts
Q2
20
13
Acq
uis
itio
n
of
Sca
rte
l/Y
ota
O
utl
oo
k
for
20
13
W
ha
t Is
M
eg
aFo
n
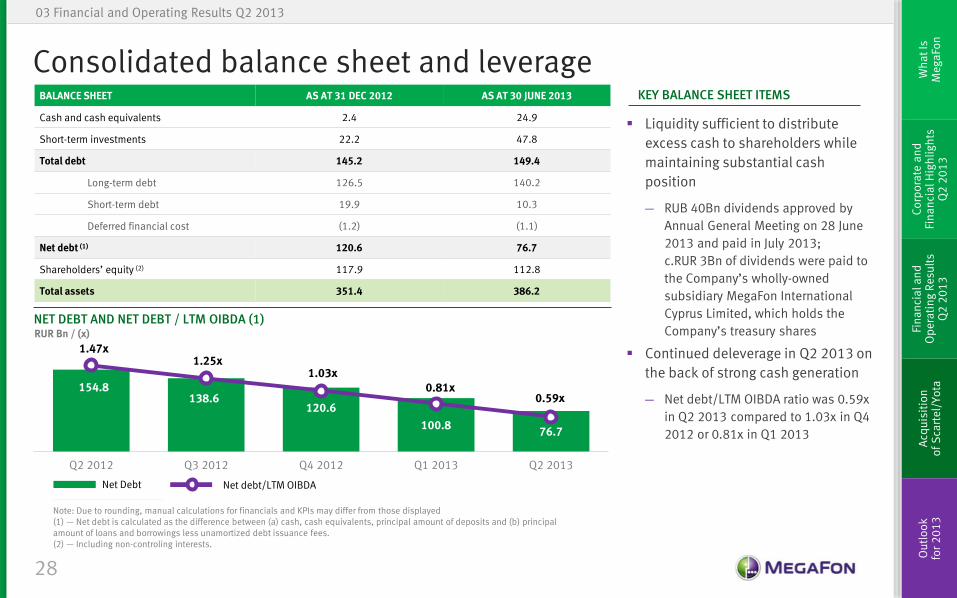
Consolidated balance sheet and leverage
NET DEBT AND NET DEBT / LTM OIBDA (1)
154.8 138.6
120.6
100.8 76.7
1.47x 1.25x
1.03x 0.81x
0.59x
Q2 2012 Q3 2012 Q4 2012 Q1 2013 Q2 2013
Liquidity sufficient to distribute
excess cash to shareholders while
maintaining substantial cash
position
― RUB 40Bn dividends approved by
Annual General Meeting on 28 June
2013 and paid in July 2013;
c.RUR 3Bn of dividends were paid to
the Company’s wholly-owned
subsidiary MegaFon International
Cyprus Limited, which holds the
Company’s treasury shares
Continued deleverage in Q2 2013 on
the back of strong cash generation
― Net debt/LTM OIBDA ratio was 0.59x
in Q2 2013 compared to 1.03x in Q4
2012 or 0.81x in Q1 2013
Note: Due to rounding, manual calculations for financials and KPIs may differ from those displayed (1) — Net debt is calculated as the difference between (a) cash, cash equivalents, principal amount of deposits and (b) principal amount of loans and borrowings less unamortized debt issuance fees. (2) — Including non-controling interests.
BALANCE SHEET AS AT 31 DEC 2012 AS AT 30 JUNE 2013
Cash and cash equivalents 2.4 24.9
Short-term investments 22.2 47.8
Total debt 145.2 149.4
Long-term debt 126.5 140.2
Short-term debt 19.9 10.3
Deferred financial cost (1.2) (1.1)
Net debt (1) 120.6 76.7
Shareholders’ equity (2) 117.9 112.8
Total assets 351.4 386.2
03 Financial and Operating Results Q2 2013
KEY BALANCE SHEET ITEMS
RUR Bn / (x)
Net Debt Net debt/LTM OIBDA
Headings and Fonts
000
155
071
Chart Colours
192
192
192
122
098
166
000
110
038
213
234
192
000
155
071
29
Co
rpo
rate
an
d
Fin
an
cia
l Hig
hli
gh
ts
Q2
20
13
Fin
an
cia
l an
d
Op
era
tin
g R
esu
lts
Q2
20
13
Acq
uis
itio
n
of
Sca
rte
l/Y
ota
O
utl
oo
k
for
20
13
W
ha
t Is
M
eg
aFo
n
52% 28%
20%
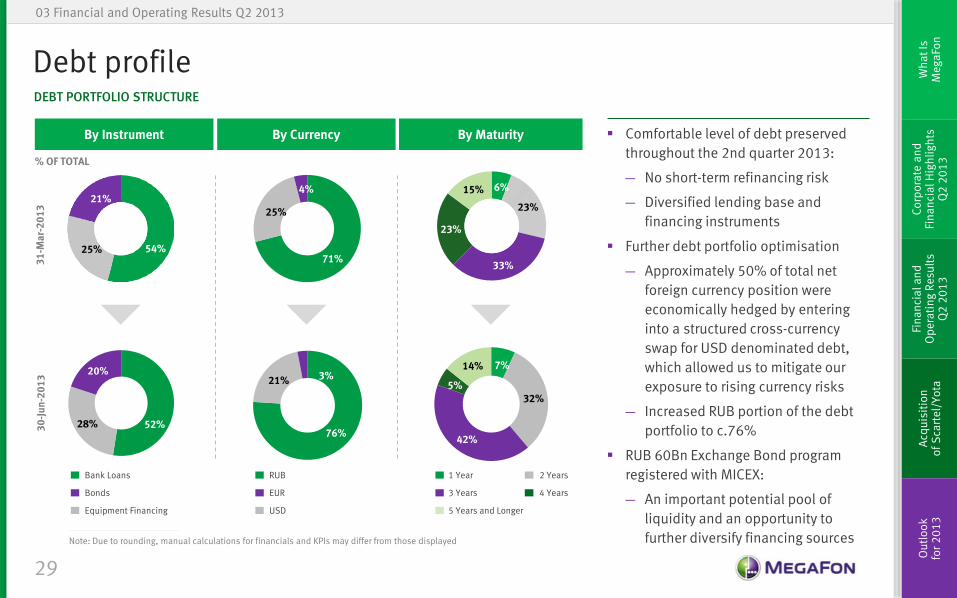
Debt profile DEBT PORTFOLIO STRUCTURE
Comfortable level of debt preserved
throughout the 2nd quarter 2013:
― No short-term refinancing risk
― Diversified lending base and
financing instruments
Further debt portfolio optimisation
― Approximately 50% of total net
foreign currency position were
economically hedged by entering
into a structured cross-currency
swap for USD denominated debt,
which allowed us to mitigate our
exposure to rising currency risks
― Increased RUB portion of the debt
portfolio to c.76%
RUB 60Bn Exchange Bond program
registered with MICEX:
― An important potential pool of
liquidity and an opportunity to
further diversify financing sources Note: Due to rounding, manual calculations for financials and KPIs may differ from those displayed
03 Financial and Operating Results Q2 2013
% OF TOTAL
54% 25%
21%
By Currency By Instrument By Maturity
31
-Ma
r-2
01
3
30
-Ju
n-2
01
3
7%
32%
42%
5%
14%
71%
25%
4%
76%
21% 3%
Bonds
Bank Loans
Equipment Financing
3 Years
1 Year
5 Years and Longer
4 Years
2 Years
EUR
RUB
USD
6%
23%
33%
23%
15%
Headings and Fonts
000
155
071
Chart Colours
192
192
192
122
098
166
000
110
038
213
234
192
000
155
071
Co
rpo
rate
an
d
Fin
an
cia
l Hig
hli
gh
ts
Q2
20
13
Fin
an
cia
l an
d
Op
era
tin
g R
esu
lts
Q2
20
13
Acq
uis
itio
n
of
Sca
rte
l/Y
ota
O
utl
oo
k
for
20
13
W
ha
t Is
M
eg
aFo
n
Acquisition of Scartel/Yota 04
Headings and Fonts
000
155
071
Chart Colours
192
192
192
122
098
166
000
110
038
213
234
192
000
155
071
31
Co
rpo
rate
an
d
Fin
an
cia
l Hig
hli
gh
ts
Q2
20
13
Fin
an
cia
l an
d
Op
era
tin
g R
esu
lts
Q2
20
13
Acq
uis
itio
n
of
Sca
rte
l/Y
ota
O
utl
oo
k
for
20
13
W
ha
t Is
M
eg
aFo
n
04 Acquisition of Scartel/Yota
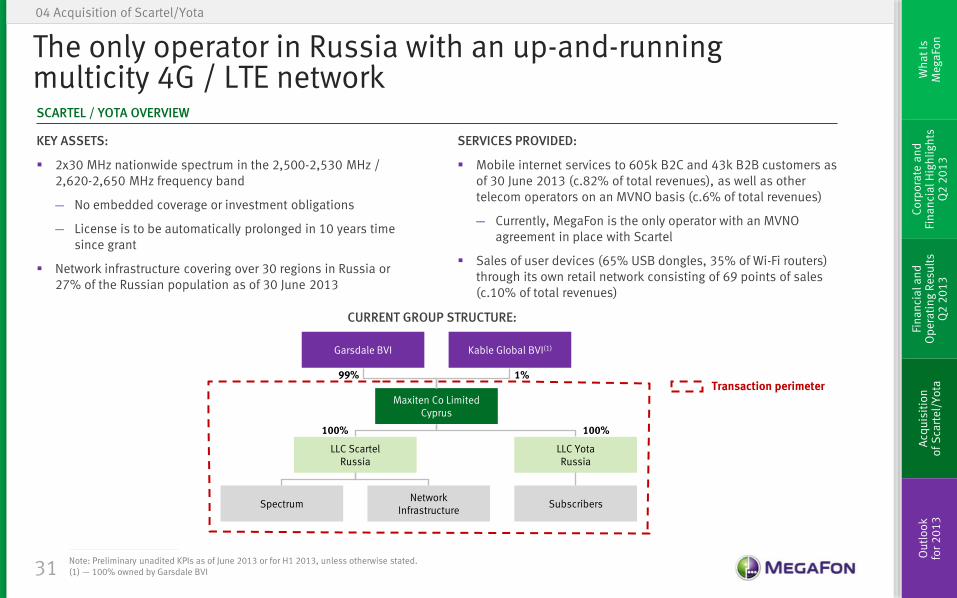
The only operator in Russia with an up-and-running multicity 4G / LTE network SCARTEL / YOTA OVERVIEW
KEY ASSETS:
2x30 MHz nationwide spectrum in the 2,500-2,530 MHz / 2,620-2,650 MHz frequency band
― No embedded coverage or investment obligations
― License is to be automatically prolonged in 10 years time since grant
Network infrastructure covering over 30 regions in Russia or 27% of the Russian population as of 30 June 2013
CURRENT GROUP STRUCTURE:
Transaction perimeter
100% 100%
LLC Yota Russia
Spectrum Network
Infrastructure
LLC Scartel Russia
Subscribers
Maxiten Co Limited Cyprus
Garsdale BVI Kable Global BVI(1)
99% 1%
SERVICES PROVIDED:
Mobile internet services to 605k B2C and 43k B2B customers as of 30 June 2013 (c.82% of total revenues), as well as other telecom operators on an MVNO basis (c.6% of total revenues)
― Currently, MegaFon is the only operator with an MVNO agreement in place with Scartel
Sales of user devices (65% USB dongles, 35% of Wi-Fi routers) through its own retail network consisting of 69 points of sales (c.10% of total revenues)
Note: Preliminary unadited KPIs as of June 2013 or for H1 2013, unless otherwise stated. (1) — 100% owned by Garsdale BVI
Headings and Fonts
000
155
071
Chart Colours
192
192
192
122
098
166
000
110
038
213
234
192
000
155
071
32
Co
rpo
rate
an
d
Fin
an
cia
l Hig
hli
gh
ts
Q2
20
13
Fin
an
cia
l an
d
Op
era
tin
g R
esu
lts
Q2
20
13
Acq
uis
itio
n
of
Sca
rte
l/Y
ota
O
utl
oo
k
for
20
13
W
ha
t Is
M
eg
aFo
n
04 Acquisition of Scartel/Yota
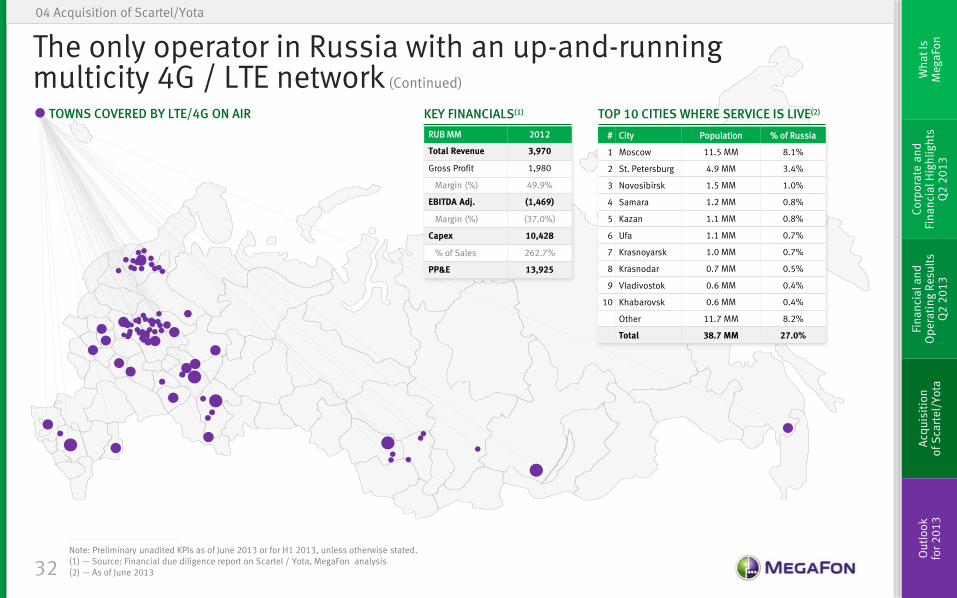
The only operator in Russia with an up-and-running multicity 4G / LTE network (Continued)
RUB MM 2012
Total Revenue 3,970
Gross Profit 1,980
Margin (%) 49.9%
EBITDA Adj. (1,469)
Margin (%) (37.0%)
Capex 10,428
% of Sales 262.7%
PP&E 13,925
# City Population % of Russia
1 Moscow 11.5 MM 8.1%
2 St. Petersburg 4.9 MM 3.4%
3 Novosibirsk 1.5 MM 1.0%
4 Samara 1.2 MM 0.8%
5 Kazan 1.1 MM 0.8%
6 Ufa 1.1 MM 0.7%
7 Krasnoyarsk 1.0 MM 0.7%
8 Krasnodar 0.7 MM 0.5%
9 Vladivostok 0.6 MM 0.4%
10 Khabarovsk 0.6 MM 0.4%
Other 11.7 MM 8.2%
Total 38.7 MM 27.0%
Note: Preliminary unadited KPIs as of June 2013 or for H1 2013, unless otherwise stated. (1) — Source: Financial due diligence report on Scartel / Yota, MegaFon analysis (2) — As of June 2013
KEY FINANCIALS(1) TOP 10 CITIES WHERE SERVICE IS LIVE(2) TOWNS COVERED BY LTE/4G ON AIR
Headings and Fonts
000
155
071
Chart Colours
192
192
192
122
098
166
000
110
038
213
234
192
000
155
071
33
Co
rpo
rate
an
d
Fin
an
cia
l Hig
hli
gh
ts
Q2
20
13
Fin
an
cia
l an
d
Op
era
tin
g R
esu
lts
Q2
20
13
Acq
uis
itio
n
of
Sca
rte
l/Y
ota
O
utl
oo
k
for
20
13
W
ha
t Is
M
eg
aFo
n
04 Acquisition of Scartel/Yota
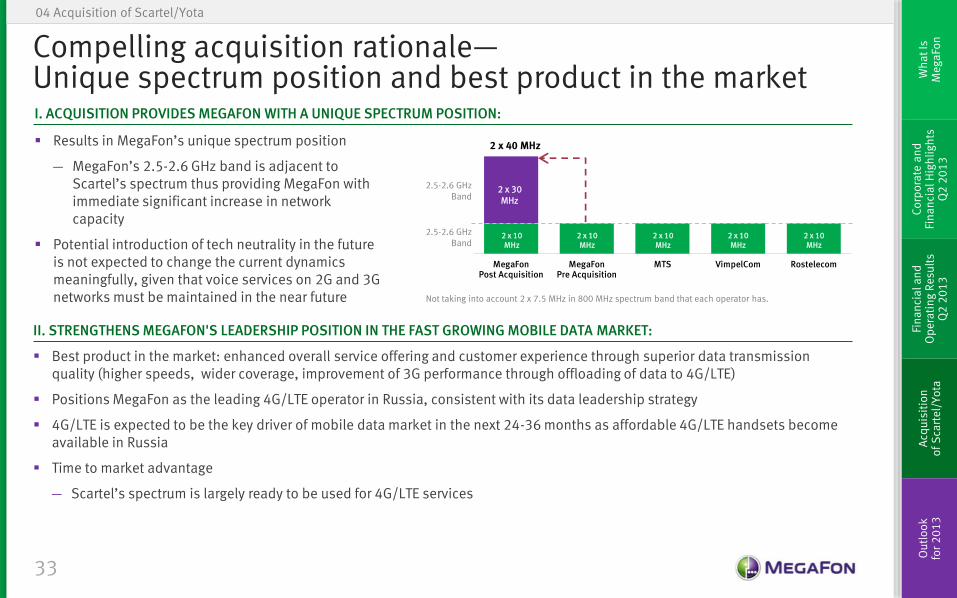
Compelling acquisition rationale— Unique spectrum position and best product in the market
Results in MegaFon’s unique spectrum position
― MegaFon’s 2.5-2.6 GHz band is adjacent to Scartel’s spectrum thus providing MegaFon with immediate significant increase in network capacity
Potential introduction of tech neutrality in the future is not expected to change the current dynamics meaningfully, given that voice services on 2G and 3G networks must be maintained in the near future
MegaFonPost Acquisition
MegaFonPre Acquisition
MTS VimpelCom Rostelecom
2 x 40 MHz
2.5-2.6 GHz Band
2.5-2.6 GHz Band
2 x 10 MHz
2 x 10 MHz
2 x 10 MHz
2 x 10 MHz
2 x 10 MHz
2 x 30 MHz
Not taking into account 2 x 7.5 MHz in 800 MHz spectrum band that each operator has.
II. STRENGTHENS MEGAFON'S LEADERSHIP POSITION IN THE FAST GROWING MOBILE DATA MARKET:
Best product in the market: enhanced overall service offering and customer experience through superior data transmission quality (higher speeds, wider coverage, improvement of 3G performance through offloading of data to 4G/LTE)
Positions MegaFon as the leading 4G/LTE operator in Russia, consistent with its data leadership strategy
4G/LTE is expected to be the key driver of mobile data market in the next 24-36 months as affordable 4G/LTE handsets become available in Russia
Time to market advantage
― Scartel’s spectrum is largely ready to be used for 4G/LTE services
I. ACQUISITION PROVIDES MEGAFON WITH A UNIQUE SPECTRUM POSITION:
Headings and Fonts
000
155
071
Chart Colours
192
192
192
122
098
166
000
110
038
213
234
192
000
155
071
34
Co
rpo
rate
an
d
Fin
an
cia
l Hig
hli
gh
ts
Q2
20
13
Fin
an
cia
l an
d
Op
era
tin
g R
esu
lts
Q2
20
13
Acq
uis
itio
n
of
Sca
rte
l/Y
ota
O
utl
oo
k
for
20
13
W
ha
t Is
M
eg
aFo
n
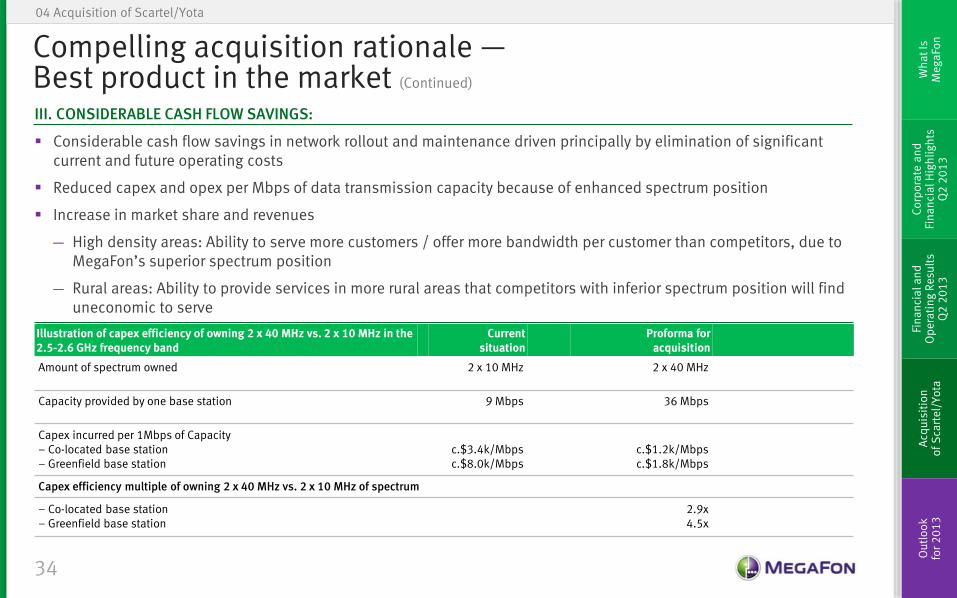
Illustration of capex efficiency of owning 2 x 40 MHz vs. 2 x 10 MHz in the 2.5-2.6 GHz frequency band
Current situation
Proforma for acquisition
Amount of spectrum owned 2 x 10 MHz 2 x 40 MHz
Capacity provided by one base station 9 Mbps 36 Mbps
Capex incurred per 1Mbps of Capacity – Co-located base station – Greenfield base station
c.$3.4k/Mbps c.$8.0k/Mbps
c.$1.2k/Mbps c.$1.8k/Mbps
Capex efficiency multiple of owning 2 x 40 MHz vs. 2 x 10 MHz of spectrum
– Co-located base station – Greenfield base station
2.9x 4.5x
04 Acquisition of Scartel/Yota
Compelling acquisition rationale — Best product in the market (Continued)
III. CONSIDERABLE CASH FLOW SAVINGS:
Considerable cash flow savings in network rollout and maintenance driven principally by elimination of significant current and future operating costs
Reduced capex and opex per Mbps of data transmission capacity because of enhanced spectrum position
Increase in market share and revenues
― High density areas: Ability to serve more customers / offer more bandwidth per customer than competitors, due to MegaFon’s superior spectrum position
― Rural areas: Ability to provide services in more rural areas that competitors with inferior spectrum position will find uneconomic to serve
Headings and Fonts
000
155
071
Chart Colours
192
192
192
122
098
166
000
110
038
213
234
192
000
155
071
35
Co
rpo
rate
an
d
Fin
an
cia
l Hig
hli
gh
ts
Q2
20
13
Fin
an
cia
l an
d
Op
era
tin
g R
esu
lts
Q2
20
13
Acq
uis
itio
n
of
Sca
rte
l/Y
ota
O
utl
oo
k
for
20
13
W
ha
t Is
M
eg
aFo
n
04 Acquisition of Scartel/Yota
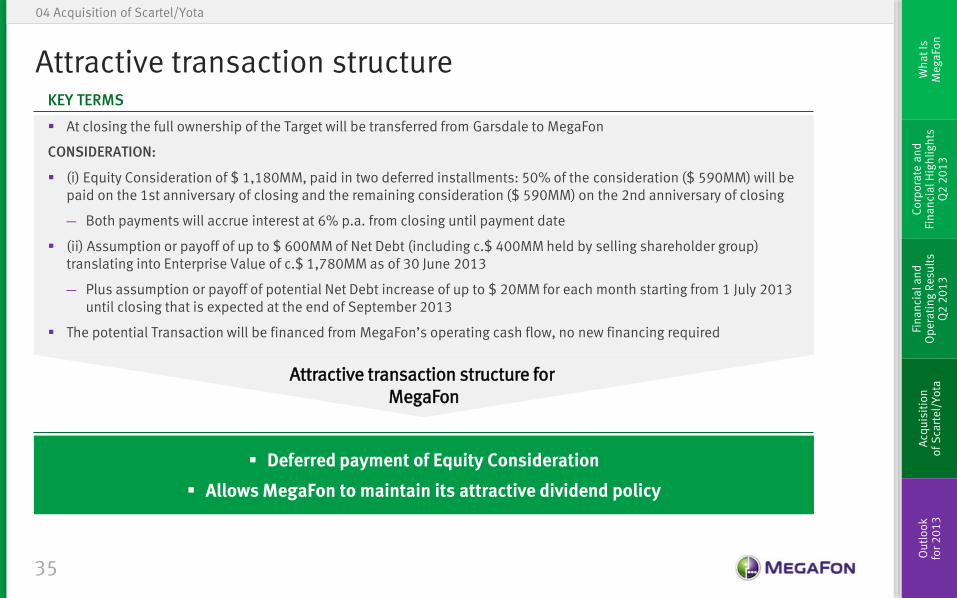
Attractive transaction structure KEY TERMS
At closing the full ownership of the Target will be transferred from Garsdale to MegaFon
CONSIDERATION:
(i) Equity Consideration of $ 1,180MM, paid in two deferred installments: 50% of the consideration ($ 590MM) will be paid on the 1st anniversary of closing and the remaining consideration ($ 590MM) on the 2nd anniversary of closing
― Both payments will accrue interest at 6% p.a. from closing until payment date
(ii) Assumption or payoff of up to $ 600MM of Net Debt (including c.$ 400MM held by selling shareholder group) translating into Enterprise Value of c.$ 1,780MM as of 30 June 2013
― Plus assumption or payoff of potential Net Debt increase of up to $ 20MM for each month starting from 1 July 2013 until closing that is expected at the end of September 2013
The potential Transaction will be financed from MegaFon’s operating cash flow, no new financing required
Deferred payment of Equity Consideration
Allows MegaFon to maintain its attractive dividend policy
Attractive transaction structure for MegaFon
Headings and Fonts
000
155
071
Chart Colours
192
192
192
122
098
166
000
110
038
213
234
192
000
155
071
36
Co
rpo
rate
an
d
Fin
an
cia
l Hig
hli
gh
ts
Q2
20
13
Fin
an
cia
l an
d
Op
era
tin
g R
esu
lts
Q2
20
13
Acq
uis
itio
n
of
Sca
rte
l/Y
ota
O
utl
oo
k
for
20
13
W
ha
t Is
M
eg
aFo
n
04 Acquisition of Scartel/Yota
Conclusion
Unique opportunity to acquire a stronghold in the 4G/LTE segment: “We buy the future, not the past”
Enhanced spectrum position provides MegaFon with long-term sustainable competitive advantage and best product offering for consumers
Acquisition is consistent with MegaFon’s data leadership strategy
Significant cash flow improvement that MegaFon can capitalise on going forward
Attractive transaction structure
No impact on MegaFon’s attractive dividend policy
Supported by majority of non-interested MegaFon shareholders

Headings and Fonts
000
155
071
Chart Colours
192
192
192
122
098
166
000
110
038
213
234
192
000
155
071
Co
rpo
rate
an
d
Fin
an
cia
l Hig
hli
gh
ts
Q2
20
13
Fin
an
cia
l an
d
Op
era
tin
g R
esu
lts
Q2
20
13
Acq
uis
itio
n
of
Sca
rte
l/Y
ota
O
utl
oo
k
for
20
13
W
ha
t Is
M
eg
aFo
n
Outlook for 2013 05
Headings and Fonts
000
155
071
Chart Colours
192
192
192
122
098
166
000
110
038
213
234
192
000
155
071
38
Co
rpo
rate
an
d
Fin
an
cia
l Hig
hli
gh
ts
Q2
20
13
Fin
an
cia
l an
d
Op
era
tin
g R
esu
lts
Q2
20
13
Acq
uis
itio
n
of
Sca
rte
l/Y
ota
O
utl
oo
k
for
20
13
W
ha
t Is
M
eg
aFo
n
05 Outlook for 2013
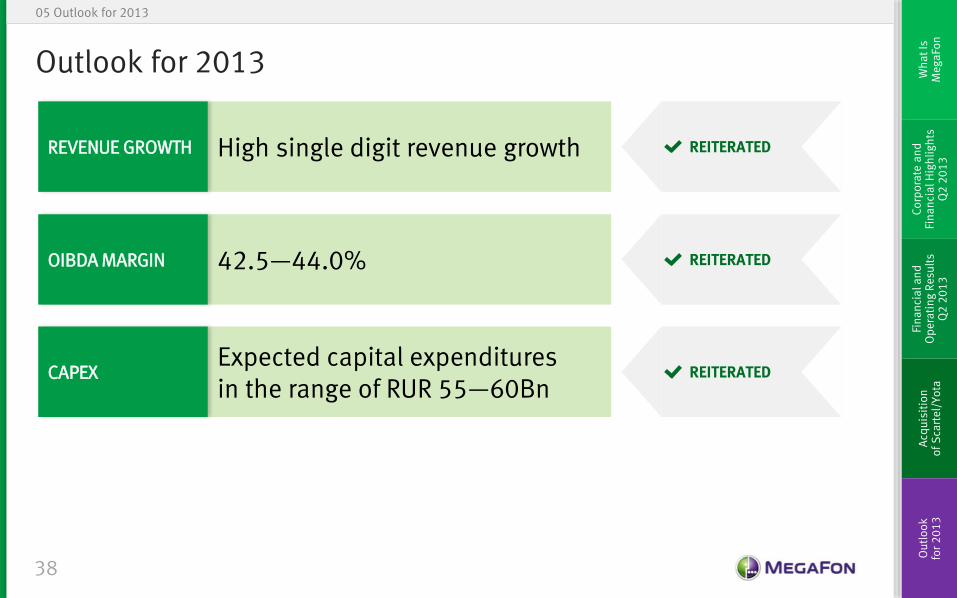
Outlook for 2013
High single digit revenue growth
42.5—44.0%
Expected capital expenditures in the range of RUR 55—60Bn
REVENUE GROWTH
OIBDA MARGIN
CAPEX
REITERATED
REITERATED
REITERATED

Headings and Fonts
000
155
071
Chart Colours
192
192
192
122
098
166
000
110
038
213
234
192
000
155
071
39

Headings and Fonts
000
155
071
Chart Colours
192
192
192
122
098
166
000
110
038
213
234
192
000
155
071
Contact Information MegaFon Investor Relations 30 Kadashevskaya embankment Moscow, 115035, Russia Tel.: +7 495 926 2012 Email: [email protected] Web: ir.megafon.com
For further information visit our IR website http://ir.megafon.com:


![IOFFE-LUT ACCELERATOR · 2019. 12. 26. · ПРЕЗЕНТАЦИЯ ИНВЕСТОРАМ [DemoDay] ЭТАПЫ РАБОТЫ АКСЕЛЕРАТОРА. постоянно. по запросу](https://img.pdfslide.us/doc/110x75/5fec9cd5169ba90a6a5fe214/ioffe-lut-accelerator-2019-12-26-oe.jpg)