Embed Size (px)
Citation preview
Investor PresentationJune 2010June 2010
1Enterprise ● Energy ● Endurance
Table of contents
1. Company Overview
2. Company Financials
3. Key Highlights
4 Company Highlights4. Company Highlights
2

Section 1:Company Overview
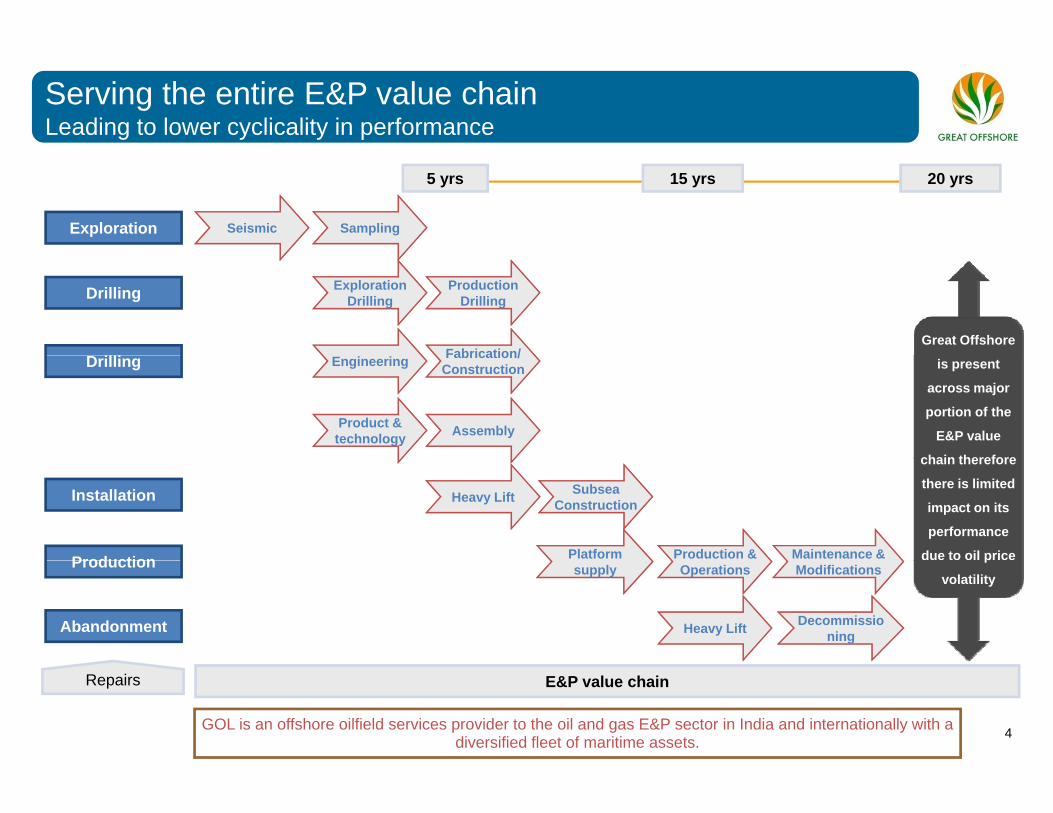
Serving the entire E&P value chainLeading to lower cyclicality in performance
5 yrs 15 yrs 20 yrs
Seismic SamplingExploration
Great Offshore
Exploration Drilling
Production Drilling
Fabrication/
Drilling
is present
across major
portion of the
E&P value
chain therefore
Engineering Fabrication/Construction
Product & technology Assembly
Drilling
chain therefore
there is limited
impact on its
performance
due to oil price
Heavy Lift Subsea ConstructionInstallation
Platform Production & Production & Maintenance & Production p
volatilitysupply Operations Modifications
Heavy Lift Decommissioning
Production
Abandonment
4
E&P value chainRepairs
GOL is an offshore oilfield services provider to the oil and gas E&P sector in India and internationally with a diversified fleet of maritime assets.
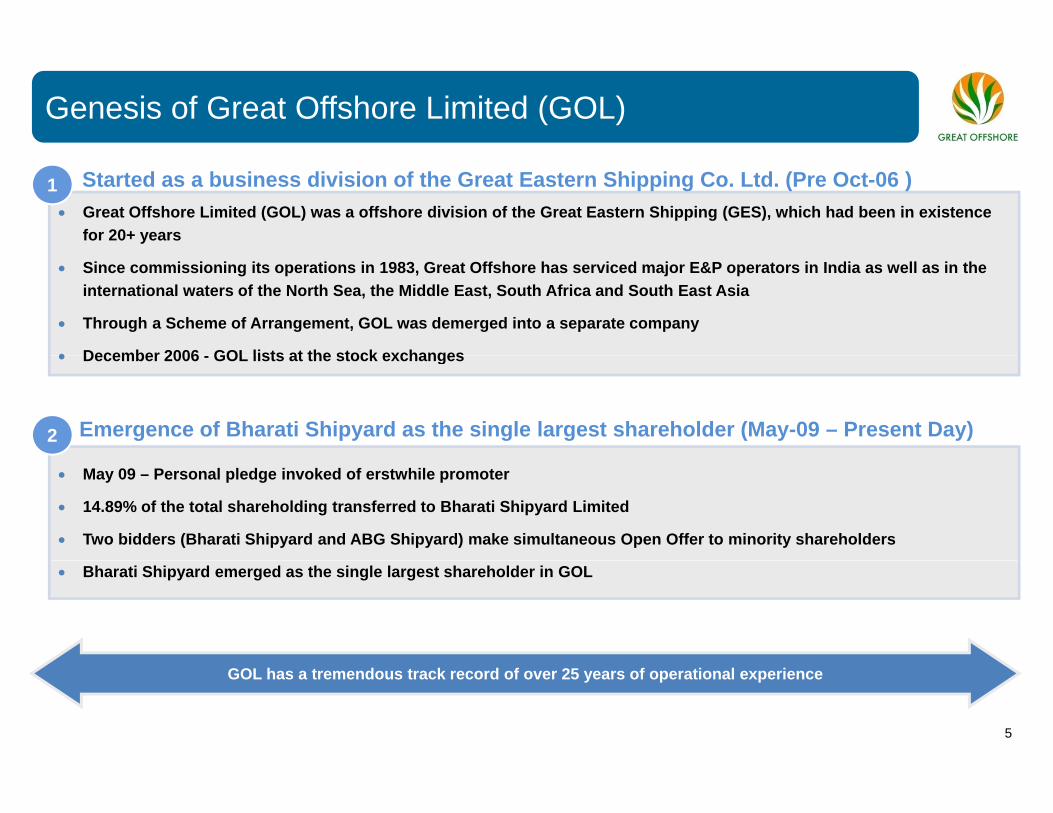
Genesis of Great Offshore Limited (GOL)
• Great Offshore Limited (GOL) was a offshore division of the Great Eastern Shipping (GES), which had been in existence for 20+ years
Started as a business division of the Great Eastern Shipping Co. Ltd. (Pre Oct-06 )1
• Since commissioning its operations in 1983, Great Offshore has serviced major E&P operators in India as well as in the international waters of the North Sea, the Middle East, South Africa and South East Asia
• Through a Scheme of Arrangement, GOL was demerged into a separate company
• December 2006 GOL lists at the stock exchanges• December 2006 - GOL lists at the stock exchanges
2 Emergence of Bharati Shipyard as the single largest shareholder (May-09 – Present Day)
• May 09 – Personal pledge invoked of erstwhile promoter
• 14.89% of the total shareholding transferred to Bharati Shipyard Limited
• Two bidders (Bharati Shipyard and ABG Shipyard) make simultaneous Open Offer to minority shareholders
• Bharati Shipyard emerged as the single largest shareholder in GOL
5
GOL has a tremendous track record of over 25 years of operational experience
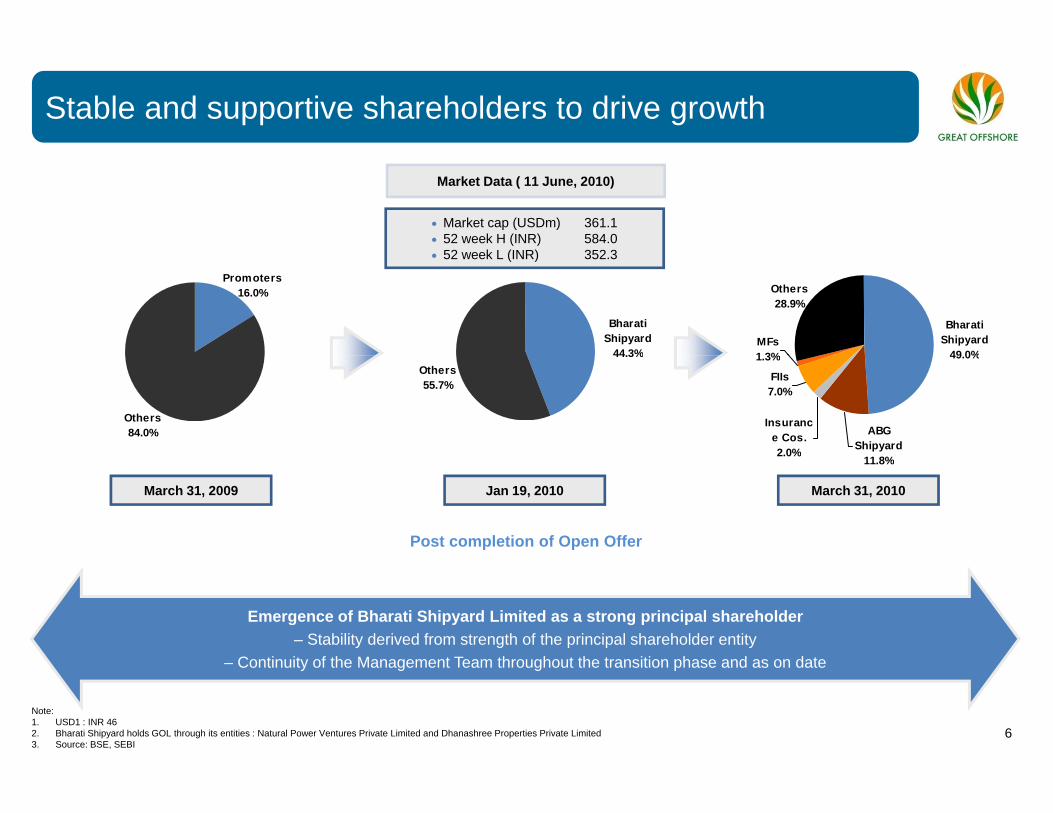
Stable and supportive shareholders to drive growth
• Market cap (USDm) 361.1• 52 week H (INR) 584.0
52 week L (INR) 352 3
Market Data ( 11 June, 2010)
Promoters16.0%
BharatiShipyard
44.3%
• 52 week L (INR) 352.3
MFs1 3%
Others28.9%
Bharati Shipyard
49 0%
Others84.0%
44.3%Others55.7%
FIIs7.0%
1.3%
Insurance Cos.2.0%
49.0%
ABG Shipyard
11 8%
March 31, 2009 Jan 19, 2010
11.8%
March 31, 2010
Post completion of Open Offer
Emergence of Bharati Shipyard Limited as a strong principal shareholder– Stability derived from strength of the principal shareholder entity
– Continuity of the Management Team throughout the transition phase and as on date
6
Note:1. USD1 : INR 462. Bharati Shipyard holds GOL through its entities : Natural Power Ventures Private Limited and Dhanashree Properties Private Limited3. Source: BSE, SEBI
– Continuity of the Management Team throughout the transition phase and as on date
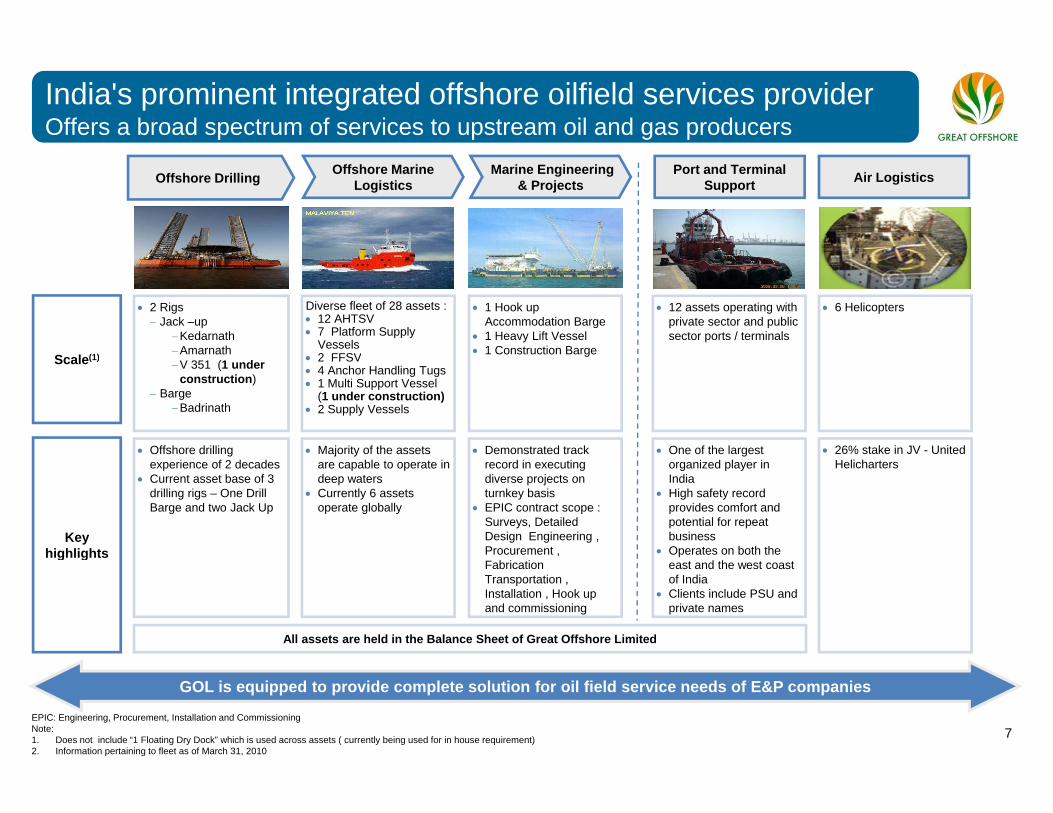
India's prominent integrated offshore oilfield services providerOffers a broad spectrum of services to upstream oil and gas producers
Offshore Drilling Marine Engineering & Projects
Offshore Marine Logistics
Port and Terminal Support Air Logistics
• 2 Rigs− Jack –up
−Kedarnath−Amarnath
Diverse fleet of 28 assets :• 12 AHTSV• 7 Platform Supply
Vessels2 FFSVS l (1)
• 1 Hook up Accommodation Barge
• 1 Heavy Lift Vessel• 1 Construction Barge
• 12 assets operating with private sector and public sector ports / terminals
• 6 Helicopters
−V 351 (1 under construction)
− Barge−Badrinath
• 2 FFSV• 4 Anchor Handling Tugs • 1 Multi Support Vessel
(1 under construction)• 2 Supply Vessels
Scale(1) g
• Offshore drilling • Demonstrated track • One of the largest • Majority of the assets • 26% stake in JV - United experience of 2 decades
• Current asset base of 3 drilling rigs – One Drill Barge and two Jack Up
record in executing diverse projects on turnkey basis
• EPIC contract scope : Surveys, Detailed Design Engineering , Procurement , F b i i
organized player in India
• High safety record provides comfort and potential for repeat business
• Operates on both the d h
Key highlights
are capable to operate in deep waters
• Currently 6 assets operate globally
Helicharters
Fabrication Transportation , Installation , Hook up and commissioning
east and the west coast of India
• Clients include PSU and private names
g g
All assets are held in the Balance Sheet of Great Offshore Limited
7EPIC: Engineering, Procurement, Installation and Commissioning Note:1. Does not include “1 Floating Dry Dock” which is used across assets ( currently being used for in house requirement)2. Information pertaining to fleet as of March 31, 2010
GOL is equipped to provide complete solution for oil field service needs of E&P companies
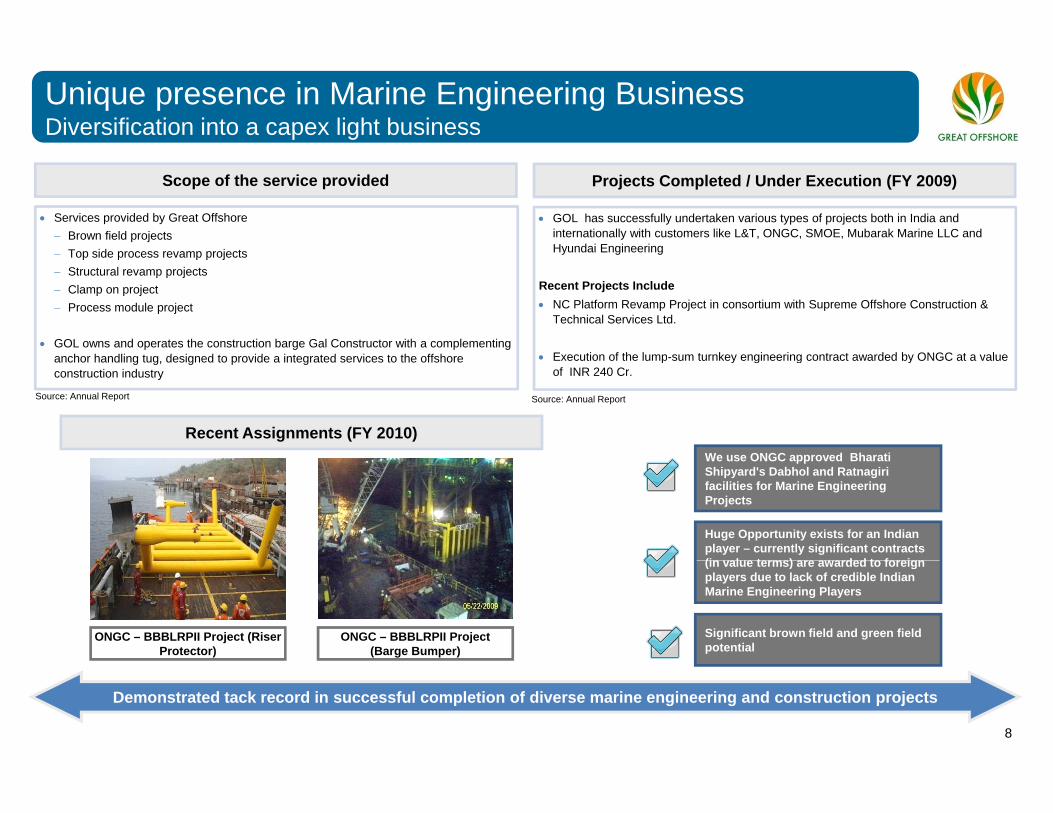
Unique presence in Marine Engineering BusinessDiversification into a capex light business
• Services provided by Great Offshore− Brown field projects
Top side process revamp projects
Scope of the service provided Projects Completed / Under Execution (FY 2009)
• GOL has successfully undertaken various types of projects both in India and internationally with customers like L&T, ONGC, SMOE, Mubarak Marine LLC and Hyundai Engineering− Top side process revamp projects
− Structural revamp projects− Clamp on project− Process module project
• GOL owns and operates the construction barge Gal Constructor with a complementing h h dli t d i d t id i t t d i t th ff h
y g g
Recent Projects Include• NC Platform Revamp Project in consortium with Supreme Offshore Construction &
Technical Services Ltd.
• Execution of the lump sum turnkey engineering contract awarded by ONGC at a valueanchor handling tug, designed to provide a integrated services to the offshore construction industry
Recent Assignments (FY 2010)
• Execution of the lump-sum turnkey engineering contract awarded by ONGC at a value of INR 240 Cr.
Source: Annual Report Source: Annual Report
We use ONGC approved BharatiWe use ONGC approved Bharati Shipyard's Dabhol and Ratnagiri facilities for Marine Engineering Projects
Huge Opportunity exists for an Indian player – currently significant contracts (in value terms) are awarded to foreign
ONGC – BBBLRPII Project (Riser Protector)
ONGC – BBBLRPII Project (Barge Bumper)
(in value terms) are awarded to foreign players due to lack of credible Indian Marine Engineering Players
Significant brown field and green field potential
8
Demonstrated tack record in successful completion of diverse marine engineering and construction projects
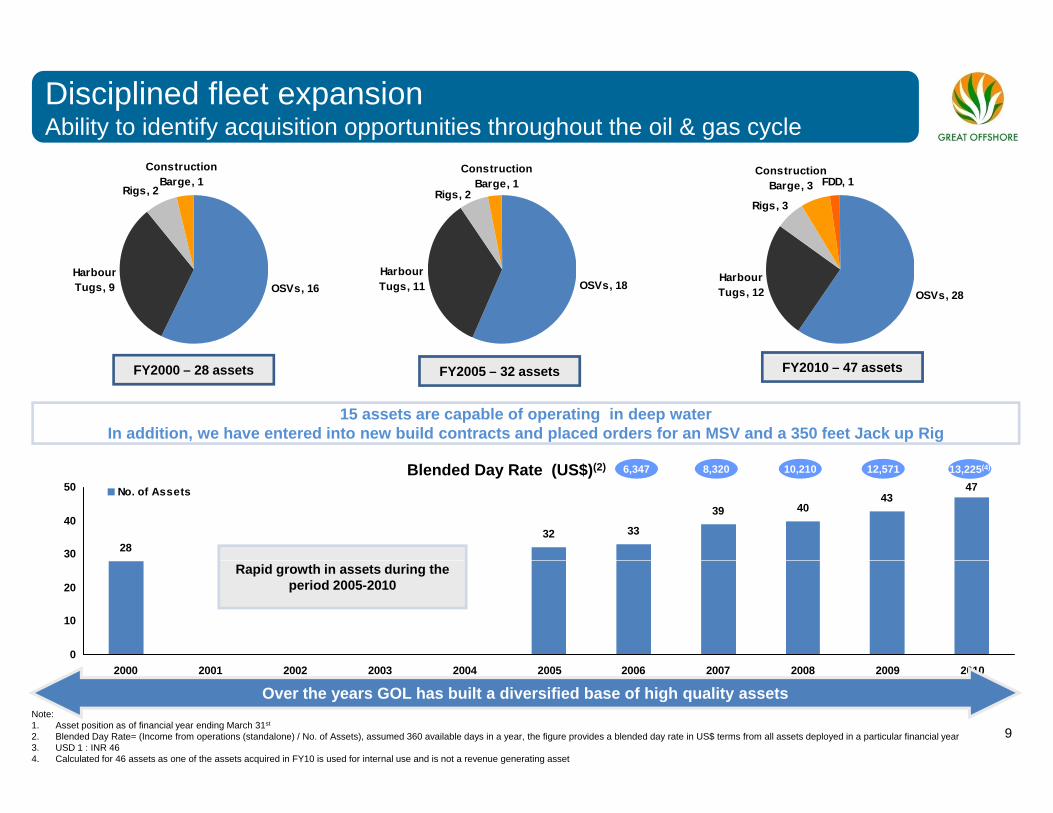
Disciplined fleet expansion Ability to identify acquisition opportunities throughout the oil & gas cycle
Rigs, 2
ConstructionBarge, 1
ConstructionBarge, 1
Rigs, 2
ConstructionBarge, 3 FDD, 1
Rigs, 3
OSVs, 16HarbourTugs, 9 OSVs, 18
HarbourTugs, 11
OSVs, 28HarbourTugs, 12
FY2000 – 28 assets FY2005 – 32 assets FY2010 – 47 assets
15 assets are capable of operating in deep waterIn addition, we have entered into new build contracts and placed orders for an MSV and a 350 feet Jack up Rig
2832 33
39 4043
47
30
40
50 No. of Assets
Blended Day Rate (US$)(2) 12,57110,2108,3206,347 13,225(4)
0
10
20Rapid growth in assets during the
period 2005-2010
9
2000 2001 2002 2003 2004 2005 2006 2007 2008 2009 2010
Over the years GOL has built a diversified base of high quality assetsNote:1. Asset position as of financial year ending March 31st
2. Blended Day Rate= (Income from operations (standalone) / No. of Assets), assumed 360 available days in a year, the figure provides a blended day rate in US$ terms from all assets deployed in a particular financial year3. USD 1 : INR 464. Calculated for 46 assets as one of the assets acquired in FY10 is used for internal use and is not a revenue generating asset
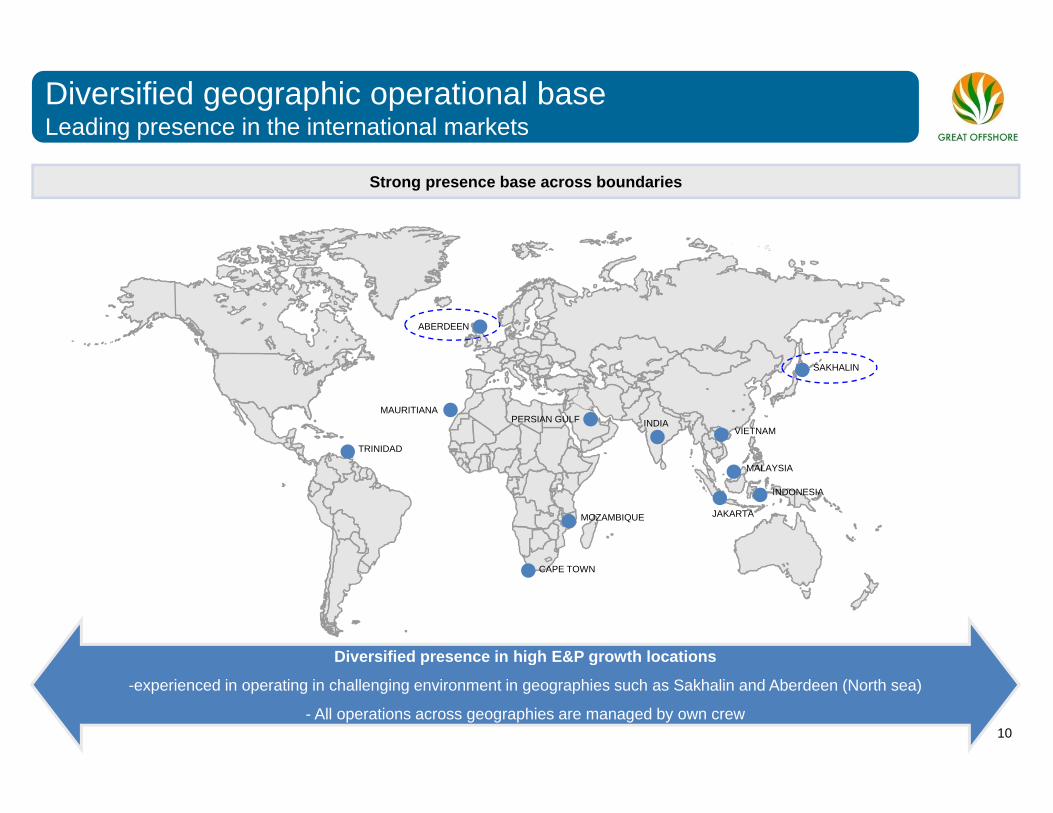
Diversified geographic operational baseLeading presence in the international markets
Strong presence base across boundaries
ABERDEEN
VIETNAMINDIAPERSIAN GULF
TRINIDAD
MAURITIANA
SAKHALIN
MALAYSIA
JAKARTAMOZAMBIQUE
INDONESIA
Diversified presence in high E&P growth locations
CAPE TOWN
10
p g g
-experienced in operating in challenging environment in geographies such as Sakhalin and Aberdeen (North sea)
- All operations across geographies are managed by own crew
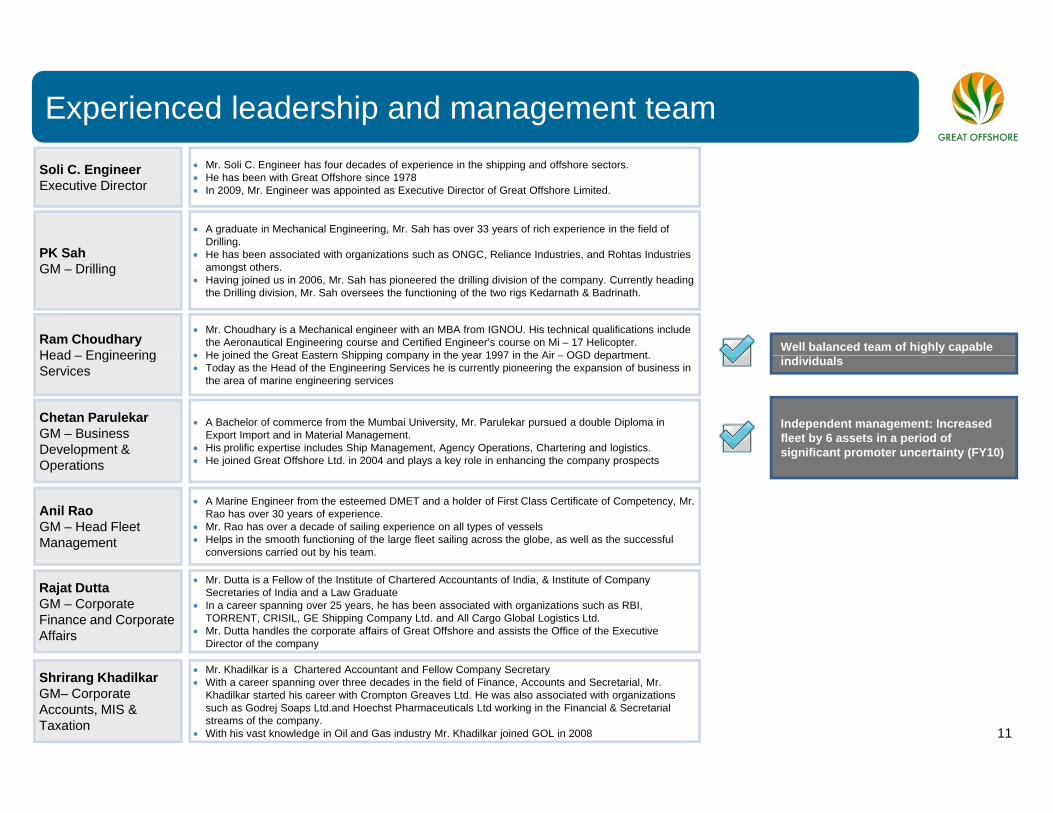
Experienced leadership and management team
PK Sah
• A graduate in Mechanical Engineering, Mr. Sah has over 33 years of rich experience in the field of Drilling. He has been associated with organizations such as ONGC Reliance Industries and Rohtas Industries
Soli C. Engineer Executive Director
• Mr. Soli C. Engineer has four decades of experience in the shipping and offshore sectors. • He has been with Great Offshore since 1978• In 2009, Mr. Engineer was appointed as Executive Director of Great Offshore Limited.
PK SahGM – Drilling
• He has been associated with organizations such as ONGC, Reliance Industries, and Rohtas Industries amongst others.
• Having joined us in 2006, Mr. Sah has pioneered the drilling division of the company. Currently heading the Drilling division, Mr. Sah oversees the functioning of the two rigs Kedarnath & Badrinath.
Ram Choudhary Head Engineering
• Mr. Choudhary is a Mechanical engineer with an MBA from IGNOU. His technical qualifications include the Aeronautical Engineering course and Certified Engineer’s course on Mi – 17 Helicopter.
• He joined the Great Eastern Shipping company in the year 1997 in the Air – OGD departmentWell balanced team of highly capable Head – Engineering
Services • He joined the Great Eastern Shipping company in the year 1997 in the Air – OGD department. • Today as the Head of the Engineering Services he is currently pioneering the expansion of business in
the area of marine engineering services
Chetan Parulekar GM – Business Development &
• A Bachelor of commerce from the Mumbai University, Mr. Parulekar pursued a double Diploma in Export Import and in Material Management.
• His prolific expertise includes Ship Management, Agency Operations, Chartering and logistics. H j i d G t Off h Ltd i 2004 d l k l i h i th t
individuals
Independent management: Increased fleet by 6 assets in a period of significant promoter uncertainty (FY10)
Operations • He joined Great Offshore Ltd. in 2004 and plays a key role in enhancing the company prospects
Anil Rao GM – Head Fleet Management
• A Marine Engineer from the esteemed DMET and a holder of First Class Certificate of Competency, Mr. Rao has over 30 years of experience.
• Mr. Rao has over a decade of sailing experience on all types of vessels• Helps in the smooth functioning of the large fleet sailing across the globe, as well as the successful
conversions carried out by his team.
g p y ( )
Rajat Dutta GM – Corporate Finance and Corporate Affairs
• Mr. Dutta is a Fellow of the Institute of Chartered Accountants of India, & Institute of Company Secretaries of India and a Law Graduate
• In a career spanning over 25 years, he has been associated with organizations such as RBI, TORRENT, CRISIL, GE Shipping Company Ltd. and All Cargo Global Logistics Ltd.
• Mr. Dutta handles the corporate affairs of Great Offshore and assists the Office of the Executive Director of the company
11
Shrirang KhadilkarGM– Corporate Accounts, MIS & Taxation
• Mr. Khadilkar is a Chartered Accountant and Fellow Company Secretary• With a career spanning over three decades in the field of Finance, Accounts and Secretarial, Mr.
Khadilkar started his career with Crompton Greaves Ltd. He was also associated with organizations such as Godrej Soaps Ltd.and Hoechst Pharmaceuticals Ltd working in the Financial & Secretarial streams of the company.
• With his vast knowledge in Oil and Gas industry Mr. Khadilkar joined GOL in 2008
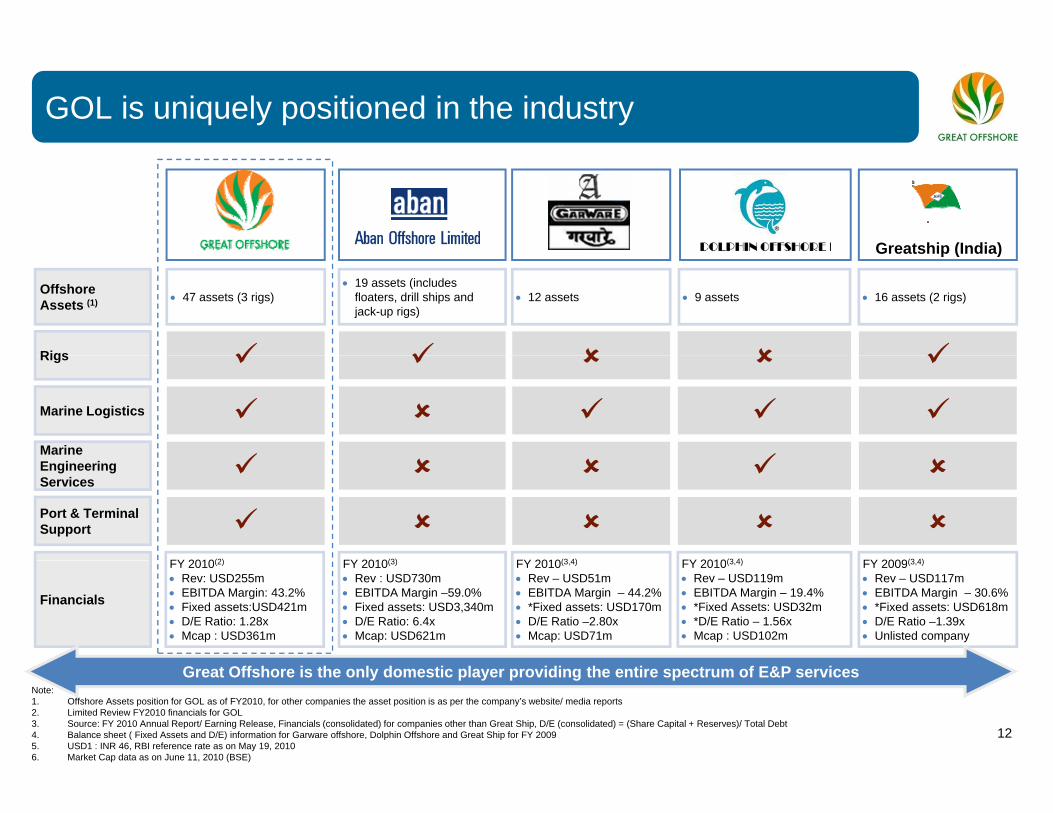
GOL is uniquely positioned in the industry
Great Offshore Great Offshore Great Offshore Great Offshore Great Offshore
Greatship (India)Greatship (India)
Offshore Assets (1) • 47 assets (3 rigs)
• 19 assets (includes floaters, drill ships and jack-up rigs)
• 12 assets • 16 assets (2 rigs)
Rigs
• 9 assets
Rigs
Marine
Marine Logistics
Engineering Services
Port & Terminal Support
FY 2010(2) FY 2010(3) FY 2010(3 4) FY 2010(3 4) FY 2009(3 4)
Financials
FY 2010(2)
• Rev: USD255m• EBITDA Margin: 43.2%• Fixed assets:USD421m• D/E Ratio: 1.28x• Mcap : USD361m
FY 2010(3)
• Rev : USD730m• EBITDA Margin –59.0%• Fixed assets: USD3,340m• D/E Ratio: 6.4x• Mcap: USD621m
FY 2010(3,4)
• Rev – USD51m• EBITDA Margin – 44.2%• *Fixed assets: USD170m• D/E Ratio –2.80x• Mcap: USD71m
FY 2010(3,4)
• Rev – USD119m• EBITDA Margin – 19.4%• *Fixed Assets: USD32m• *D/E Ratio – 1.56x• Mcap : USD102m
FY 2009(3,4)
• Rev – USD117m• EBITDA Margin – 30.6%• *Fixed assets: USD618m• D/E Ratio –1.39x• Unlisted company
12
Note:1. Offshore Assets position for GOL as of FY2010, for other companies the asset position is as per the company’s website/ media reports2. Limited Review FY2010 financials for GOL3. Source: FY 2010 Annual Report/ Earning Release, Financials (consolidated) for companies other than Great Ship, D/E (consolidated) = (Share Capital + Reserves)/ Total Debt4. Balance sheet ( Fixed Assets and D/E) information for Garware offshore, Dolphin Offshore and Great Ship for FY 20095. USD1 : INR 46, RBI reference rate as on May 19, 20106. Market Cap data as on June 11, 2010 (BSE)
Great Offshore is the only domestic player providing the entire spectrum of E&P services

Section 2:Company Financials
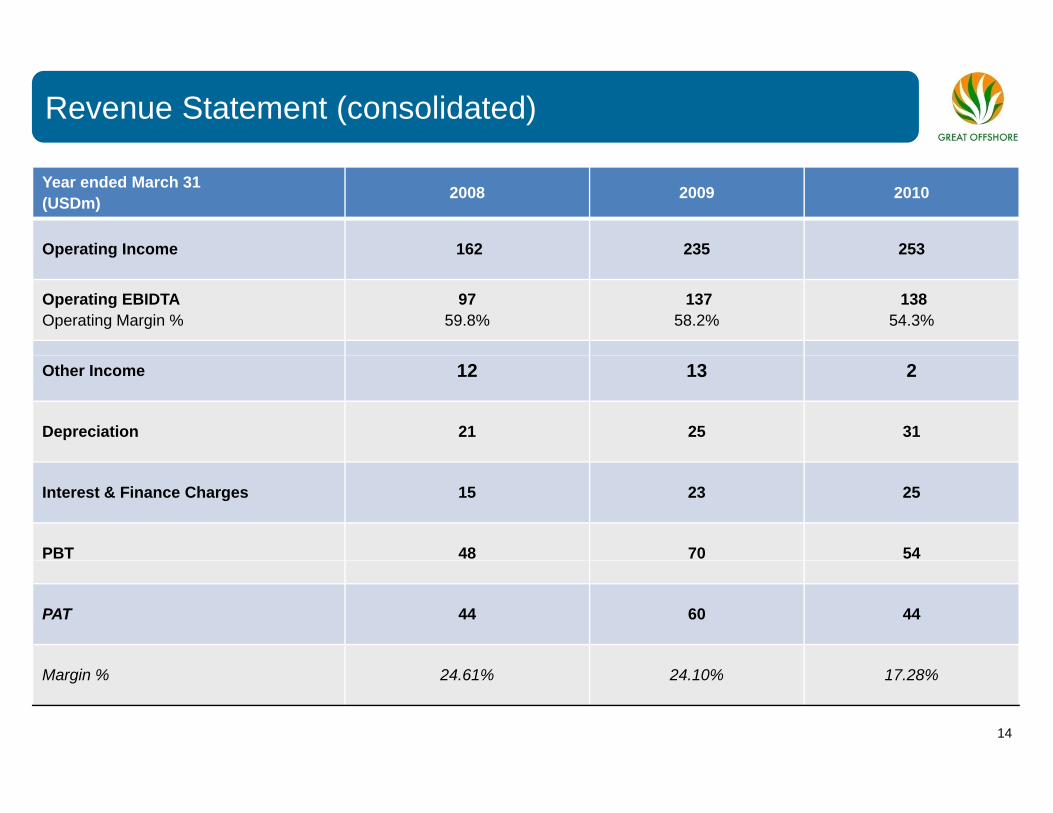
Revenue Statement (consolidated)
Year ended March 31(USDm) 2008 2009 2010
Operating Income 162 235 253Operating Income 162 235 253
Operating EBIDTAOperating Margin %
97 59.8%
137 58.2%
138 54.3%
Other Income 12 13 2
Depreciation 21 25 31
Interest & Finance Charges 15 23 25
PBT 48 70 54
PAT 44 60 44
14
Margin % 24.61% 24.10% 17.28%
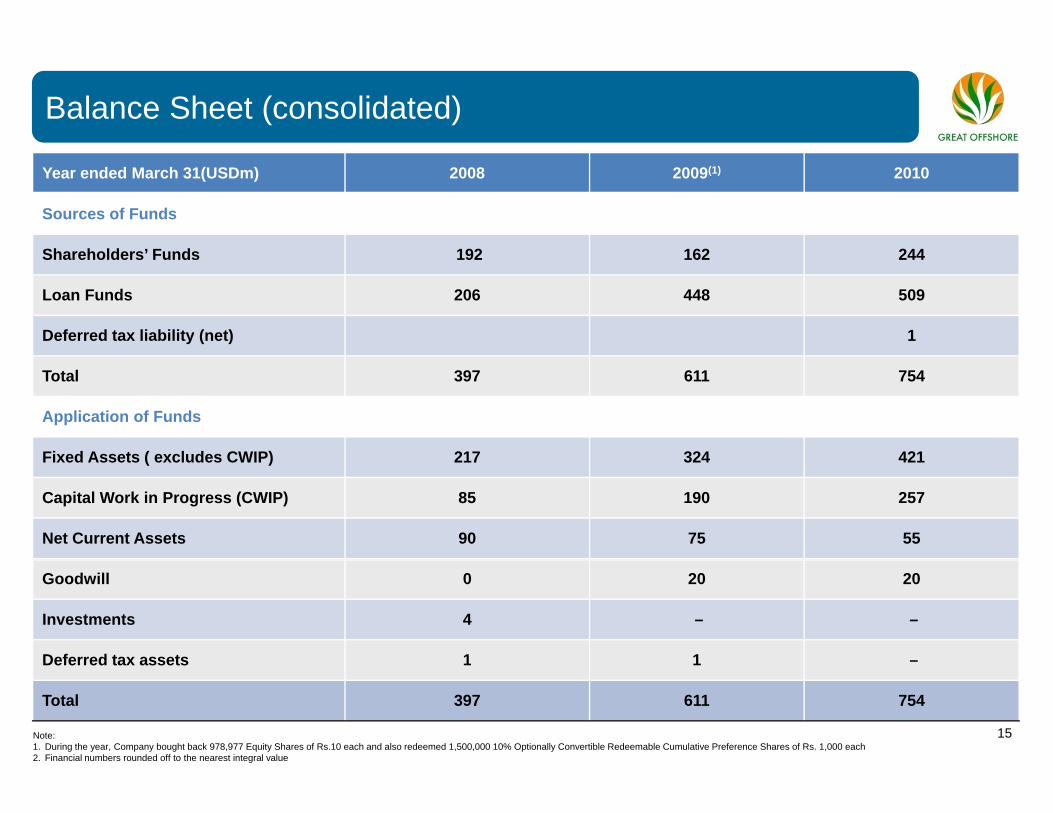
Balance Sheet (consolidated)
Year ended March 31(USDm) 2008 2009(1) 2010
Sources of Funds
Shareholders’ Funds 192 162 244Shareholders’ Funds 192 162 244
Loan Funds 206 448 509
Deferred tax liability (net) 1
Total 397 611 754
Application of Funds
Fixed Assets ( excludes CWIP) 217 324 421Fixed Assets ( excludes CWIP) 217 324 421
Capital Work in Progress (CWIP) 85 190 257
Net Current Assets 90 75 55
Goodwill 0 20 20
Investments 4 – –
Deferred tax assets 1 1 –
15
Deferred tax assets 1 1
Total 397 611 754
Note:1. During the year, Company bought back 978,977 Equity Shares of Rs.10 each and also redeemed 1,500,000 10% Optionally Convertible Redeemable Cumulative Preference Shares of Rs. 1,000 each2. Financial numbers rounded off to the nearest integral value
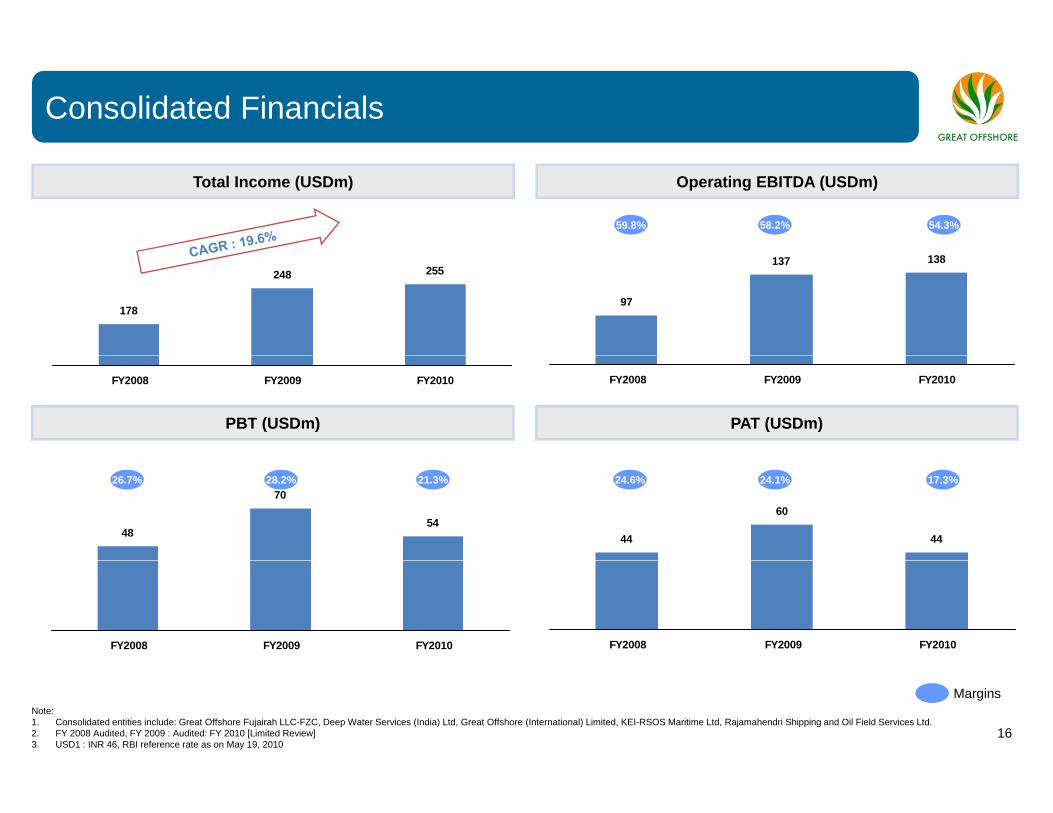
Consolidated Financials
59.8% 58.2% 54.3%
Total Income (USDm) Operating EBITDA (USDm)
178
248 255
97
137 138
FY2008 FY2009 FY2010 FY2008 FY2009 FY2010
PBT (USDm) PAT (USDm)
48
70
5444
60
44
26.7% 28.2% 21.3% 24.6% 24.1% 17.3%
FY2008 FY2009 FY2010 FY2008 FY2009 FY2010
16
MarginsNote:1. Consolidated entities include: Great Offshore Fujairah LLC-FZC, Deep Water Services (India) Ltd, Great Offshore (International) Limited, KEI-RSOS Maritime Ltd, Rajamahendri Shipping and Oil Field Services Ltd.2. FY 2008 Audited, FY 2009 : Audited: FY 2010 [Limited Review]3. USD1 : INR 46, RBI reference rate as on May 19, 2010
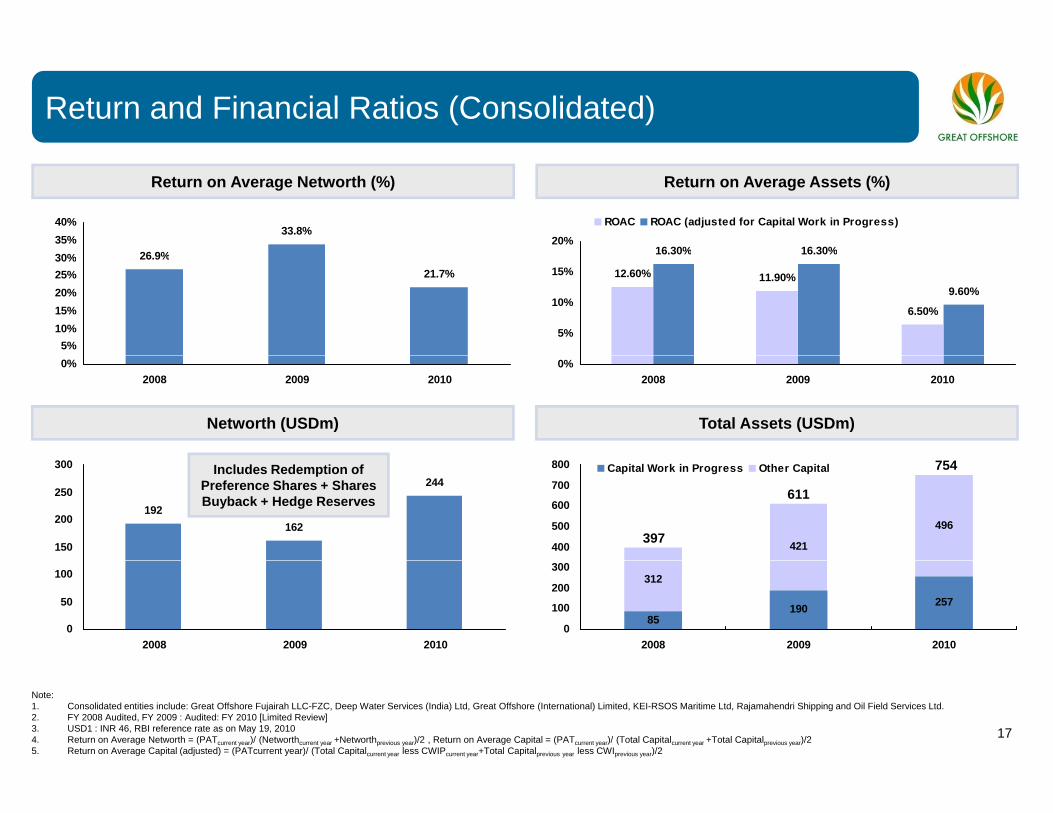
Return and Financial Ratios (Consolidated)
26 9%
33.8%35%40%
16.30% 16.30%20%
ROAC ROAC (adjusted for Capital Work in Progress)
Return on Average Networth (%) Return on Average Assets (%)
26.9%21.7%
5%10%15%20%25%30%
12.60% 11.90%
6.50%
16.30% 16.30%
9.60%
5%
10%
15%
0%2008 2009 2010
0%2008 2009 2010
Networth (USDm) Total Assets (USDm)
192162
244
150
200
250
300
421
496
400
500
600
700
800 Capital Work in Progress Other CapitalIncludes Redemption of Preference Shares + Shares Buyback + Hedge Reserves
397
611
754
0
50
100
2008 2009 2010
85190 257
312
0
100
200
300
2008 2009 2010
17
Note:1. Consolidated entities include: Great Offshore Fujairah LLC-FZC, Deep Water Services (India) Ltd, Great Offshore (International) Limited, KEI-RSOS Maritime Ltd, Rajamahendri Shipping and Oil Field Services Ltd.2. FY 2008 Audited, FY 2009 : Audited: FY 2010 [Limited Review]3. USD1 : INR 46, RBI reference rate as on May 19, 20104. Return on Average Networth = (PATcurrent year)/ (Networthcurrent year +Networthprevious year)/2 , Return on Average Capital = (PATcurrent year)/ (Total Capitalcurrent year +Total Capitalprevious year)/2 5. Return on Average Capital (adjusted) = (PATcurrent year)/ (Total Capitalcurrent year less CWIPcurrent year+Total Capitalprevious year less CWIprevious year)/2

Section 3:Industry Highlights
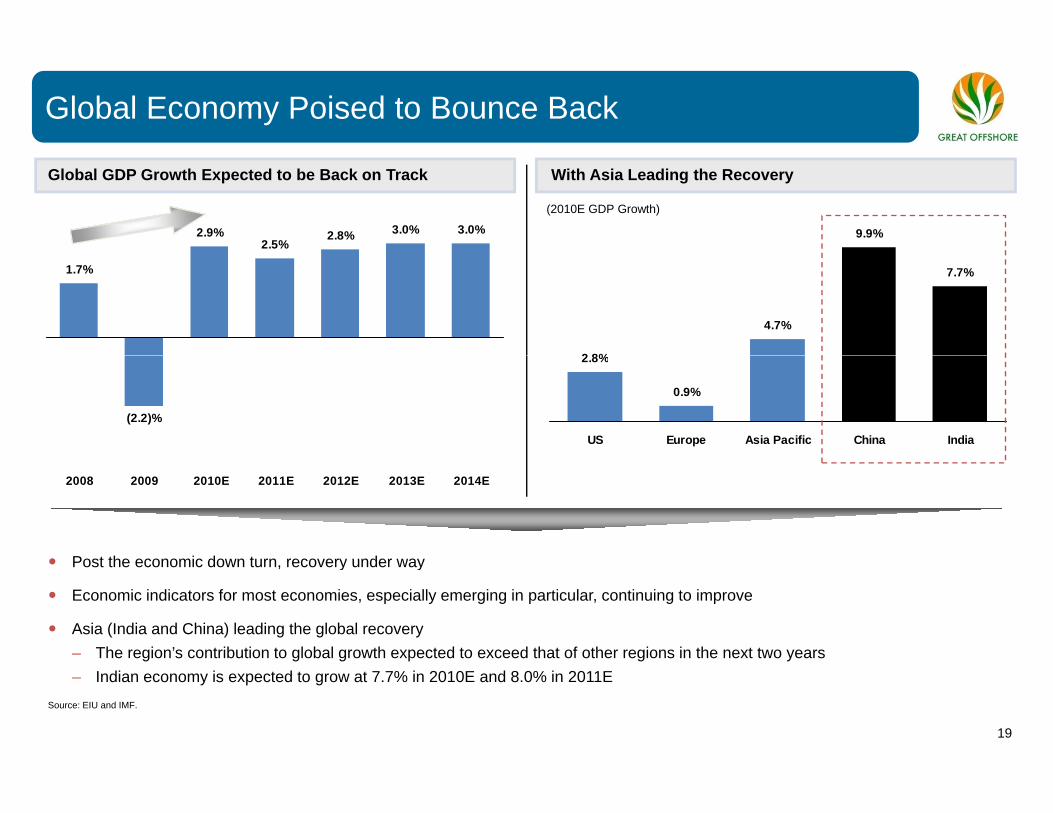
Global Economy Poised to Bounce Back
Global GDP Growth Expected to be Back on Track With Asia Leading the Recovery
2.9%2.5%
2.8% 3.0% 3.0% 9.9%
(2010E GDP Growth)
1.7%
2 8%
4.7%
7.7%
(2.2)%
2.8%
0.9%
US Europe Asia Pacific China India
Post the economic down turn recovery under way
2008 2009 2010E 2011E 2012E 2013E 2014E
Post the economic down turn, recovery under way
Economic indicators for most economies, especially emerging in particular, continuing to improve
Asia (India and China) leading the global recovery– The region’s contribution to global growth expected to exceed that of other regions in the next two years
19
Source: EIU and IMF.
– Indian economy is expected to grow at 7.7% in 2010E and 8.0% in 2011E
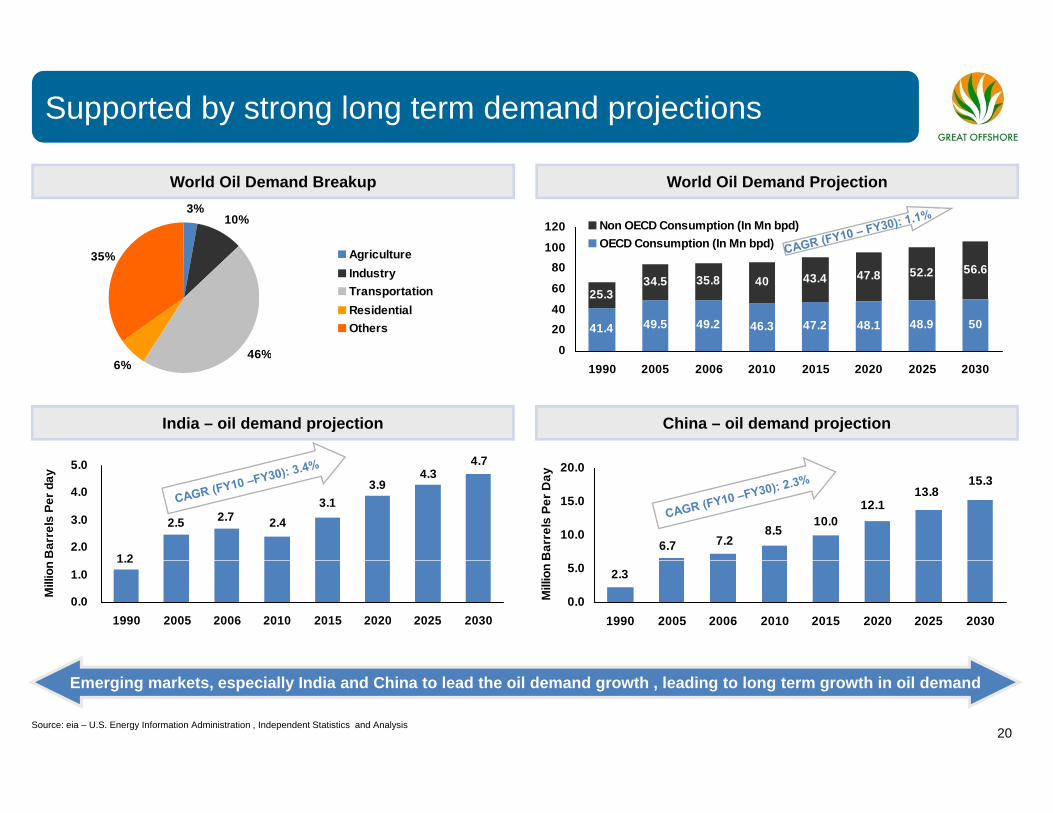
Supported by strong long term demand projections
100
120 Non OECD Consumption (In Mn bpd)OECD Consumption (In Mn bpd)
3%10%
35% Agriculture
World Oil Demand Breakup World Oil Demand Projection
41.4 49.5 49.2 46.3 47.2 48.1 48.9 50
25.334.5 35.8 40 43.4 47.8 52.2 56.6
0
2040
60
80
46%
35% AgricultureIndustryTransportationResidentialOthers
1990 2005 2006 2010 2015 2020 2025 2030
4 7
46%6%
Transportation accounts for a sizeable chunk of the demandIndia – oil demand projection China – oil demand projection
4.74.3
3.93.1
2.42.72.5
1 22.0
3.0
4.0
5.0
Bar
rels
Per
day 15.3
13.812.1
10.08.5
7.26.710.0
15.0
20.0
Bar
rels
Per
Day
1.2
0.0
1.0
1990 2005 2006 2010 2015 2020 2025 2030
Mill
ion
2.3
0.0
5.0
1990 2005 2006 2010 2015 2020 2025 2030
Mill
ion
20
Emerging markets, especially India and China to lead the oil demand growth , leading to long term growth in oil demand
Source: eia – U.S. Energy Information Administration , Independent Statistics and Analysis
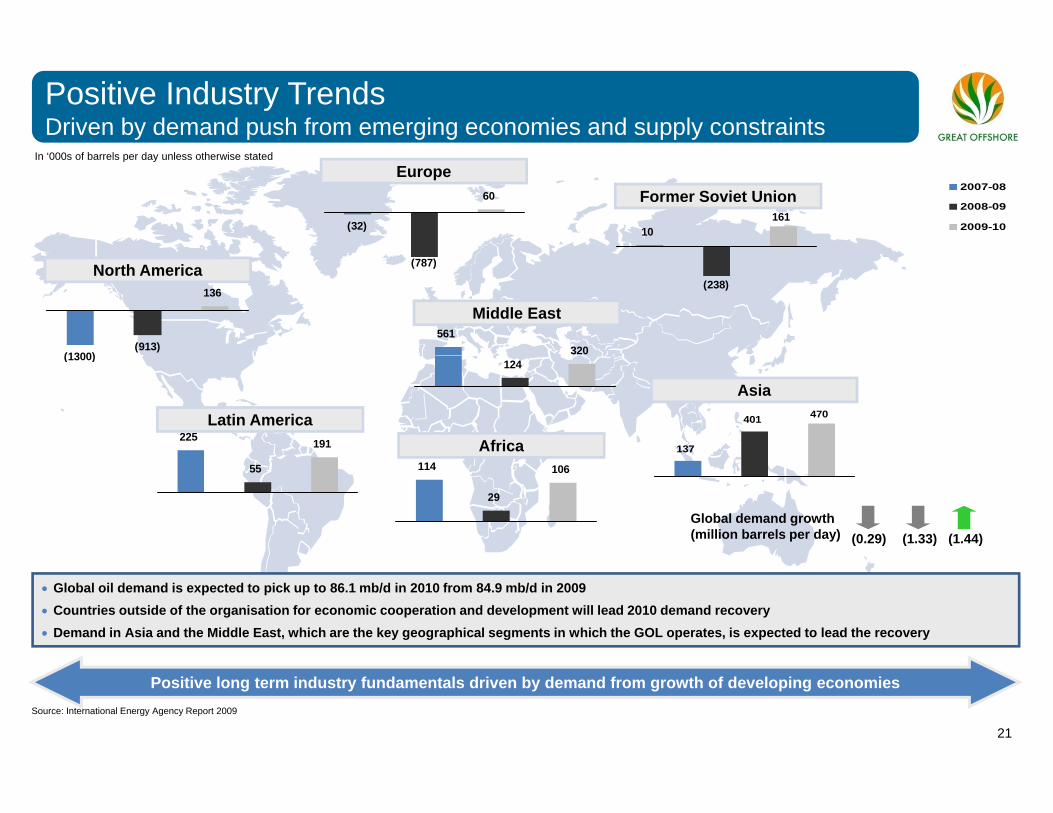
Positive Industry TrendsDriven by demand push from emerging economies and supply constraints
(32)
60
Europe
10161
Former Soviet Union2007-08
2008-09
2009-10
In ‘000s of barrels per day unless otherwise stated
(1300)(913)
136
North America (787)
(238)
561320
Middle East
(1300)
225 191
Latin AmericaAfrica
124
137
401 470
Asia
55 114
29
106
Global demand growth(million barrels per day) (0.29) (1.33) (1.44)
• Global oil demand is expected to pick up to 86.1 mb/d in 2010 from 84.9 mb/d in 2009• Countries outside of the organisation for economic cooperation and development will lead 2010 demand recovery• Demand in Asia and the Middle East, which are the key geographical segments in which the GOL operates, is expected to lead the recovery
21
Source: International Energy Agency Report 2009
Positive long term industry fundamentals driven by demand from growth of developing economies
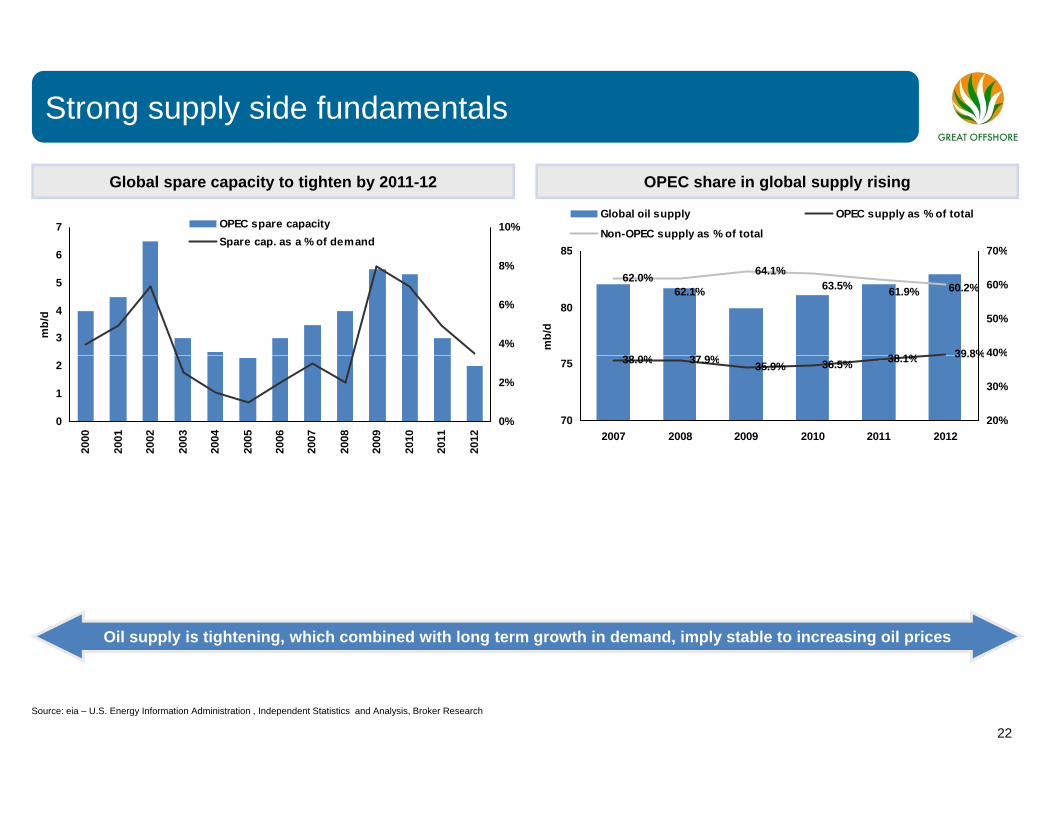
Strong supply side fundamentals
6
7 10%OPEC spare capacitySpare cap. as a % of demand
85 70%
Global oil supply OPEC supply as % of total
Non-OPEC supply as % of total
Global spare capacity to tighten by 2011-12 OPEC share in global supply rising
3
4
5
6
mb/
d
4%
6%
8%
38 0% 37 9% 38 1% 39 8%
62.0% 64.1%
62.1% 63.5% 61.9% 60.2%
80
85
mb/
d
40%
50%
60%
70%
0
1
2
2000
2001
2002
2003
2004
2005
2006
2007
2008
2009
2010
2011
2012
0%
2%
38.0% 37.9% 35.9% 36.5% 38.1% 39.8%
70
75
2007 2008 2009 2010 2011 201220%
30%
40%
Oil supply is tightening, which combined with long term growth in demand, imply stable to increasing oil prices
22
Source: eia – U.S. Energy Information Administration , Independent Statistics and Analysis, Broker Research
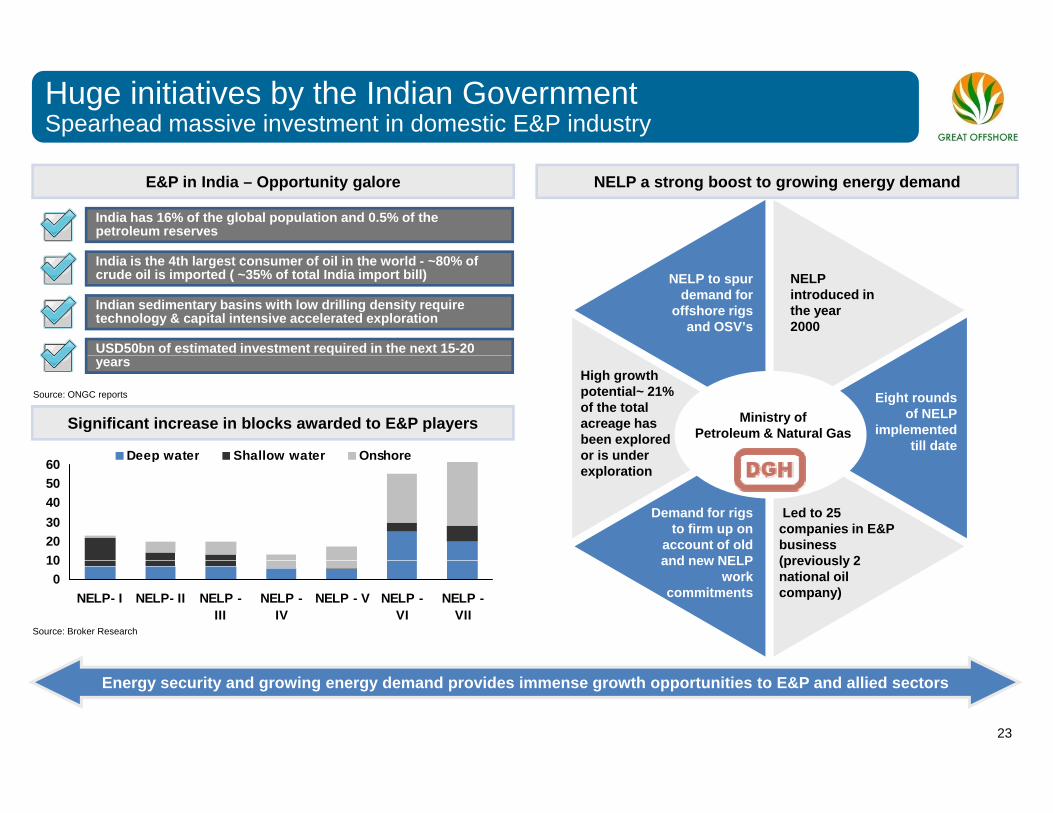
Huge initiatives by the Indian GovernmentSpearhead massive investment in domestic E&P industry
India has 16% of the global population and 0.5% of the petroleum reserves
E&P in India – Opportunity galore NELP a strong boost to growing energy demand
NELP introduced in the year2000
NELP to spur demand for
offshore rigs and OSV’s
India is the 4th largest consumer of oil in the world - ~80% of crude oil is imported ( ~35% of total India import bill)
Indian sedimentary basins with low drilling density require technology & capital intensive accelerated exploration
USD50bn of estimated investment required in the next 15-20
Eight rounds of NELP
implemented till date
High growth potential~ 21% of the total acreage has been explored or is under
Ministry of Petroleum & Natural Gas
Source: ONGC reports
Deep water Shallow water Onshore
years
Significant increase in blocks awarded to E&P players
Led to 25 companies in E&P business (previously 2
Demand for rigsto firm up on
account of old and new NELP
or is under exploration
102030405060
Deep water Shallow water Onshore
(previously 2 national oil company)
and new NELP work
commitments
Source: Broker Research
010
NELP- I NELP- II NELP -III
NELP -IV
NELP - V NELP -VI
NELP -VII
23
Energy security and growing energy demand provides immense growth opportunities to E&P and allied sectors
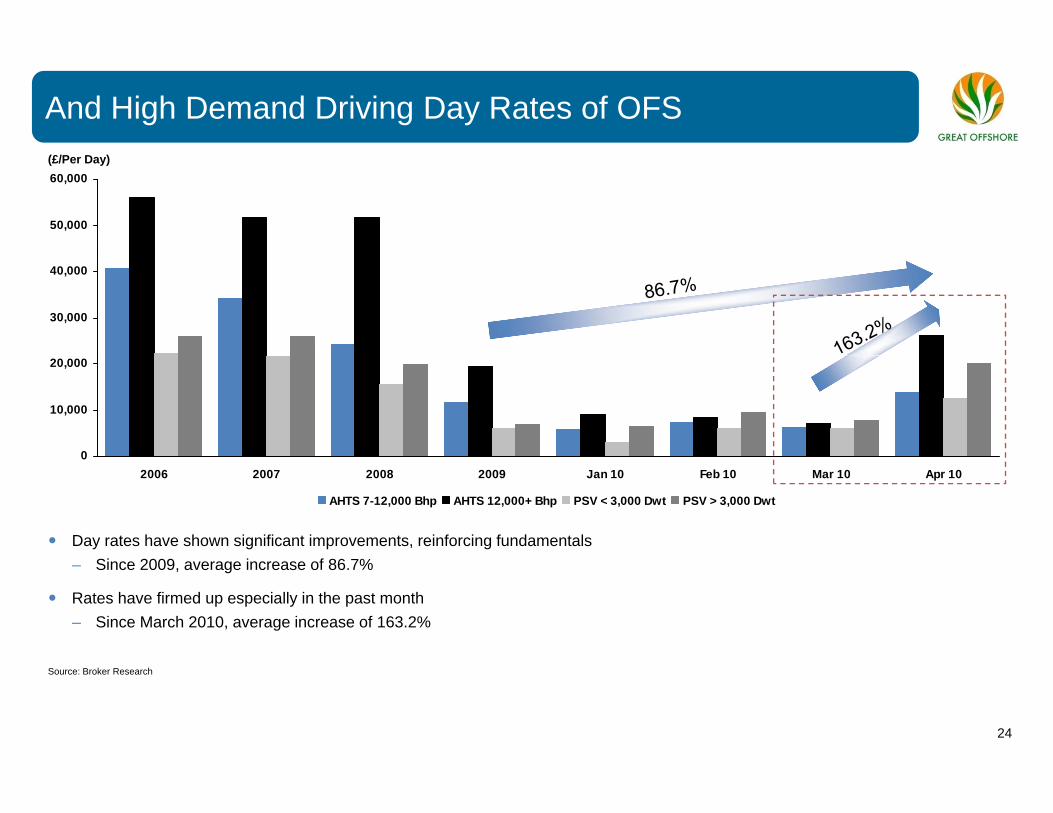
And High Demand Driving Day Rates of OFS (£/Per Day)
50,000
60,000
30,000
40,000
0
10,000
20,000
02006 2007 2008 2009 Jan 10 Feb 10 Mar 10 Apr 10
AHTS 7-12,000 Bhp AHTS 12,000+ Bhp PSV < 3,000 Dwt PSV > 3,000 Dwt
Day rates have shown significant improvements, reinforcing fundamentalsSi 2009 i f 86 7%– Since 2009, average increase of 86.7%
Rates have firmed up especially in the past month– Since March 2010, average increase of 163.2%
24
Source: Broker Research
Section 4:Company Highlights
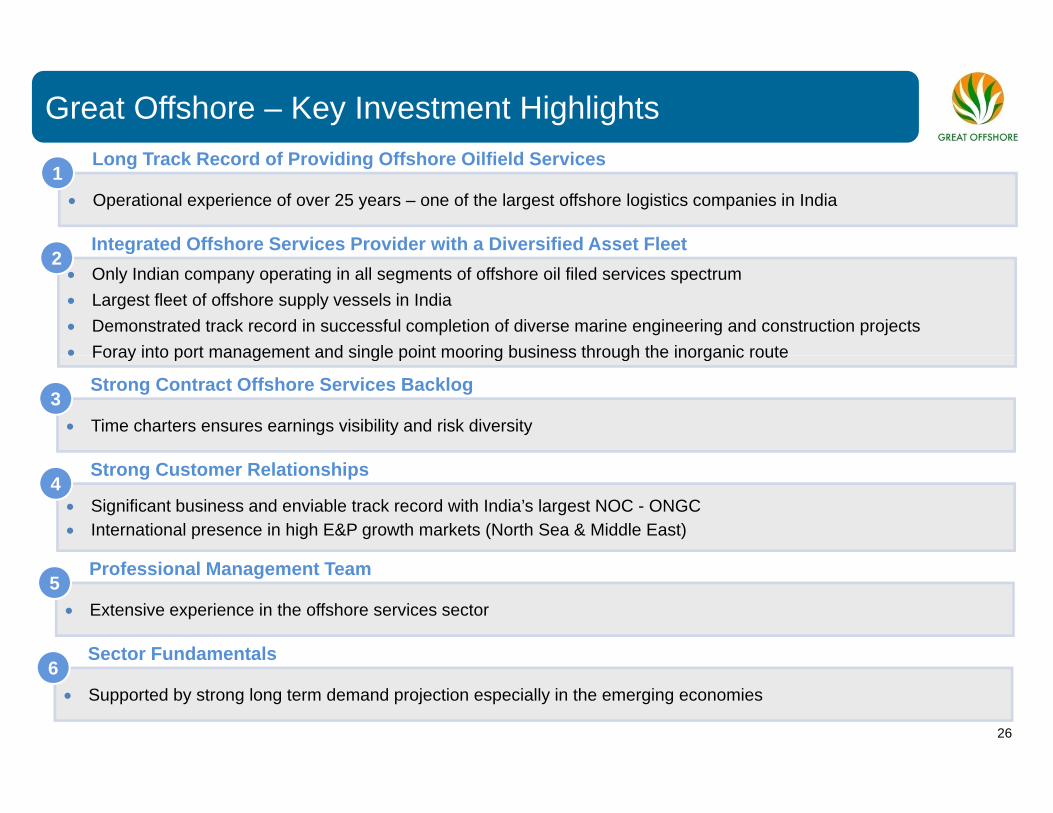
Great Offshore – Key Investment Highlights
• Operational experience of over 25 years – one of the largest offshore logistics companies in India1
Long Track Record of Providing Offshore Oilfield Services
2Integrated Offshore Services Provider with a Diversified Asset Fleet
• Only Indian company operating in all segments of offshore oil filed services spectrum• Largest fleet of offshore supply vessels in India • Demonstrated track record in successful completion of diverse marine engineering and construction projects • Foray into port management and single point mooring business through the inorganic route
2g
• Time charters ensures earnings visibility and risk diversity3
Strong Contract Offshore Services Backlog
• Foray into port management and single point mooring business through the inorganic route
• Significant business and enviable track record with India’s largest NOC - ONGC• International presence in high E&P growth markets (North Sea & Middle East)
4Strong Customer Relationships
• Extensive experience in the offshore services sector5
Professional Management Team
6Sector Fundamentals
26
• Supported by strong long term demand projection especially in the emerging economies6
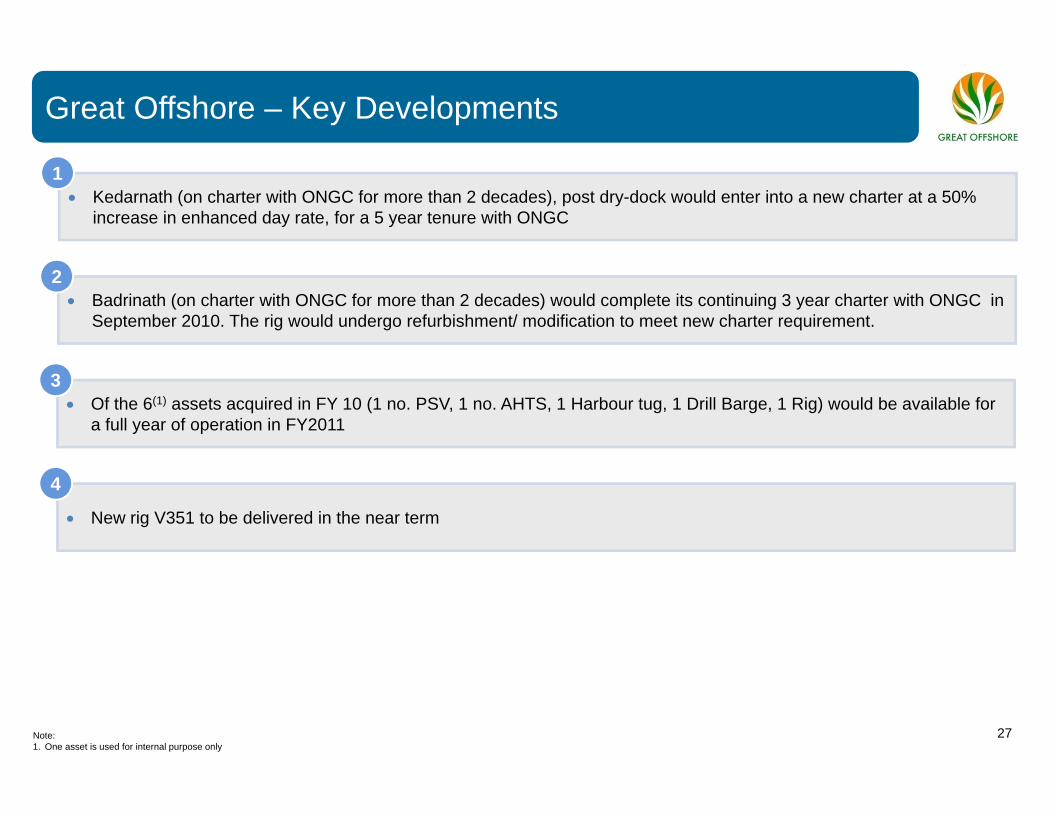
Great Offshore – Key Developments
• Kedarnath (on charter with ONGC for more than 2 decades), post dry-dock would enter into a new charter at a 50% increase in enhanced day rate, for a 5 year tenure with ONGC
1
• Badrinath (on charter with ONGC for more than 2 decades) would complete its continuing 3 year charter with ONGC in September 2010. The rig would undergo refurbishment/ modification to meet new charter requirement.
2
• Of the 6(1) assets acquired in FY 10 (1 no. PSV, 1 no. AHTS, 1 Harbour tug, 1 Drill Barge, 1 Rig) would be available for a full year of operation in FY2011
3
• New rig V351 to be delivered in the near term
4
27Note:1. One asset is used for internal purpose only
28