Embed Size (px)
Citation preview

Investor Presentation
Matters discussed in this document and in our public disclosures, whether written or oral, relating to future events or our
future performance, including any discussion, express or implied, of our anticipated growth, operating results, future earnings
per share, or plans and objectives, contain forward-looking statements within the meaning of Section 27A of the Securities Act
of 1933 and Section 21E of the Securities Exchange Act of 1934. These statements are often identified by the words “will,”
“believe,” “positioned, ” “estimate,” “project,” “target,” “continue,” “intend,” “expect,” “future,” “anticipates,” and similar
expressions that are not statements of historical fact. These statements are not guarantees of future performance and involve
certain risks, uncertainties and assumptions that are difficult to predict. Our actual results and timing of certain events could
differ materially from those anticipated in these forward-looking statements as a result of certain factors, including, but not
limited to, those set forth under ``Risk Factors'' in our Form 10-K’s and Form 10-Q’s, and in our other subsequent public filings
with the Securities and Exchange Commission. Such factors include, but are not limited to: risks associated with the
execution of our strategic plan; changes in economic conditions; loss of market share due to competition; changes in our
pension funding obligations; failure to forecast demand or anticipate or respond to changes in consumer tastes and fashion
trends; failure to achieve projected mix of product sales; business failures of large customers; distribution realignments;
manufacturing realignments and cost savings programs; increased reliance on offshore (import) sourcing of various products;
fluctuations in the cost, availability and quality of raw materials; product liability uncertainty; environmental regulations; future
acquisitions; loss of key personnel; impairment of intangible assets; anti-takeover provisions which could result in a decreased
valuation of our common stock; loss of funding sources or our inability to secure additional financing to meet our operating
and capital needs; and our ability to open and operate new retail stores successfully. It is routine for internal projections and
expectations to change as the year or each quarter in the year progresses, and therefore it should be clearly understood that
all forward-looking statements and the internal projections and beliefs upon which we base our expectations included in this
report or other periodic reports are made only as of the date made and may change. While we may elect to update forward-
looking statements at some point in the future, we do not undertake any obligation to update any forward-looking statements
whether as a result of new information, future events or otherwise.
Caution Regarding Forward-Looking Statements
2
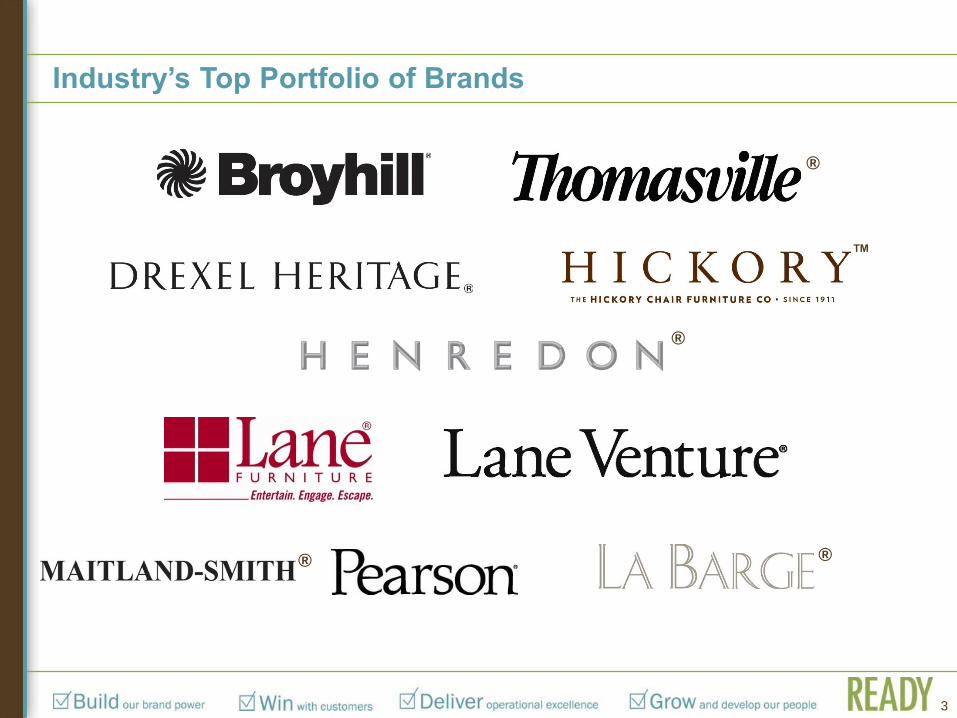
Industry’s Top Portfolio of Brands
3
™
®
® ®
®
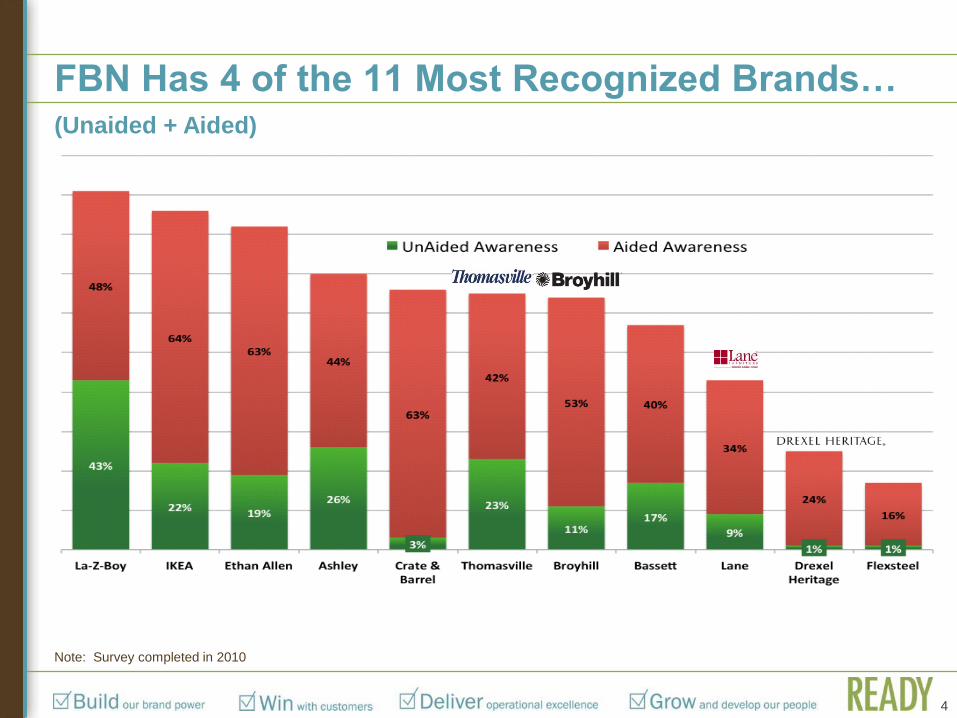
FBN Has 4 of the 11 Most Recognized Brands…
4
(Unaided + Aided)
Note: Survey completed in 2010
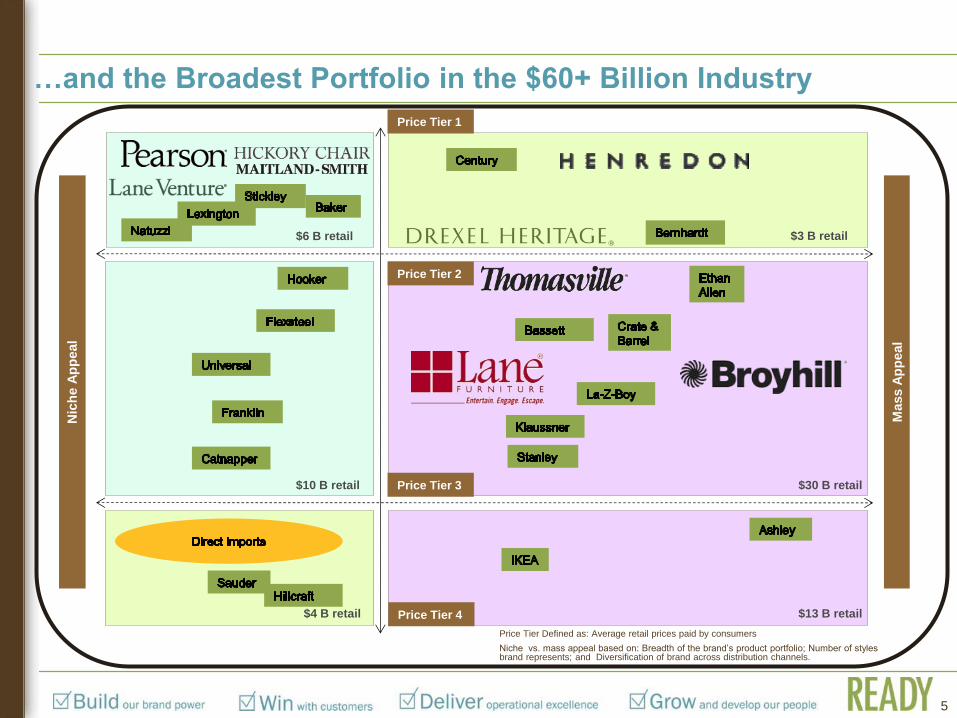
Price Tier Defined as: Average retail prices paid by consumers
Niche vs. mass appeal based on: Breadth of the brand’s product portfolio; Number of styles brand represents; and Diversification of brand across distribution channels.
Nic
he A
pp
eal
Price Tier 4
Mass A
pp
eal
$6 B retail
$30 B retail
$13 B retail $4 B retail
$3 B retail
$10 B retail Price Tier 3
Price Tier 2
Price Tier 1
…and the Broadest Portfolio in the $60+ Billion Industry
5
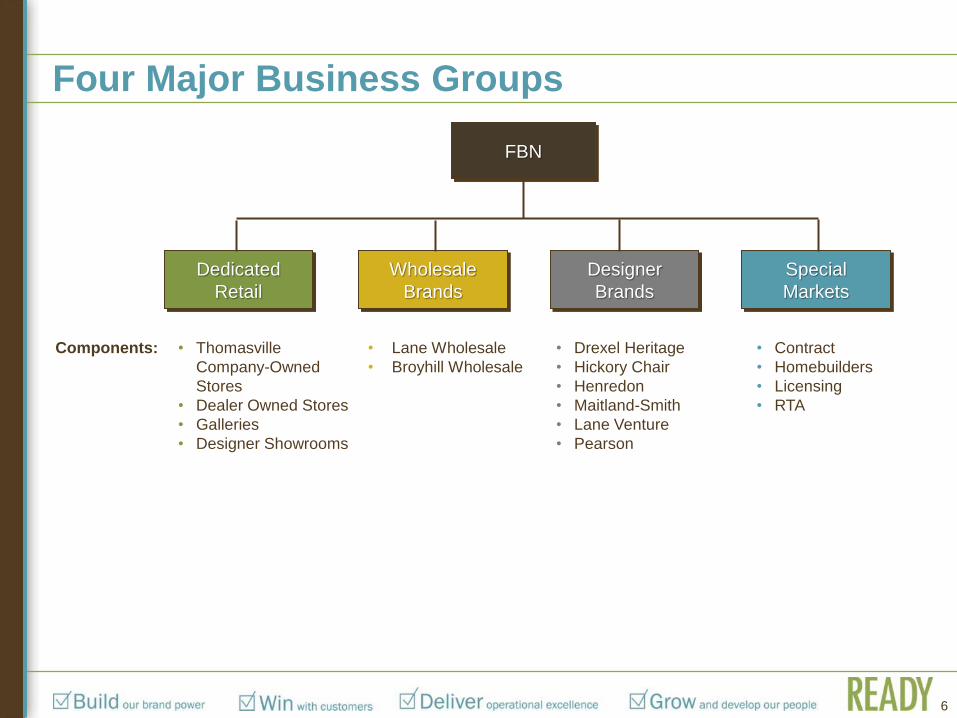
Four Major Business Groups
Dedicated
Retail
Wholesale
Brands
Designer
Brands
Special
Markets
FBN
Components: • Thomasville
Company-Owned
Stores
• Dealer Owned Stores
• Galleries
• Designer Showrooms
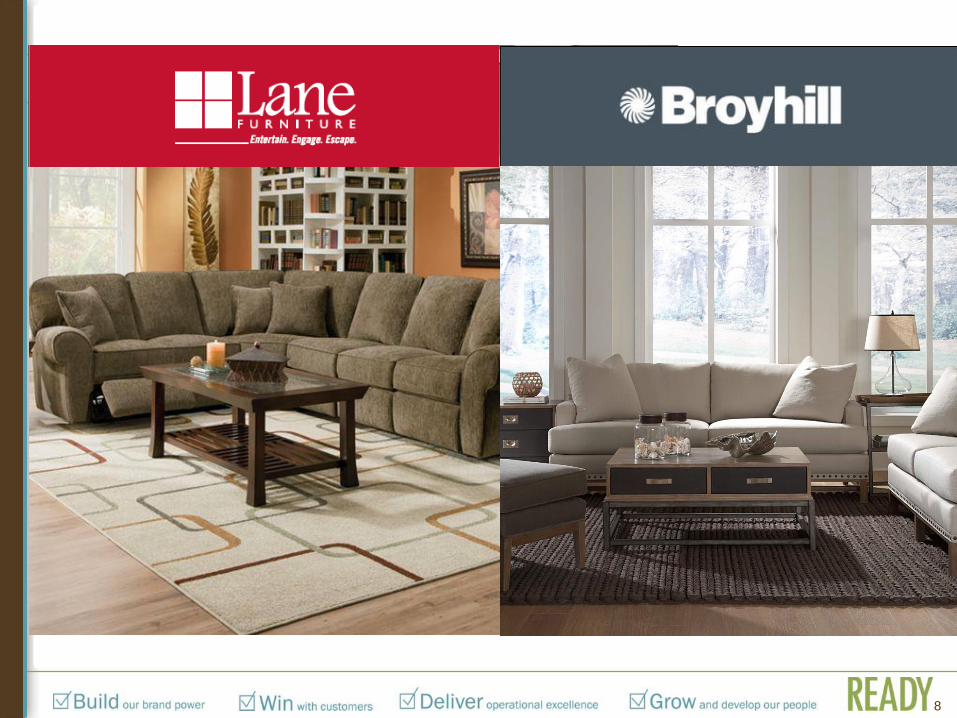
• Lane Wholesale
• Broyhill Wholesale
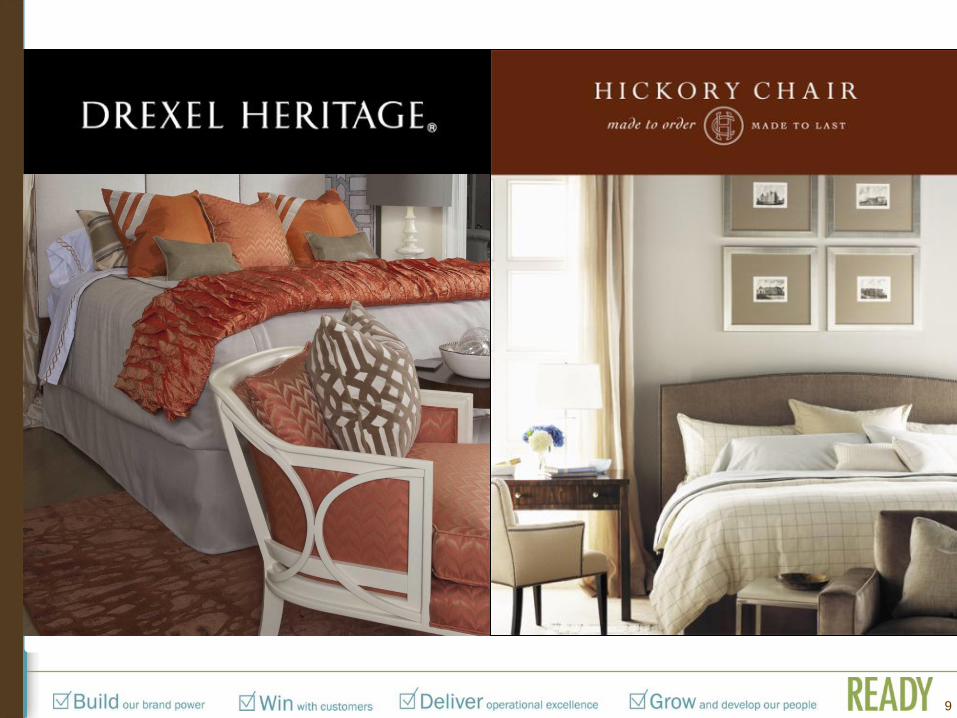
• Drexel Heritage
• Hickory Chair
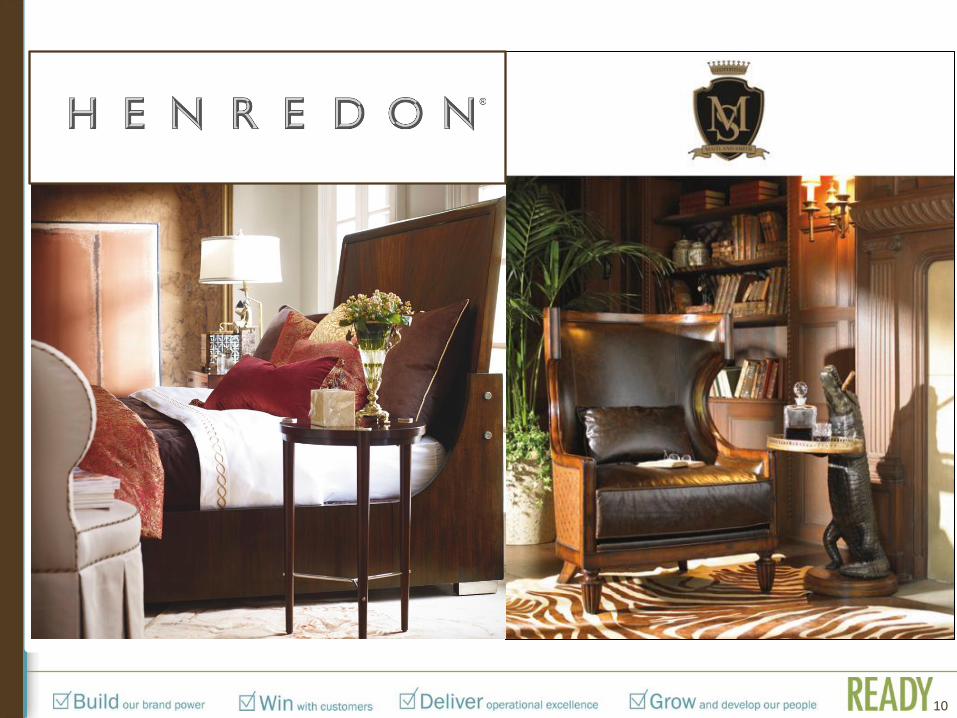
• Henredon
• Maitland-Smith
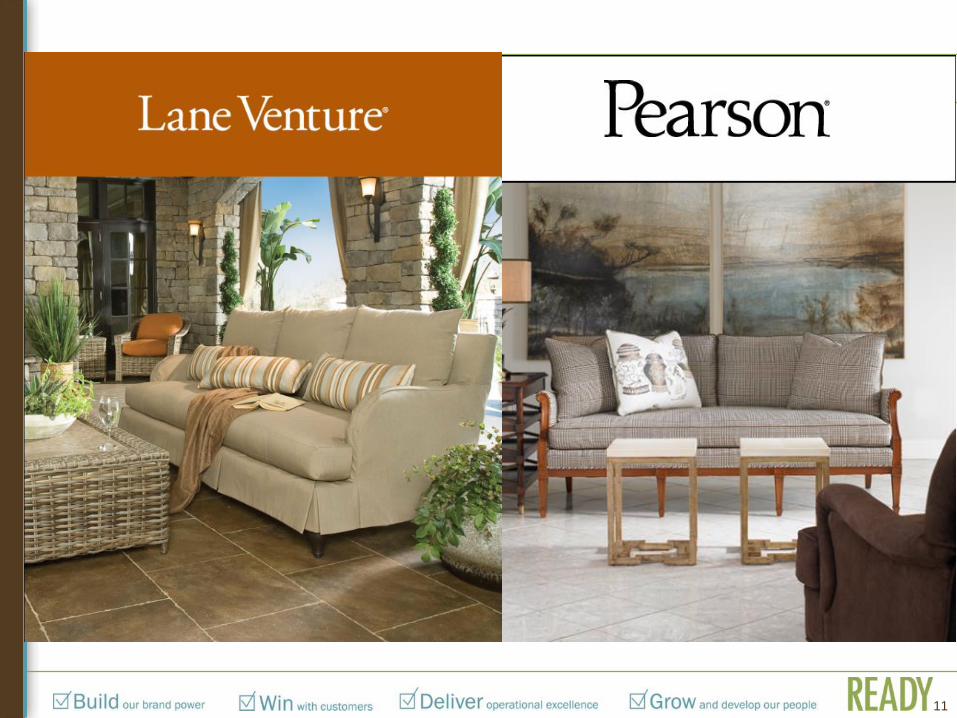
• Lane Venture
• Pearson
• Contract
• Homebuilders
• Licensing
• RTA
6

7
8
`
9
`
10
11
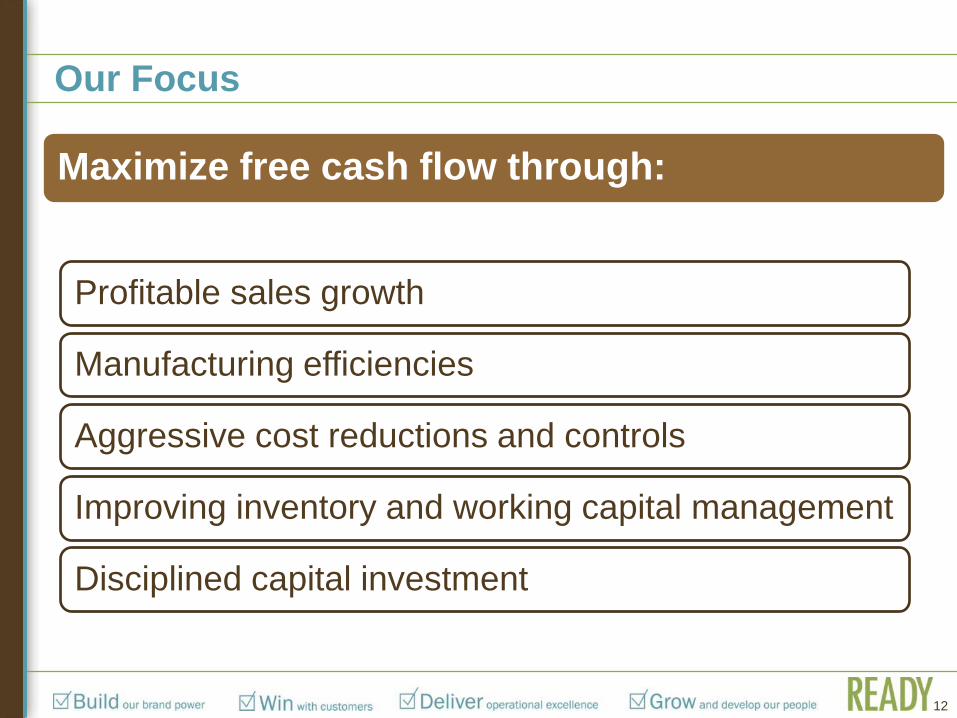
Our Focus
Maximize free cash flow through:
Profitable sales growth
Manufacturing efficiencies
Aggressive cost reductions and controls
Improving inventory and working capital management
Disciplined capital investment
12
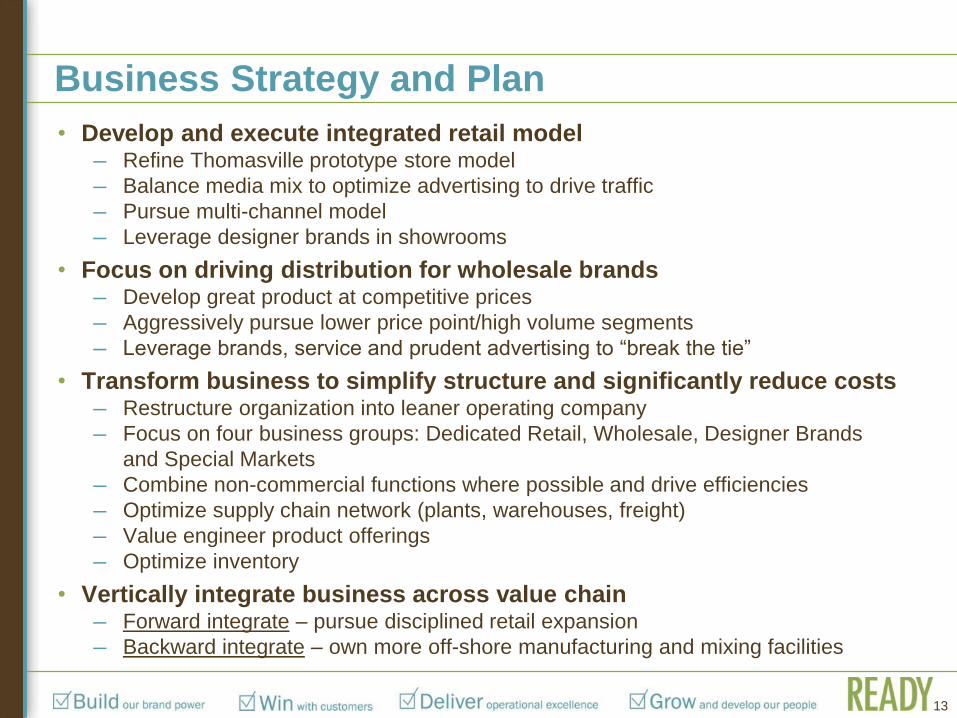
Business Strategy and Plan
• Develop and execute integrated retail model ─ Refine Thomasville prototype store model
─ Balance media mix to optimize advertising to drive traffic
─ Pursue multi-channel model
─ Leverage designer brands in showrooms
• Focus on driving distribution for wholesale brands ─ Develop great product at competitive prices
─ Aggressively pursue lower price point/high volume segments
─ Leverage brands, service and prudent advertising to “break the tie”
• Transform business to simplify structure and significantly reduce costs ─ Restructure organization into leaner operating company
─ Focus on four business groups: Dedicated Retail, Wholesale, Designer Brands
and Special Markets
─ Combine non-commercial functions where possible and drive efficiencies
─ Optimize supply chain network (plants, warehouses, freight)
─ Value engineer product offerings
─ Optimize inventory
• Vertically integrate business across value chain ─ Forward integrate – pursue disciplined retail expansion
─ Backward integrate – own more off-shore manufacturing and mixing facilities
13
Business Strategy
Execute integrated retail model
Drive distribution for wholesale brands
Transform business structure and reduce costs
Vertically integrate business
14
Dedicated Retail Sales Programs
• Migration to updated and transitional
furniture styles at retail
• New Thomasville retail store format and
enhancements
• Targeted marketing initiatives
• Multi-channel Thomasville model
• Designer showrooms with multi-brand
product
15
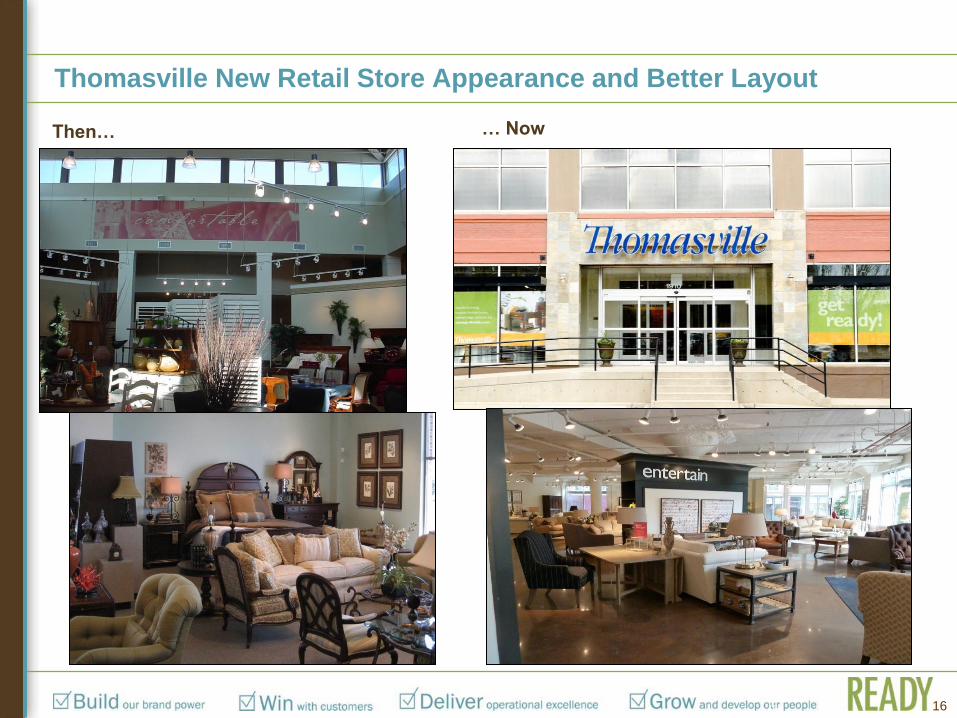
Thomasville New Retail Store Appearance and Better Layout
16
Then… … Now
16
Designer Brands Sales Programs
• Leveraging Designer Brands at retail and in designer
showrooms
• Major focus on interior designers
• Migration to updated and transitional furniture styles
• Expanding price bands of good-better-best offerings
• International opportunities and mixing program
17
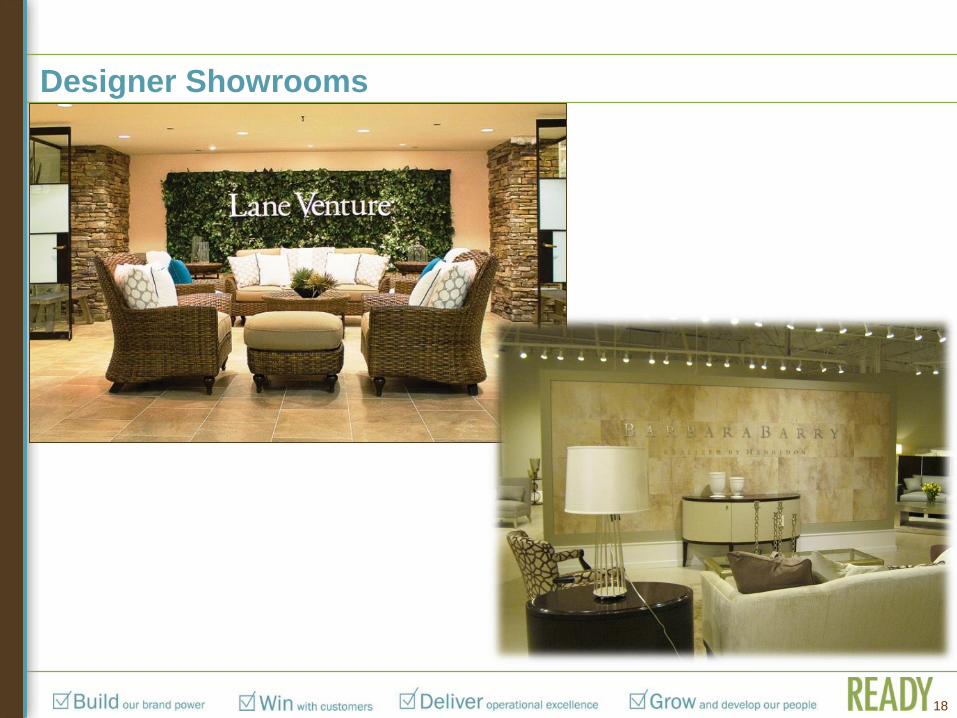
Designer Showrooms
18
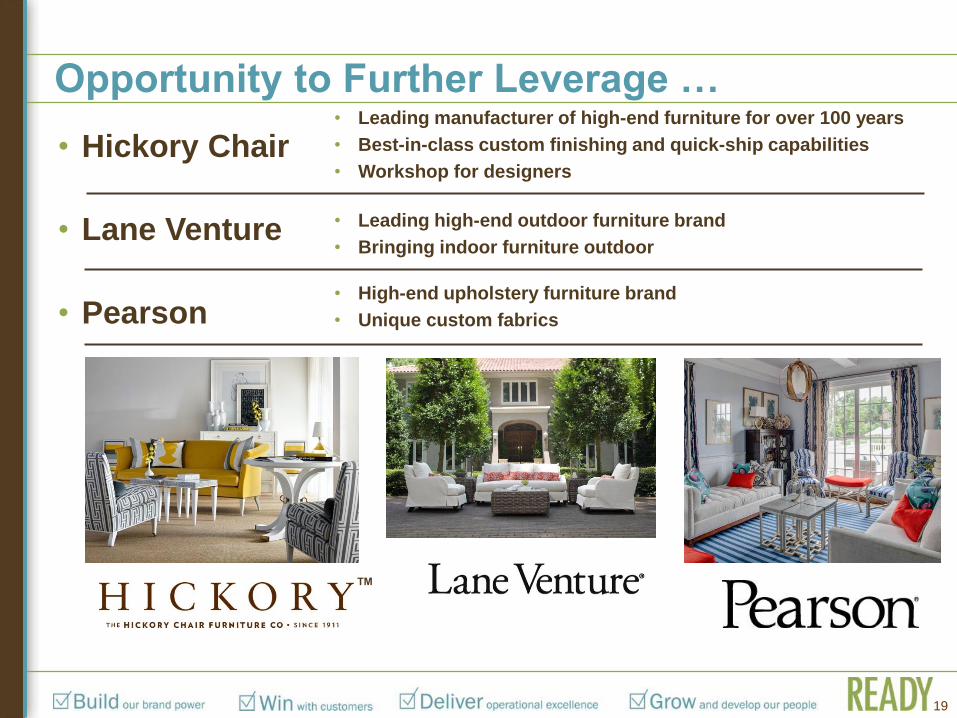
Opportunity to Further Leverage … • Leading manufacturer of high-end furniture for over 100 years
• Best-in-class custom finishing and quick-ship capabilities
• Workshop for designers
• Leading high-end outdoor furniture brand
• Bringing indoor furniture outdoor
• High-end upholstery furniture brand
• Unique custom fabrics
• Lane Venture
• Pearson
• Hickory Chair
19
™
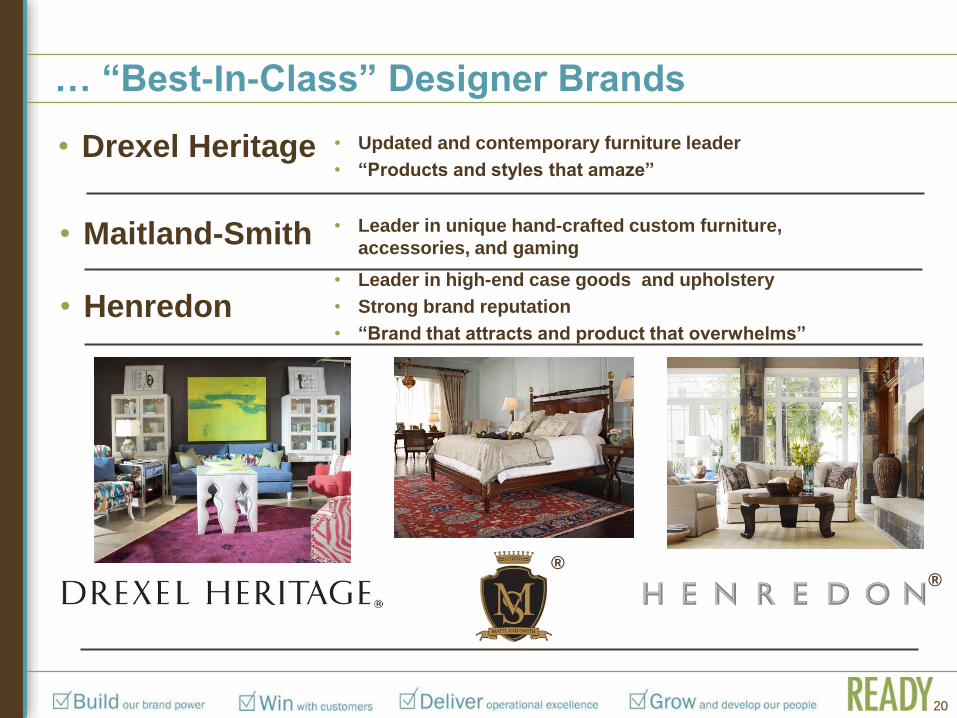
… “Best-In-Class” Designer Brands
• Updated and contemporary furniture leader
• “Products and styles that amaze”
• Leader in high-end case goods and upholstery
• Strong brand reputation
• “Brand that attracts and product that overwhelms”
• Leader in unique hand-crafted custom furniture,
accessories, and gaming
• Henredon
• Maitland-Smith
• Drexel Heritage
20
® ®

Business Strategy
Execute integrated retail model
Drive distribution for wholesale brands
Transform business structure and reduce costs
Vertically integrate business
21
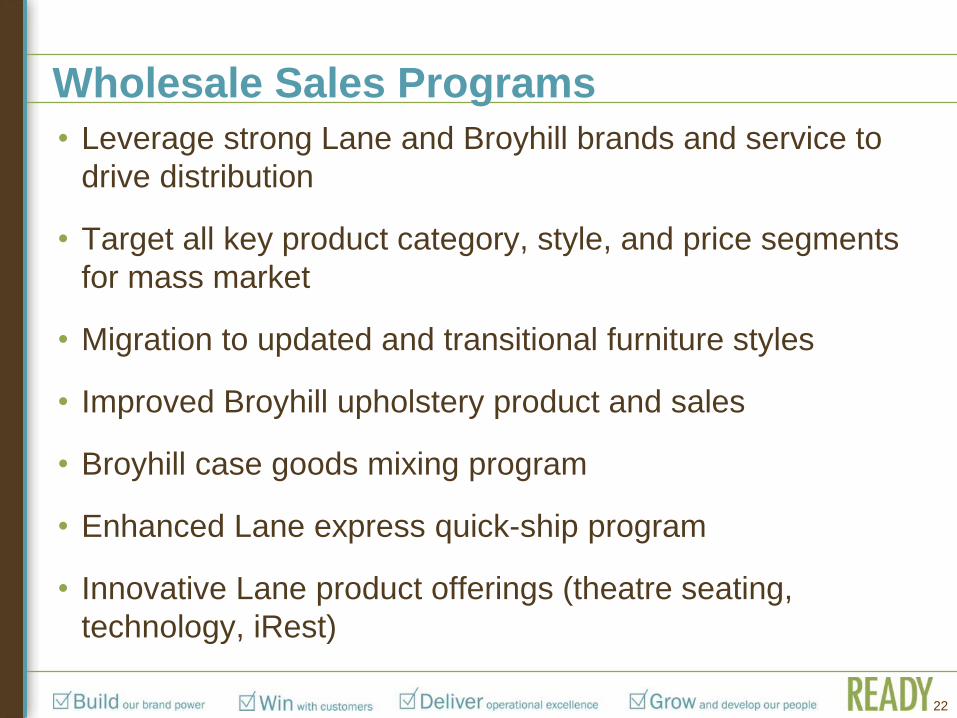
• Leverage strong Lane and Broyhill brands and service to
drive distribution
• Target all key product category, style, and price segments
for mass market
• Migration to updated and transitional furniture styles
• Improved Broyhill upholstery product and sales
• Broyhill case goods mixing program
• Enhanced Lane express quick-ship program
• Innovative Lane product offerings (theatre seating,
technology, iRest)
Wholesale Sales Programs
22
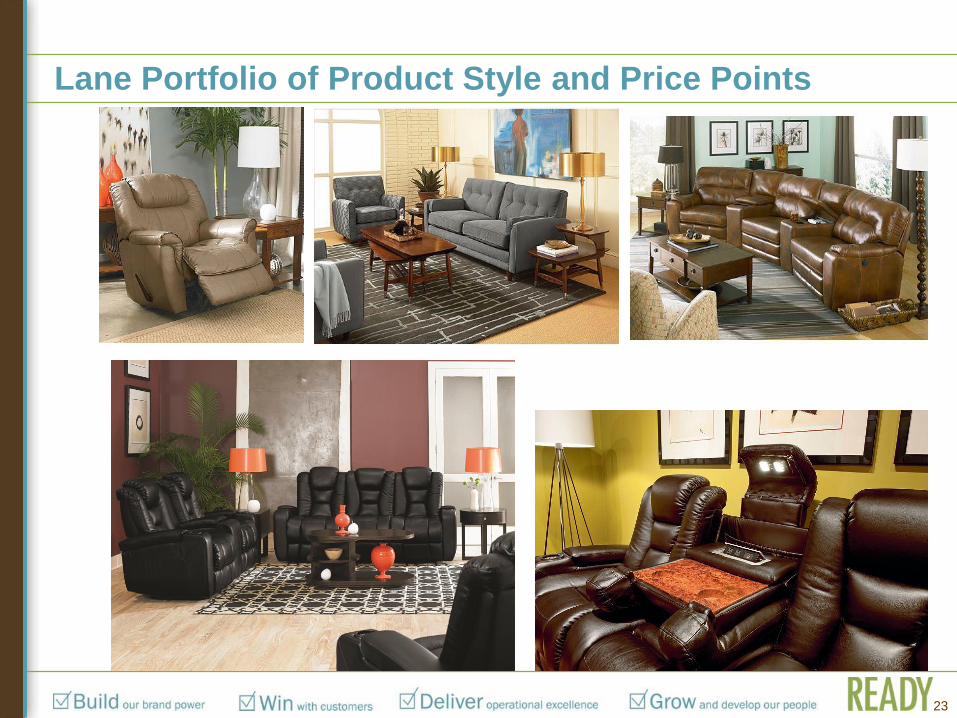
Lane Portfolio of Product Style and Price Points
23
24
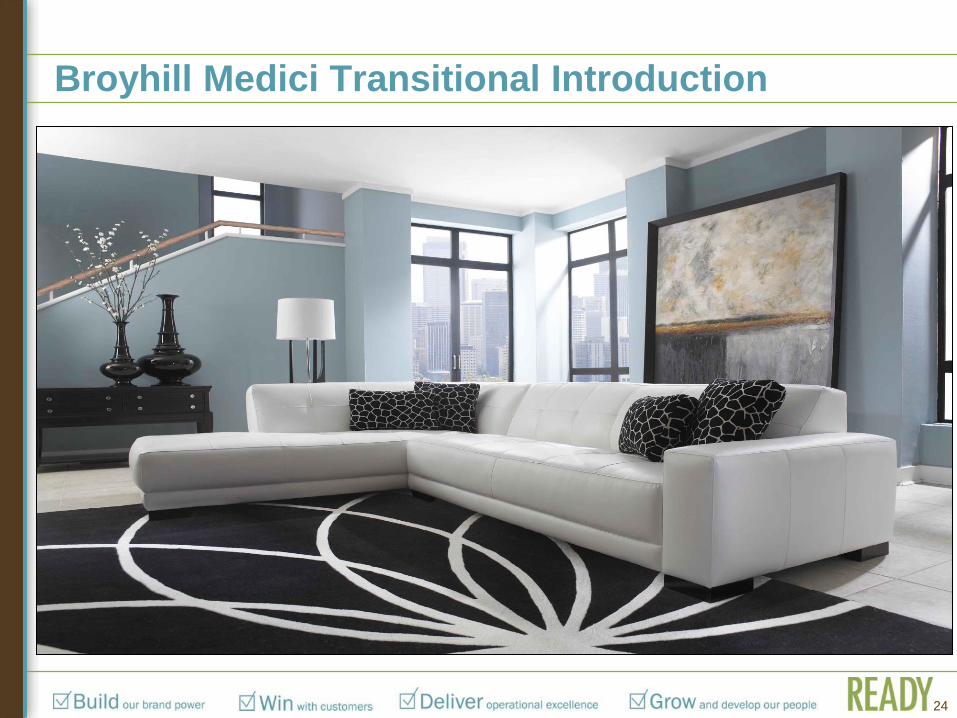
Broyhill Medici Transitional Introduction
Business Strategy
Execute integrated retail model
Drive distribution for wholesale brands
Transform business structure and reduce costs
Vertically integrate business
25
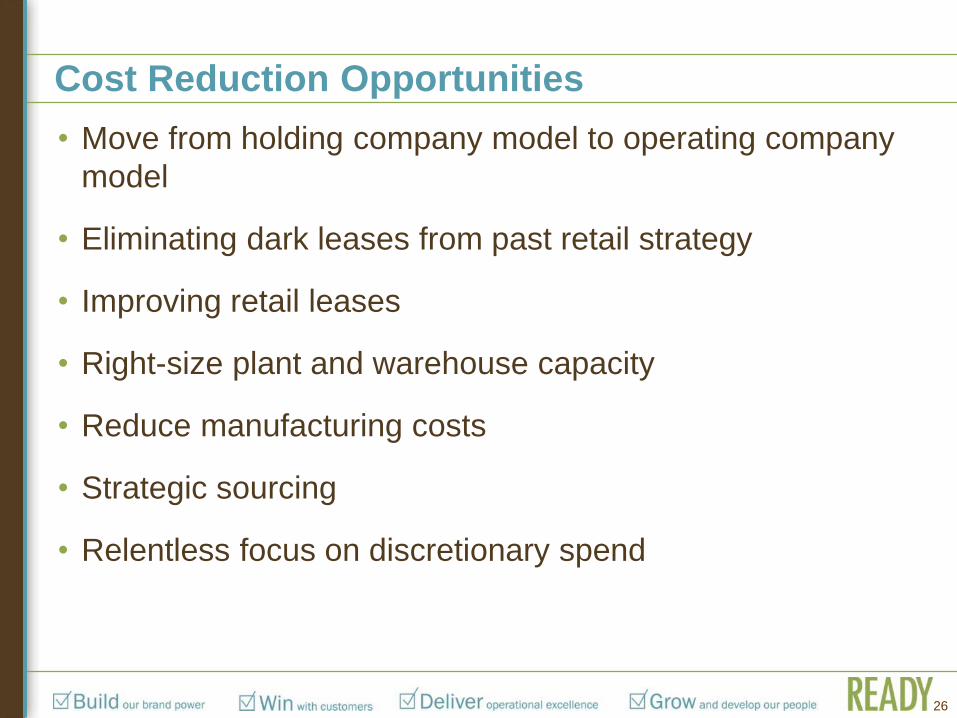
Cost Reduction Opportunities
• Move from holding company model to operating company
model
• Eliminating dark leases from past retail strategy
• Improving retail leases
• Right-size plant and warehouse capacity
• Reduce manufacturing costs
• Strategic sourcing
• Relentless focus on discretionary spend
26
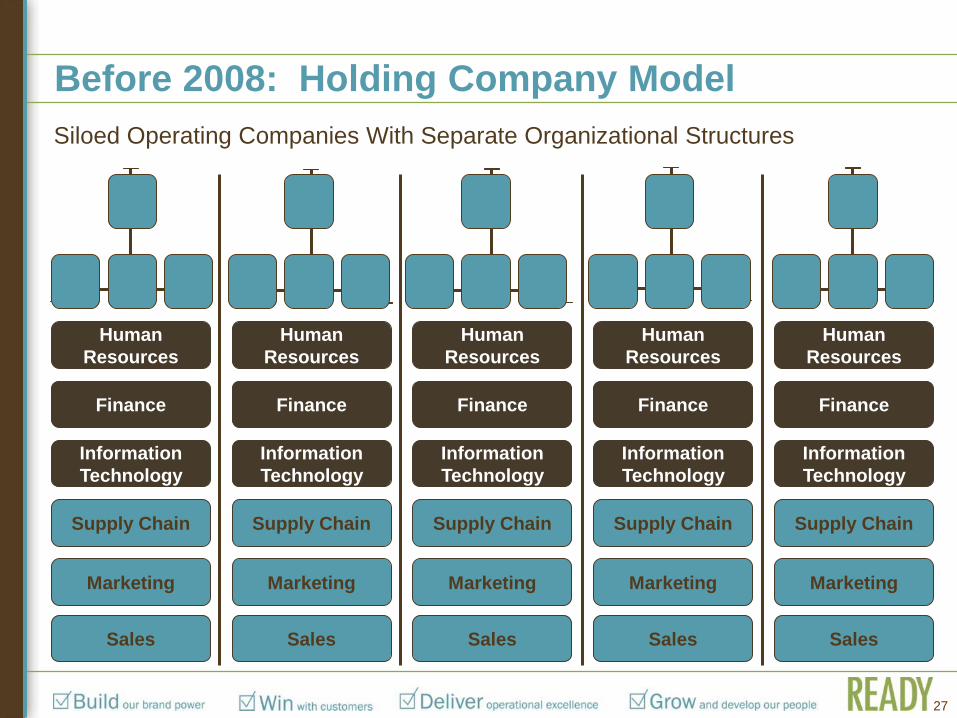
Siloed Operating Companies With Separate Organizational Structures
Before 2008: Holding Company Model
Human
Resources
Finance
Information
Technology
Supply Chain
Marketing
Human
Resources
Finance
Information
Technology
Supply Chain
Marketing
Human
Resources
Finance
Information
Technology
Supply Chain
Marketing
Human
Resources
Finance
Information
Technology
Supply Chain
Marketing
Human
Resources
Finance
Information
Technology
Supply Chain
Marketing
Sales Sales Sales Sales Sales
27
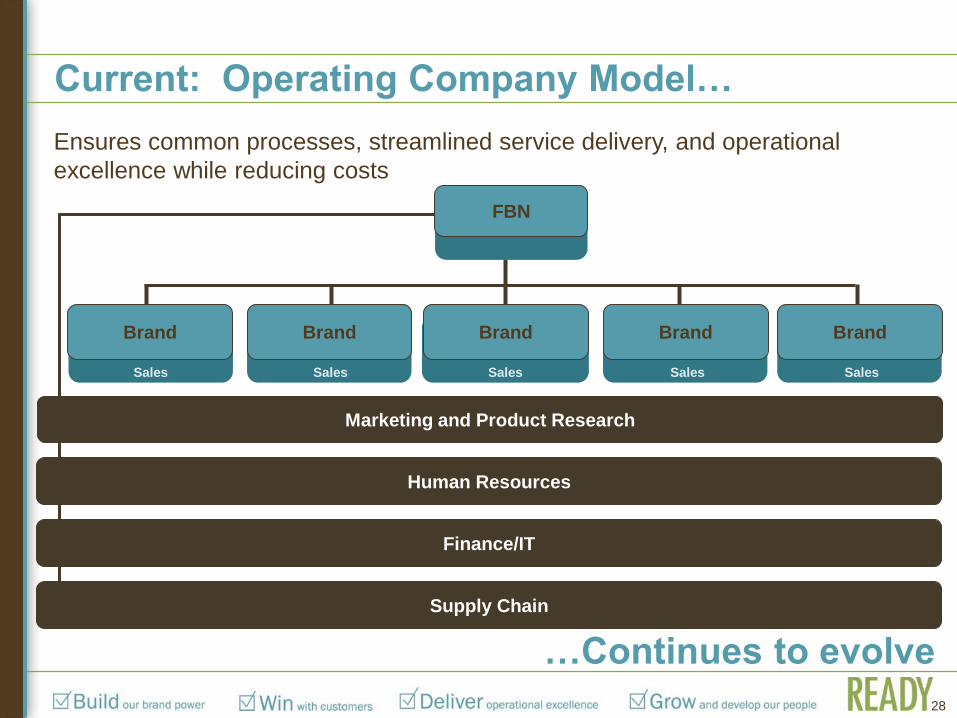
Current: Operating Company Model…
Human Resources
Ensures common processes, streamlined service delivery, and operational
excellence while reducing costs
Finance/IT
Supply Chain
Sales
Brand Brand Brand Brand
FBN
Sales Sales Sales
Brand
Sales
Marketing and Product Research
28
…Continues to evolve
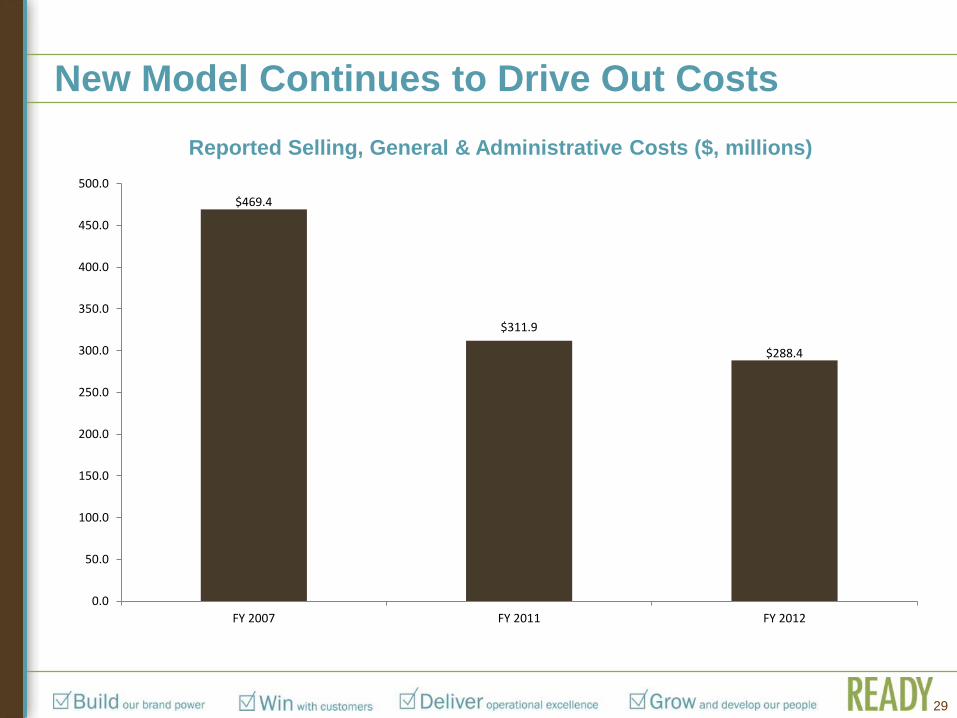
New Model Continues to Drive Out Costs
Reported Selling, General & Administrative Costs ($, millions)
$469.4
$311.9
$288.4
0.0
50.0
100.0
150.0
200.0
250.0
300.0
350.0
400.0
450.0
500.0
FY 2007 FY 2011 FY 2012
29
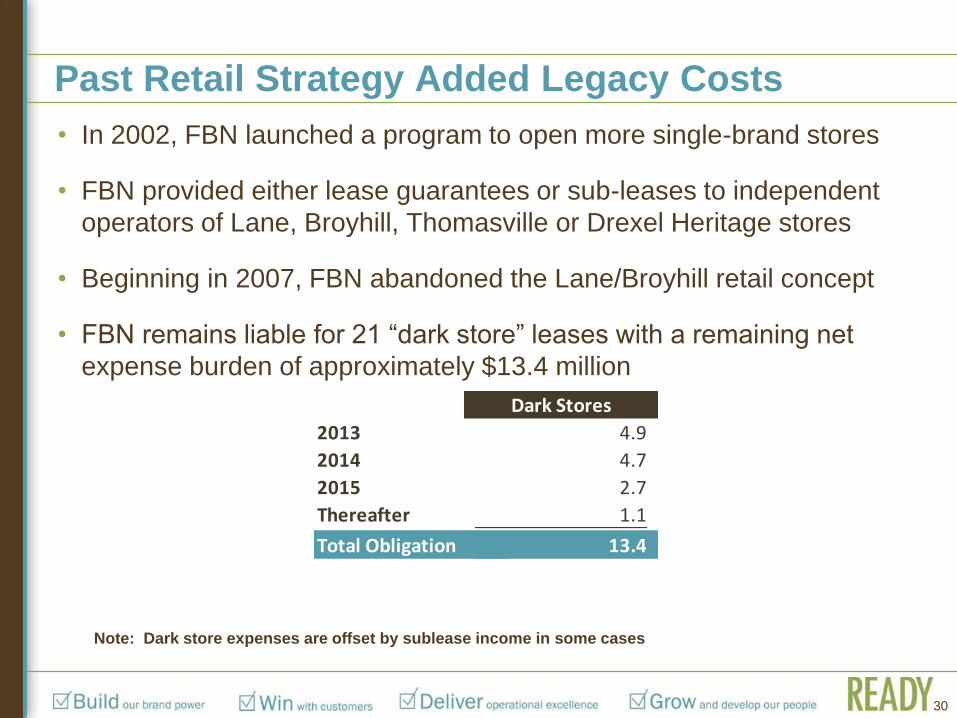
Past Retail Strategy Added Legacy Costs
• In 2002, FBN launched a program to open more single-brand stores
• FBN provided either lease guarantees or sub-leases to independent
operators of Lane, Broyhill, Thomasville or Drexel Heritage stores
• Beginning in 2007, FBN abandoned the Lane/Broyhill retail concept
• FBN remains liable for 21 “dark store” leases with a remaining net
expense burden of approximately $13.4 million
Dark Stores
2013 4.9
2014 4.7
2015 2.7
Thereafter 1.1
Total Obligation 13.4$
Dark store expenses are offset by sublease
income. Current income stream is estimated
to be $1.7 in 2013, $1.5mm in 2014,
$0.8mm in 2015 and $0.3mm after 2015.
30
Note: Dark store expenses are offset by sublease income in some cases
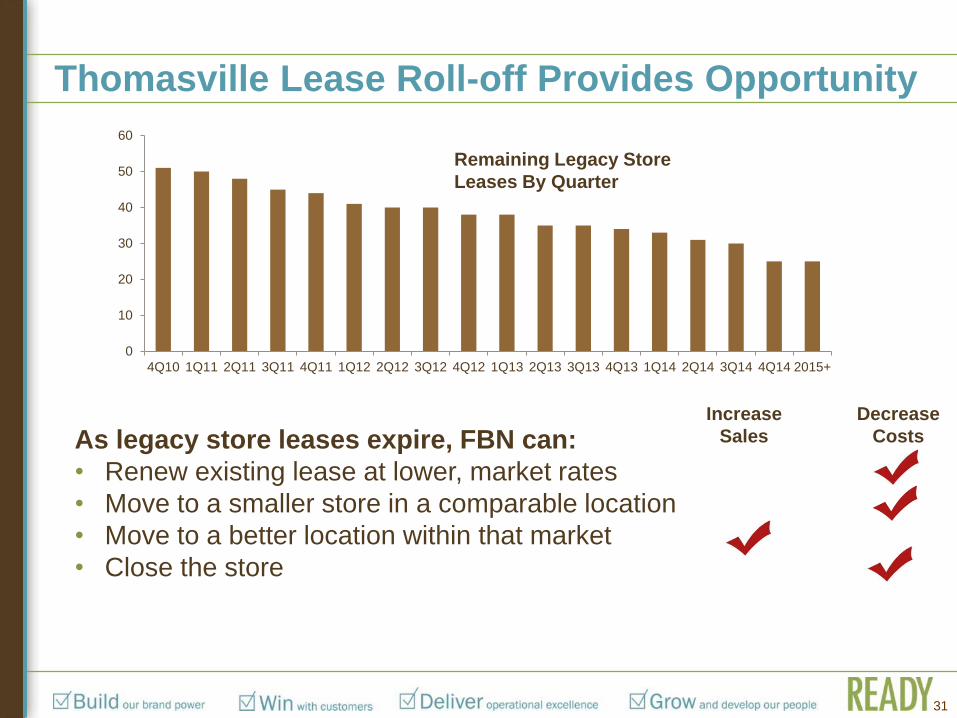
Thomasville Lease Roll-off Provides Opportunity
31
As legacy store leases expire, FBN can:
• Renew existing lease at lower, market rates
• Move to a smaller store in a comparable location
• Move to a better location within that market
• Close the store
Increase
Sales
Decrease
Costs
0
10
20
30
40
50
60
4Q10 1Q11 2Q11 3Q11 4Q11 1Q12 2Q12 3Q12 4Q12 1Q13 2Q13 3Q13 4Q13 1Q14 2Q14 3Q14 4Q14 2015+
Remaining Legacy Store
Leases By Quarter
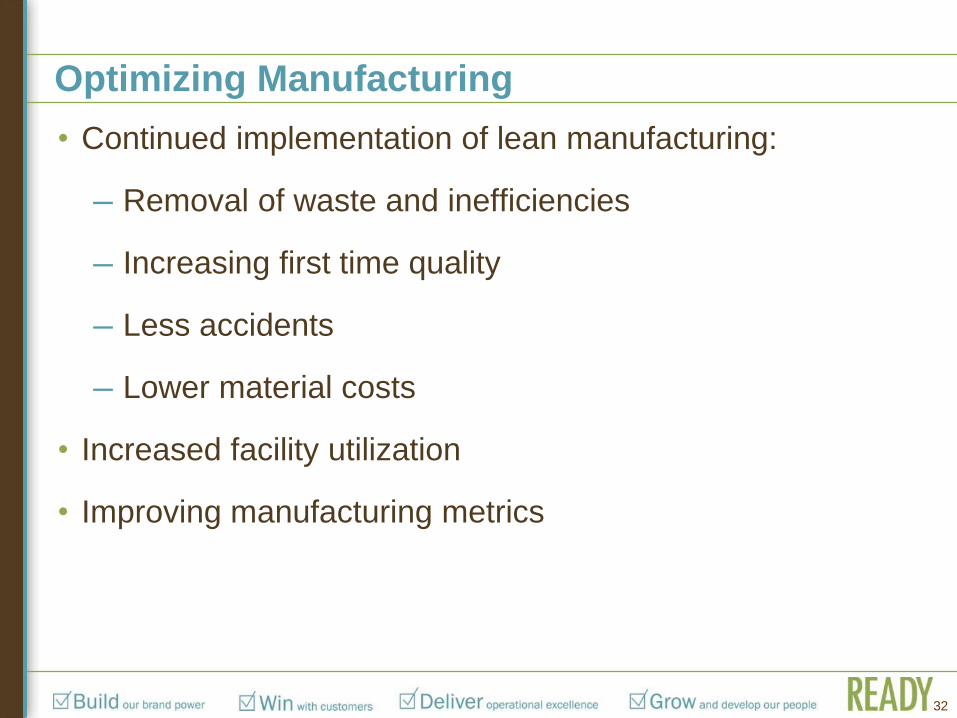
Optimizing Manufacturing
• Continued implementation of lean manufacturing:
─ Removal of waste and inefficiencies
─ Increasing first time quality
─ Less accidents
─ Lower material costs
• Increased facility utilization
• Improving manufacturing metrics
32
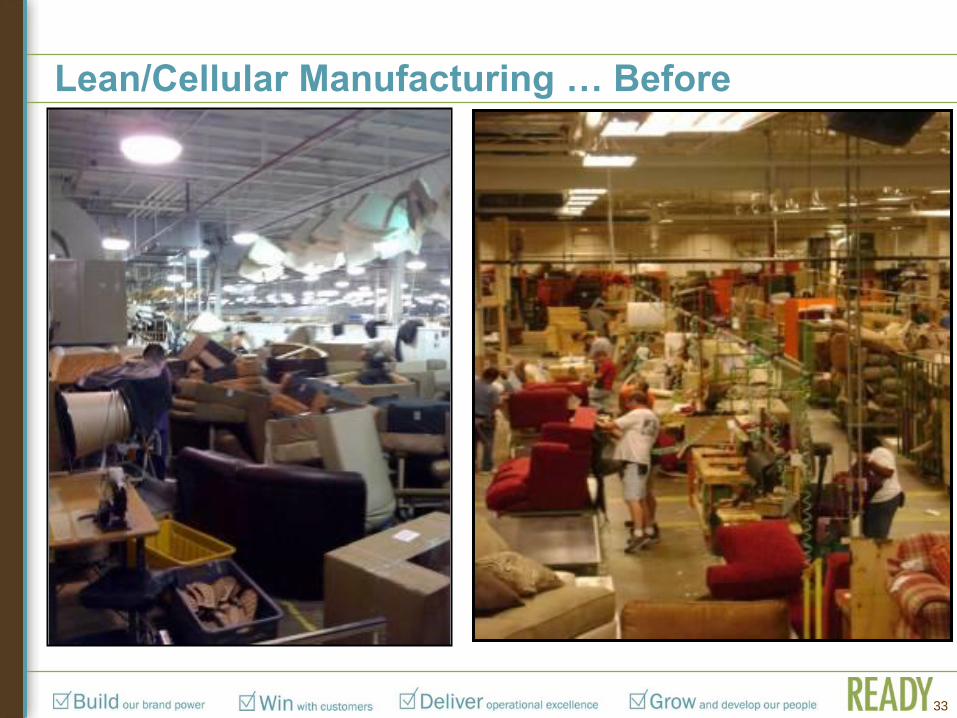
Lean/Cellular Manufacturing … Before
33
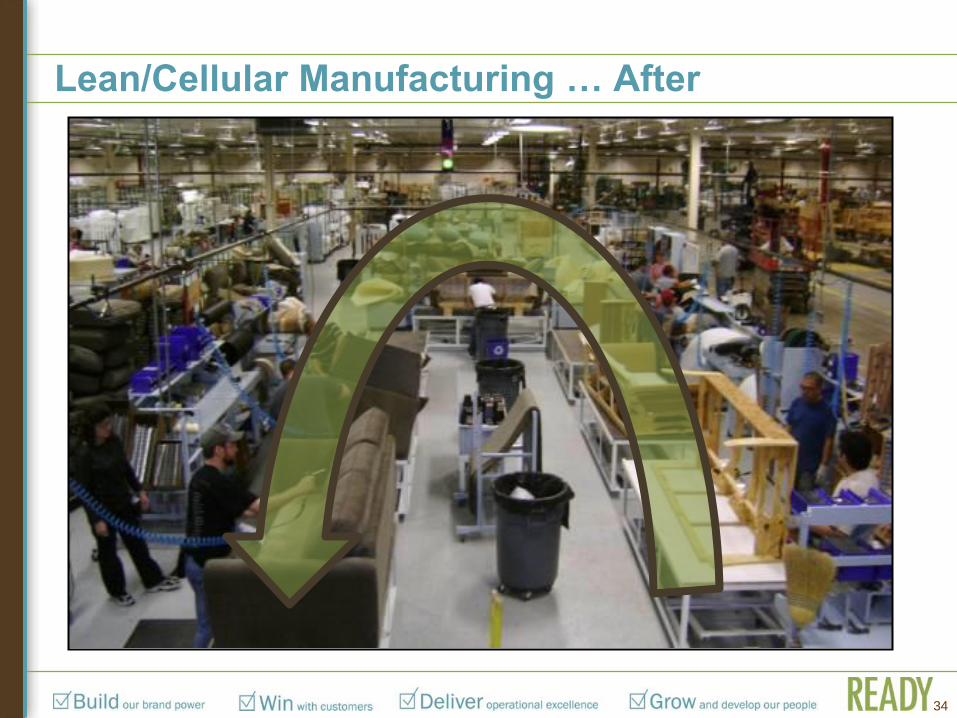
Lean/Cellular Manufacturing … After
34
Business Strategy
Execute integrated retail model
Drive distribution for wholesale brands
Transform business structure and reduce costs
Vertically integrate business
35
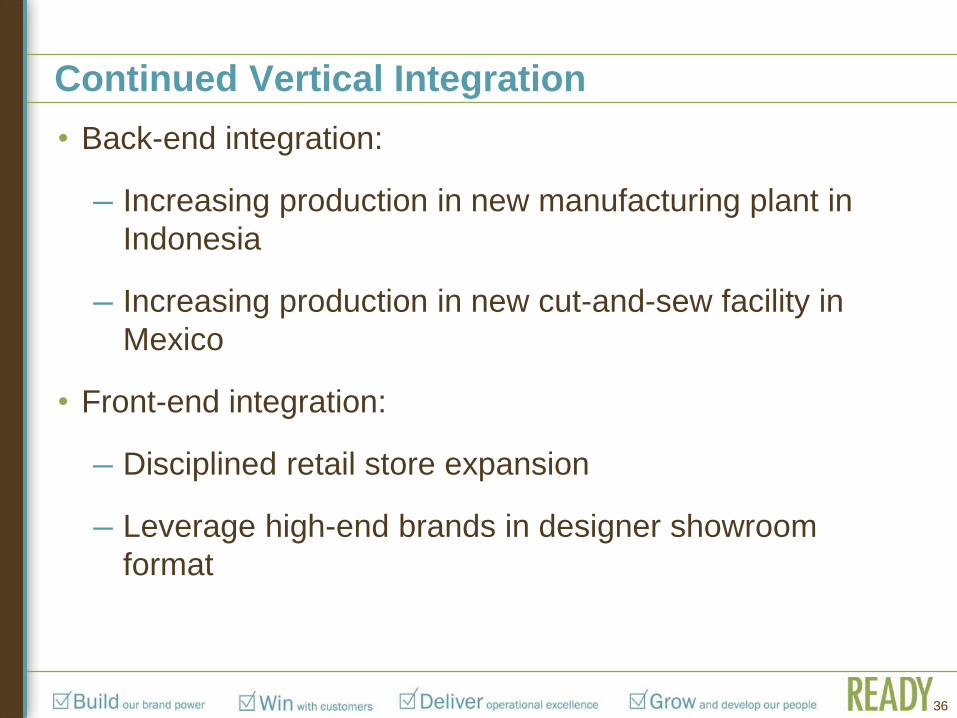
Continued Vertical Integration
• Back-end integration:
─ Increasing production in new manufacturing plant in
Indonesia
─ Increasing production in new cut-and-sew facility in
Mexico
• Front-end integration:
─ Disciplined retail store expansion
─ Leverage high-end brands in designer showroom
format
36
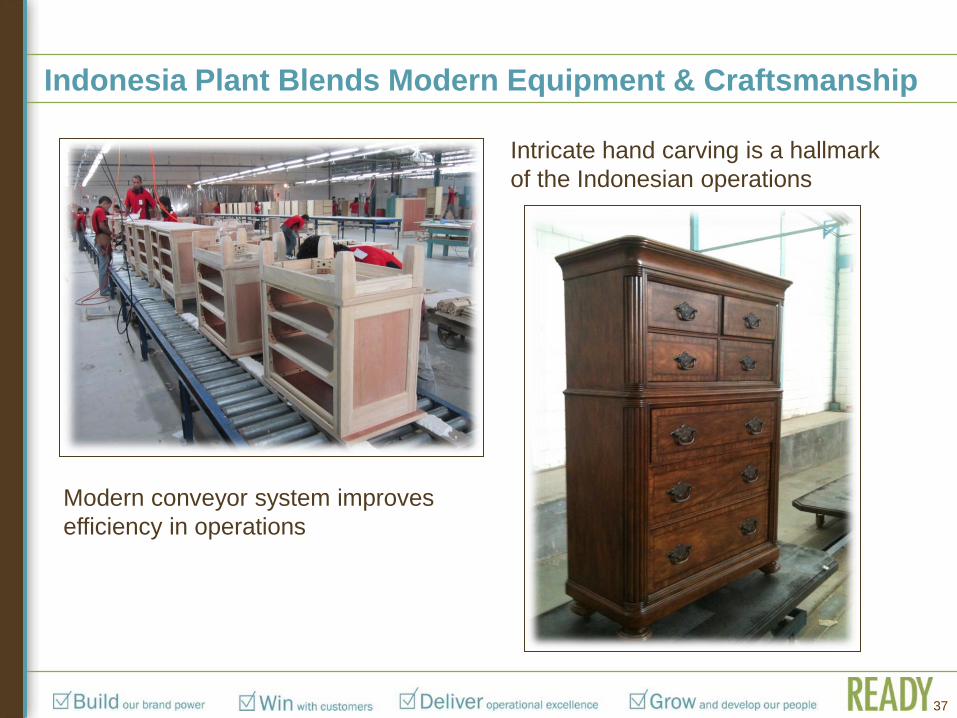
Indonesia Plant Blends Modern Equipment & Craftsmanship
37
Modern conveyor system improves
efficiency in operations
Intricate hand carving is a hallmark
of the Indonesian operations
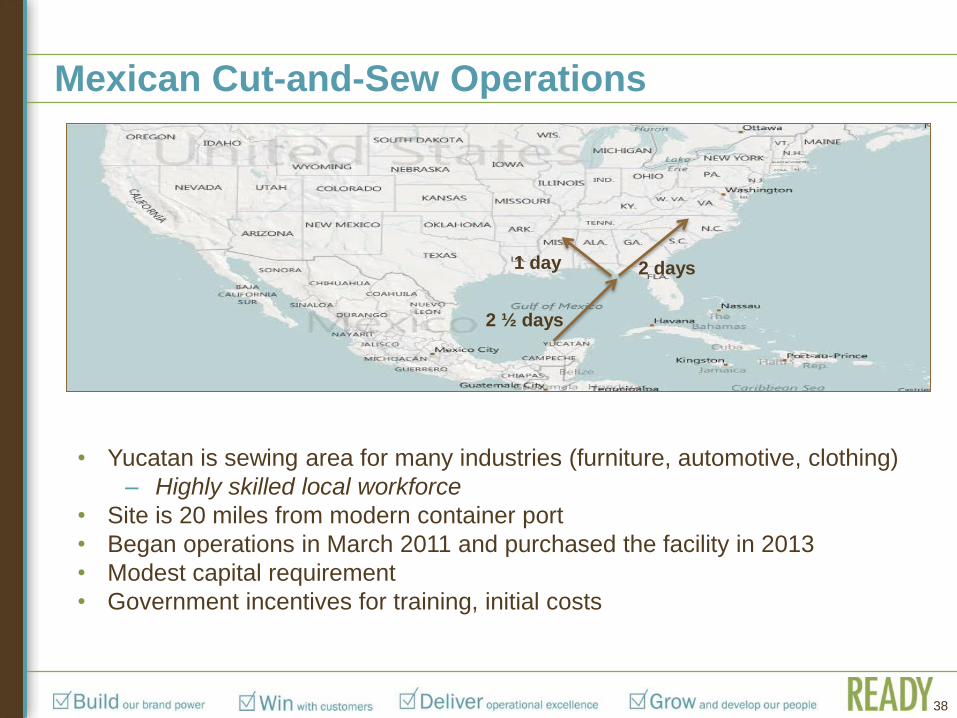
Mexican Cut-and-Sew Operations
38
2 ½ days
2 days 1 day
• Yucatan is sewing area for many industries (furniture, automotive, clothing)
‒ Highly skilled local workforce
• Site is 20 miles from modern container port
• Began operations in March 2011 and purchased the facility in 2013
• Modest capital requirement
• Government incentives for training, initial costs
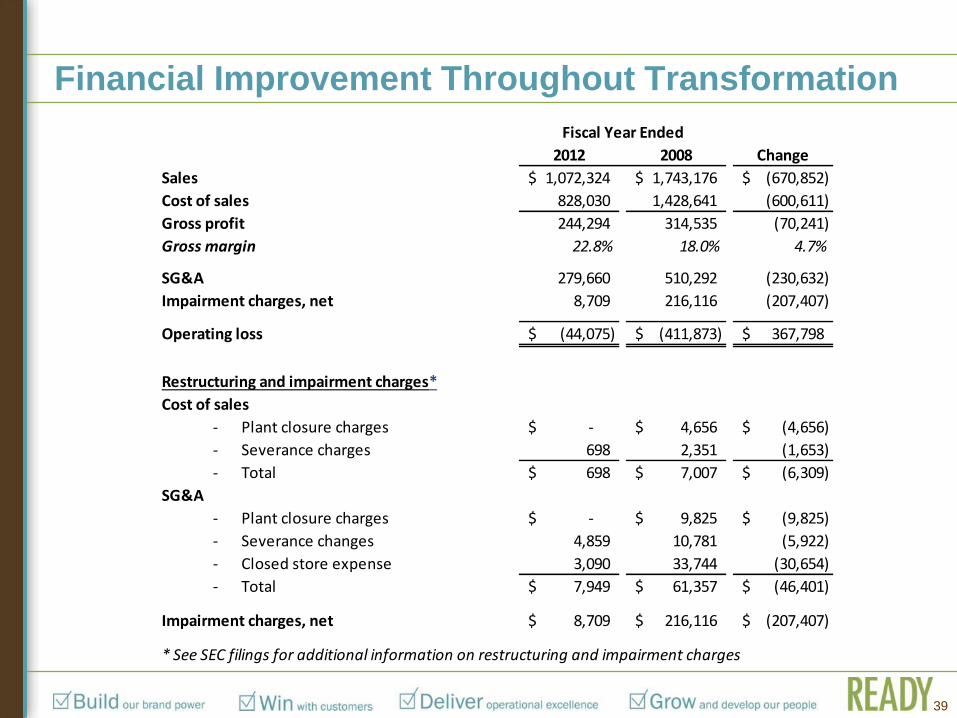
Financial Improvement Throughout Transformation
39
2012 2008 Change
Sales 1,072,324$ 1,743,176$ (670,852)$
Cost of sales 828,030 1,428,641 (600,611)
Gross profit 244,294 314,535 (70,241)
Gross margin 22.8% 18.0% 4.7%
SG&A 279,660 510,292 (230,632)
Impairment charges, net 8,709 216,116 (207,407)
Operating loss (44,075)$ (411,873)$ 367,798$
Restructuring and impairment charges*
Cost of sales
- Plant closure charges -$ 4,656$ (4,656)$
- Severance charges 698 2,351 (1,653)
- Total 698$ 7,007$ (6,309)$
SG&A
- Plant closure charges -$ 9,825$ (9,825)$
- Severance changes 4,859 10,781 (5,922)
- Closed store expense 3,090 33,744 (30,654)
- Total 7,949$ 61,357$ (46,401)$
Impairment charges, net 8,709$ 216,116$ (207,407)$
* See SEC filings for additional information on restructuring and impairment charges
Fiscal Year Ended
Debt and Liquidity • Refinanced debt in September 2012 with two instruments:
─ $200 million asset-based loan (ABL)
─ $50 million term loan
• The ABL includes an accordion feature that will allow the Company to increase
the ABL by up to $50,000 subject to securing additional commitments from the
lenders
• Refinancing has significantly increased borrowing capacity:
─ Low liquidity thresholds
─ More efficient borrowing base
─ Term loan borrowing
• 5-year term with availability to borrow at end of 2012 of $75.4 million
• Total liquidity at end of 2012 of $87.3 million
40
Key Cash Flow Drivers
• EBITDA
─ Profitable sales
─ SG&A cost reduction and control
• Working Capital
─ Inventory
─ Accounts Receivable
─ Accounts Payable
• Capital expenditures
• Pension payment requirements
• Interest payments
41
Investment Considerations
• Strong brands in a large fragmented industry
• Potential for industry growth as housing rebounds
• Opportunistic programs to drive profitable sales
• Continued vertical integration opportunities
• Optimizing manufacturing
• Cost reduction opportunities
• Increases in sales volume can drive strong
operating leverage
42
Investor Presentation