Embed Size (px)
Citation preview

First Resources Limited
Delivering Growth and Returns
Investor Presentation July 2015

2
Table of Contents
Group Overview 3
1Q2015 Financial Highlights 8
1Q2015 Operational Highlights 14
Group Updates 19

Group Overview

4
A Fast-Growing Plantation Group…
196,551 ha of plantations
Nucleus: 167,710 ha
Plasma: 28,841 ha
13 palm oil mills
Capacity of 4.32 million
tonnes of FFB p.a.
Processing facilities
Refinery, fractionation &
biodiesel plants (combined
capacity of 850,000 tonnes p.a.)
Kernel crushing plant (capacity
of 105,000 tonnes p.a.)
Plantations are located in the Riau, East Kalimantan and West Kalimantan
provinces of Indonesia
Locations
Assets
Profile
Established in 1992; listed on
Singapore Exchange in Dec 2007
Market Capitalization of ~ S$3.3
billion as at end-Jun 2015
Data as at 31 Mar 2015

5
With a Strong Growth Profile
Strong growth expected from existing plantation assets due to young age profile
FFB Yield vs. Tree Age
(tonnes/ha)
Prime Production from 8th – 17th year
Young Plantation Profile Expected Growth from Existing Asset Base
CPO Production
(‘000 tonnes)
Data as at 31 Mar 2015
Estimated production potential based on
current planted hectarage

6
Upstream Agri-
Business Focus
Active Cost
Containment
Responsible
Cultivation
Maintain our low-cost structure through best-in-class operational
efficiency and stringent cost management
To achieve superior margins and greater resilience to price cycles by
being at the low end of the industry cost curve
Continuously strengthen our multi-faceted sustainability policy across
the Group’s entire operations
To maximise market access through sustainable palm oil production
Growth Strategy: Building on our Core Expertise
Develop and maintain high-quality plantation assets, and ensure
optimal milling capacity in line with FFB production growth
To achieve sustainable production growth

7
A Leading Plantation Group with Integrated
Operations Throughout the Value Chain
Plantations Milling Processing
Fresh Fruit Bunches RBDPO
PFAD
RBD Olein
RBD Stearin
Biodiesel
Crude
Glycerine
PKE
PKO
Crude Palm Oil
Palm Kernel
Ac
tivit
y
As
se
ts
Pro
du
cts
196,551 ha of plantations
• Nucleus : 167,710 ha
• Plasma : 28,841 ha
13 CPO mills
Capacity of 4.32 million tonnes
of FFB p.a.
Refinery, fractionation &
biodiesel plants (with combined
capacity of 850,000 tonnes p.a.)
Kernel crushing plant (capacity
of 105,000 tonnes p.a.)
Note: Data as at 31 Mar 2015

1Q2015 Financial Performance

9
Income Statement Highlights
US$’ million 1Q2015 1Q2014 Change
Sales 96.3 177.9 (45.9%)
Cost of sales (38.2) (103.1) (62.9%)
Gross profit 58.0 74.8 (22.4%)
EBITDA(1) 53.4 67.4 (20.7%)
Net profit attributable to owners of the Company 27.7 45.0 (38.5%)
(1) Profit from operations adjusted for depreciation and amortisation
Gross profit margin 60.3% 42.0%
EBITDA margin 55.5% 37.9%
Decline in sales reflects the combined effects of lower average selling prices and sales volumes
Lower cost of sales mainly due to the lower sales volumes, decrease in purchases of FFB and palm oil products
from third parties, as well as lower processing costs
Improvement in margins in spite of lower average selling prices was partly contributed by lower purchases from
third parties

10
Segmental Results
US$’ million 1Q2015 1Q2014 Change
Sales
Plantations and Palm Oil Mills 107.8 135.7 (20.6%)
• Crude Palm Oil 92.9 122.1 (23.9%)
• Palm Kernel 12.9 13.6 (4.9%)
• Fresh Fruit Bunches 1.9 - n.m.
Refinery and Processing 23.3 100.2 (76.8%)
Inter-segment elimination (34.8) (58.0) (40.1%)
96.3 177.9 (45.9%)
EBITDA
Plantations and Palm Oil Mills 52.9 64.4 (17.9%)
Refinery and Processing 1.5 2.9 (48.9%)
Inter-segment elimination(1) (0.9) 0.1 n.m.
53.4 67.4 (20.7%)
(1) Inter-segment elimination of EBITDA relates to the elimination of unrealised profit on inter-segment sales
11
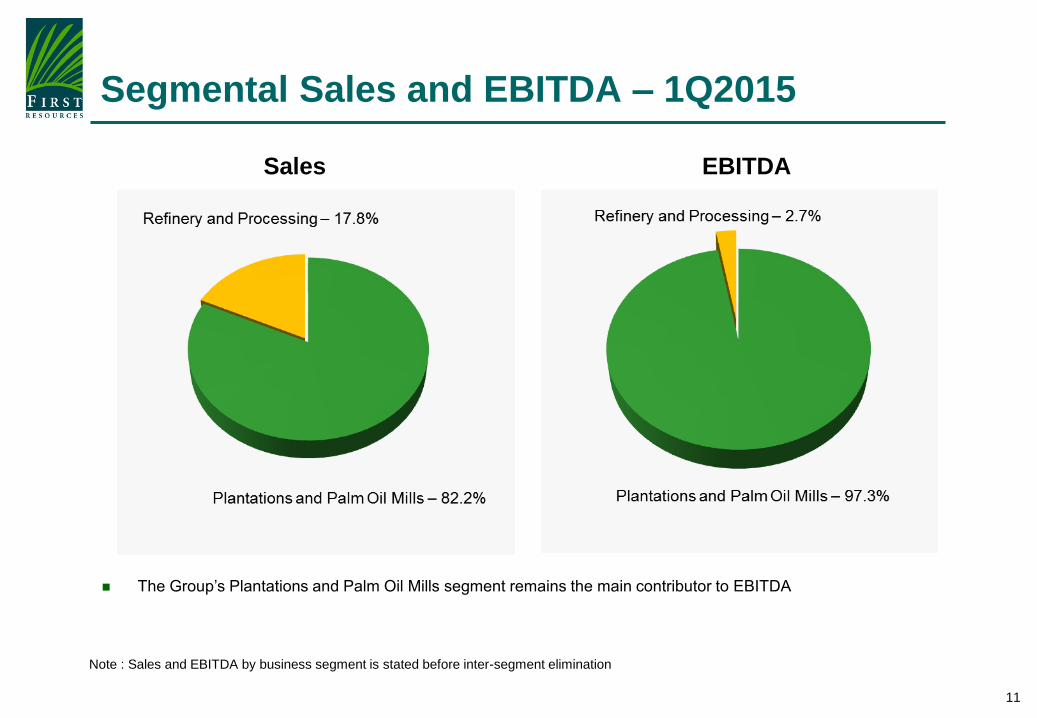
Segmental Sales and EBITDA – 1Q2015
Sales EBITDA
Note : Sales and EBITDA by business segment is stated before inter-segment elimination
The Group’s Plantations and Palm Oil Mills segment remains the main contributor to EBITDA

12
1Q2015 1Q2014 Change
Sales Volume (tonnes)
Plantations and Palm Oil Mills(1)
• Crude Palm Oil 147,567 164,871 (10.5%)
• Palm Kernel 33,592 33,831 (0.7%)
Refinery and Processing 41,848 128,370 (67.4%)
(1) Sales volume include inter-segment sales
Segmental Sales Volume
Sales volumes decreased due to lower purchases of palm oil products from third parties and a net inventory
build-up of ~ 20,000 tonnes in 1Q2015 (1Q2014: net inventory drawdown of ~ 20,000 tonnes)
Significant decrease in sales volumes of processed palm based products also due to slowing down of processing
activities at the Group’s refinery, fractionation and biodiesel plants in view of unfavourable refining margins

13
Balance Sheet Highlights
US$’ million 31 Mar 2015 31 Dec 2014
Total Assets 1,957.1 1,997.9
Cash and bank balances 356.6 350.9
Total Liabilities 880.3 882.1
Borrowings and debt securities(1) 540.3 583.1
Total Equity 1,076.9 1,115.8
Net Debt 183.7 232.2
Net Debt(2)/Total Equity 0.17x 0.21x
Net Debt(2)/EBITDA(3) 0.86x 0.77x
EBITDA/Interest Expense(4) 9.3x 15.5x
(1) Sum of Islamic MTNs and borrowings from financial institutions
(2) Borrowings and debt securities less cash and bank balances
(3) Annualised
(4) Total interest/profit distribution paid/payable on borrowings and debt securities

1Q2015 Operational Performance

15
1Q2015 1Q2014 Change
Production
FFB harvested (tonnes) 580,563 501,074 15.8%
• Nucleus 519,250 446,451 16.3%
• Plasma 61,313 54,623 12.2%
FFB purchased (tonnes) 68,974 76,317 (9.6%)
CPO (tonnes) 145,220 131,474 10.5%
PK (tonnes) 33,440 31,153 7.3%
Efficiency
FFB Yield (tonnes/ha) 4.0 3.8
CPO Yield (tonnes/ha) 0.9 0.9
CPO Extraction Rate (%) 23.0 23.1
PK Extraction Rate (%) 5.3 5.5
Production Highlights
Overall increase in production volumes due to yield recovery and contribution from newly mature hectarage
Improvement in FFB yields due to yield recovery of nucleus plantations in Riau

16
Production Trends
FFB Production
CPO Production

17
Oil Palm Plantation Area
As at 31 Mar 2015 As at 31 Mar 2014 As at 31 Dec 2014
Area (ha) % of Total Area (ha) % of Total Area (ha)
Planted Nucleus 167,710 85% 152,498 86% 165,936
- Mature 125,062 64% 114,143 64% 114,377
- Immature 42,648 21% 38,355 22% 51,559
Planted Plasma 28,841 15% 25,720 14% 28,631
- Mature 19,802 10% 17,893 10% 17,843
- Immature 9,039 5% 7,827 4% 10,788
Total Planted 196,551 100% 178,218 100% 194,567
- Mature 144,864 74% 132,036 74% 132,220
- Immature 51,687 26% 46,182 26% 62,347

18
Oil Palm Plantation Age Profile
Age As at 31 Mar 2015
Area (ha) % of Total
0-3 years (Immature) 51,687 26%
4-7 years (Young) 52,690 27%
8-17 years (Prime) 49,090 25%
≥ 18 years (Old) 43,084 22%
Total 196,551 100%
Weighted average age of ~ 9 years
Immature26%
Young27%
Prime25%
Old22%
Age Profile

Group Updates

20
Updates
Increasing CPO milling capacity
13th CPO mill in Riau was commissioned in 1Q2015
14th CPO mill is under construction in West Kalimantan; expected to be ready in 2H2016
Outlook
Weakness in crude oil and soybean oil prices, coupled with slowing demand in China,
continued to exert pressure on palm oil prices. Prices are expected to remain weak in the
near term as the industry enters into the seasonally higher production period
Long-term fundamentals of the palm oil industry remains favorable with higher biodiesel
blending mandate in Indonesia and underlying demand growth from emerging markets
Production growth of fresh fruit bunches to continue due to yield recovery and contribution
from newly mature plantations

21
Sustainability Updates
On 1st July, 2015 – Introduced the Sustainable Palm Oil Policy
No Development on High Carbon Stock forest and High Conservation Value areas
No development on Peat areas (regardless of depth)
No Exploitation of local communities as well as people
Observe a strict zero-burning policy
Establish a traceable and transparent supply chain
Develop a grievance procedure to handle grievances in a fair and transparent manner
More updates will be provided on the implementation progress of this policy
Certification updates and plans as at 30 Jun 2015
53,363ha of estates (including 5,019ha of plasma estates), refineries, jetty and bulking station
are ISCC(1) certified
41,766ha of our estates are ISPO(2) certified, awaiting the issuance of certificate for two more
estates
Pursuing RSPO(3) certifications for our estates
(1)ISPO – Indonesian Sustainable Palm Oil
(2)ISCC – International Sustainability and Carbon Certification
(3)RSPO – Roundtable on Sustainable Palm Oil

22
Disclaimer
This presentation has been prepared by First Resources Limited (“Company”) for informational
purposes, and may contain projections and forward-looking statements that reflect the Company’s
current views with respect to future events and financial performance. These views are based on
current assumptions which are subject to various risks and which may change over time. No
assurance can be given that future events will occur, that projections will be achieved, or that the
Company’s assumptions are correct.
The information is current only as of its date and shall not, under any circumstances, create any
implication that the information contained therein is correct as of any time subsequent to the date
thereof or that there has been no change in the financial condition or affairs of the Company since
such date. Opinions expressed herein reflect the judgement of the Company as of the date of this
presentation and may be subject to change. This presentation may be updated from time to time and
there is no undertaking by the Company to post any such amendments or supplements on this
presentation.
The Company will not be responsible for any consequences resulting from the use of this
presentation as well as the reliance upon any opinion or statement contained herein or for any
omission.

23
Contact Information
For further information, please contact:
Investor Relations
First Resources Limited 8 Temasek Boulevard
#36-02 Suntec Tower Three
Singapore 038988
Tel: +65 6602 0200
Fax: +65 6333 6711
Website: www.first-resources.com