Embed Size (px)
Citation preview
Investor Presentation
November 2017
Ayurveda – Science of Life
2
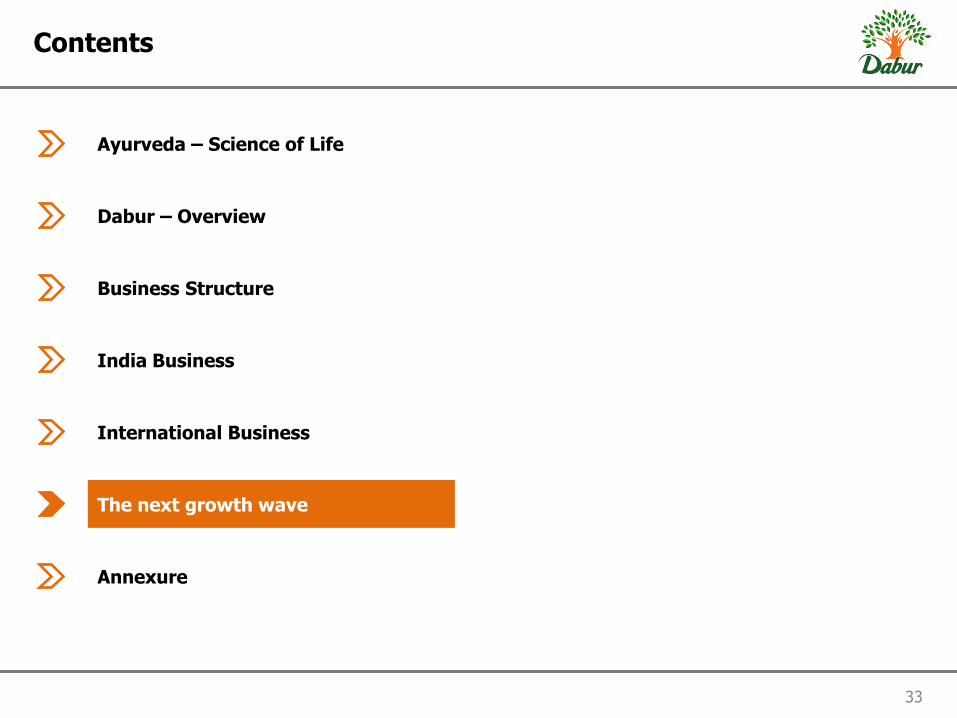
Contents
Business Structure
India Business
The next growth wave
International Business
Annexure
Dabur – Overview
3
Ayurveda – Science of Life
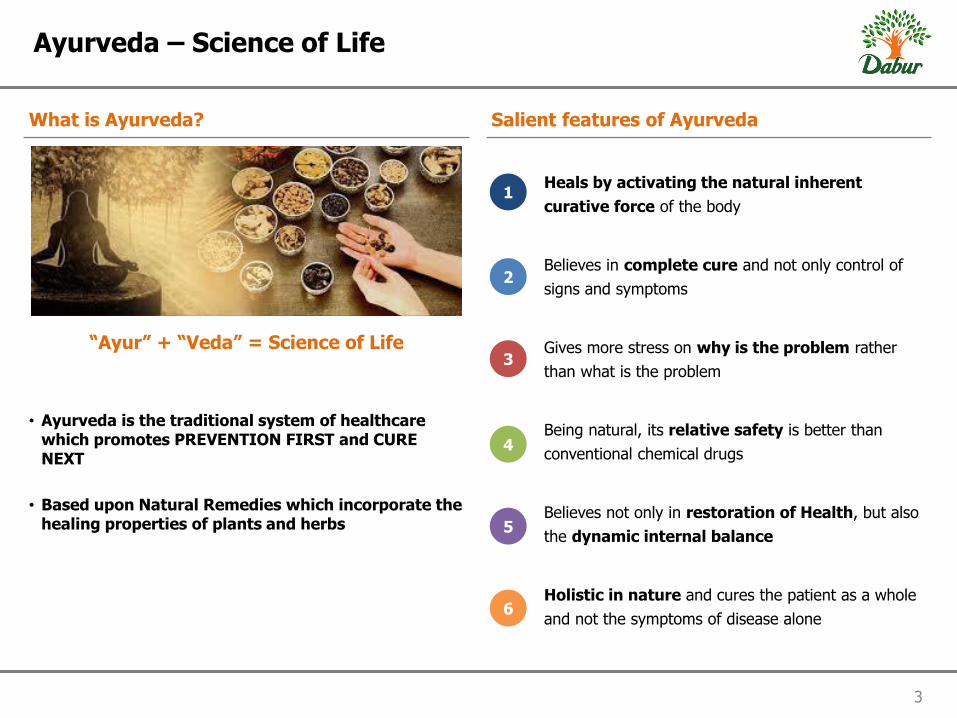
What is Ayurveda? Salient features of Ayurveda
“Ayur” + “Veda” = Science of Life
• Ayurveda is the traditional system of healthcare which promotes PREVENTION FIRST and CURE NEXT
• Based upon Natural Remedies which incorporate the healing properties of plants and herbs
Heals by activating the natural inherent
curative force of the body
Believes in complete cure and not only control of
signs and symptoms
Gives more stress on why is the problem rather
than what is the problem
Being natural, its relative safety is better than
conventional chemical drugs
Believes not only in restoration of Health, but also
the dynamic internal balance
Holistic in nature and cures the patient as a whole
and not the symptoms of disease alone
1
2
3
4
5
6
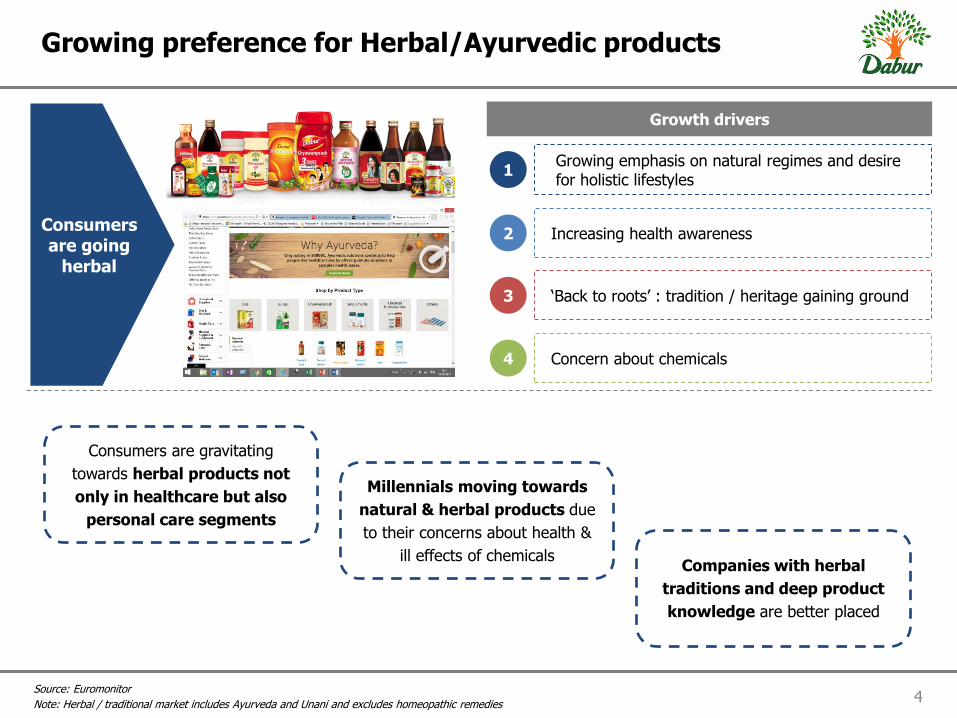
4 Source: Euromonitor
Note: Herbal / traditional market includes Ayurveda and Unani and excludes homeopathic remedies
Growing preference for Herbal/Ayurvedic products
Growth drivers
Growing emphasis on natural regimes and desire for holistic lifestyles
1
2
3
4
Increasing health awareness
‘Back to roots’ : tradition / heritage gaining ground
Concern about chemicals
Consumers are going
herbal
Consumers are gravitating
towards herbal products not
only in healthcare but also
personal care segments
Millennials moving towards
natural & herbal products due
to their concerns about health &
ill effects of chemicals Companies with herbal
traditions and deep product
knowledge are better placed
5
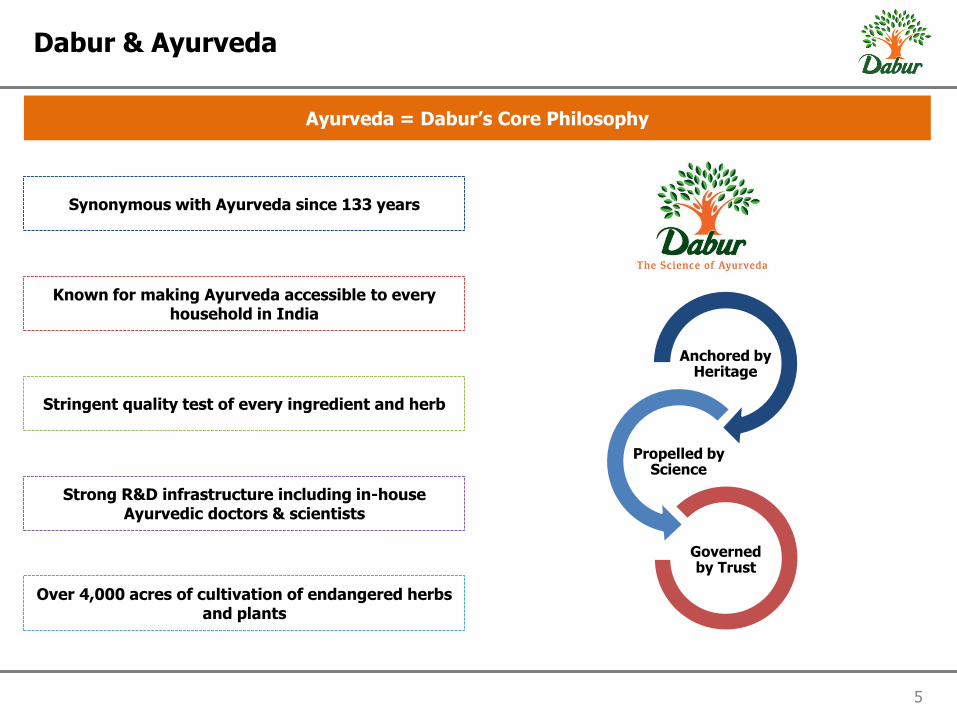
Dabur & Ayurveda
Ayurveda = Dabur’s Core Philosophy
Synonymous with Ayurveda since 133 years
Known for making Ayurveda accessible to every household in India
Stringent quality test of every ingredient and herb
Strong R&D infrastructure including in-house Ayurvedic doctors & scientists
Over 4,000 acres of cultivation of endangered herbs and plants
Anchored by Heritage
Propelled by Science
Governed by Trust
Ayurveda – Science of Life
6
Contents
Business Structure
India Business
The next growth wave
International Business
Annexure
Dabur – Overview
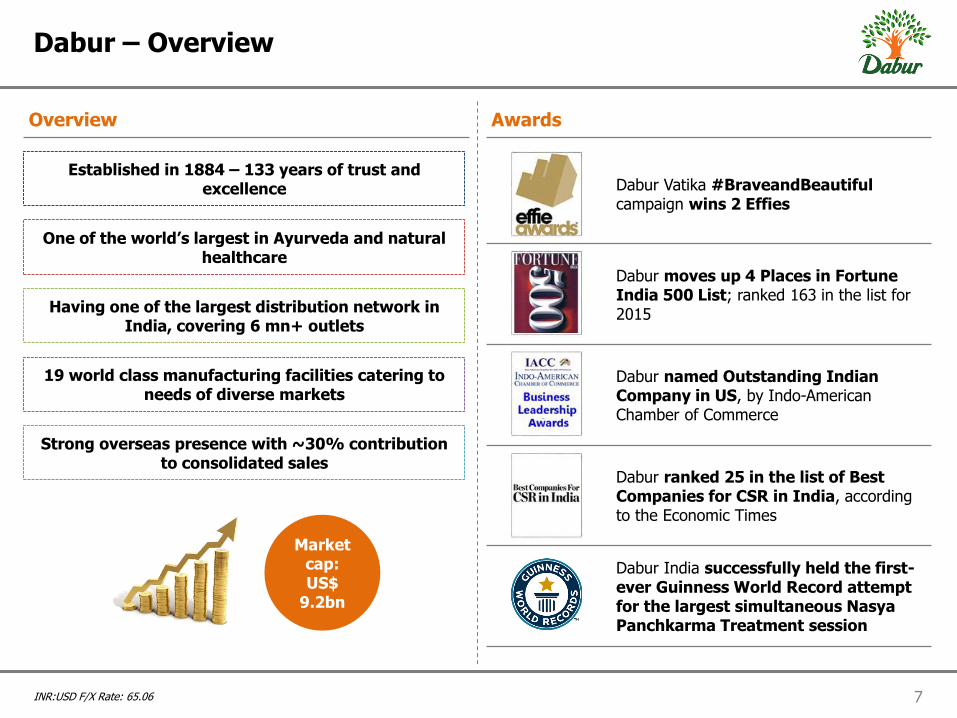
Dabur Vatika #BraveandBeautiful campaign wins 2 Effies
Dabur moves up 4 Places in Fortune India 500 List; ranked 163 in the list for 2015
Dabur named Outstanding Indian Company in US, by Indo-American Chamber of Commerce
Dabur ranked 25 in the list of Best Companies for CSR in India, according to the Economic Times
Dabur India successfully held the first-ever Guinness World Record attempt for the largest simultaneous Nasya Panchkarma Treatment session
7 INR:USD F/X Rate: 65.06
Dabur – Overview
Overview Awards
Established in 1884 – 133 years of trust and excellence
One of the world’s largest in Ayurveda and natural healthcare
Having one of the largest distribution network in India, covering 6 mn+ outlets
19 world class manufacturing facilities catering to needs of diverse markets
Strong overseas presence with ~30% contribution to consolidated sales
Market cap: US$
9.2bn
8
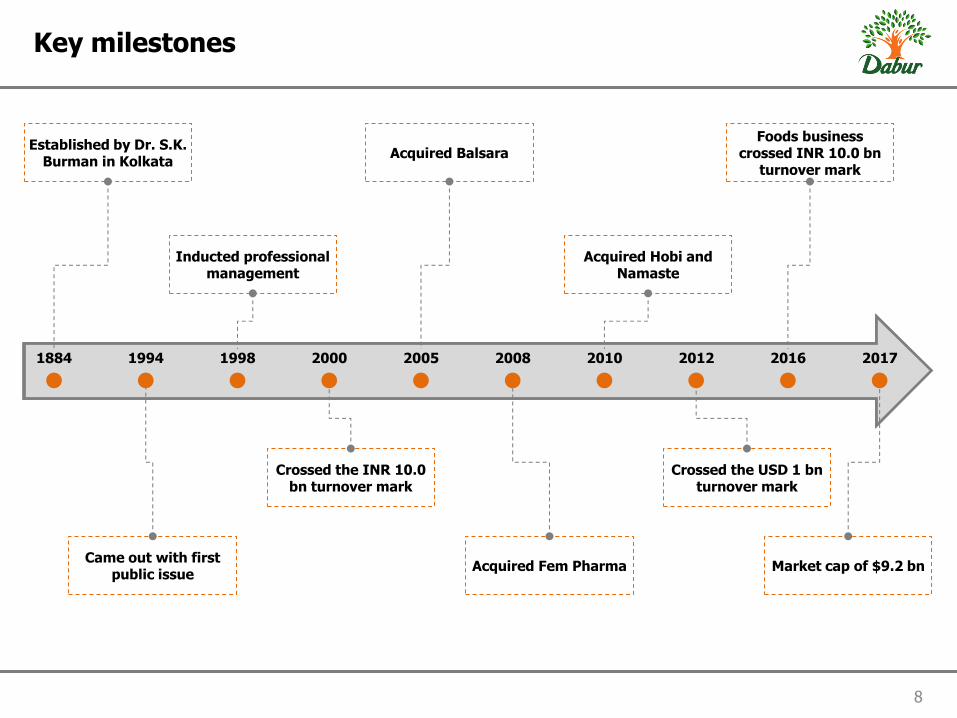
Key milestones
1884 1994 1998 2000 2005 2008 2010 2012 2016
Established by Dr. S.K. Burman in Kolkata
Came out with first public issue
Inducted professional management
Crossed the INR 10.0 bn turnover mark
Acquired Balsara
Acquired Fem Pharma
Acquired Hobi and Namaste
Crossed the USD 1 bn turnover mark
Foods business crossed INR 10.0 bn
turnover mark
2017
Market cap of $9.2 bn
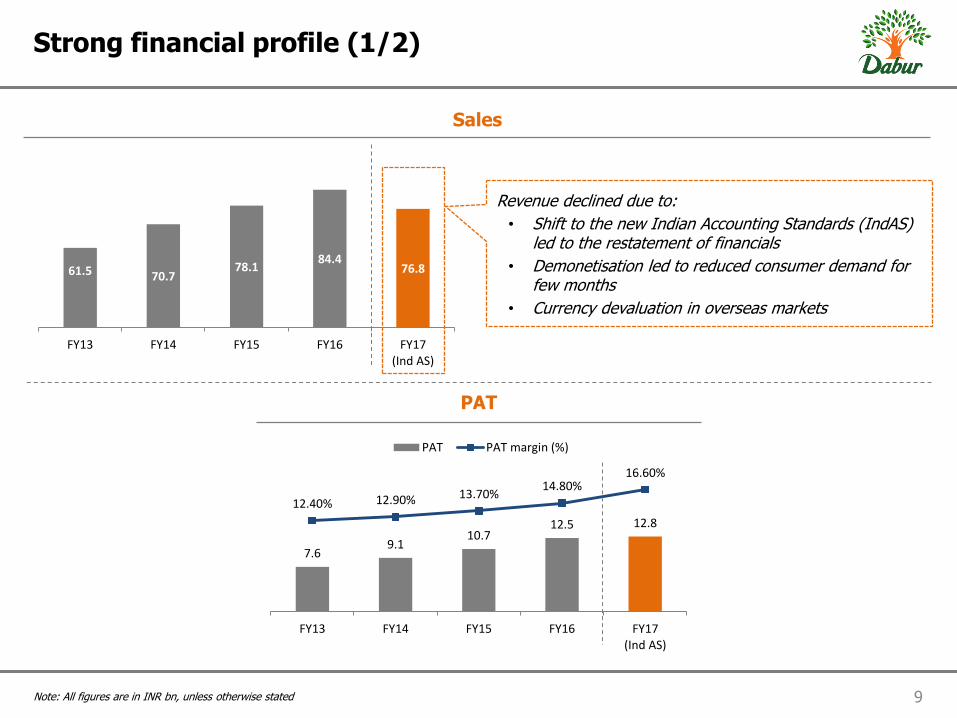
61.5 70.7 78.1
84.4 76.8
FY13 FY14 FY15 FY16 FY17(Ind AS)
7.6 9.1
10.7 12.5 12.8
12.40% 12.90% 13.70% 14.80%
16.60%
FY13 FY14 FY15 FY16 FY17(Ind AS)
PAT PAT margin (%)
9 Note: All figures are in INR bn, unless otherwise stated
Strong financial profile (1/2)
Sales
PAT
Revenue declined due to:
• Shift to the new Indian Accounting Standards (IndAS) led to the restatement of financials
• Demonetisation led to reduced consumer demand for few months
• Currency devaluation in overseas markets
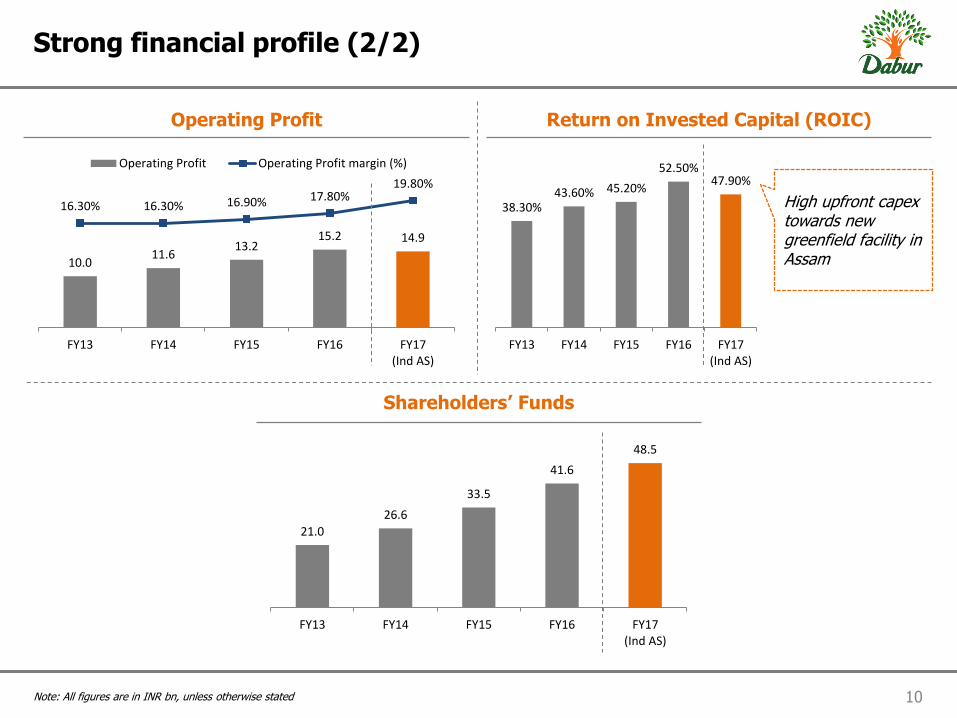
10.0 11.6
13.2 15.2 14.9
16.30% 16.30% 16.90% 17.80% 19.80%
FY13 FY14 FY15 FY16 FY17(Ind AS)
Operating Profit Operating Profit margin (%)
38.30% 43.60% 45.20%
52.50% 47.90%
FY13 FY14 FY15 FY16 FY17(Ind AS)
21.0
26.6
33.5
41.6
48.5
FY13 FY14 FY15 FY16 FY17(Ind AS)
10 Note: All figures are in INR bn, unless otherwise stated
Strong financial profile (2/2)
Operating Profit Return on Invested Capital (ROIC)
Shareholders’ Funds
High upfront capex towards new greenfield facility in Assam
11
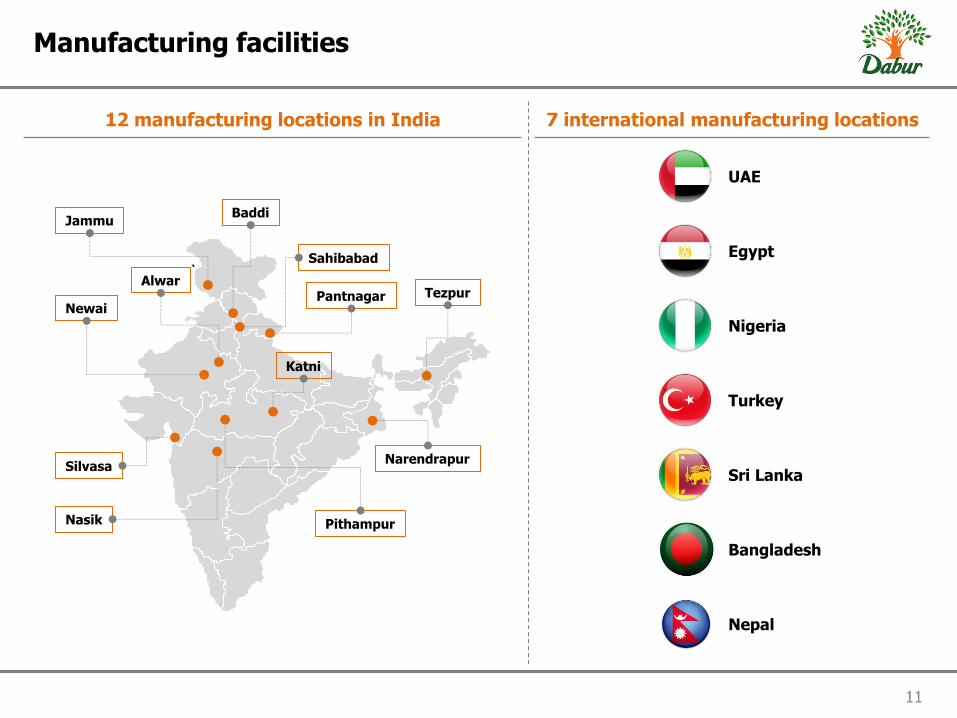
Manufacturing facilities
12 manufacturing locations in India 7 international manufacturing locations
UAE
Egypt
Nigeria
Turkey
Sri Lanka
Bangladesh
Nepal
`
Jammu Baddi
Pantnagar
Sahibabad
Tezpur
Nasik
Silvasa
Pithampur
Narendrapur
Katni
Alwar
Newai
12
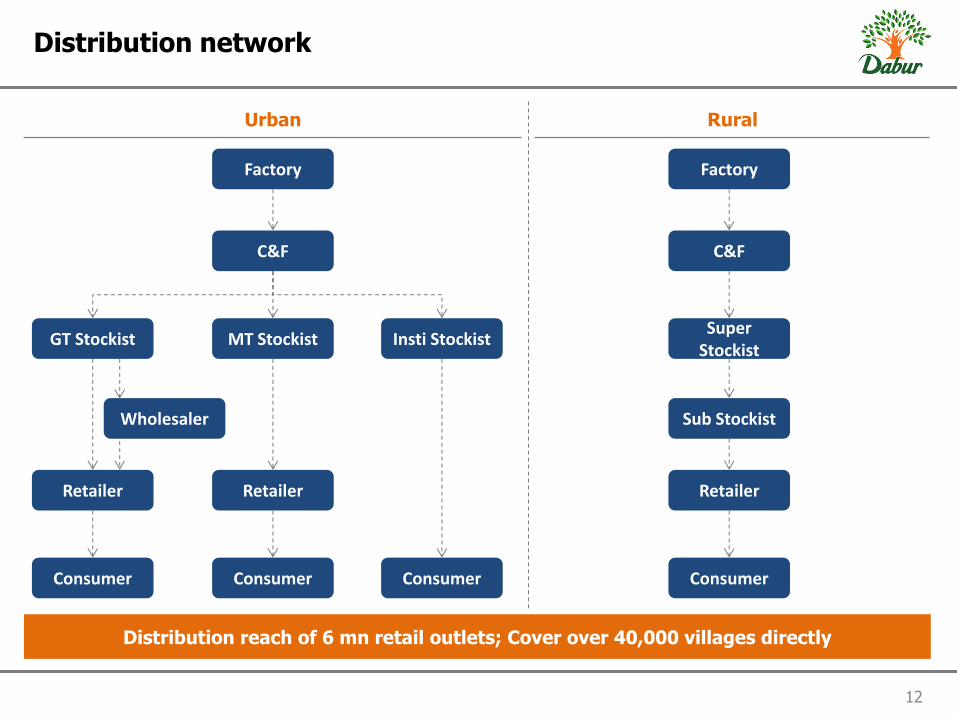
Distribution network
Rural Urban
Insti Stockist
Wholesaler
GT Stockist
Retailer Retailer
Consumer Consumer Consumer
Factory
C&F
MT Stockist
Retailer
Consumer
Factory
C&F
Super Stockist
Sub Stockist
Distribution reach of 6 mn retail outlets; Cover over 40,000 villages directly
Ayurveda – Science of Life
13
Contents
Business Structure
India Business
The next growth wave
International Business
Annexure
Dabur – Overview
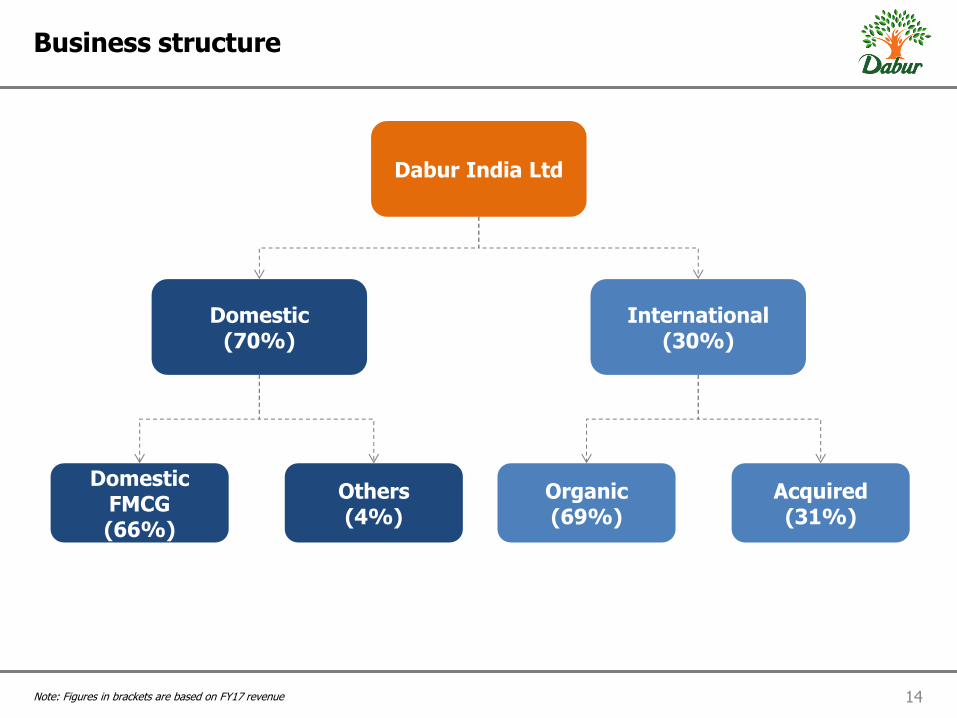
14 Note: Figures in brackets are based on FY17 revenue
Business structure
Dabur India Ltd
Domestic (70%)
International (30%)
Domestic FMCG (66%)
Others (4%)
Organic (69%)
Acquired (31%)
Ayurveda – Science of Life
15
Contents
Business Structure
India Business
The next growth wave
International Business
Annexure
Dabur – Overview
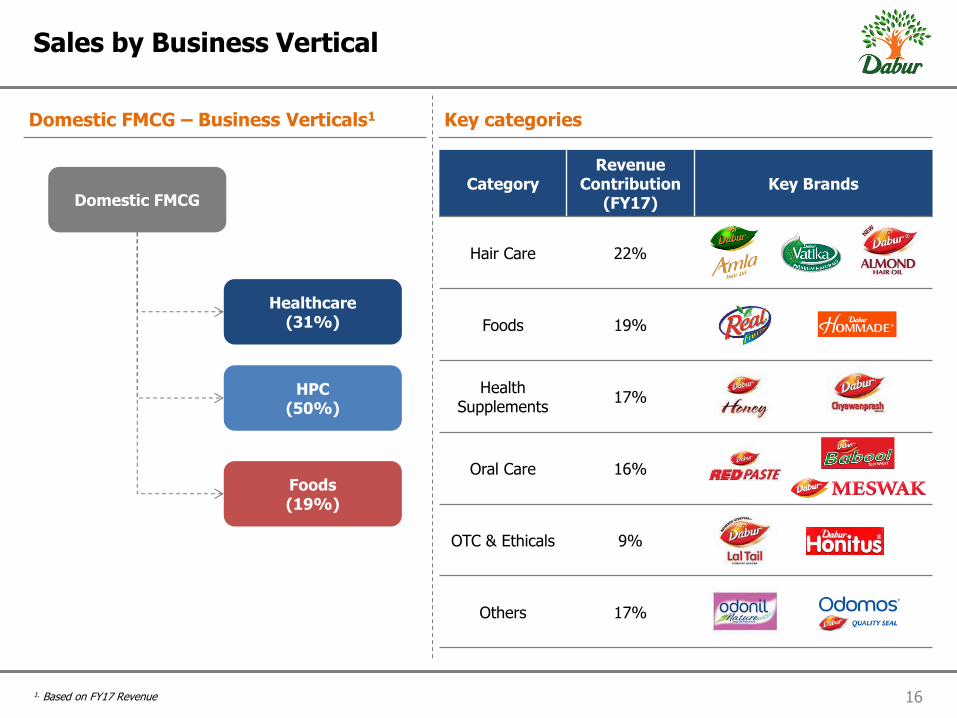
Category Revenue
Contribution (FY17)
Key Brands
Hair Care 22%
Foods 19%
Health Supplements
17%
Oral Care 16%
OTC & Ethicals 9%
Others 17%
16 1. Based on FY17 Revenue
Sales by Business Vertical
Domestic FMCG – Business Verticals1 Key categories
Domestic FMCG
Healthcare (31%)
HPC (50%)
Foods (19%)
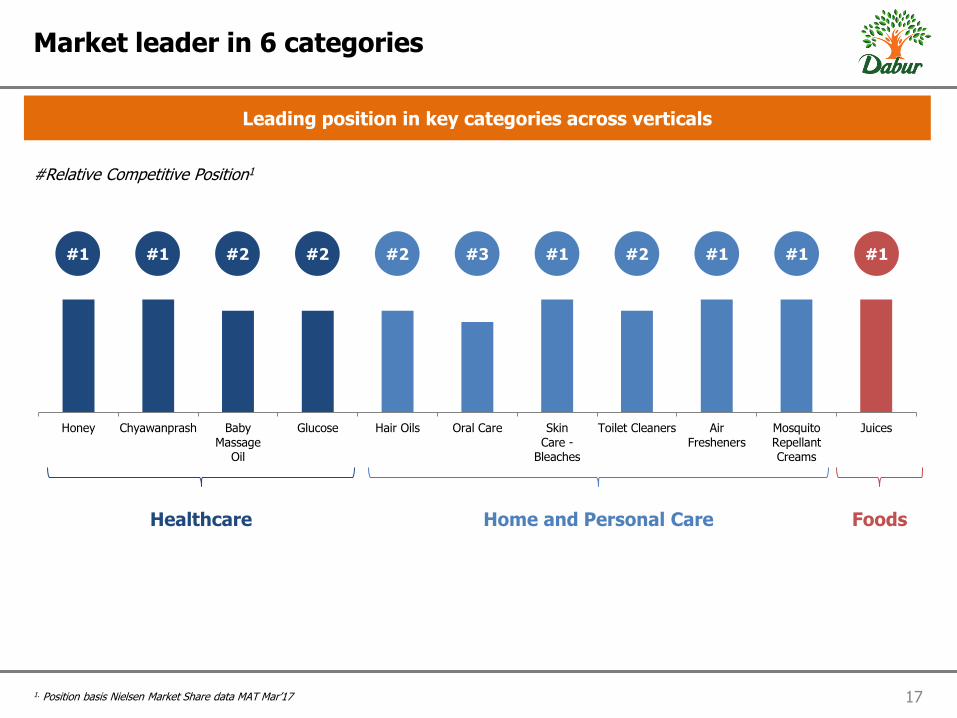
17 1. Position basis Nielsen Market Share data MAT Mar’17
Market leader in 6 categories
Leading position in key categories across verticals
Honey Chyawanprash BabyMassage
Oil
Glucose Hair Oils Oral Care SkinCare -
Bleaches
Toilet Cleaners AirFresheners
MosquitoRepellantCreams
Juices
Healthcare Home and Personal Care Foods
#1 #1 #2 #2 #2 #3 #1 #2 #1 #1 #1
#Relative Competitive Position1
18
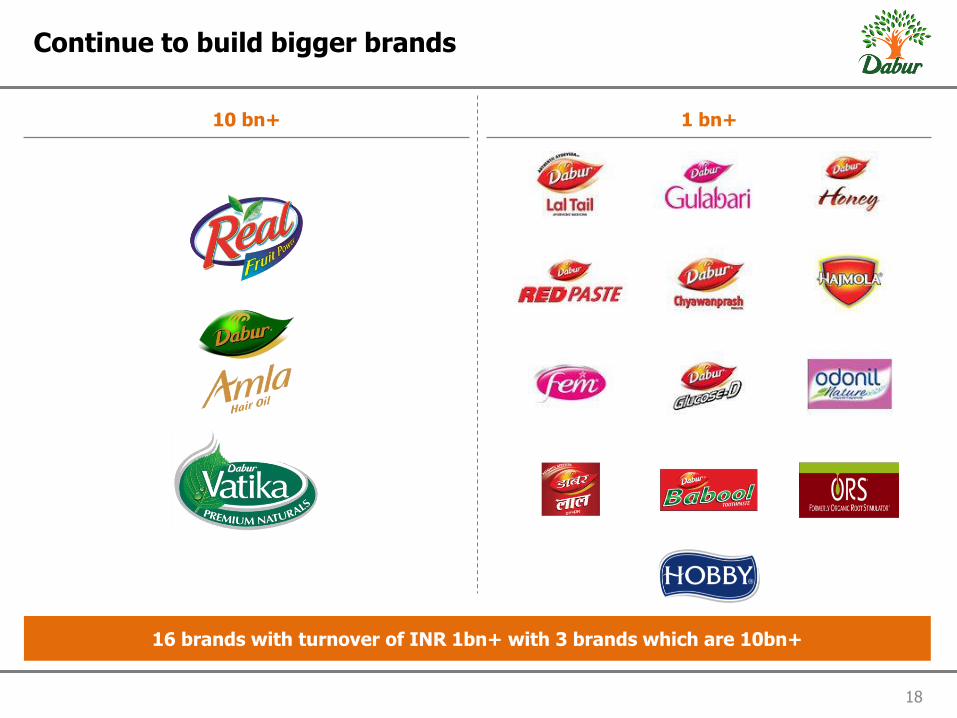
Continue to build bigger brands
10 bn+ 1 bn+
16 brands with turnover of INR 1bn+ with 3 brands which are 10bn+
19
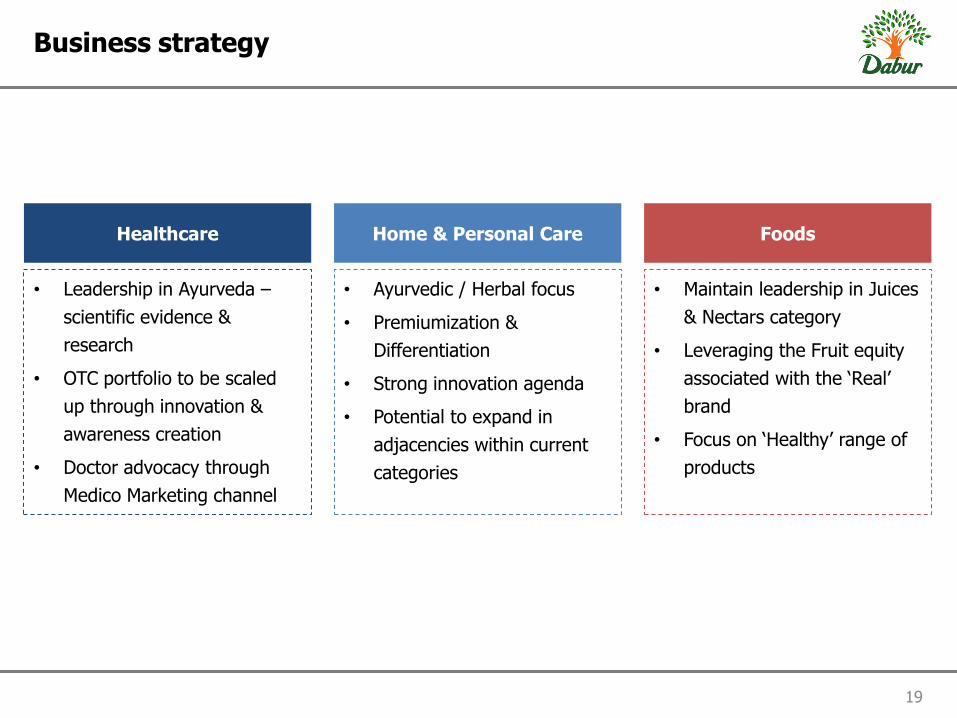
Business strategy
• Leadership in Ayurveda –
scientific evidence &
research
• OTC portfolio to be scaled
up through innovation &
awareness creation
• Doctor advocacy through
Medico Marketing channel
• Ayurvedic / Herbal focus
• Premiumization &
Differentiation
• Strong innovation agenda
• Potential to expand in
adjacencies within current
categories
• Maintain leadership in Juices
& Nectars category
• Leveraging the Fruit equity
associated with the ‘Real’
brand
• Focus on ‘Healthy’ range of
products
Healthcare Home & Personal Care Foods
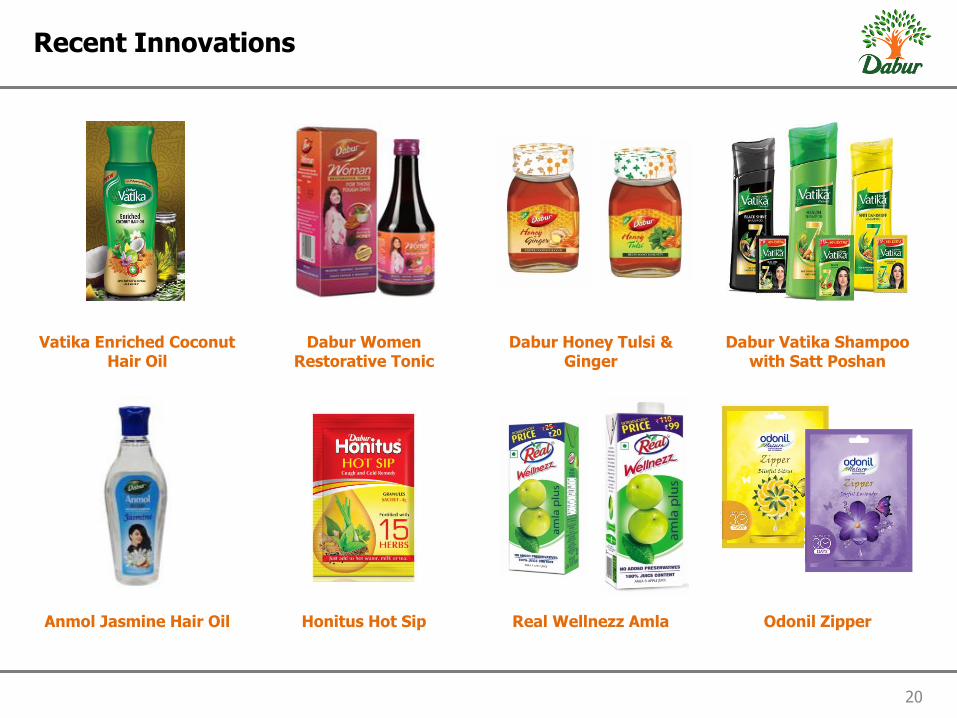
Vatika Enriched Coconut Hair Oil
Dabur Women Restorative Tonic
Dabur Honey Tulsi & Ginger
Dabur Vatika Shampoo with Satt Poshan
Anmol Jasmine Hair Oil
Honitus Hot Sip
Real Wellnezz Amla
Odonil Zipper
20
Recent Innovations
21
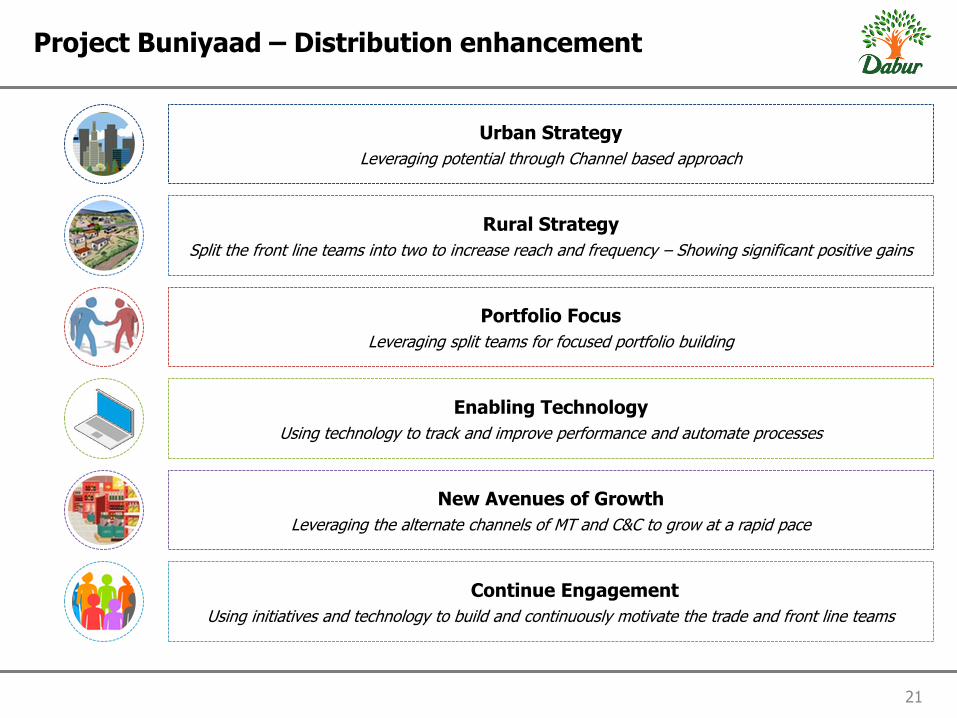
Project Buniyaad – Distribution enhancement
Urban Strategy
Leveraging potential through Channel based approach
Enabling Technology
Using technology to track and improve performance and automate processes
Portfolio Focus
Leveraging split teams for focused portfolio building
Rural Strategy
Split the front line teams into two to increase reach and frequency – Showing significant positive gains
New Avenues of Growth
Leveraging the alternate channels of MT and C&C to grow at a rapid pace
Continue Engagement
Using initiatives and technology to build and continuously motivate the trade and front line teams
Dabur Stresscom
Dabur Hepano
Dabur Honitus Cough Syrup
Dabur Laxirid
Dabur ImuDab
Dabur Lipistat
Dabur Woman Restorative Tonic
Dabur Chyawanprash
22
Project Lead – Doctor advocacy initiative
Project Lead was initiated in 2015 with an aim to create
the Doctor advocacy platform
• Building the detailing team – Started with 163
Medical Representatives, which is currently at 178;
plans to increase to 230 by year end
• Both Ayurvedic and Allopathic doctors being covered
– Number of doctors increased from 25,000 to
36,000 currently
• States covered – Initially Maharashta, UP and West
Bengal; Bihar and Orissa have been added in current
year
• Head of business inducted for Medical detailing and
marketing
• IT Platform and hand held devices for seamless
information flow and detailing support for the
medical reps
Key Products (Project Lead)
Ayurveda – Science of Life
23
Contents
Business Structure
India Business
The next growth wave
International Business
Annexure
Dabur – Overview
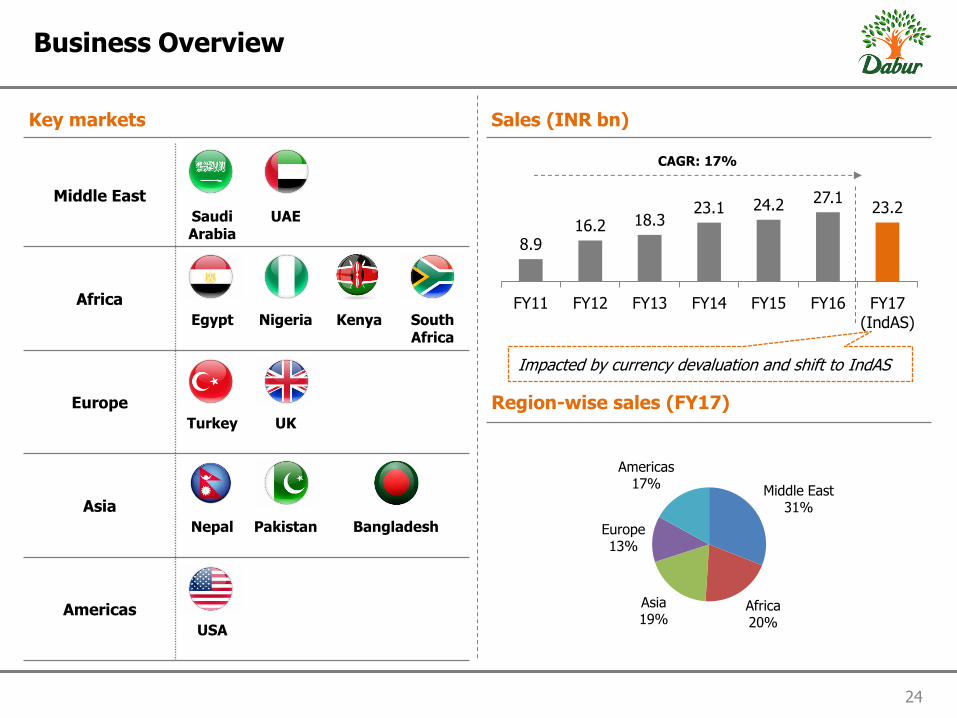
8.9 16.2 18.3
23.1 24.2 27.1 23.2
FY11 FY12 FY13 FY14 FY15 FY16 FY17(IndAS)
Middle East 31%
Africa 20%
Asia 19%
Europe 13%
Americas 17%
24
Business Overview
Key markets Sales (INR bn)
Region-wise sales (FY17)
Middle East
Saudi Arabia
UAE
Africa
Egypt
Nigeria
Kenya
South Africa
Europe
Turkey
UK
Asia
Nepal
Pakistan
Bangladesh
Americas
USA
CAGR: 17%
Impacted by currency devaluation and shift to IndAS
25
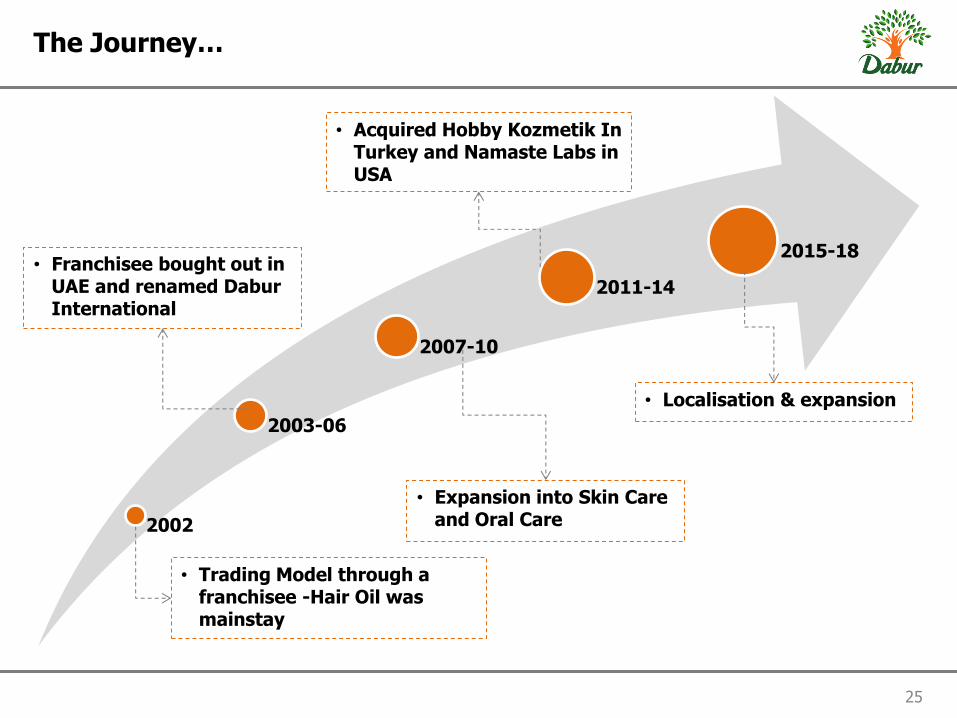
The Journey…
2002
2003-06
2007-10
2011-14
2015-18
• Trading Model through a franchisee -Hair Oil was mainstay
• Franchisee bought out in UAE and renamed Dabur International
• Expansion into Skin Care and Oral Care
• Acquired Hobby Kozmetik In Turkey and Namaste Labs in USA
• Localisation & expansion
26
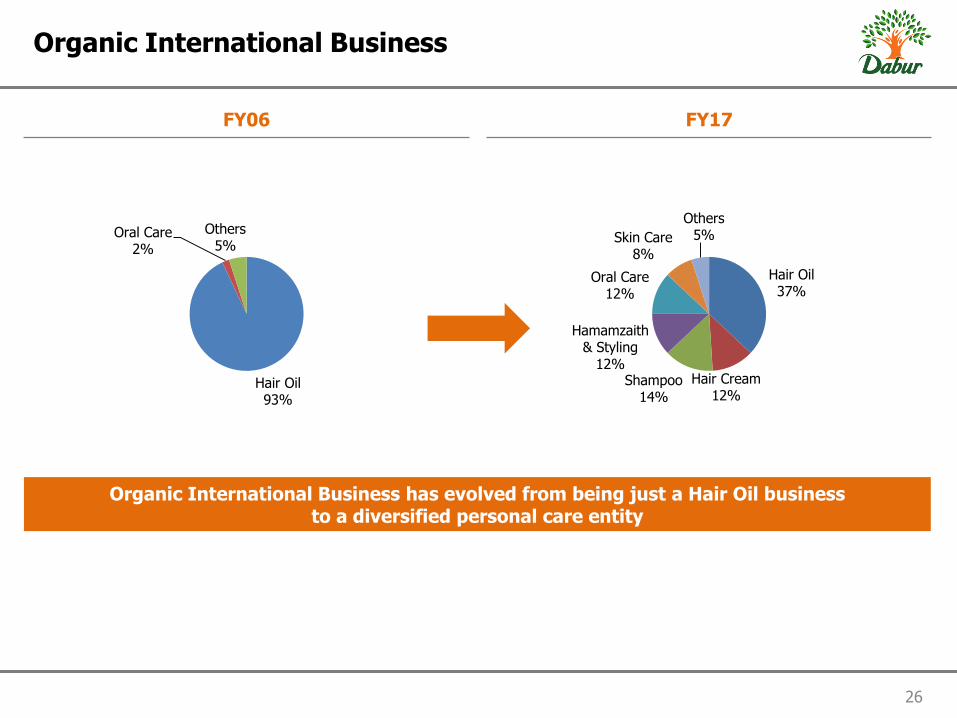
Organic International Business
FY06 FY17
Hair Oil 93%
Oral Care 2%
Others 5%
Hair Oil 37%
Hair Cream 12%
Shampoo 14%
Hamamzaith & Styling
12%
Oral Care 12%
Skin Care 8%
Others 5%
Organic International Business has evolved from being just a Hair Oil business to a diversified personal care entity
27
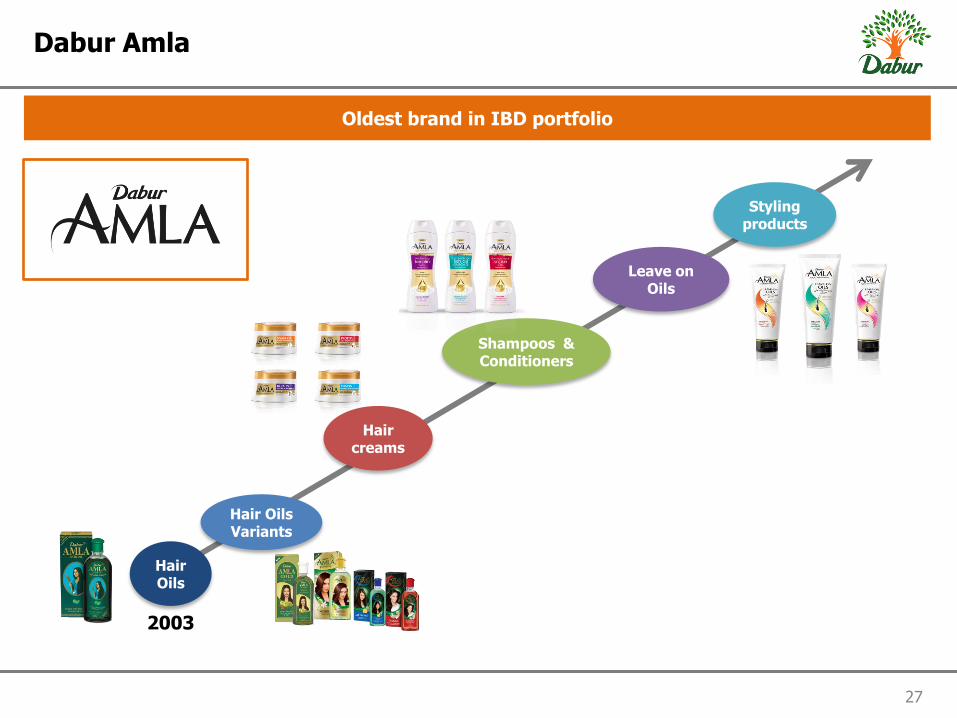
Dabur Amla
Oldest brand in IBD portfolio
Hair Oils
Hair creams
Shampoos & Conditioners
Leave on Oils
Styling products
2003
Hair Oils Variants
28
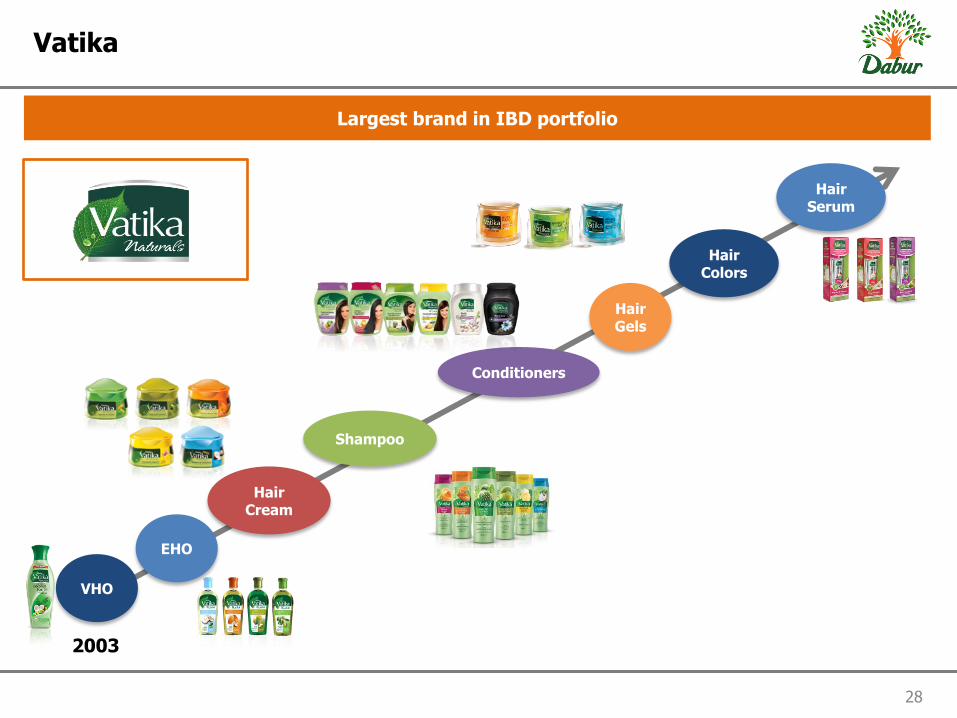
Vatika
Largest brand in IBD portfolio
VHO
EHO
Shampoo
Conditioners
Hair Gels
Hair Colors
Hair Cream
Hair Serum
2003
29
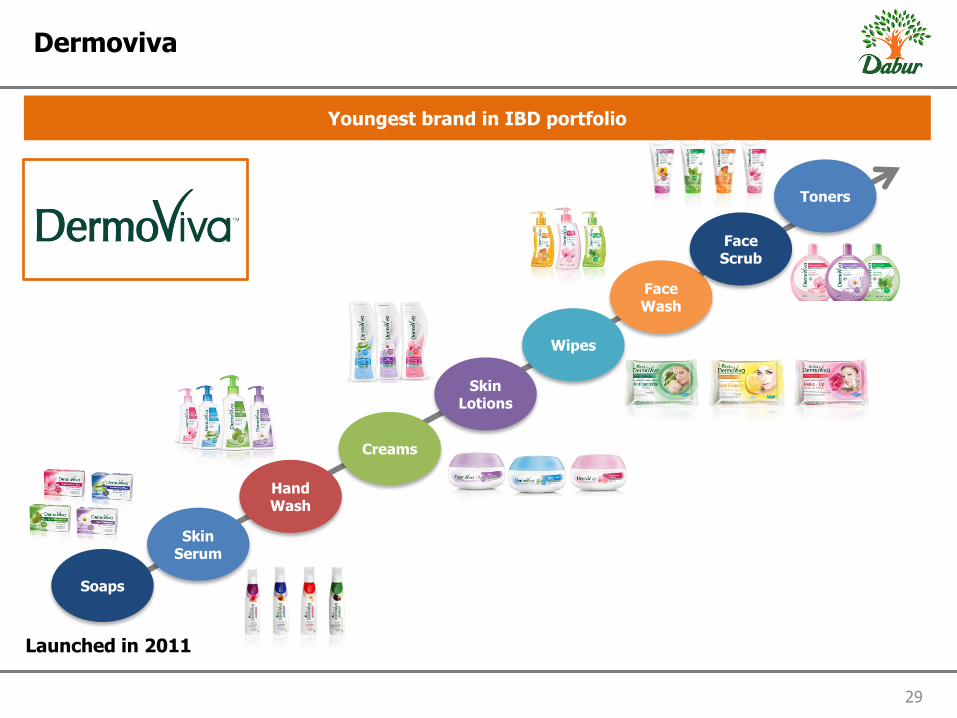
Dermoviva
Youngest brand in IBD portfolio
Launched in 2011
Soaps
Skin Serum
Hand Wash
Creams
Skin Lotions
Wipes
Face Wash
Face Scrub
Toners
30
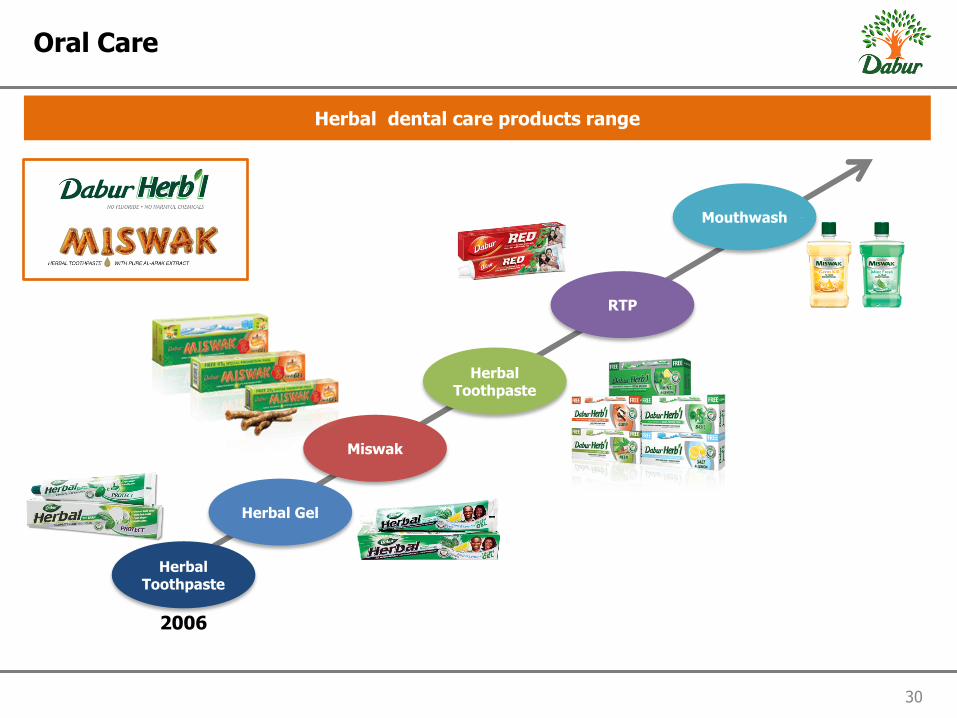
Oral Care
Herbal dental care products range
Herbal Toothpaste
Miswak
Herbal Toothpaste
RTP
Mouthwash
2006
Herbal Gel
31
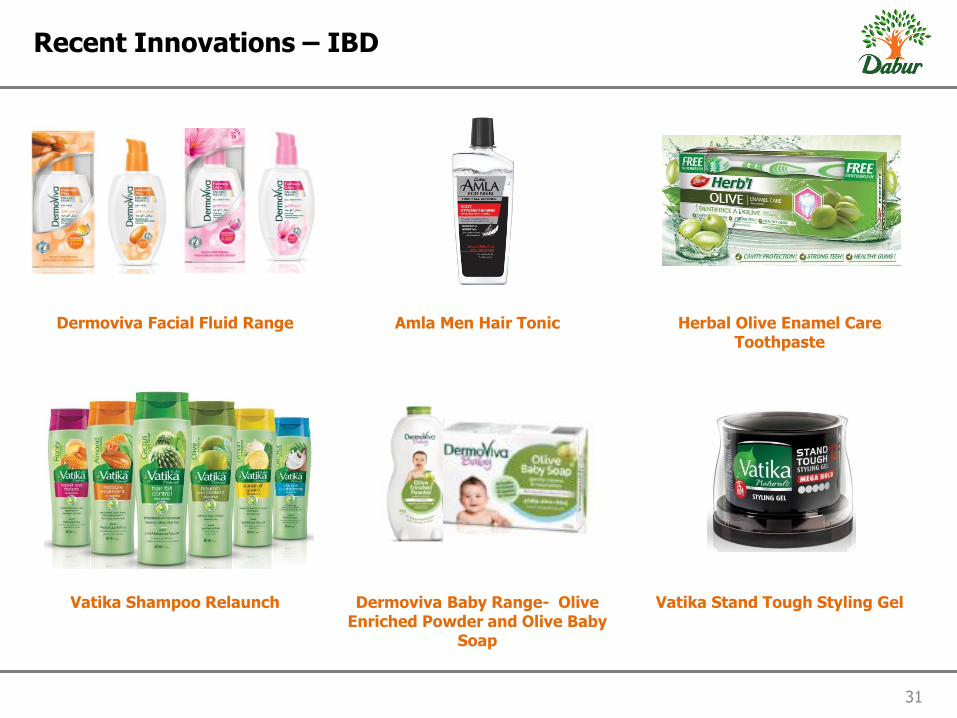
Recent Innovations – IBD
Dermoviva Facial Fluid Range
Amla Men Hair Tonic
Herbal Olive Enamel Care Toothpaste
Vatika Shampoo Relaunch
Dermoviva Baby Range- Olive Enriched Powder and Olive Baby
Soap
Vatika Stand Tough Styling Gel
32
IBD – Business Strategy
Brands positioned on “Herbal and Natural” platform
Local supply chain & management offers strategic advantage
Leveraging Digital platform to enhance consumer awareness and brand visibility
Strong investments in brands and business
Product portfolio customized to local preferences
Ayurveda – Science of Life
33
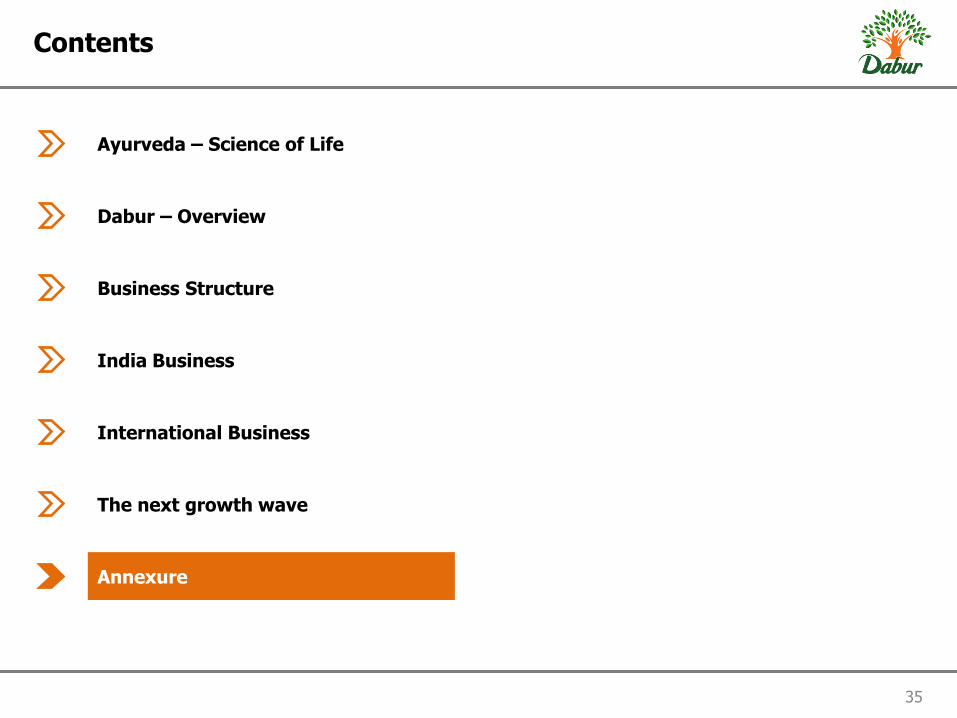
Contents
Business Structure
India Business
The next growth wave
International Business
Annexure
Dabur – Overview
34
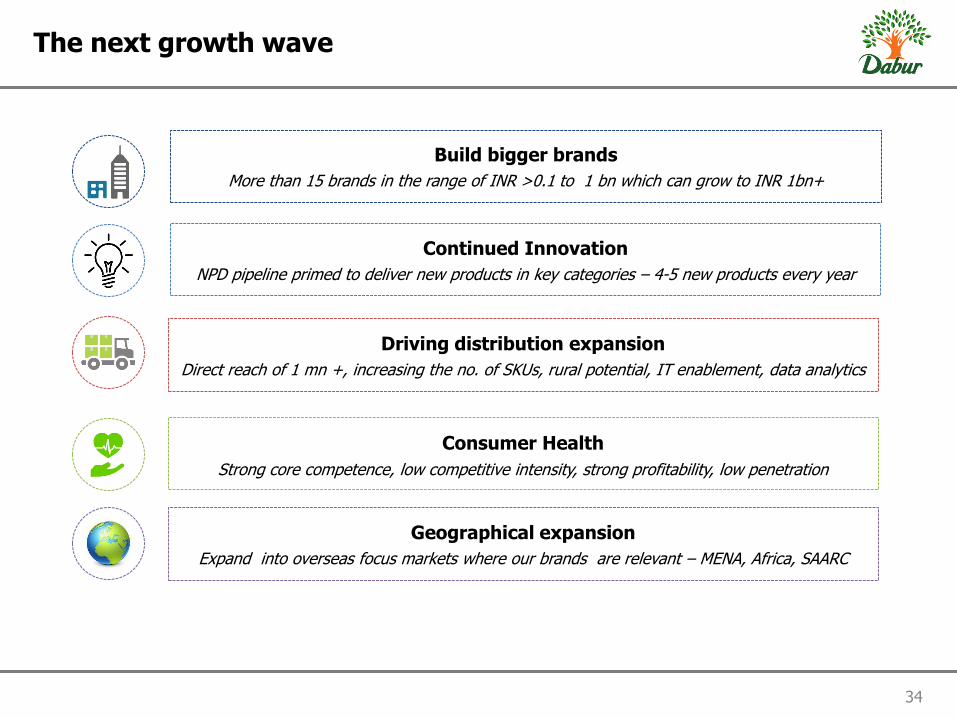
The next growth wave
Build bigger brands
More than 15 brands in the range of INR >0.1 to 1 bn which can grow to INR 1bn+
Geographical expansion
Expand into overseas focus markets where our brands are relevant – MENA, Africa, SAARC
Consumer Health Strong core competence, low competitive intensity, strong profitability, low penetration
Driving distribution expansion
Direct reach of 1 mn +, increasing the no. of SKUs, rural potential, IT enablement, data analytics
Continued Innovation
NPD pipeline primed to deliver new products in key categories – 4-5 new products every year
Ayurveda – Science of Life
35
Contents
Business Structure
India Business
The next growth wave
International Business
Annexure
Dabur – Overview
361.9 357.3
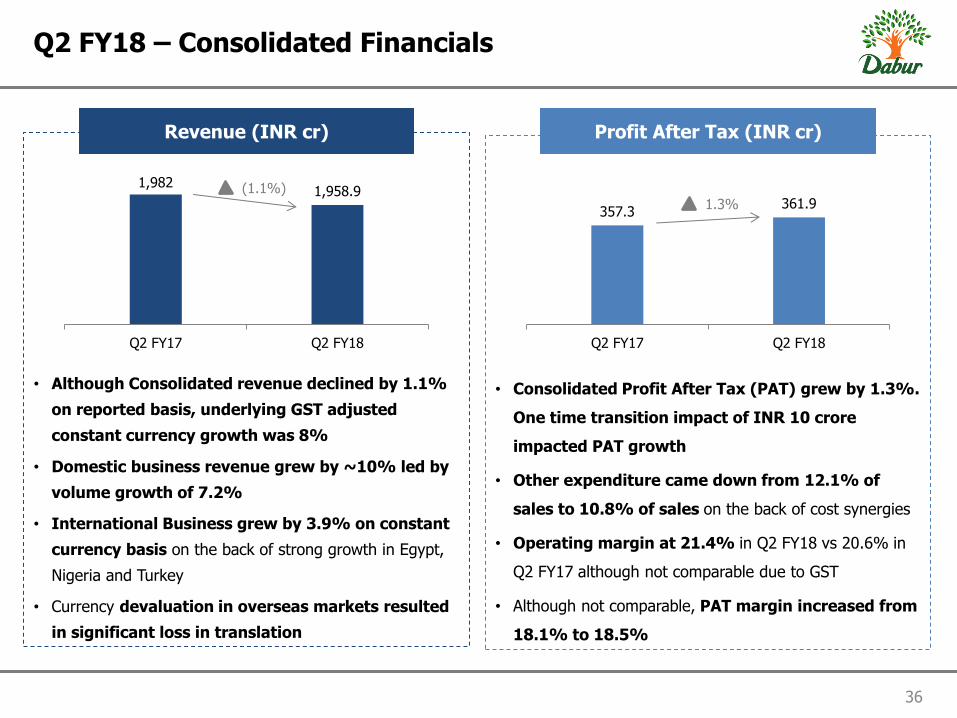
Q2 FY18Q2 FY17
• Consolidated Profit After Tax (PAT) grew by 1.3%.
One time transition impact of INR 10 crore
impacted PAT growth
• Other expenditure came down from 12.1% of
sales to 10.8% of sales on the back of cost synergies
• Operating margin at 21.4% in Q2 FY18 vs 20.6% in
Q2 FY17 although not comparable due to GST
• Although not comparable, PAT margin increased from
18.1% to 18.5%
36
Q2 FY18 – Consolidated Financials
• Although Consolidated revenue declined by 1.1%
on reported basis, underlying GST adjusted
constant currency growth was 8%
• Domestic business revenue grew by ~10% led by
volume growth of 7.2%
• International Business grew by 3.9% on constant
currency basis on the back of strong growth in Egypt,
Nigeria and Turkey
• Currency devaluation in overseas markets resulted
in significant loss in translation
Revenue (INR cr) Profit After Tax (INR cr)
1,958.9 1,982
Q2 FY18Q2 FY17
(1.1%) 1.3%
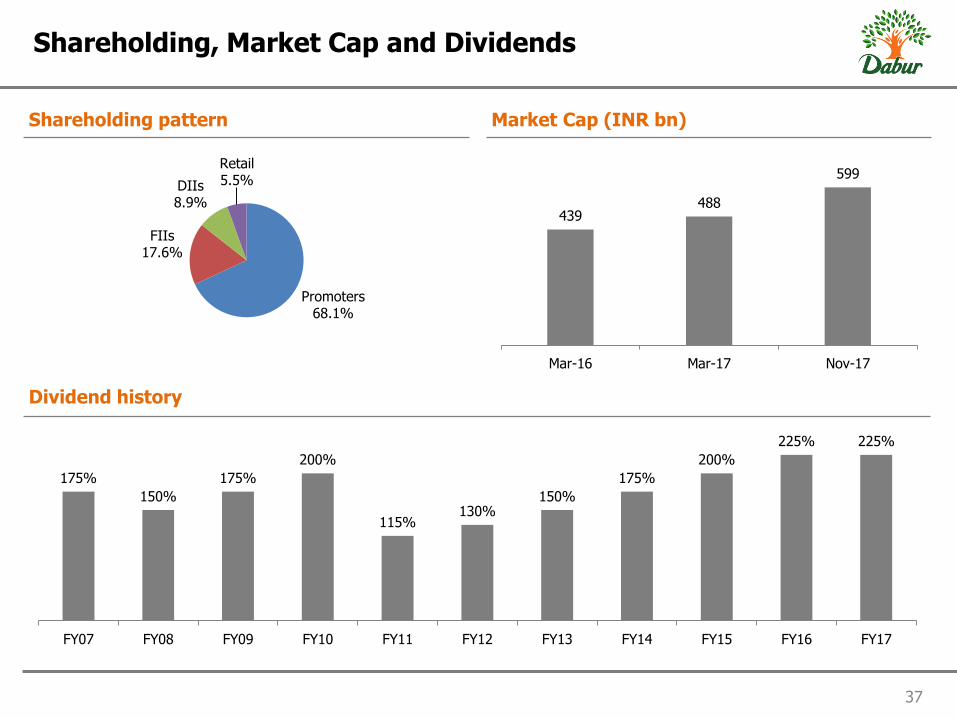
175%
150%
175%
200%
115% 130%
150%
175%
200%
225% 225%
FY07 FY08 FY09 FY10 FY11 FY12 FY13 FY14 FY15 FY16 FY17
Promoters 68.1%
FIIs 17.6%
DIIs 8.9%
Retail 5.5%
439 488
599
Mar-16 Mar-17 Nov-17
37
Shareholding, Market Cap and Dividends
Shareholding pattern Market Cap (INR bn)
Dividend history
38
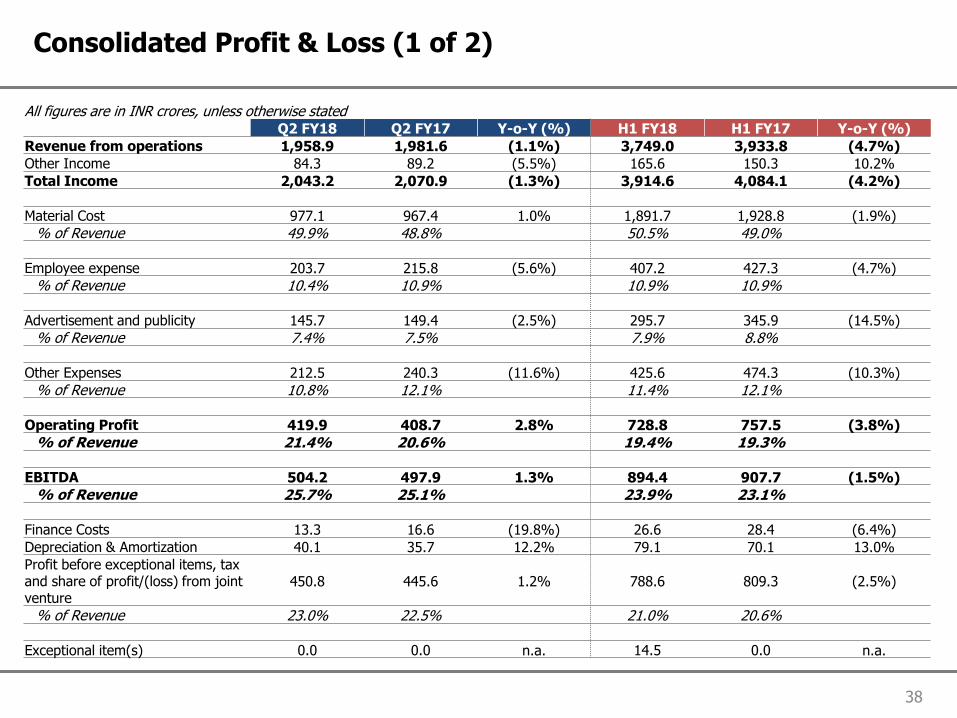
Consolidated Profit & Loss (1 of 2)
All figures are in INR crores, unless otherwise stated Q2 FY18 Q2 FY17 Y-o-Y (%) H1 FY18 H1 FY17 Y-o-Y (%)
Revenue from operations 1,958.9 1,981.6 (1.1%) 3,749.0 3,933.8 (4.7%)
Other Income 84.3 89.2 (5.5%) 165.6 150.3 10.2%
Total Income 2,043.2 2,070.9 (1.3%) 3,914.6 4,084.1 (4.2%)
Material Cost 977.1 967.4 1.0% 1,891.7 1,928.8 (1.9%)
% of Revenue 49.9% 48.8% 50.5% 49.0%
Employee expense 203.7 215.8 (5.6%) 407.2 427.3 (4.7%)
% of Revenue 10.4% 10.9% 10.9% 10.9%
Advertisement and publicity 145.7 149.4 (2.5%) 295.7 345.9 (14.5%)
% of Revenue 7.4% 7.5% 7.9% 8.8%
Other Expenses 212.5 240.3 (11.6%) 425.6 474.3 (10.3%)
% of Revenue 10.8% 12.1% 11.4% 12.1%
Operating Profit 419.9 408.7 2.8% 728.8 757.5 (3.8%)
% of Revenue 21.4% 20.6% 19.4% 19.3%
EBITDA 504.2 497.9 1.3% 894.4 907.7 (1.5%)
% of Revenue 25.7% 25.1% 23.9% 23.1%
Finance Costs 13.3 16.6 (19.8%) 26.6 28.4 (6.4%)
Depreciation & Amortization 40.1 35.7 12.2% 79.1 70.1 13.0%
Profit before exceptional items, tax and share of profit/(loss) from joint venture
450.8 445.6 1.2% 788.6 809.3 (2.5%)
% of Revenue 23.0% 22.5% 21.0% 20.6%
Exceptional item(s) 0.0 0.0 n.a. 14.5 0.0 n.a.
39
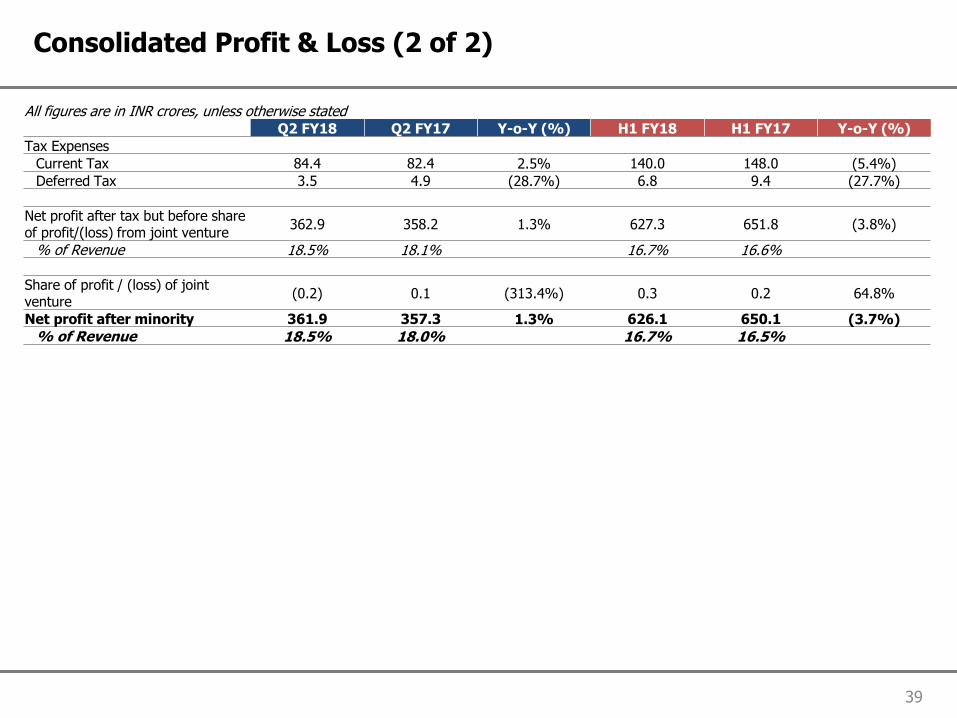
Consolidated Profit & Loss (2 of 2)
All figures are in INR crores, unless otherwise stated Q2 FY18 Q2 FY17 Y-o-Y (%) H1 FY18 H1 FY17 Y-o-Y (%)
Tax Expenses
Current Tax 84.4 82.4 2.5% 140.0 148.0 (5.4%)
Deferred Tax 3.5 4.9 (28.7%) 6.8 9.4 (27.7%)
Net profit after tax but before share of profit/(loss) from joint venture
362.9 358.2 1.3% 627.3 651.8 (3.8%)
% of Revenue 18.5% 18.1% 16.7% 16.6%
Share of profit / (loss) of joint venture
(0.2) 0.1 (313.4%) 0.3 0.2 64.8%
Net profit after minority 361.9 357.3 1.3% 626.1 650.1 (3.7%)
% of Revenue 18.5% 18.0% 16.7% 16.5%
40
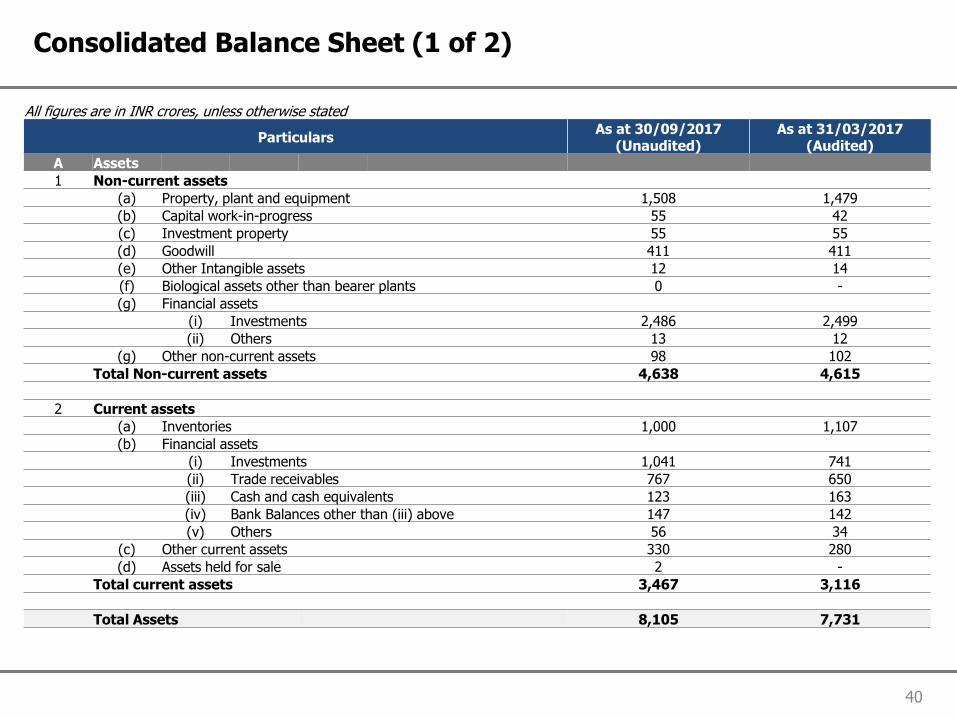
Consolidated Balance Sheet (1 of 2)
All figures are in INR crores, unless otherwise stated
Particulars As at 30/09/2017
(Unaudited) As at 31/03/2017
(Audited)
A Assets
1 Non-current assets
(a) Property, plant and equipment 1,508 1,479
(b) Capital work-in-progress 55 42
(c) Investment property 55 55
(d) Goodwill 411 411
(e) Other Intangible assets 12 14
(f) Biological assets other than bearer plants 0 -
(g) Financial assets
(i) Investments 2,486 2,499
(ii) Others 13 12
(g) Other non-current assets 98 102
Total Non-current assets 4,638 4,615
2 Current assets
(a) Inventories 1,000 1,107
(b) Financial assets
(i) Investments 1,041 741
(ii) Trade receivables 767 650
(iii) Cash and cash equivalents 123 163
(iv) Bank Balances other than (iii) above 147 142
(v) Others 56 34
(c) Other current assets 330 280
(d) Assets held for sale 2 -
Total current assets 3,467 3,116
Total Assets 8,105 7,731
41
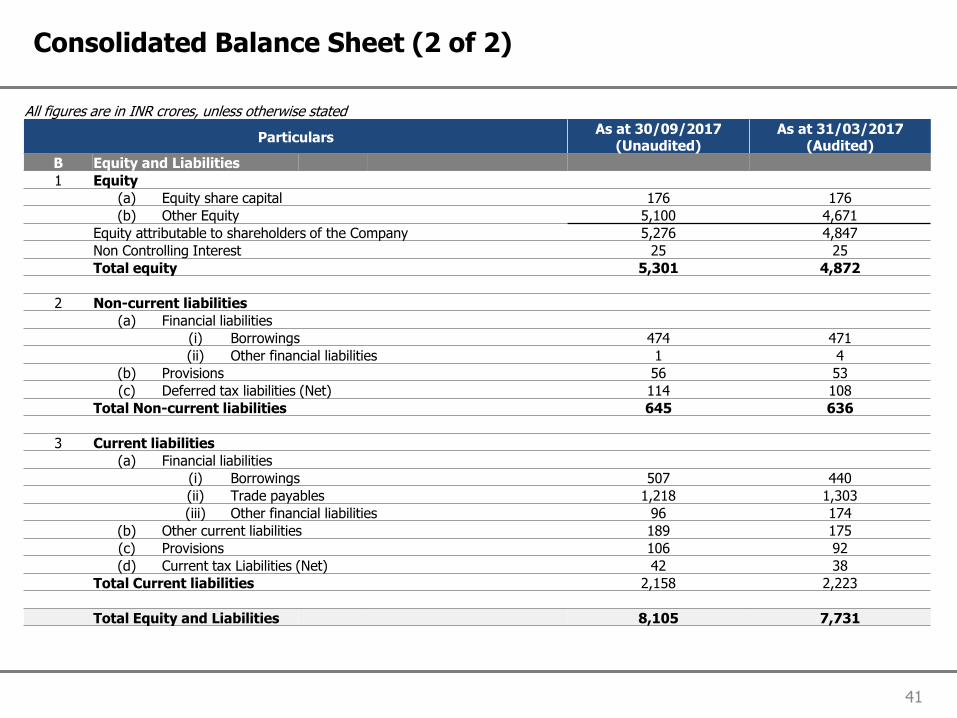
Consolidated Balance Sheet (2 of 2)
All figures are in INR crores, unless otherwise stated
Particulars As at 30/09/2017
(Unaudited) As at 31/03/2017
(Audited)
B Equity and Liabilities
1 Equity
(a) Equity share capital 176 176
(b) Other Equity 5,100 4,671
Equity attributable to shareholders of the Company 5,276 4,847
Non Controlling Interest 25 25
Total equity 5,301 4,872
2 Non-current liabilities
(a) Financial liabilities
(i) Borrowings 474 471
(ii) Other financial liabilities 1 4
(b) Provisions 56 53
(c) Deferred tax liabilities (Net) 114 108
Total Non-current liabilities 645 636
3 Current liabilities
(a) Financial liabilities
(i) Borrowings 507 440
(ii) Trade payables 1,218 1,303
(iii) Other financial liabilities 96 174
(b) Other current liabilities 189 175
(c) Provisions 106 92
(d) Current tax Liabilities (Net) 42 38
Total Current liabilities 2,158 2,223
Total Equity and Liabilities 8,105 7,731
42
For more information & updates, visit http://www.dabur.com/in/en-us/investor