Embed Size (px)
Citation preview
Building and Sharing Vital Infrastructure
Investor Presentation
February 2018
DisclaimerBy attending the meeting where this presentation is made, or by reading the presentation materials, you agree to be bound by the following limitations:
The information in this presentation has been prepared by Bharti Infratel Limited (the “Company”) for use in presentations by the Company at investor meetings and does not constitute a
recommendation regarding the securities of the Company.
No representation or warranty, express or implied, is made as to, and no reliance should be placed on, the fairness, accuracy, completeness or correctness of the information, or opinions
contained herein. Neither the Company nor any of its advisors or representatives shall have any responsibility or liability whatsoever (for negligence or otherwise) for any loss howsoever
arising from any use of this presentation or its contents or otherwise arising in connection with this presentation. The information set out herein may be subject to updating, completion,
revision, verification and amendment and such information may change materially. Neither the Company nor any of its advisors or representatives is under any obligation to update or keep
current the information contained herein.
The information communicated in this presentation contains certain statements that are or may be forward looking. These statements typically contain words such as "will", "expects" and
"anticipates" and words of similar import. By their nature forward looking statements involve risk and uncertainty because they relate to events and depend on circumstances that will occur in
the future. Any investment in securities issued by the Company will also involve certain risks. There may be additional material risks that are currently not considered to be material or of which
the Company and its advisors or representatives are unaware. Against the background of these uncertainties, readers should not unduly rely on these forward-looking statements. The
Company, its advisors and representatives assume no responsibility to update forward-looking statements or to adapt them to future events or developments.
This presentation has been prepared for informational purposes only. This presentation does not constitute a prospectus under the (Indian) Companies Act, 1956 and will not be registered
with any registrar of companies. Furthermore, this presentation is not and should not be construed as an offer or a solicitation of an offer to buy securities for sale in the India.
This presentation and the information contained herein does not constitute or form part of any offer for sale or subscription of or solicitation or invitation of any offer to buy or subscribe for any
securities of the Company, nor should it or any part of it form the basis of, or be relied on in connection with, any contract or commitment whatsoever. The securities of the Company have not
been and will not be registered under the U.S. Securities Act of 1933, as amended (the "Securities Act"), and may not be offered, sold or delivered within the United States or to U.S. persons
absent from registration under or an applicable exemption from the registration requirements of the United States securities laws. This presentation and the information contained herein is
being furnished to you solely for your information and may not be reproduced or redistributed to any other person, in whole or in part. In particular, neither the information contained in this
presentation nor any copy hereof may be, directly or indirectly, taken or transmitted into or distributed in the U.S., Canada, Australia, Japan or any other jurisdiction which prohibits the same
except in compliance with applicable securities laws. Any failure to comply with this restriction may constitute a violation of the United States or other national securities laws. No money,
securities or other consideration is being solicited, and, if sent in response to this presentation or the information contained herein, will not be accepted.
By reviewing this presentation, you are deemed to have represented and agreed that you and any person you represent are either (a) a qualified institutional buyer (within the meaning of
Regulation 144A under the Securities Act) and a qualified purchaser (within the meaning of the U.S. Investment Company Act of 1940, as amended), or (b) not a U.S. person (as defined in
Regulation S under the Securities Act) and are outside of the United States and not acting for the account or benefit of a U.S. person.
2 of 34
Table of Contents
Company Overview
Industry Overview
In Summary
Business Model Strengths
3 of 34

Company Overview
4 of 34
Bharti Infratel – Who We Are?
A Leading Tower Infrastructure Operator
Pan India Presence across all 22 Telecommunications Circles
Indus Towers – JV between Bharti Infratel, Vodafone and Aditya Birla Telecom
Top 3 Operators Anchor Customers & Relationships with all other Operators
Marquee promoter and investors
5 of 34
Indus, 37.1%
Bharti Infratel (standalone)
11.6%
BSNL/MTNL9.9%
RTIL11.6%
GTL Infra6.7%
Viom14.8%
Others8.3%
Indus31.0%
Bharti Infratel (standalone)
9.8%BSNL/MTNL18.2%
RTIL11.6%
GTL Infra8.0%
Viom11.3%
Others10.1%
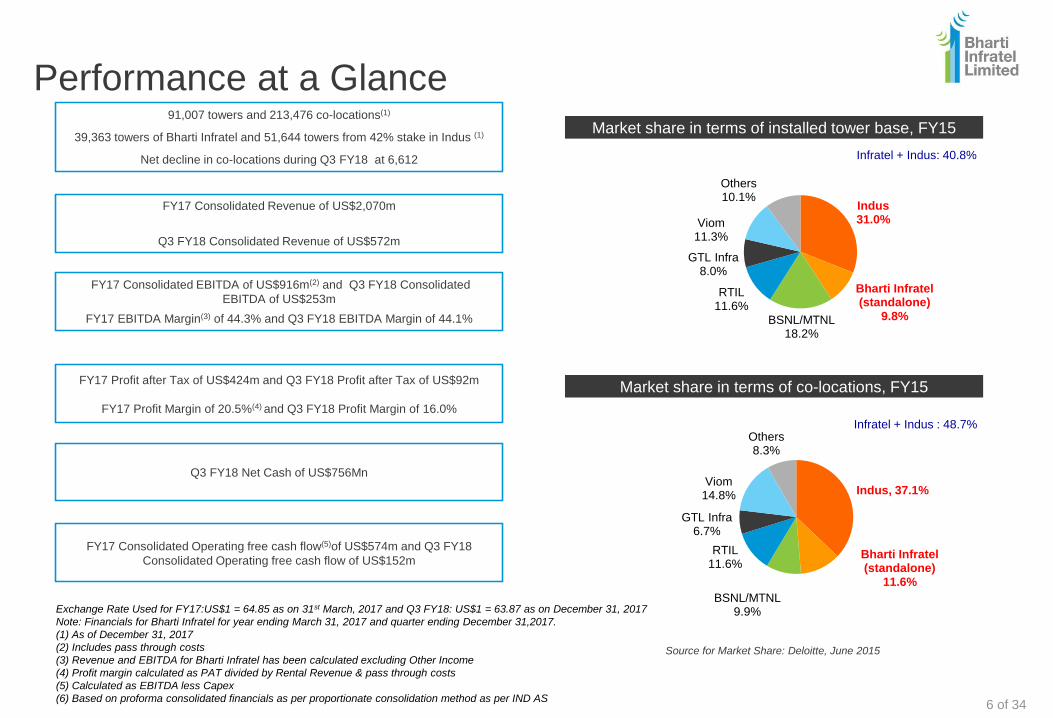
Performance at a Glance
FY17 Consolidated Revenue of US$2,070m
Q3 FY18 Consolidated Revenue of US$572m
FY17 Consolidated EBITDA of US$916m(2) and Q3 FY18 Consolidated
EBITDA of US$253m
FY17 EBITDA Margin(3) of 44.3% and Q3 FY18 EBITDA Margin of 44.1%
FY17 Profit after Tax of US$424m and Q3 FY18 Profit after Tax of US$92m
FY17 Profit Margin of 20.5%(4) and Q3 FY18 Profit Margin of 16.0%
Q3 FY18 Net Cash of US$756Mn
FY17 Consolidated Operating free cash flow(5)of US$574m and Q3 FY18
Consolidated Operating free cash flow of US$152m
91,007 towers and 213,476 co-locations(1)
39,363 towers of Bharti Infratel and 51,644 towers from 42% stake in Indus (1)
Net decline in co-locations during Q3 FY18 at 6,612
Market share in terms of installed tower base, FY15
Market share in terms of co-locations, FY15
Infratel + Indus: 40.8%
Infratel + Indus : 48.7%
Source for Market Share: Deloitte, June 2015
Exchange Rate Used for FY17:US$1 = 64.85 as on 31st March, 2017 and Q3 FY18: US$1 = 63.87 as on December 31, 2017
Note: Financials for Bharti Infratel for year ending March 31, 2017 and quarter ending December 31,2017.
(1) As of December 31, 2017
(2) Includes pass through costs
(3) Revenue and EBITDA for Bharti Infratel has been calculated excluding Other Income
(4) Profit margin calculated as PAT divided by Rental Revenue & pass through costs
(5) Calculated as EBITDA less Capex
(6) Based on proforma consolidated financials as per proportionate consolidation method as per IND AS6 of 34
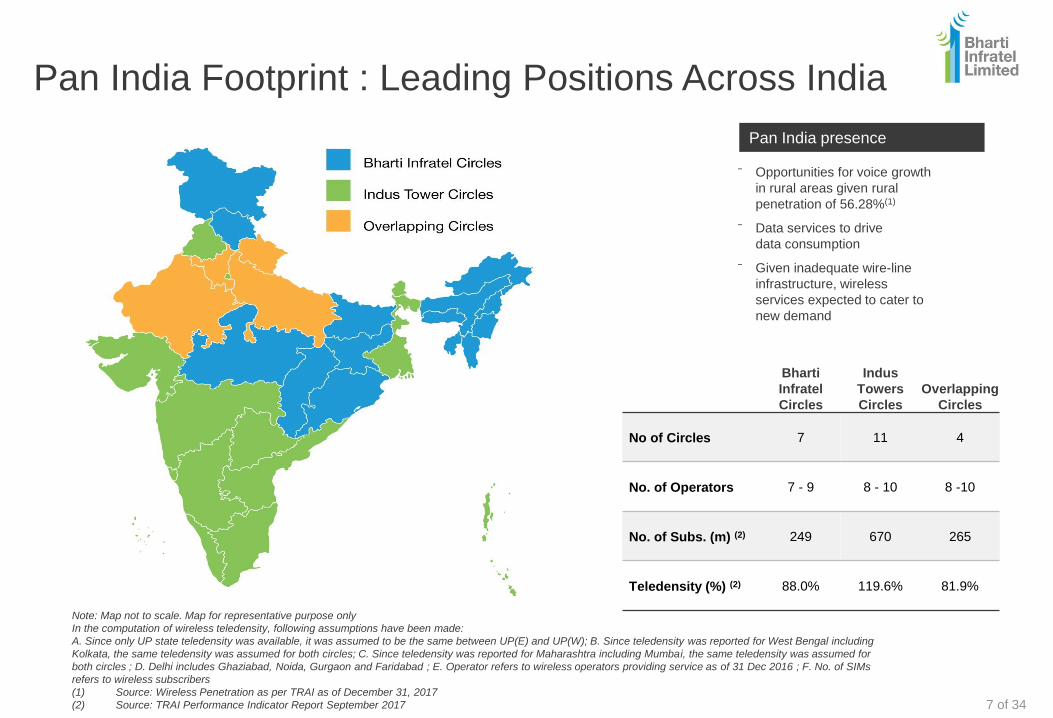
Pan India Footprint : Leading Positions Across India
⁻ Opportunities for voice growth
in rural areas given rural
penetration of 56.28%(1)
⁻ Data services to drive
data consumption
⁻ Given inadequate wire-line
infrastructure, wireless
services expected to cater to
new demand
Bharti
Infratel
Circles
Indus
Towers
Circles
Overlapping
Circles
No of Circles 7 11 4
No. of Operators 7 - 9 8 - 10 8 -10
No. of Subs. (m) (2) 249 670 265
Teledensity (%) (2) 88.0% 119.6% 81.9%
Pan India presence
Note: Map not to scale. Map for representative purpose only
In the computation of wireless teledensity, following assumptions have been made:
A. Since only UP state teledensity was available, it was assumed to be the same between UP(E) and UP(W); B. Since teledensity was reported for West Bengal including
Kolkata, the same teledensity was assumed for both circles; C. Since teledensity was reported for Maharashtra including Mumbai, the same teledensity was assumed for
both circles ; D. Delhi includes Ghaziabad, Noida, Gurgaon and Faridabad ; E. Operator refers to wireless operators providing service as of 31 Dec 2016 ; F. No. of SIMs
refers to wireless subscribers
(1) Source: Wireless Penetration as per TRAI as of December 31, 2017
(2) Source: TRAI Performance Indicator Report September 2017 7 of 34

Industry Overview
8 of 34
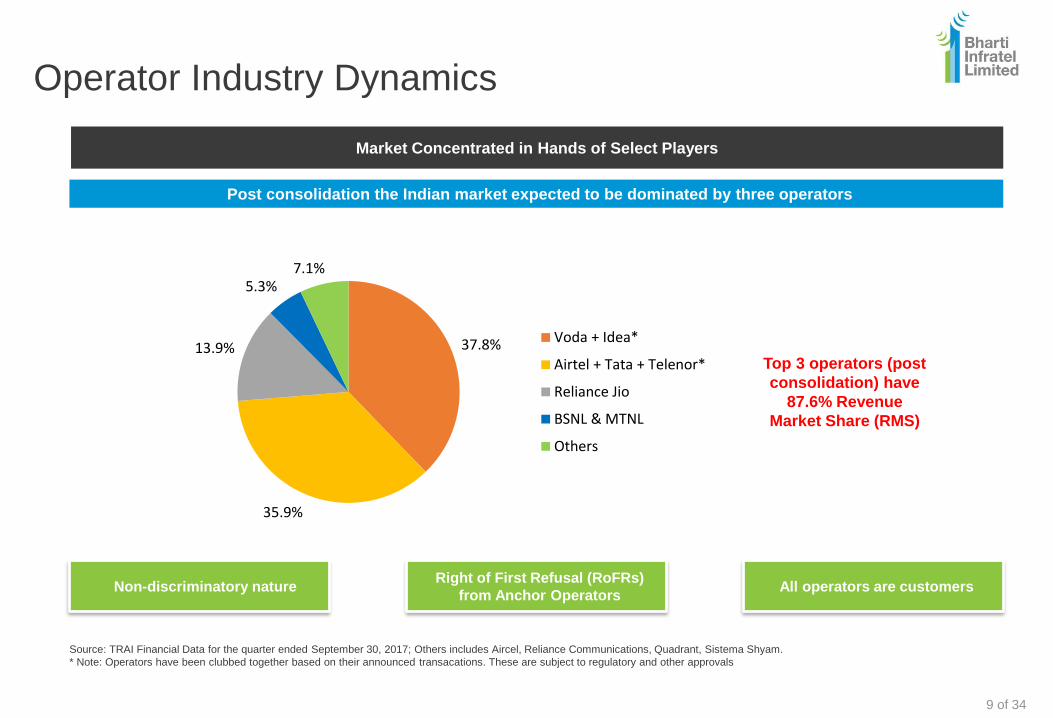
Operator Industry Dynamics
Top 3 operators (post
consolidation) have
87.6% Revenue
Market Share (RMS)
Market Concentrated in Hands of Select Players
Non-discriminatory nature All operators are customersRight of First Refusal (RoFRs)
from Anchor Operators
Post consolidation the Indian market expected to be dominated by three operators
Source: TRAI Financial Data for the quarter ended September 30, 2017; Others includes Aircel, Reliance Communications, Quadrant, Sistema Shyam.
* Note: Operators have been clubbed together based on their announced transacations. These are subject to regulatory and other approvals
9 of 34
37.8%
35.9%
13.9%
5.3%7.1%
Voda + Idea*
Airtel + Tata + Telenor*
Reliance Jio
BSNL & MTNL
Others
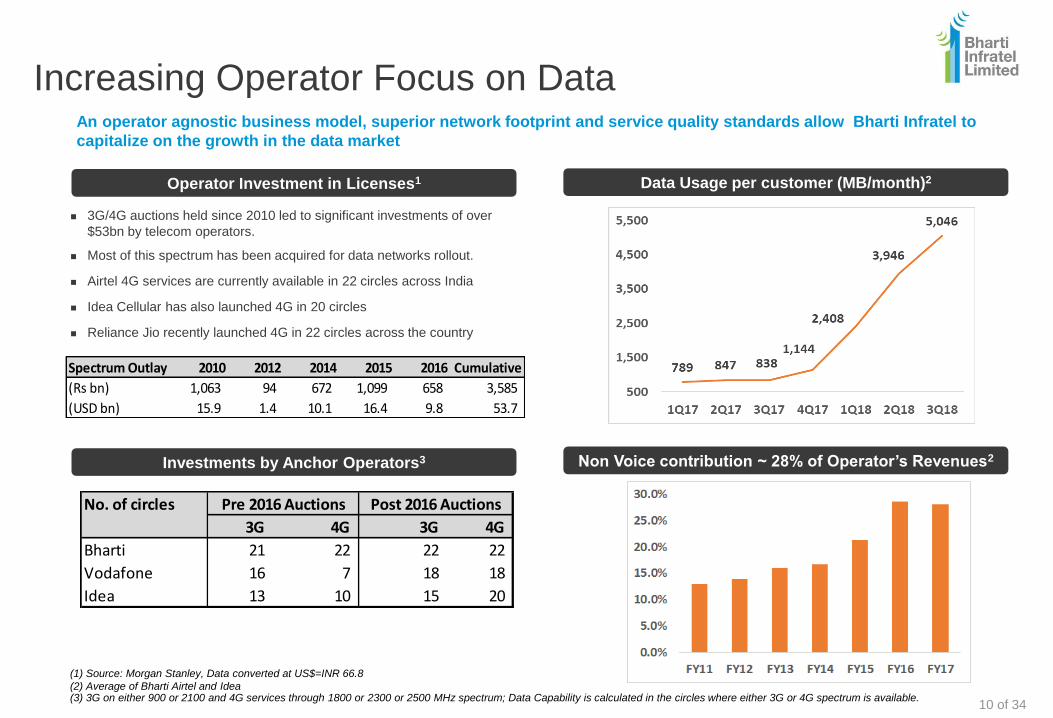
Increasing Operator Focus on Data
3G/4G auctions held since 2010 led to significant investments of over
$53bn by telecom operators.
Most of this spectrum has been acquired for data networks rollout.
Airtel 4G services are currently available in 22 circles across India
Idea Cellular has also launched 4G in 20 circles
Reliance Jio recently launched 4G in 22 circles across the country
Operator Investment in Licenses1
Investments by Anchor Operators3 Non Voice contribution ~ 28% of Operator’s Revenues2
An operator agnostic business model, superior network footprint and service quality standards allow Bharti Infratel to
capitalize on the growth in the data market
(1) Source: Morgan Stanley, Data converted at US$=INR 66.8
(2) Average of Bharti Airtel and Idea(3) 3G on either 900 or 2100 and 4G services through 1800 or 2300 or 2500 MHz spectrum; Data Capability is calculated in the circles where either 3G or 4G spectrum is available.
Spectrum Outlay 2010 2012 2014 2015 2016 Cumulative
(Rs bn) 1,063 94 672 1,099 658 3,585
(USD bn) 15.9 1.4 10.1 16.4 9.8 53.7
No. of circles
3G 4G 3G 4G
Bharti 21 22 22 22
Vodafone 16 7 18 18
Idea 13 10 15 20
Pre 2016 Auctions Post 2016 Auctions
Data Usage per customer (MB/month)2
10 of 34
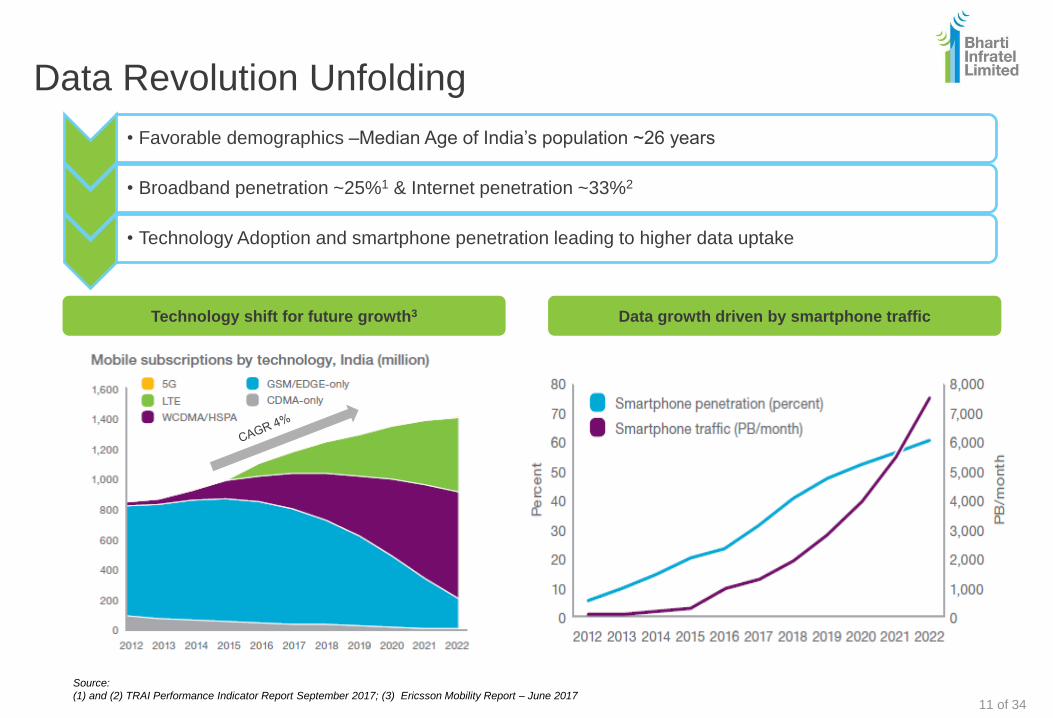
Data Revolution Unfolding
Technology shift for future growth3
• Favorable demographics –Median Age of India’s population ~26 years
• Broadband penetration ~25%1 & Internet penetration ~33%2
• Technology Adoption and smartphone penetration leading to higher data uptake
Data growth driven by smartphone traffic
Source:
(1) and (2) TRAI Performance Indicator Report September 2017; (3) Ericsson Mobility Report – June 201711 of 34
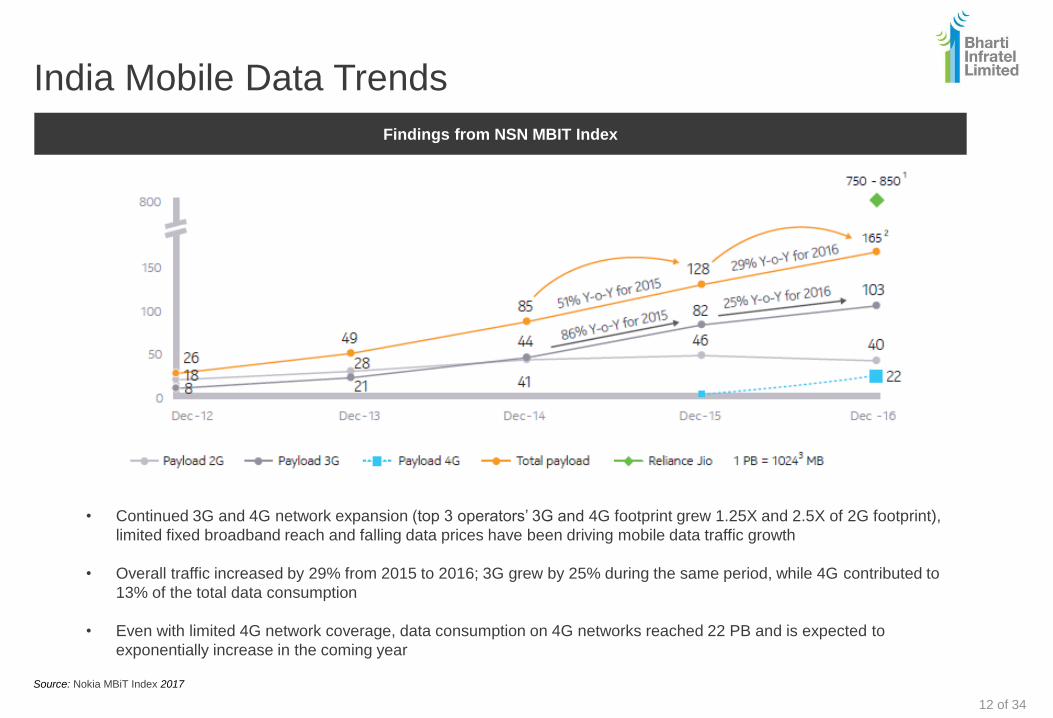
India Mobile Data Trends
Source: Nokia MBiT Index 2017
Findings from NSN MBIT Index
• Continued 3G and 4G network expansion (top 3 operators’ 3G and 4G footprint grew 1.25X and 2.5X of 2G footprint),
limited fixed broadband reach and falling data prices have been driving mobile data traffic growth
• Overall traffic increased by 29% from 2015 to 2016; 3G grew by 25% during the same period, while 4G contributed to
13% of the total data consumption
• Even with limited 4G network coverage, data consumption on 4G networks reached 22 PB and is expected to
exponentially increase in the coming year
12 of 34
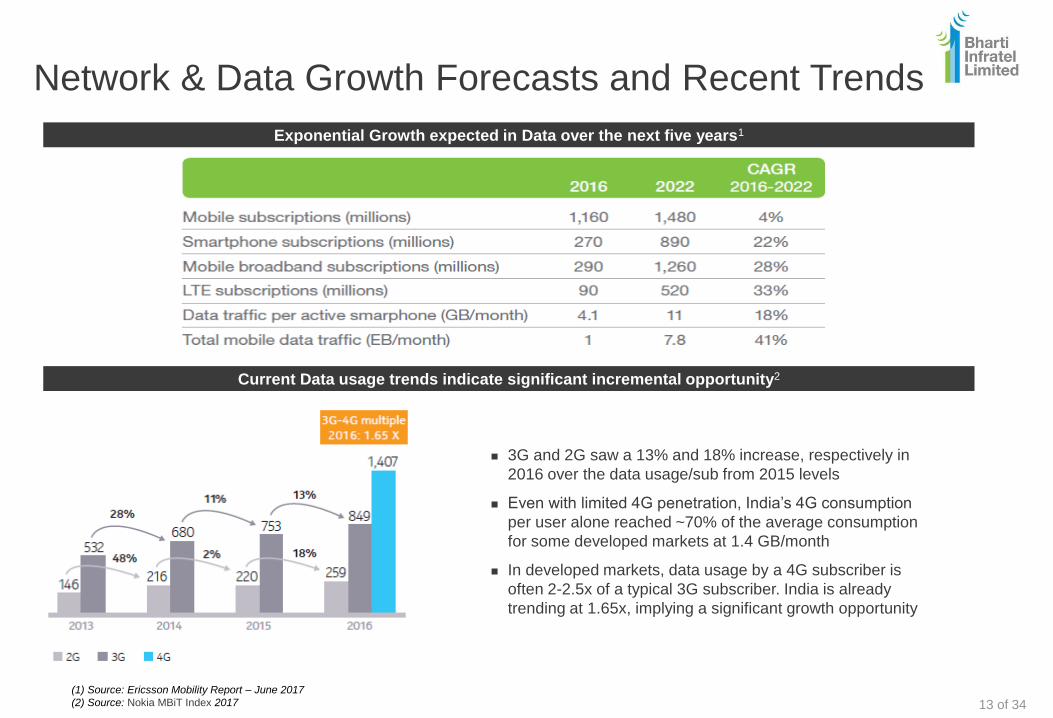
Network & Data Growth Forecasts and Recent Trends
Exponential Growth expected in Data over the next five years1
(1) Source: Ericsson Mobility Report – June 2017
(2) Source: Nokia MBiT Index 2017
Current Data usage trends indicate significant incremental opportunity2
3G and 2G saw a 13% and 18% increase, respectively in
2016 over the data usage/sub from 2015 levels
Even with limited 4G penetration, India’s 4G consumption
per user alone reached ~70% of the average consumption
for some developed markets at 1.4 GB/month
In developed markets, data usage by a 4G subscriber is
often 2-2.5x of a typical 3G subscriber. India is already
trending at 1.65x, implying a significant growth opportunity
13 of 34
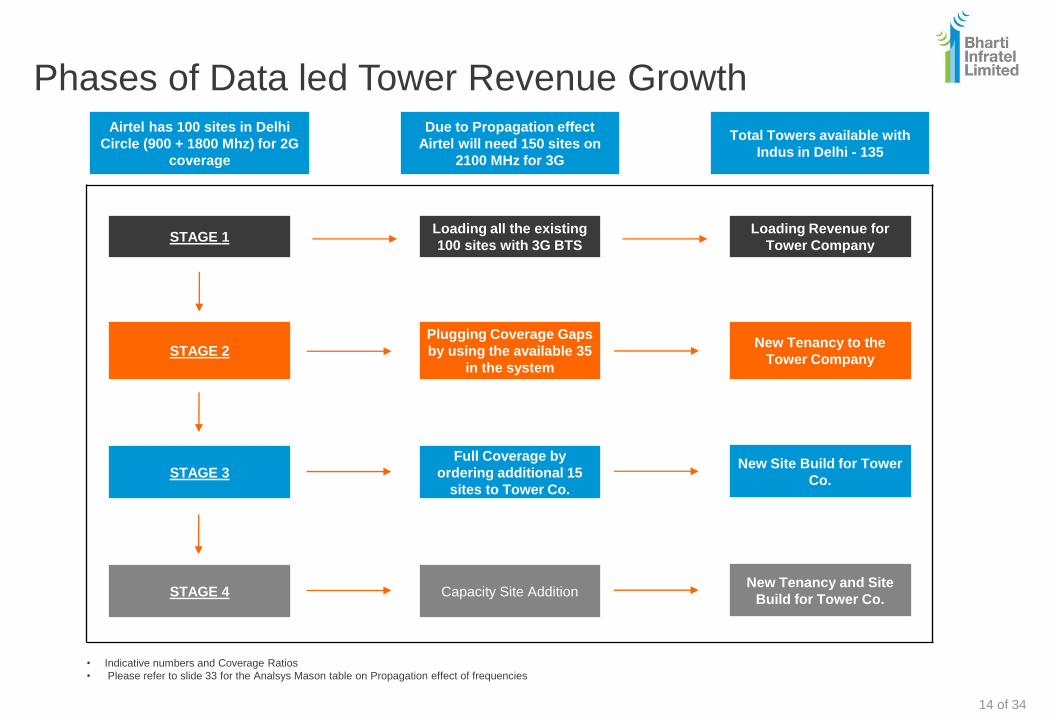
Phases of Data led Tower Revenue Growth
STAGE 1Loading all the existing
100 sites with 3G BTS
Loading Revenue for
Tower Company
STAGE 2
Plugging Coverage Gaps
by using the available 35
in the system
New Tenancy to the
Tower Company
STAGE 3
Full Coverage by
ordering additional 15
sites to Tower Co.
New Site Build for Tower
Co.
STAGE 4 Capacity Site AdditionNew Tenancy and Site
Build for Tower Co.
Airtel has 100 sites in Delhi
Circle (900 + 1800 Mhz) for 2G
coverage
Due to Propagation effect
Airtel will need 150 sites on
2100 MHz for 3G
Total Towers available with
Indus in Delhi - 135
• Indicative numbers and Coverage Ratios
• Please refer to slide 33 for the Analsys Mason table on Propagation effect of frequencies
14 of 34

Business Model Strengths
15 of 34
Business Model Strengths
A Leading Tower Infrastructure Operator1
Visibility of Future Revenues Through Long Term Contracts2
Demonstrated Operational and Financial Performance3
Implementation of Green Initiatives4
Experienced Management5
16 of 34
91
6958
4428 26
148
4027
15 13
71
0
20
40
60
80
100
120
140
160
180
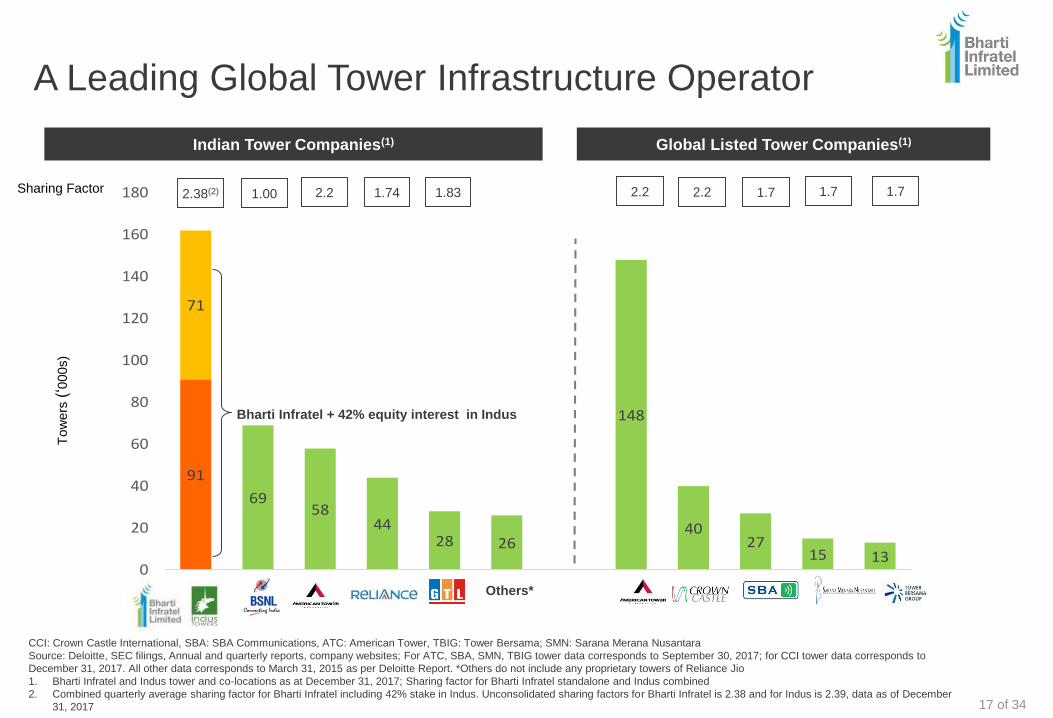
A Leading Global Tower Infrastructure OperatorT
ow
ers
(‘0
00s)
Indian Tower Companies(1) Global Listed Tower Companies(1)
1.7 1.72.38(2)
Others*
1.00 2.2 1.74 1.83
Bharti Infratel + 42% equity interest in Indus
1.7
CCI: Crown Castle International, SBA: SBA Communications, ATC: American Tower, TBIG: Tower Bersama; SMN: Sarana Merana Nusantara
Source: Deloitte, SEC filings, Annual and quarterly reports, company websites; For ATC, SBA, SMN, TBIG tower data corresponds to September 30, 2017; for CCI tower data corresponds to
December 31, 2017. All other data corresponds to March 31, 2015 as per Deloitte Report. *Others do not include any proprietary towers of Reliance Jio
1. Bharti Infratel and Indus tower and co-locations as at December 31, 2017; Sharing factor for Bharti Infratel standalone and Indus combined
2. Combined quarterly average sharing factor for Bharti Infratel including 42% stake in Indus. Unconsolidated sharing factors for Bharti Infratel is 2.38 and for Indus is 2.39, data as of December
31, 2017
Sharing Factor 2.2 2.2
17 of 34
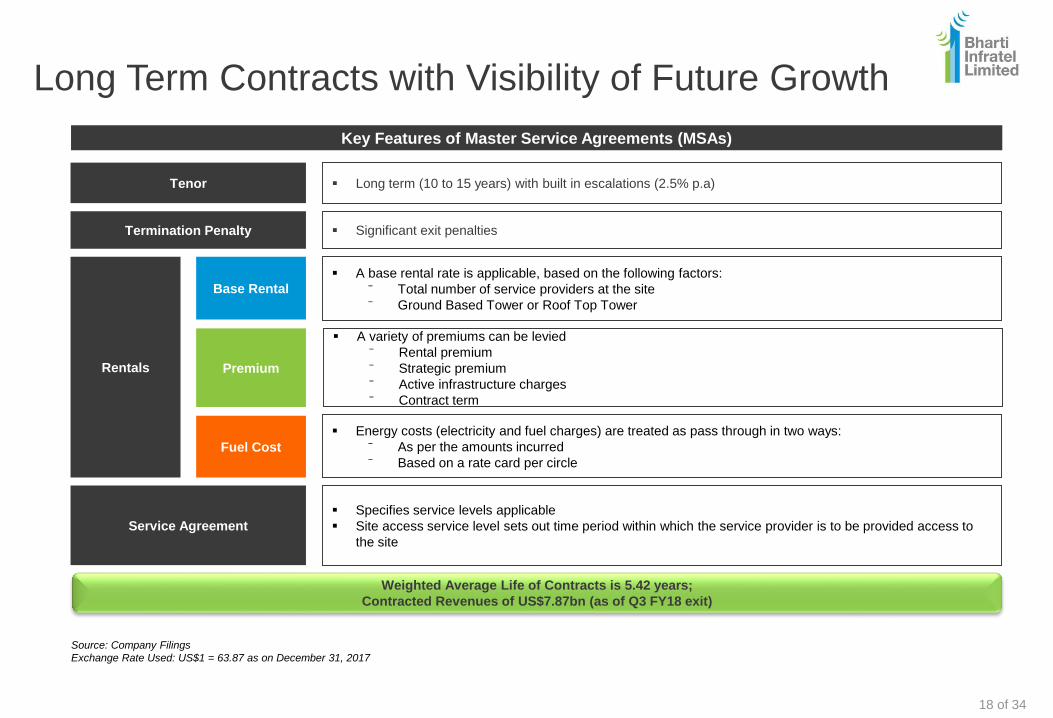
Long Term Contracts with Visibility of Future Growth
Source: Company Filings
Exchange Rate Used: US$1 = 63.87 as on December 31, 2017
Tenor
Rentals
Base Rental
Long term (10 to 15 years) with built in escalations (2.5% p.a)
Termination Penalty Significant exit penalties
A base rental rate is applicable, based on the following factors:
⁻ Total number of service providers at the site
⁻ Ground Based Tower or Roof Top Tower
A variety of premiums can be levied
⁻ Rental premium
⁻ Strategic premium
⁻ Active infrastructure charges
⁻ Contract term
Energy costs (electricity and fuel charges) are treated as pass through in two ways:
⁻ As per the amounts incurred
⁻ Based on a rate card per circle
Specifies service levels applicable
Site access service level sets out time period within which the service provider is to be provided access to
the site
Premium
Fuel Cost
Service Agreement
Weighted Average Life of Contracts is 5.42 years;
Contracted Revenues of US$7.87bn (as of Q3 FY18 exit)
Key Features of Master Service Agreements (MSAs)
18 of 34
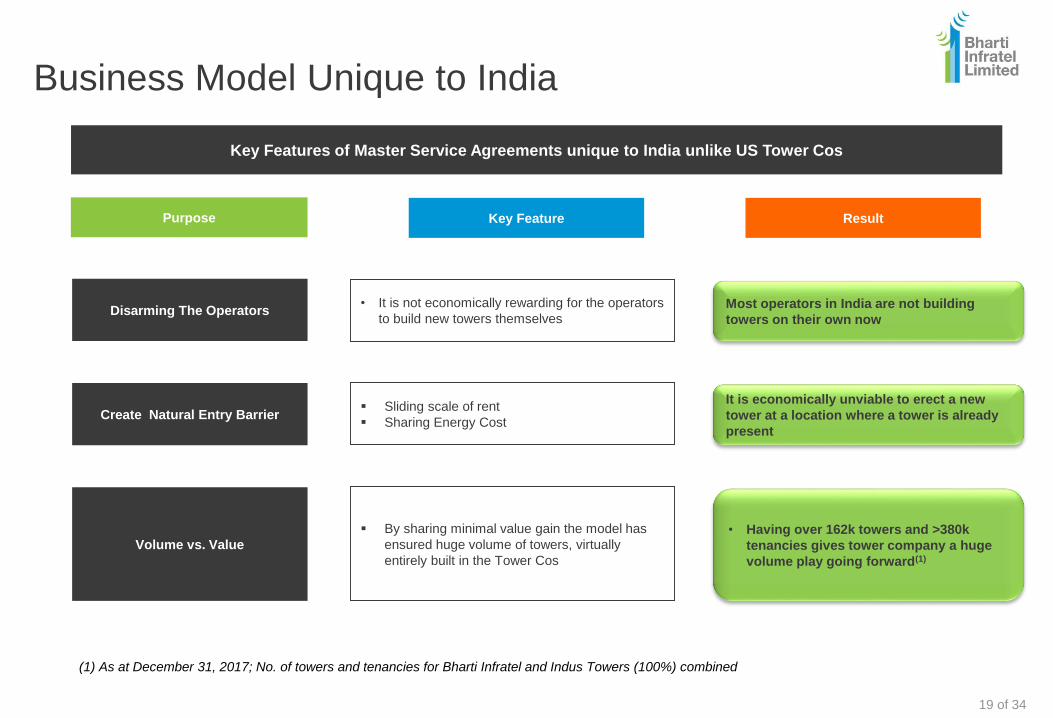
Business Model Unique to India
Disarming The Operators
Key Feature
• It is not economically rewarding for the operators
to build new towers themselves
Result
Most operators in India are not building
towers on their own now
Key Features of Master Service Agreements unique to India unlike US Tower Cos
Purpose
Create Natural Entry Barrier Sliding scale of rent
Sharing Energy Cost
It is economically unviable to erect a new
tower at a location where a tower is already
present
Volume vs. Value
By sharing minimal value gain the model has
ensured huge volume of towers, virtually
entirely built in the Tower Cos
• Having over 162k towers and >380k
tenancies gives tower company a huge
volume play going forward(1)
19 of 34
(1) As at December 31, 2017; No. of towers and tenancies for Bharti Infratel and Indus Towers (100%) combined
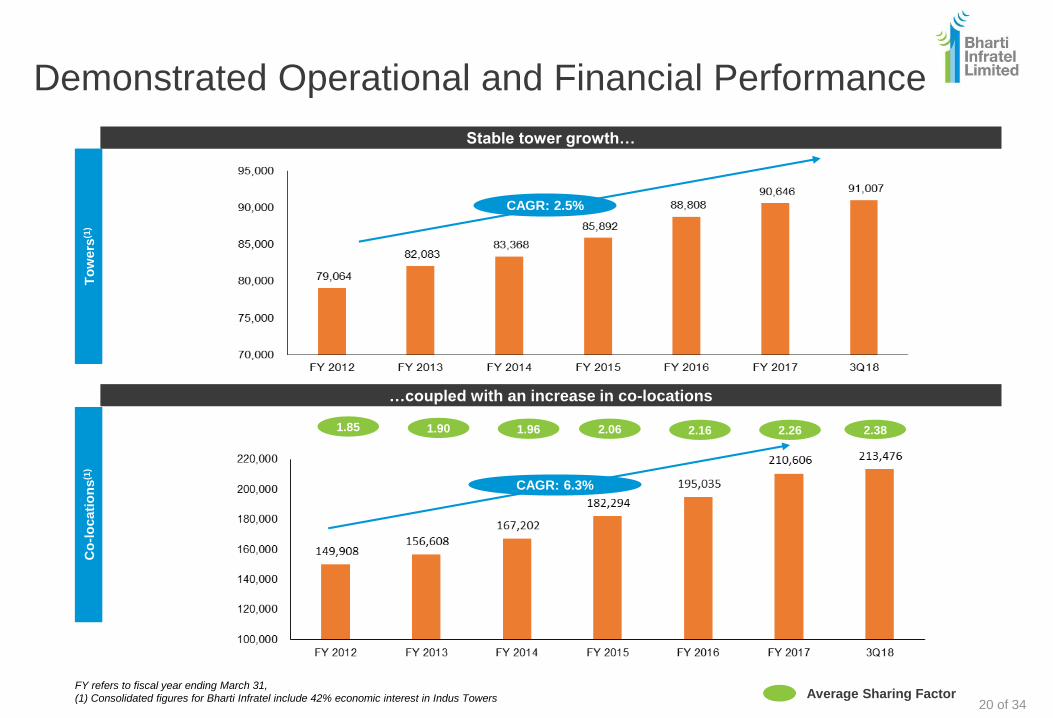
Demonstrated Operational and Financial PerformanceTow
ers
(1)
Co-locations
(1)
Stable tower growth…
…coupled with an increase in co-locations
To
wers
(1)
Co
-lo
cati
on
s(1
)
1.85 1.90 1.96 2.06 2.16 2.26
FY refers to fiscal year ending March 31,
(1) Consolidated figures for Bharti Infratel include 42% economic interest in Indus Towers Average Sharing Factor20 of 34
2.38
CAGR: 6.3%
CAGR: 2.5%
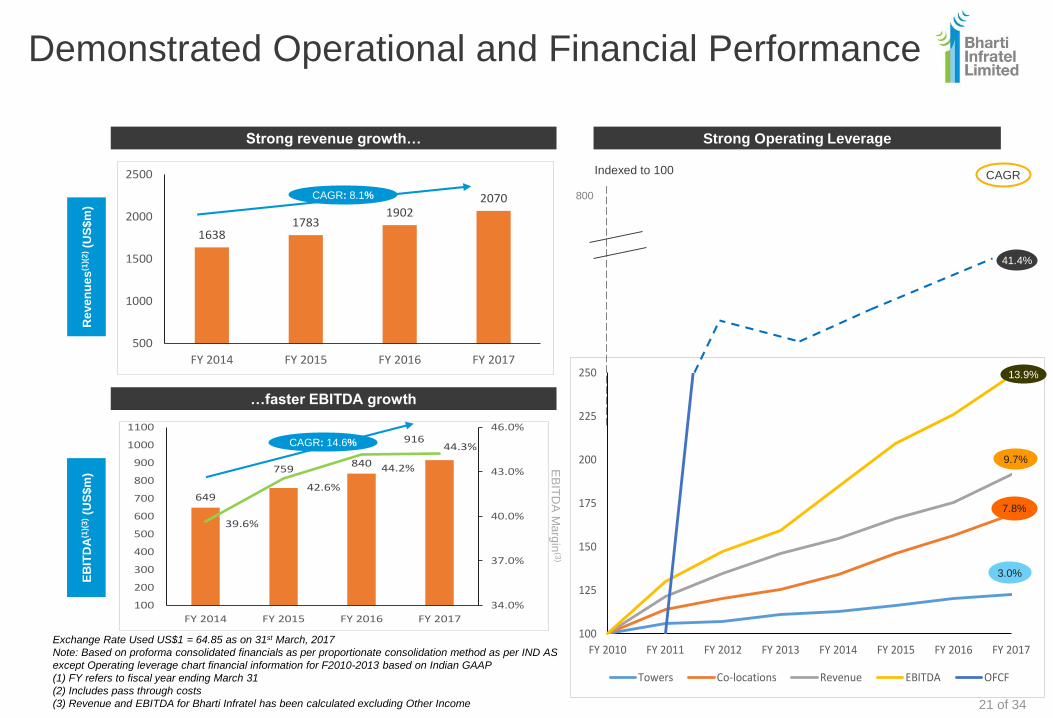
649
759840
916
39.6%
42.6%
44.2%
44.3%
34.0%
37.0%
40.0%
43.0%
46.0%
100
200
300
400
500
600
700
800
900
1000
1100
FY 2014 FY 2015 FY 2016 FY 2017
100
125
150
175
200
225
250
FY 2010 FY 2011 FY 2012 FY 2013 FY 2014 FY 2015 FY 2016 FY 2017
Towers Co-locations Revenue EBITDA OFCF
41.4%
16381783
19022070
500
1000
1500
2000
2500
FY 2014 FY 2015 FY 2016 FY 2017
Demonstrated Operational and Financial Performance
Strong Operating LeverageStrong revenue growth…
Reve
nu
es
(1)(
2)(U
S$m
)
…faster EBITDA growth
EB
ITD
A(1
)(3
)(U
S$m
)
EB
ITD
A M
arg
in(3
)
CAGRIndexed to 100
13.9%
9.7%
7.8%
3.0%
CAGR: 8.1%
Exchange Rate Used US$1 = 64.85 as on 31st March, 2017
Note: Based on proforma consolidated financials as per proportionate consolidation method as per IND AS
except Operating leverage chart financial information for F2010-2013 based on Indian GAAP
(1) FY refers to fiscal year ending March 31
(2) Includes pass through costs
(3) Revenue and EBITDA for Bharti Infratel has been calculated excluding Other Income
800
CAGR: 14.6%
21 of 34
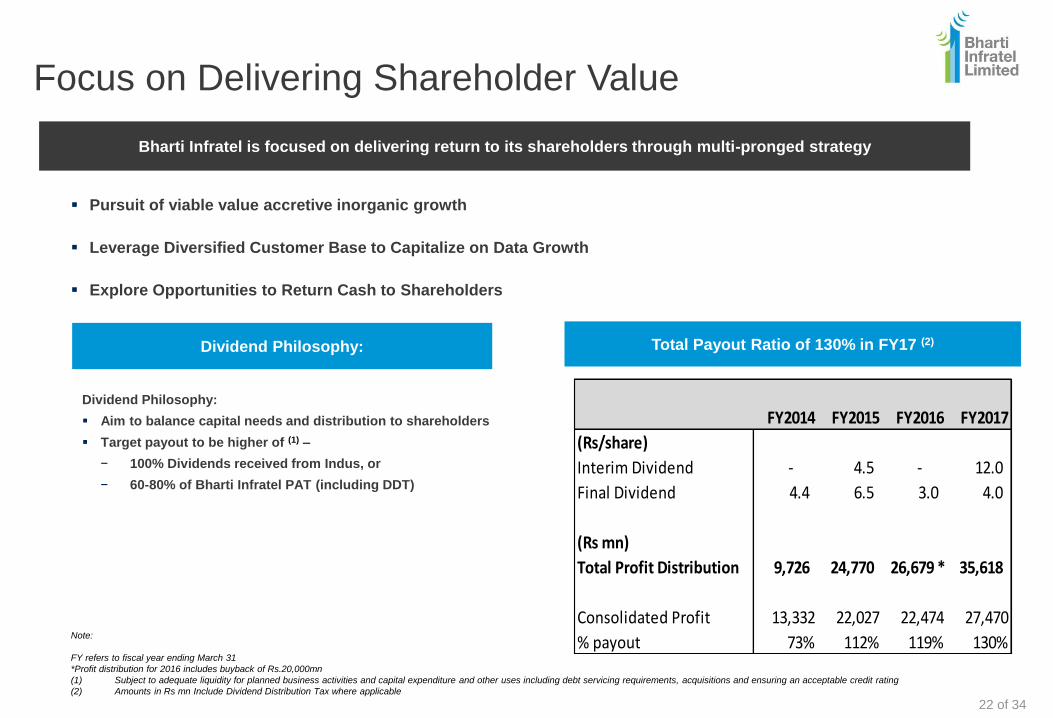
Focus on Delivering Shareholder Value
Dividend Philosophy:
Aim to balance capital needs and distribution to shareholders
Target payout to be higher of (1) –
− 100% Dividends received from Indus, or
− 60-80% of Bharti Infratel PAT (including DDT)
Note:
FY refers to fiscal year ending March 31
*Profit distribution for 2016 includes buyback of Rs.20,000mn
(1) Subject to adequate liquidity for planned business activities and capital expenditure and other uses including debt servicing requirements, acquisitions and ensuring an acceptable credit rating
(2) Amounts in Rs mn Include Dividend Distribution Tax where applicable
Dividend Philosophy:
Pursuit of viable value accretive inorganic growth
Leverage Diversified Customer Base to Capitalize on Data Growth
Explore Opportunities to Return Cash to Shareholders
Bharti Infratel is focused on delivering return to its shareholders through multi-pronged strategy
Total Payout Ratio of 130% in FY17 (2)
22 of 34
FY2014 FY2015 FY2016 FY2017
(Rs/share)
Interim Dividend - 4.5 - 12.0
Final Dividend 4.4 6.5 3.0 4.0
(Rs mn)
Total Profit Distribution 9,726 24,770 26,679 * 35,618
Consolidated Profit 13,332 22,027 22,474 27,470
% payout 73% 112% 119% 130%
New opportunities for Telecom Infrastructure
development under ‘Smart Cities’ Project
23 of 34
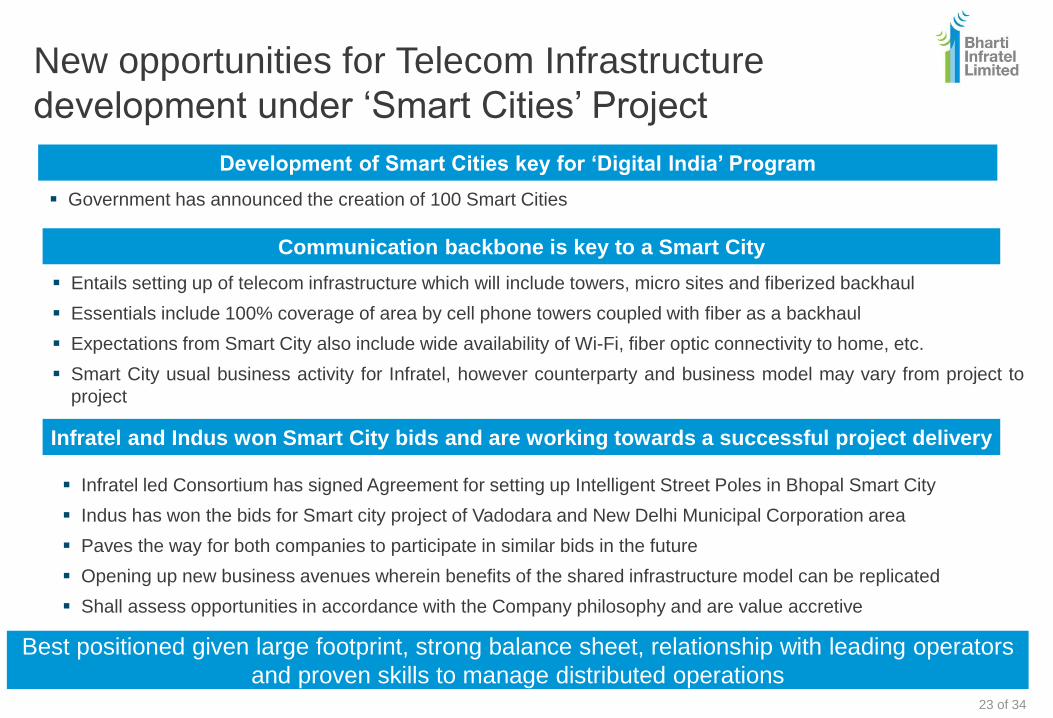
Development of Smart Cities key for ‘Digital India’ Program
Government has announced the creation of 100 Smart Cities
Communication backbone is key to a Smart City
Entails setting up of telecom infrastructure which will include towers, micro sites and fiberized backhaul
Essentials include 100% coverage of area by cell phone towers coupled with fiber as a backhaul
Expectations from Smart City also include wide availability of Wi-Fi, fiber optic connectivity to home, etc.
Smart City usual business activity for Infratel, however counterparty and business model may vary from project to
project
Infratel and Indus won Smart City bids and are working towards a successful project delivery
Infratel led Consortium has signed Agreement for setting up Intelligent Street Poles in Bhopal Smart City
Indus has won the bids for Smart city project of Vadodara and New Delhi Municipal Corporation area
Paves the way for both companies to participate in similar bids in the future
Opening up new business avenues wherein benefits of the shared infrastructure model can be replicated
Shall assess opportunities in accordance with the Company philosophy and are value accretive
Best positioned given large footprint, strong balance sheet, relationship with leading operators
and proven skills to manage distributed operations
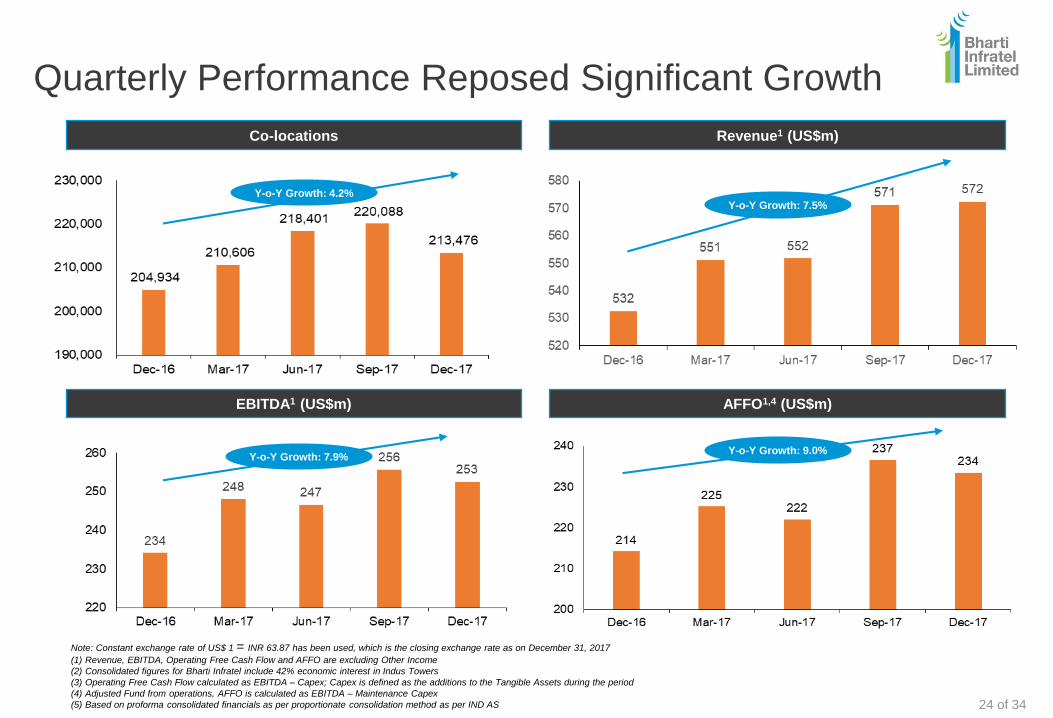
Quarterly Performance Reposed Significant Growth
Co-locations
EBITDA1 (US$m)
Revenue1 (US$m)
AFFO1,4 (US$m)
Note: Constant exchange rate of US$ 1 = INR 63.87 has been used, which is the closing exchange rate as on December 31, 2017
(1) Revenue, EBITDA, Operating Free Cash Flow and AFFO are excluding Other Income
(2) Consolidated figures for Bharti Infratel include 42% economic interest in Indus Towers
(3) Operating Free Cash Flow calculated as EBITDA – Capex; Capex is defined as the additions to the Tangible Assets during the period
(4) Adjusted Fund from operations, AFFO is calculated as EBITDA – Maintenance Capex
(5) Based on proforma consolidated financials as per proportionate consolidation method as per IND AS 24 of 34
Y-o-Y Growth: 4.2%
Y-o-Y Growth: 7.9%
Y-o-Y Growth: 7.5%
Y-o-Y Growth: 9.0%
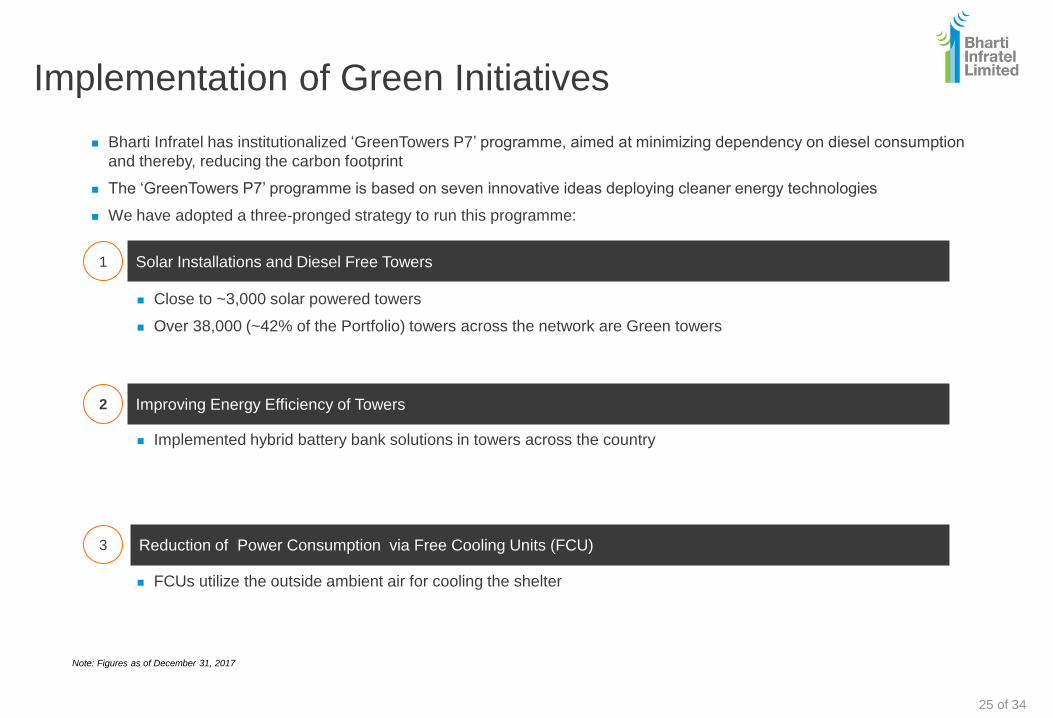
Implementation of Green Initiatives
Bharti Infratel has institutionalized ‘GreenTowers P7’ programme, aimed at minimizing dependency on diesel consumption
and thereby, reducing the carbon footprint
The ‘GreenTowers P7’ programme is based on seven innovative ideas deploying cleaner energy technologies
We have adopted a three-pronged strategy to run this programme:
Solar Installations and Diesel Free Towers1
Close to ~3,000 solar powered towers
Over 38,000 (~42% of the Portfolio) towers across the network are Green towers
Improving Energy Efficiency of Towers2
Implemented hybrid battery bank solutions in towers across the country
Reduction of Power Consumption via Free Cooling Units (FCU)3
FCUs utilize the outside ambient air for cooling the shelter
Note: Figures as of December 31, 2017
25 of 34
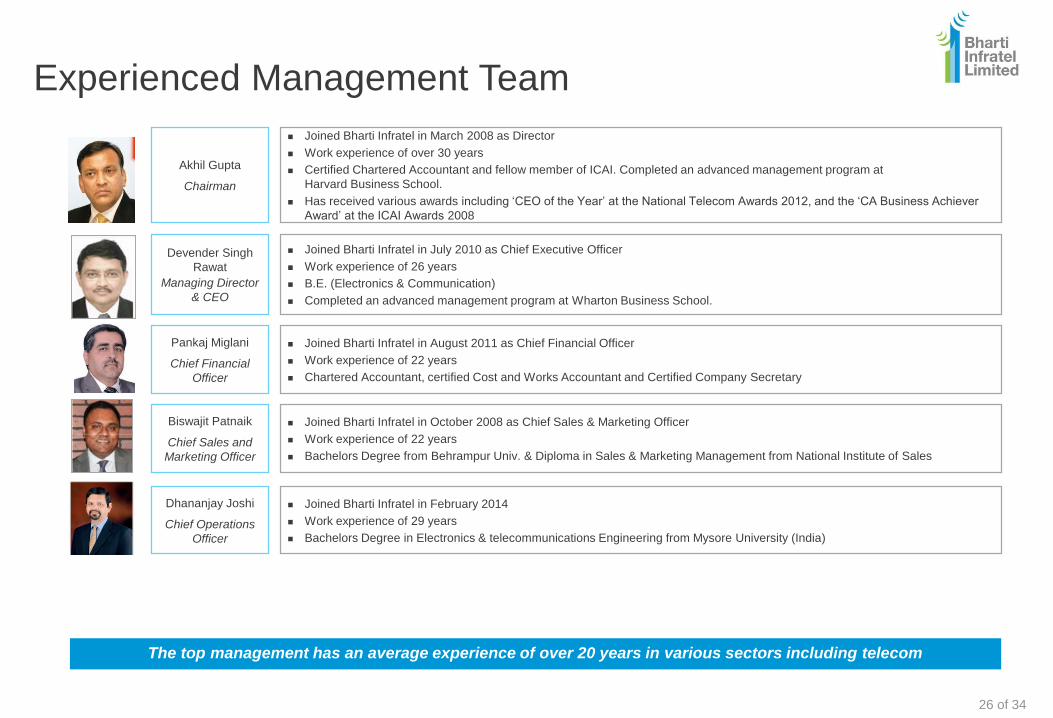
Experienced Management Team
Akhil Gupta
Chairman
Joined Bharti Infratel in March 2008 as Director
Work experience of over 30 years
Certified Chartered Accountant and fellow member of ICAI. Completed an advanced management program at
Harvard Business School.
Has received various awards including ‘CEO of the Year’ at the National Telecom Awards 2012, and the ‘CA Business Achiever
Award’ at the ICAI Awards 2008
Pankaj Miglani
Chief Financial
Officer
Joined Bharti Infratel in August 2011 as Chief Financial Officer
Work experience of 22 years
Chartered Accountant, certified Cost and Works Accountant and Certified Company Secretary
Biswajit Patnaik
Chief Sales and
Marketing Officer
Joined Bharti Infratel in October 2008 as Chief Sales & Marketing Officer
Work experience of 22 years
Bachelors Degree from Behrampur Univ. & Diploma in Sales & Marketing Management from National Institute of Sales
The top management has an average experience of over 20 years in various sectors including telecom
Devender Singh
Rawat
Managing Director
& CEO
Joined Bharti Infratel in July 2010 as Chief Executive Officer
Work experience of 26 years
B.E. (Electronics & Communication)
Completed an advanced management program at Wharton Business School.
Dhananjay Joshi
Chief Operations
Officer
Joined Bharti Infratel in February 2014
Work experience of 29 years
Bachelors Degree in Electronics & telecommunications Engineering from Mysore University (India)
26 of 34
CSR, Awards and Recognition
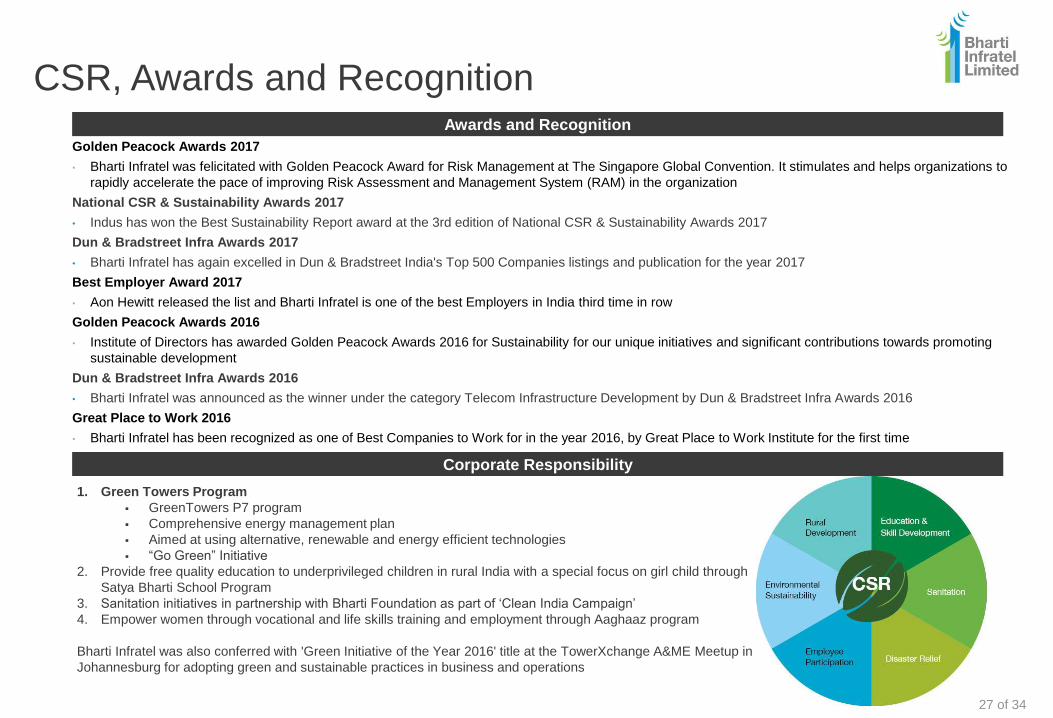
Golden Peacock Awards 2017
• Bharti Infratel was felicitated with Golden Peacock Award for Risk Management at The Singapore Global Convention. It stimulates and helps organizations to
rapidly accelerate the pace of improving Risk Assessment and Management System (RAM) in the organization
National CSR & Sustainability Awards 2017
• Indus has won the Best Sustainability Report award at the 3rd edition of National CSR & Sustainability Awards 2017
Dun & Bradstreet Infra Awards 2017
• Bharti Infratel has again excelled in Dun & Bradstreet India's Top 500 Companies listings and publication for the year 2017
Best Employer Award 2017
• Aon Hewitt released the list and Bharti Infratel is one of the best Employers in India third time in row
Golden Peacock Awards 2016
• Institute of Directors has awarded Golden Peacock Awards 2016 for Sustainability for our unique initiatives and significant contributions towards promoting
sustainable development
Dun & Bradstreet Infra Awards 2016
• Bharti Infratel was announced as the winner under the category Telecom Infrastructure Development by Dun & Bradstreet Infra Awards 2016
Great Place to Work 2016
• Bharti Infratel has been recognized as one of Best Companies to Work for in the year 2016, by Great Place to Work Institute for the first time
Awards and Recognition
1. Green Towers Program
GreenTowers P7 program
Comprehensive energy management plan
Aimed at using alternative, renewable and energy efficient technologies
“Go Green” Initiative
2. Provide free quality education to underprivileged children in rural India with a special focus on girl child through
Satya Bharti School Program
3. Sanitation initiatives in partnership with Bharti Foundation as part of ‘Clean India Campaign’
4. Empower women through vocational and life skills training and employment through Aaghaaz program
Bharti Infratel was also conferred with 'Green Initiative of the Year 2016' title at the TowerXchange A&ME Meetup in
Johannesburg for adopting green and sustainable practices in business and operations
Corporate Responsibility
27 of 34

In Summary
28 of 34
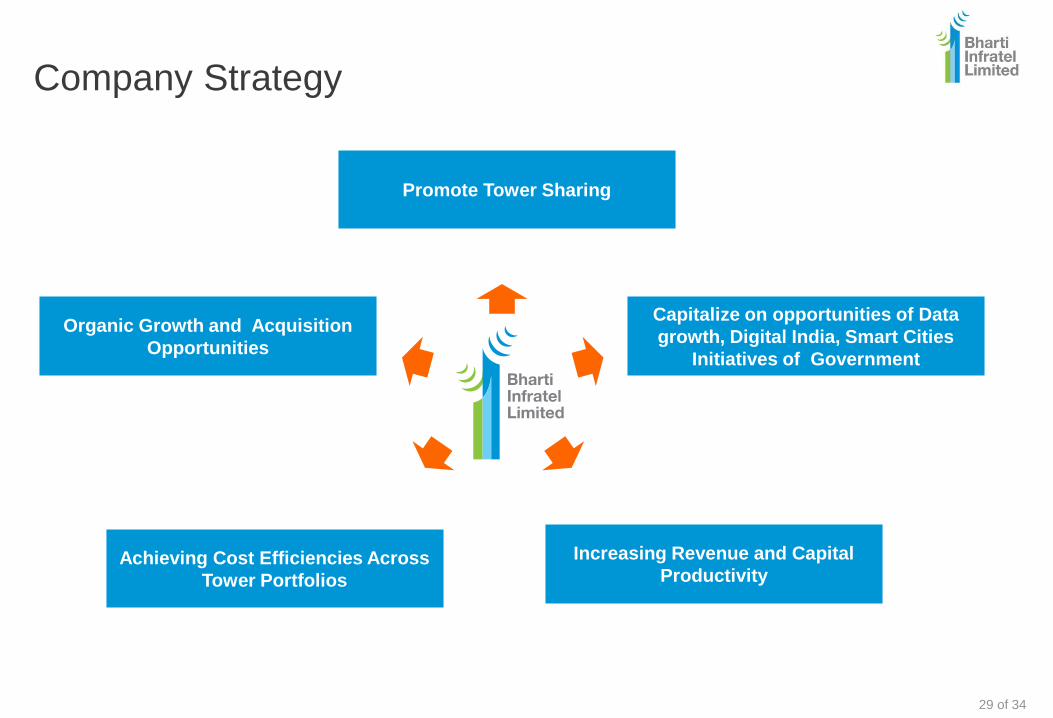
Company Strategy
Promote Tower Sharing
Capitalize on opportunities of Data
growth, Digital India, Smart Cities
Initiatives of Government
Organic Growth and Acquisition
Opportunities
Increasing Revenue and Capital
ProductivityAchieving Cost Efficiencies Across
Tower Portfolios
29 of 34
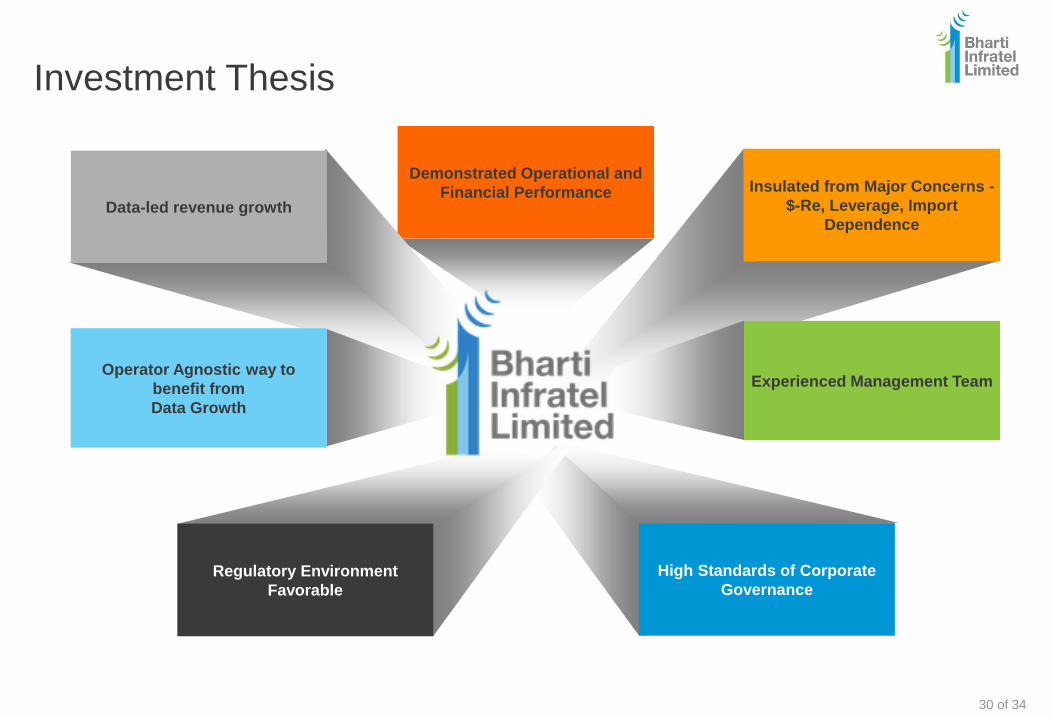
Investment Thesis
Demonstrated Operational and
Financial Performance Insulated from Major Concerns -
$-Re, Leverage, Import
Dependence
High Standards of Corporate
GovernanceRegulatory Environment
Favorable
Data-led revenue growth
Operator Agnostic way to
benefit from
Data Growth
Experienced Management Team
30 of 34

Appendix
31 of 34
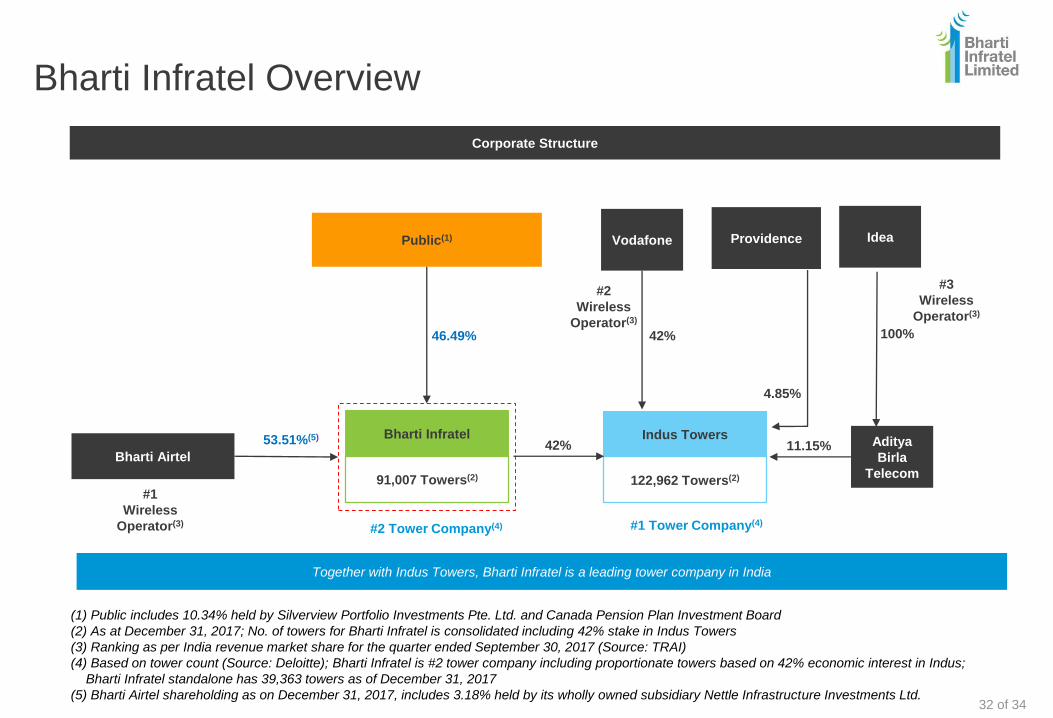
Bharti Infratel Overview
(1) Public includes 10.34% held by Silverview Portfolio Investments Pte. Ltd. and Canada Pension Plan Investment Board
(2) As at December 31, 2017; No. of towers for Bharti Infratel is consolidated including 42% stake in Indus Towers
(3) Ranking as per India revenue market share for the quarter ended September 30, 2017 (Source: TRAI)
(4) Based on tower count (Source: Deloitte); Bharti Infratel is #2 tower company including proportionate towers based on 42% economic interest in Indus;
Bharti Infratel standalone has 39,363 towers as of December 31, 2017
(5) Bharti Airtel shareholding as on December 31, 2017, includes 3.18% held by its wholly owned subsidiary Nettle Infrastructure Investments Ltd.
Corporate Structure
Together with Indus Towers, Bharti Infratel is a leading tower company in India
Bharti Airtel
53.51%(5)
#1
Wireless
Operator(3)
Public(1)
46.49%
Bharti Infratel
91,007 Towers(2)
#2 Tower Company(4)
Aditya
Birla
Telecom
Vodafone Idea
42% 100%
#2
Wireless
Operator(3)
#3
Wireless
Operator(3)
Indus Towers
122,962 Towers(2)
#1 Tower Company(4)
42% 11.15%
Providence
4.85%
32 of 34
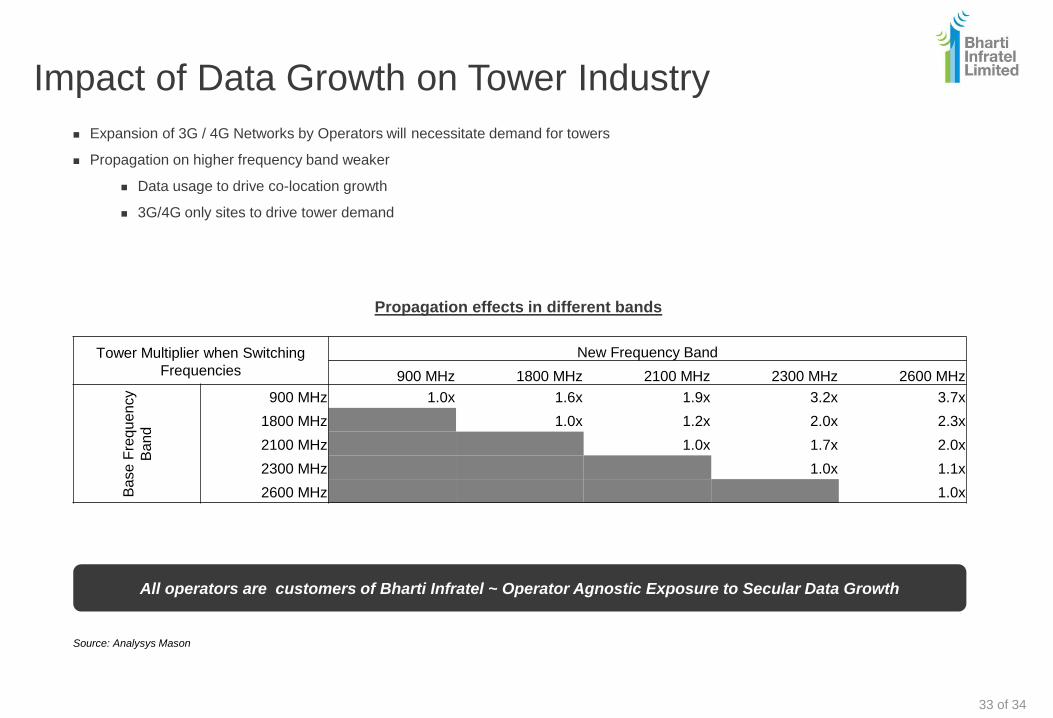
Impact of Data Growth on Tower Industry
Expansion of 3G / 4G Networks by Operators will necessitate demand for towers
Propagation on higher frequency band weaker
Data usage to drive co-location growth
3G/4G only sites to drive tower demand
Source: Analysys Mason
Propagation effects in different bands
All operators are customers of Bharti Infratel ~ Operator Agnostic Exposure to Secular Data Growth
Tower Multiplier when Switching
Frequencies
New Frequency Band
900 MHz 1800 MHz 2100 MHz 2300 MHz 2600 MHz
Ba
se F
req
uen
cy
Ba
nd
900 MHz 1.0x 1.6x 1.9x 3.2x 3.7x
1800 MHz 1.0x 1.2x 2.0x 2.3x
2100 MHz 1.0x 1.7x 2.0x
2300 MHz 1.0x 1.1x
2600 MHz 1.0x
33 of 34
Building and Sharing Vital Infrastructure
Thank You