Embed Size (px)
Citation preview

1
Munich, 20 September 2017
Investor Presentation
Baader Investment Conference

Disclaimer
2
This presentation contains assumptions and prospects in respect of the future development of the Sixt Group. These assumptions and prospects are expressed both orally and in writing by the terms “expect”, “anticipate”, “aim”, “plan”, “believe”, “aspire”, “estimate”, “will” and by words with a similar meaning as the aforementioned. These forecasts are based inter alia on our assessment of the economic development in certain countries as well as of the development of the mobility sector. We based our assessment on the information available to us and we deem it to be realistic at the time this presentation was prepared. Our assessments bear a certain amount of risk and future developments may differ from our expectations.
In particular, a totally different performance can ensue from an unexpected slump in demand or economic stagnationon our key markets in Western Europe, in particular in Germany.
The actual performance can differ materially from the forecasts made in this presentation, in case one of theaforementioned risks or other risks not mentioned here should materialize and/or the assumption on which we havebased our forecasts and prospects turn out to be wrong.
We will not subsequently update the forward-looking statements made in this presentation and in their context.
For the above reasons, we assume no liability for any trust placed in the occurrence of our forecasts and in our expectations and assumptions.
Due to rounding it is possible that individual figures presented in this presentation may not add up exactly to the totals shown and that the full-year figures listed may not follow from adding up the individual quarterly figures. For the same reason, the percentage figures presented may not exactly reflect the absolute figures they relate to.
The bar/stock diagrams in the presentation serve as visualisation of the results. They do not follow a consisting scaling. The values stated in the diagrams are authoritative.

Agenda
3
03SIXT GROUP: OVERVIEW AND BUSINESS MODEL –Providing mobility from one minute to five yearsA.
22PERFORMANCE REVIEW 2016 & UPDATE H1/17 – Sustainable growth through internationalisation as well as new business models and new productsB.
33REVISED OUTLOOK 2017 – Solid growth in consolidated operating revenue and significant increase in Group EBT expectedC.
35APPENDIX – Selected key figures for the Sixt GroupD.

Sixt's history – Entrepreneurial operations over four generations
1) Including franchise network
4
Overview Sixt history1912 Martin Sixt founds the "Sixt Autofahrten und Selbstfahrer" company. He starts with seven cars, four Mercedes and
three Luxus-Deutz-Landaulets. Sixt owns one of the first Rent-a-Car companies in Germany
2013 Conversion of Sixt Aktiengesellschaft to a European Stock Corporation (Societas Europaea) – "Sixt SE"
1946 Relaunch of the business after the second world war with the Mercedes 230 Landaulet as a chauffeured limousine –Setting up of the Export-Taxi fleet for members of the US Army
1967 "Auto Sixt" is the first German company to launch a leasing program for vehicles
1969 Erich Sixt, now Chairman of the Board of Sixt, is the third generation offspring to step into the family business
1986 Establishment and initial public offering of "Sixt Aktiengesellschaft“
1990 Sixt in Europe – Sixt Autovermietung Switzerland takes up business
2015 Successful IPO of subsidiary Sixt Leasing SE
2011 Sixt starts its expansion in the USA by establishing rental stations in Florida. The premium car sharing joint venture DriveNow is launched in Munich and Berlin. Founding of Sixt Mobility Consulting GmbH
2016 Around 2,200 points of sales and a fleet of 215,000 vehicles in more than 100 countries1)

The Sixt family is majority shareholder of the ordinary shares
Source: Voting rights announcements until 30 June 2017
5
Sixt SE – Ownership structure of ordinary shares as of 30 June 2017 [%]
Initial public offering in 1986 Ownership structure is basis for
stability and sustainability of the Sixt Group development
In addition, 16,576,246 preference shares outstanding – 100.0% free float
COMMENTS
Total of ordinary shares: 30,367,112
61.6%
35.3%
3.1%
Other shareholders
Erich SixtVermögensver-waltung GmbH(Sixt family)
Deutsche Asset & Wealth Management
Investment GmbH
Free float 38.4%

Sixt is managed by an experienced senior management team
6
Sixt SE – Managing Board
Erich Sixt Detlev Pätsch Dr. Julian zu Putlitz Alexander Sixt Konstantin Sixt
Chief Executive Officer Chairman of the Board Born in 1944 Joined the company in 1969 Third generation to lead the
company Responsible for IT, strategic
human resource, marketing, public relations, international franchising
Chief Operations Officer Born in 1951 Joined the company in 1986 Responsible for customer
service, operations, purchase and sale of vehicles, quality management, repair/damage
Chief Financial Officer Born in 1967 Joined the company in 2009 Holds a Doctorate in
Economics Responsible for finance,
treasury and accounting, controlling, legal, auditing, risk management
Chief Administration Officer Born in 1979 Joined the company in 2009 Responsible for Group
strategy, M&A, central procurement, process and product management, global operating human resources, global service operations, new mobility services
Chief Sales Officer Born in 1982 Joined the company in 2005 Responsible for national
and international sales, global e-commerce business

Sixt is among the leading and most profitable car rental companies worldwide
1) Hertz Global Holdings 2) Avis Budget Group 3) Figure for Sixt: Operating Revenue 4) Average 2016 exchange rate USD – EUR of 1.10295 5) "EBT Margin" equates to "Return on sales"Sources: Annual reports, company information, Bloomberg
7
Vehicle rental industry – Peer group analysis 2016
REVENUE [USD m]
EBT MARGIN5) [%]241 157 279 -470EBT
[USD m]
MARKET CAPITALISATION 31/12 [USD m]
EQUITY RATIO [%]
Europcar4)4)Hertz1)1)
ABG2)2)
Sixt3)4)3)4)
8,659
2,3432,372
8,8032,421
1,790
Sixt4) Hertz1)ABG2)
3,122
Europcar4)
1,552
10.3
Hertz1)
-5.3
Europcar4)2)
6.6 3.2
Sixt3)4)3)4) ABG2))
13.926.8
Hertz1)1)
Sixt ABG2)
2)
1.35.6
Europcar

Sixt business model at a glance
1) Figures for 2016, based on revenue 2) Average number of cars under operation including international corporate excluding franchise3) Figures for 2016, based on contracts (including order book)4) Including international finance and full-service lease and fleet management, excluding franchisees and cooperation partners 5) Based on operating revenue
8
Customer need for mobilitySIXT RENT-A-CAR
One of the largest independent leasing providers in Germany Contract portfolio3): 42% fleet leasing 24% online retail leasing 34% fleet management
SIXT LEASE-A-CAR Market leader in Germany Balanced customer portfolio1): 58% retail/ tourists 34% corporate 3% replacement business 5% other businesses
Rental vehicles2)
Operating revenue [EUR m]International share5)
108,0001,703.451.7%
98,2001,519.348.0%
20162015Contracts4)
Operating revenue [EUR m]International share5)
113,600420.313.5%
103,200419.814.9%
20162015
Sixt provides mobility from one minute to five years

Sixt's performance is built on a premium product, broad coverage, trusted brand, and lean cost structures
9
"Drive premium –pay economy"
47% in value of the car rental fleet in 2016 consists of premium brands (Audi, BMW and Mercedes-Benz)
International presence 12 corporate countries More than 90 franchise
countries
COMMENTSVehicles & services
"Premium Product"
Network & distribution
"Broad Coverage"
Brand &marketing
"Trusted Brand"
Vehicle rental – Service proposition
Organisation & infrastructure
"Lean (Cost) Structures"

Market leader in Germany and number 2 in Europe
10
Vehicle rental – Market shares 2015 [%]
1) Only Sixt corporate countries (excl. Luxembourg and Monaco), excluding franchise countriesSource: Euromonitor (Survey 2016 for previous year 2015), own estimates
34%
Sixt
12%
19%
Hertz
Others
ABG
9%
27% Europcar
22%
Sixt12%
Hertz
12%
Europcar
11%ABG
43%
Others
EUROPE1)GERMANY USA
Enterprise23%Hertz
<1%
17%ABG
Sixt
50%
9%
Others

Further expansion of station network
11
Vehicle rental – Station network
483 508 509 515
571 555 531 510
2177
1,123
International
Franchise
H1/2017
1,239
2016
2,264+47 +64-24
National
2015
1,090
2,153 2,200
1,160
2014
Sixt Europe
CorporateFranchise
Sixt Worldwide
GEOGRAPHIC COVERAGE STATIONS [No.]
-33
-16
+25
+70
-24
+1
+79
-21
+6

Ongoing US expansion
1) Franchise stations
12
Vehicle rental – US expansion as of 31 December 2016
MAJOR AIRPORT STATIONS
17
489
10
2
2011 2016
58
2013
26
IATAMIAFLLMCOATLPHXSEALASMSPPHLLAXSFODFWSJC
AirportMiamiFt. LauderdaleOrlandoAtlantaPhoenixSeattleLas VegasMinneapolis1)
Philadelphia1)
Los AngelesSan FranciscoDallasSan Jose
REGIONAL EXPANSIONSTATIONS [No.]
CorporateFranchise
2

Since February 2017, Italy is operated as a corporate country
13
Italy going-forward
12 stations to be opened until mid of 2017 Bergamo Bologna Florence Milan-Linate Milan-Malpensa (T1) Milan-Malpensa (T2) Pisa Rome-Ciampino Rome-Fiumicino Turin Venice Verona
Wish list of around 25 stations in total to be opened in the short-term
Current focus on Northern area of Italy
COMMENTS

Global trends change mobility needs
14
DRIVERS OF CHANGE USE CASES1) URBANISATION
2) CHANGE IN VALUES
4) ECONOMIC EFFICIENCY
3) SUSTAINABILITY
Increasing traffic volume Poor parking situation More demand for short-haul routes
Car loses its role as status symbol Desire to own a car decreases Trend ″from owning to sharing″
Demand for ecological mobility solutions Environmentally conscious generations Management of traffic and vehicle
admissions in large cities
Inefficient asset (only 4% utilisation) 39 km = average driving distance of
a passenger car in Germany per day
1) REPLACEMENT OF COMPANY CARS
2) EMPLOYEE INCENTIVES
4) SOLUTION FOR EXPATS
3) COMPENSATION FOR DOWNSIZING COMPANY CARS
Offers employees more flexible mobility solution
Increases employee motivation Various target groups: from Junior
Manager to Senior Manager
Decreasing company fleet by offering valuable alternatives
Reduction in costs
Expats need mobility services in different countries/cities
Various Sixt services depending on the individual situation and needs

DriveNow: Successful internationalisation continued
15
DriveNow – Highlights 2016 / Update H1/2017
INNOVATION / EXPANSIONPRESENCE
1) At the end of the respective period
MEMBERS1) ['000] Handshake (seamless switch of a
vehicle between customers) Process digitalisation (online validation
for registration) Digital fuel card (TOTAL, Berlin) Share of electric vehicles 20% Brussels since July 2016 Milan since October 2016 Helsinki
– Since May 2017– 150 cars in an area of 40 square
kilometres (BMW X1 and 2 series, MINI, BMW i3)
– Operated by a franchisee
815
580
390
215
75
925
2016 H1/172015201420132012
2011
2012
2013
2014
2015
2016
2017
MUNICH
DUSSELDORF
HAMBURG
BERLIN
COLOGNE
VIENNA LONDON
COPENHAGEN STOCKHOLM
BRUSSELS MILAN
75
215
390
580
815925
<HELSINKI

Sixt is well-known for its marketing and advertisements
16
Examples

Sixt maintains partnerships with numerous airlines and other partners and holds various high-profile awards
17
Strategic partnerships and awards – Examples
AIRLINES & FFPs AWARDS
Sixt Cards
Credit Card Web 2.0
TelecomTravel Office Sol.
Retail
OTHER PARTNERSHIPSAward Year and category
2007-09/11-13: "Best rent-a-car company in Germany"
2010/12/13/14: "Best Vehicle Rental Company in Germany"
2013/14/15/16: "Best rent-a-car company for business travelers"; 2010/11/14/15: "Best rent-a-car company in Germany"
2013/14/16: "Best Luxury Car Rental Company of the World"
2012-2016: "World's Leading Luxury Car Rental Company“ & “World's Leading Luxury Chauffeur Service”
…and +50 more!
Hotels

Sixt Leasing is a provider of mobility services with a highly attractive and customer-centric product offering
18
Leasing – Service proposition
Mid-sized and large corporates Private and business customersCustomer focus
Full Service Leasing Fleet Management Classic Leasing / Vario Financingand Services Key products
Top 3 Non-Captive Top 3 Fleet Managers First MoverMarket position in Germany
Value proposition
One-Stop-Online-Shop for >30 OEM Price Transparency Convenience Digital processes
OEM independent optimisation of Total Cost of Ownership (TCO) Know-how Purchasing power Outsourcing
Fleet Leasing Fleet Management Online Retail
Balance Sheet & Know-how Know-how Purchase Power & ServiceSuccess factors

Significant increase in leasing contract portfolio – Growth driven by Fleet Management and Online Retail
19
Leasing : Contract development ['000]
FLEET MANAGEMENTCONTRACTS1)
1) Including order book
ONLINE RETAIL1)
38,838,733,831,4
+0,4%
H1/172016
+14,3%
+7,6%
2014 2015 H1/17
+29.9%+33.7%
42.5
20152014
27.421.1
15.8
2016
+54.9%
11
62.2
12 13
76.2
56.3
15
103.2
14
97.4
16
113.6
128.9
H1/17
31.4 33.838.7 38.8

Successful product innovation at Sixt Leasing: The ″Flat Rate for the Road″ campaign
20
Flexible new vehicle leasing ranging from 12 to 30 months with Flexi-Lease option
Unrivalled low price of EUR 99.99 per month for a fully-equipped Peugeot 208 (incl. insurance, tax, transfer and registration – No upfront payment)
Seamless digital ordering process with video-ident, eSign and online credit check
1&1 cooperation as example for successful new sales

Sixt's fleet is to a large extent covered by buy-back agreements – Resilient risk profile
1) Based on vehicles added to the fleet in the fiscal year 2016 2) Based on number of contracts as at 31 December 2016 in the business fields fleet leasing and online retail, including lease assets, inventories and order book
21
Sixt rental and leasing fleet KPIs 2016
Buy-back agreements lead to low exposure to residual value risks as well as low earnings volatility
Majority of buy-back agreements in the vehicle rental business with car manufacturers
Majority of buy-back agreements in the leasing business for fleet leasing vehicles (large fleets with identical, customer-specific configuration) –Online Retail leasing vehicles with lower buy-back ratio due to higher marketability of vehicles
Typically holding periods of 6 months in vehicle rental (passenger cars) and 3-4 years in leasing
94%
RENTAL: CAR ORDERS1) LEASING: CONTRACTS2)
95%Buy-back
5%Non-Buy-back
COMMENTS
Non Buy-back
Buy-back
57%43%
Agenda
22
03SIXT GROUP: OVERVIEW AND BUSINESS MODEL –Providing mobility from one minute to five yearsA.
22PERFORMANCE REVIEW 2016 & UPDATE H1/17 – Sustainable growth through internationalisation as well as new business models and new productsB.
33REVISED OUTLOOK 2017 – Solid growth in consolidated operating revenue and significant increase in Group EBT expectedC.
35APPENDIX – Selected key figures for the Sixt GroupD.

Sustainable growth through internationalisation, new business models and products – Highlights 2016
23
RENT
ALRE
NTAL
New business models and products – MaaS1), DriveNow, myDriver
Successful Internationalisation – Rental revenue share abroad above 50%
Strong equity ratio above the defined minimum of 20%
Successful financing in an amount of more than EUR 1 billion in 2016
Dynamic growth in contract portfolio – Online Retail +30%, Fleet Management +14%
Acquisition of autohaus24.de as part of the growth strategy Online RetailLEAS
ING
LEAS
ING
GROU
PGR
OUP
Record dividend of EUR 77.8 million as proposed by the Managing Board
1) MaaS = Mobility as a Service
2
1
3
4
6
5
7
Sixt Group – Highlights 2016

Sixt Group generated an EBT of EUR 218 m and a consolidated profit of EUR 157 m in 2016
1) Figures 2013 adjusted for “at equity” consolidation of joint ventures2) Before minority interests
24
Group results 2011-2016 – Key figures [EUR m]1)
OPERATING REVENUE EBIT EBTEBITDA
199.2221.8
177.3167.7189.8
2011 20162013
255.8
2012 2014 2015
118.6157.0
137.6138.9
185.2
2014 2015 20162011 20132012
218.3
511.5 481.8 496.2 546.3 633.2 Cons.profit2) 97.5 79.2 94.4 110.0 128.2Group
revenue 1,564 1,596 1,653 1,796 2,179
1,016
961,426
393383
954
89
142
Leasingrevenue 420
1,377Rental
revenue
1,645
Otherrevenue
1,939
417
1,120
108
896
1,373
394
83
1,505
1,534
420
1702,124
20162012 20132011 20152014
2,413 756.5 156.6

Sixt Group EBT by business unit– Considerable earnings improvements in both segments
25
Consolidated financial statements 2011-2016 – EBT by segments [EUR m]1)
GROUP2) VEHICLE RENTAL2) LEASINGReturn onsales2) [%]
2016
218.3
137.6138.9
20152012
185.2
2013 2014
157.0
118.6
2011 2014
25.6
2013
16.3
2011
25.4
20152012
21.030.3 31.6
2016
119.6
2011 2014
160.4
2013
122.3
2015
136.8
2012
106.4
2016
181.0
10.1 8.3 9.1 9.5 9.6 12.2 10.2 11.0 11.1 10.6 6.5 4.3 5.3 6.1 7.210.3 10.6 7.5
1) EBT Segment Other is not shown2) Includes in 2016 a one-off effect in a mid single-digit million range from a release of a provision for legal risks 3) Related to operating revenue

Total assets have risen to EUR 4.03 bn –With 26.8% Group equity ratio remained clearly above minimum target
1) Figures 2013 adjusted for "at equity" consolidation of joint ventures2) Since fiscal year 2015 the figures presented in current and non-current financial liabilities include current and non-current finance lease liabilities, which have previously been included in other liabilities.
Prior-year figures have been adjusted accordingly.
26
Consolidated financial statements 2011-2016 – Key figures [EUR m]1)
TOTAL ASSETS FINANCIAL LIABILITIES2) EQUITY RATIO [%]Equity[EUR m]
26.3
2013
28.5
2014
28.9
2015
25.6
2012
29.1
2011 2016
26.8
855
2011
790
256289
2012
1,131
1,111977187
1,173
528
645
2013
909
921
1,420
2014
Non-current
Current
2015
1,8302,132
1,370
762
2016
Target:≥ 20%
675 775 958
457 583
939
740
926
5081,262
2,371
2012
1,763
2,174
2,8182,328
20132011
3,660
2015
1,013
654
1,196
902
2014
1,021
1,957
2016
1,050
4,028
Rentalvehicles
Others
Leaseassets
596 633 676 742 1,059 1,080

Continued focus on diversifying financial instruments and on balancing Sixt Group's maturity profile
27
Sixt Group – Maturities of financial liabilities as of 31 December 2016 [EUR m]
Bond of EUR 250 m with a tenor of 6 years successfully placed in 2016
In addition, Sixt Leasing SE issued a bond of EUR 250 m with a tenor of 4 years in January 2017
Sufficient headroom through unutilised bilateral credit lines in the amount of several EUR 100 m
Intensified cooperation with OEMs by utilisation of OEM operating lease facilities... sufficient headroom available through unutilised bilateral credit lines,
OEM operating lease facilities and commercial paper programme
Financial liabilities1) 2017 2018 2019 2020 2021 2022 2023 Total
Bonds - 250.0 - 253.82) - 250.0 - 753.8Borrower's note loans 245.0 - 93.0 30.0 224.5 - 150.5 743.0
Commercial paper 188.0 - - - - - - 188.0
Subtotal 433.0 250.0 93.0 283.8 224.5 250.0 150.5 1,684.8
Utilisation of bilateral credit lines3)
269.4 1.3 - - - - - 270.7
ABS 44.7 44.6 44.4 28.9 2.4 - - 165.0
Total 747.1 295.9 137.4 312.7 226.9 250.0 150.5 2,120.5
COMMENTS
1) Repayment amounts excluding accrued and in future payable interest 2) EUR 3.8 m (2020) refer to employee participation programme (matching stock programme)3) Incl. finance leases

Continued shareholder-friendly dividend policy –Increase in total payout by 8.9%
28
Sixt SE – Dividend proposal by management
TOTAL DIVIDEND PAYOUT [EUR m]DIVIDEND PROPOSAL
Bonusdividend
+8.9%
Dividend
2016
77.8
2015
71.5
43.0
28.5
1) As a percentage of consolidated profit after minority interests
2015 2016Proposal for ordinary shares EUR 1.50 EUR 1.65Proposal for preference shares EUR 1.52 EUR 1.67
Total dividend EUR 71.5 m EUR 77.8 m Dividend EUR 43.0 m EUR 77.8 m Bonus dividend EUR 28.5 m -
Dividend payout ratio1) 62.1% 54.7%

Sixt shares continue to show a highly attractive return profile
29
Sixt SE – Dividend per share [EUR]
PREFERENCE SHARESORDINARY SHARES
Dividend
Bonusdividend
2016
1.67
2015
1.52
0.92
0.60
2014
1.22
0.82
0.40
2013
1.02
0.67
0.35
2012
1.02
0.57
0.45
2011
0.77
0.62
0.15
Dividend
1.65
Bonusdividend
20162015
1.50
0.90
2011
0.75
0.60
0.15
0.60
2014
1.20
0.80
0.40
2013
1.00
0.65
0.35
2012
1.00
0.55
0.45
3.2%Dividendyield1)
1) Including bonus dividend and based on year-end closing price of ordinary shares and preference shares, respectively
4.3%Dividendyield1)
5.5% 6.4% 4.3% 3.7% 3.2% 6.2% 7.4% 5.3% 4.7% 4.0%

H1/17 Update: Sixt Group generated an EBT of EUR 102.6 m and a consolidated profit of EUR 72.9 m in H1/17
1) Before minority interests
30
Sixt Group – Key figures H1/17 [EUR m]
EBTREVENUE CONSOLIDATED PROFIT1)
Operatingrevenue
H1/17
1,066.8
147.0Other
1,213.8+5.7%
1,148.5145.0
H1/16
1,003.5
+1.4%
+6.3%
H1/16
81.9102.6
H1/17
+25.3%
EBIT 100.9 119.1
56.7
+28.5%
72.9
H1/16 H1/17

H1/17 Update: Sixt Group EBT by business unit –Earnings improvement in both segments
31
Sixt Group – EBT H1/17 by business unit1) [EUR m]
VEHICLE RENTALGROUP LEASINGEBTmargin2)
[%]
8.3 9.5
81.9
H1/16 H1/17
102.625.3%
H1/17
66.180.3
+21.5%
H1/16 H1/17
+3.2%
16.8
H1/16
16.2
7.9 7.78.2 9.6 EBTmargin2)
[%]
EBTmargin2)
[%]
1) Segment Other with EBT of EUR 5.5 m in H1/17 (H1/16 EUR -0.5 m)2) Based on operating revenue

H1/17 Update: Total assets have risen to almost EUR 4.6 bn –With 23.2% Group equity ratio has remained at a high level
32
Sixt Group – Key figures H1/17 [EUR m]
FINANCIAL LIABILITIESTOTAL ASSETS EQUITY RATIO [%]1,079.7 1,060.6Equity
[EUR m]
4,562.0
H1/17
Other1,098.3
Leaseassets
+533.5
2,370.3Rentalvehicles
2016
1,050.7
1,020.8
1,957.0
1,093.4
4,028.5
H1/17
761.6
2,132.0
1,370.4
2016
884.9
2,412.0
1,527.1Non-current
+280.0
Current 23.226.8
2016 H1/17
Target:≥ 20%

Agenda
33
03SIXT GROUP: OVERVIEW AND BUSINESS MODEL –Providing mobility from one minute to five yearsA.
22PERFORMANCE REVIEW 2016 & UPDATE H1/17 – Sustainable growth through internationalisation as well as new business models and new productsB.
33REVISED OUTLOOK 2017 – Solid growth in consolidated operating revenue and significant increase in Group EBT expectedC.
35APPENDIX – Selected key figures for the Sixt GroupD.
Strategic expansion measures continue in 2017 –Significantly higher Group EBT expected
34
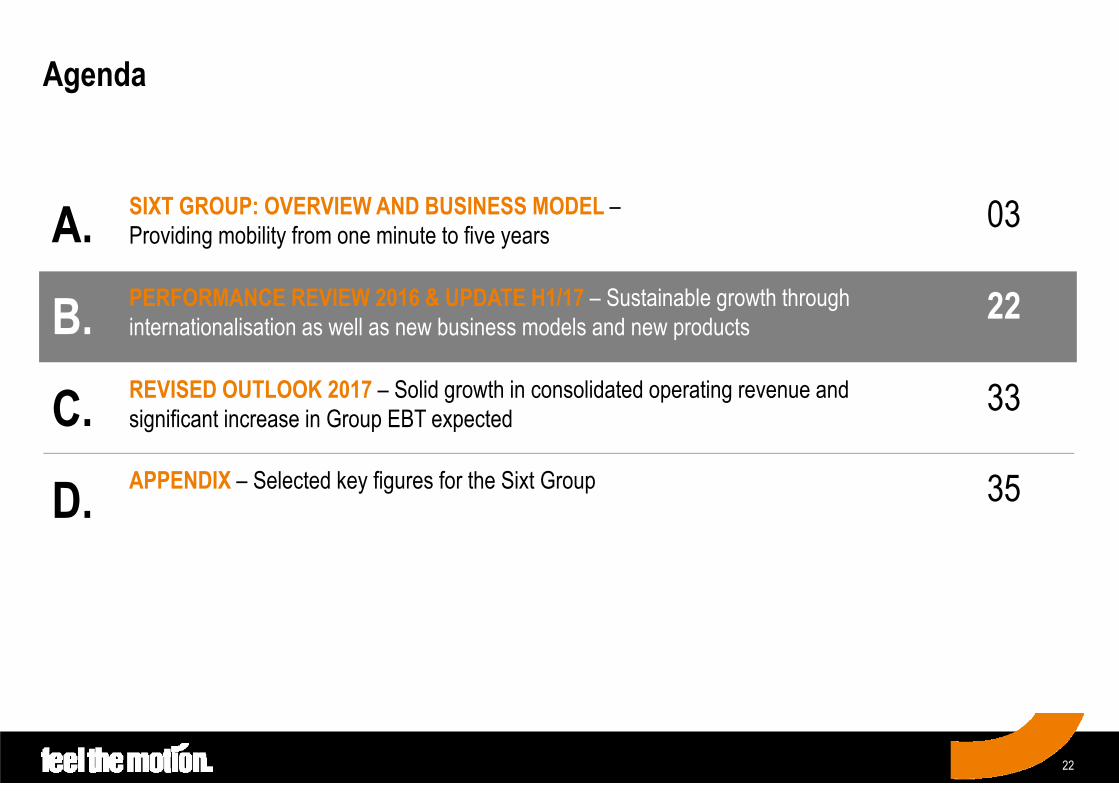
Sixt Group – Management expectations
Market environment and general conditions 2017
Measures andprospects 2017
VEHICLE RENTALVEHICLE RENTAL LEASINGLEASING REVISED GUIDANCE 2017REVISED GUIDANCE 2017
Positive economic conditions in Europe and in the USA
Increase in demand in the areas of business travel and tourism
Continuing fierce competition Rising fleet expenses and
operational costs
Continuation of strategic growth initiatives – especially in the USA and in Europe
Focus on qualitative andmargin-orientated growth
Strategic goal: Convergence of all mobility services
Maintain Pricing & Yield management focus
Modest expectations of the German leasing sector – minor corporate investment activities
Pressure on leasing companies by low interest rate environment
Continuing trend towards full-service leasing
Significant increase in demand in Online Retail
Continuation of qualitative and margin-orientated growth track
International expansion of activities
Business field Online Retail as major growth driver
Moderate expansion of contract portfolio in Fleet Leasing
Solid growth in
consolidated
operating revenue
Significant increase in
Group EBT
Expected equity ratio
considerably above
minimum target ratio
of 20%

Agenda
35
03SIXT GROUP: OVERVIEW AND BUSINESS MODEL –Providing mobility from one minute to five yearsA.
22PERFORMANCE REVIEW 2016 & UPDATE H1/17 – Sustainable growth through internationalisation as well as new business models and new productsB.
33REVISED OUTLOOK 2017 – Solid growth in consolidated operating revenue and significant increase in Group EBT expectedC.
35APPENDIX – Selected key figures for the Sixt GroupD.
Overview of selected Sixt Group key figures (1/3)
36
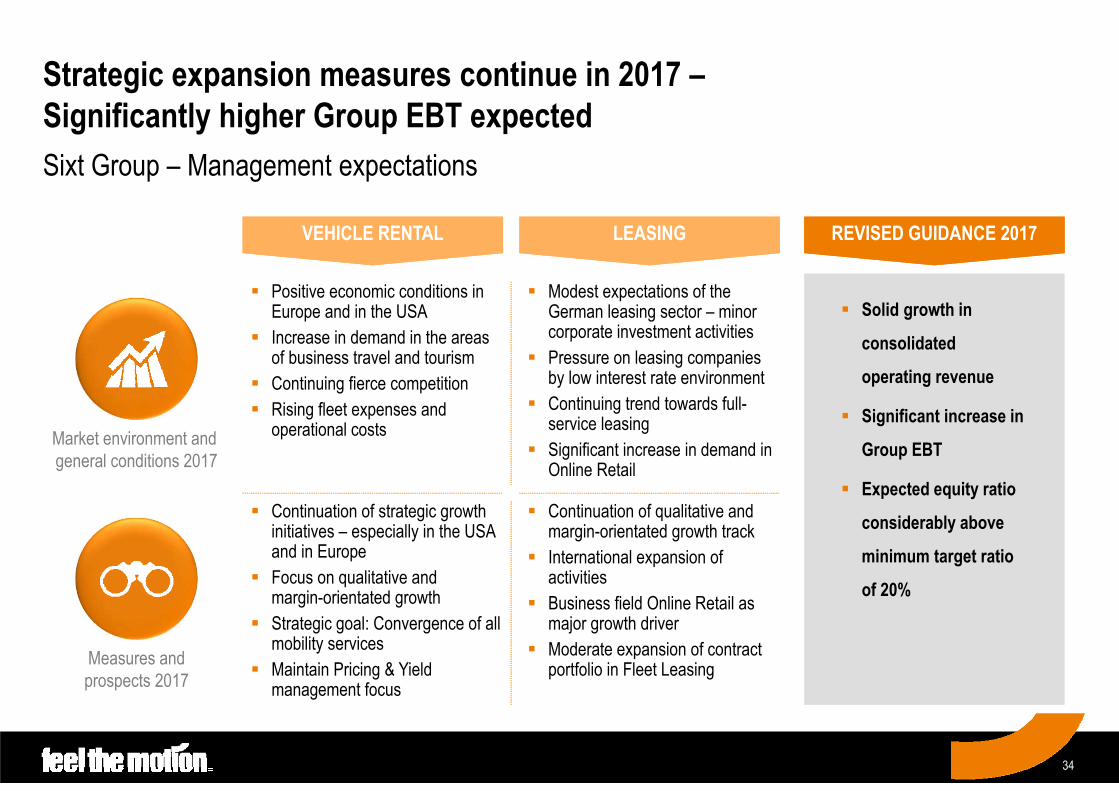
Consolidated financial statements 2016 & H1/17 – Key figures
Total assets [EUR m] Lease assets [EUR m] Rental vehicles [EUR m]EquityEquity ratio1) [%]Return on equity2) [%]Return on sales3) [%]Investments4) [EUR bn]
3,660.5957.8
1,763.31,058.8
28.917.59.6
5.26
+10.1+6.6
+11.0+2.0
-2.1ppt.+2.7ppt.+0.7ppt.
+8.1
4,028.51,020.81,957.01,079.7
26.820.210.35.68
2015 2016 YoY [%]
1) Ratio of equity to total assets 2) Ratio of EBT to equity 3) Ratio of EBT to operating revenue4) Value of the in-fleeted rental and leasing vehicles
4,369.9974.9
2,204.9987.222.6
8.23.07
+4.4+12.2+7.5+7.4
+0.6ppt.-
+1.4ppt.+11.8
4,562.01,093.42,370.31,060.6
23.2-
9.63.43
H1/16 H1/17 Change [%]

Overview of selected Sixt Group key figures (2/3)
37
Income statement 2016 & H1/17 [EUR m]
Consolidated total revenueFleet expenses and cost of lease assetsPersonnel expensesDepreciation and amortisation expenseNet other operating income/expensesEBITNet finance costsEBTIncome tax expenseConsolidated profit1)
2,179.3814.4274.5411.4
-457.1221.8-36.6185.257.0
128.2
+10.7+4.4
+21.9+21.7+3.1
+15.3+2.5
+17.9+8.1
+22.2
2,412.7850.0334.7500.7
-471.5255.8-37.5218.361.7
156.6
2015 2016 YoY [%]
1) Before minority interests
1,148.5420.1148.7240.3
-238.5100.9-19.081.925.256.7
+5.7+1.1
+14.8+5.7+2.8
+18.0-13.3+25.3+18.0+28.5
1,213.8424.8170.7253.9
-245.3119.1-16.5102.629.772.9
H1/16 H1/17 YoY [%]

Overview of selected Sixt Group key figures (3/3)
38
Consolidated financial statements 2016 & H1/17 – Key figures per business unit [EUR m]
LEASING BUSINESS UNITVEHICLE RENTAL BUSINESS UNIT
H1/17848.3
766.1
82.3453.180.3
9.5204.0162.0-14.3
Total rental revenue Thereof revenue
from vehicle rental Other revenue from
rental business Thereof abroadEBTEBT margin1) [%]Fleet expensesDepreciation expenseNet finance costs
H1/16348.6
206.1
142.544.016.2
7.9217.588.1
-10.9
Total leasing revenue Thereof leasing
revenue Thereof sales
revenue Thereof abroadEBTEBT margin1) [%]Cost of lease assetsDepreciation expenseNet finance costs
H1/17363.5
218.4
145.145.916.8
7.7227.590.7-9.6
H1/16797.3
718.0
79.3403.466.1
8.3209.1151.3-11.8
YoY [%]+6.4
+6.7
+3.7+12.3+21.5
+1.2ppt.-2.5+7.1
+21.8
YoY [%]+4.3
+6.0
+1.8+4.3+3.2
-0.2ppt.+4.6+2.9
-12.3
1) Ratio of EBT to operating revenue
20161,703.4
1,533.5
169.9880.8181.010.6
422.9321.3-27.5
20151,519.3
1,376.9
142.4728.6160.410.6
419.9239.1-23.9
YoY [%]+12.1
+11.4
+19.3+20.9+12.8
+0.0ppt.+0.7
+34.4+15.1
2015655.4
419.8
235.586.230.3
7.2408.5171.5-21.3
2016704.2
420.3
283.987.831.6
7.5439.3177.5-19.5
YoY [%]+7.5
+0.1
+20.5+1.8+4.3
+0.3ppt.+7.5+3.5-8.5

Contact details
39
Sixt SEZugspitzstrasse 182049 Pullach
Dr. Julian zu Putlitz Dieter HanelCFO Managing Director Finance & AccountingT: +49 (0)89 74444 - 4256 T: +49 (0)89 74444 - 4281F: +49 (0)89 74444 – 8 4256 F: +49 (0)89 74444 – 8 4281Email: [email protected] Email: [email protected]