Embed Size (px)
Citation preview
Investor Presentation – August 2016
2
Safe Harbor Statement
During this presentation management may discuss certain forward-looking statementsconcerning FEMSA’s future performance that should be considered as good faith estimates madeby the Company. These forward-looking statements reflect management expectations and arebased upon currently available data. Actual results are subject to future events anduncertainties, which could materially impact FEMSA’s actual performance.
3
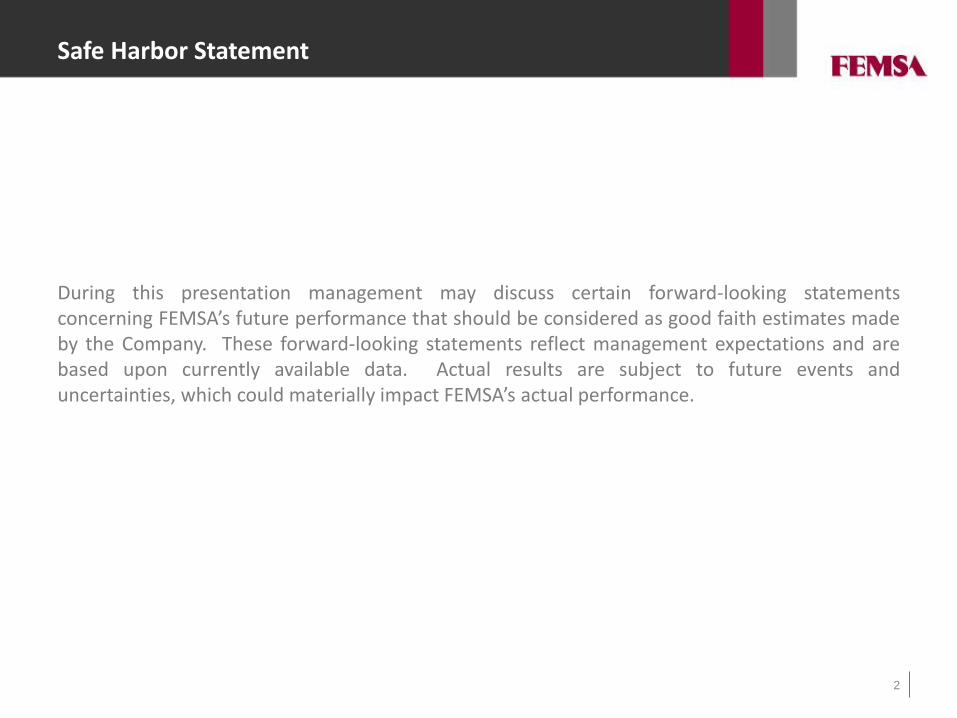
Overview
Market leader and fastest growing retail
chain in Mexico
The world’s most international brewer
Ownership
Coca-Cola’s largest franchise bottler in
the world by volume
48%(1) 100% 20%
(1) Represents 63% of shares with voting rights
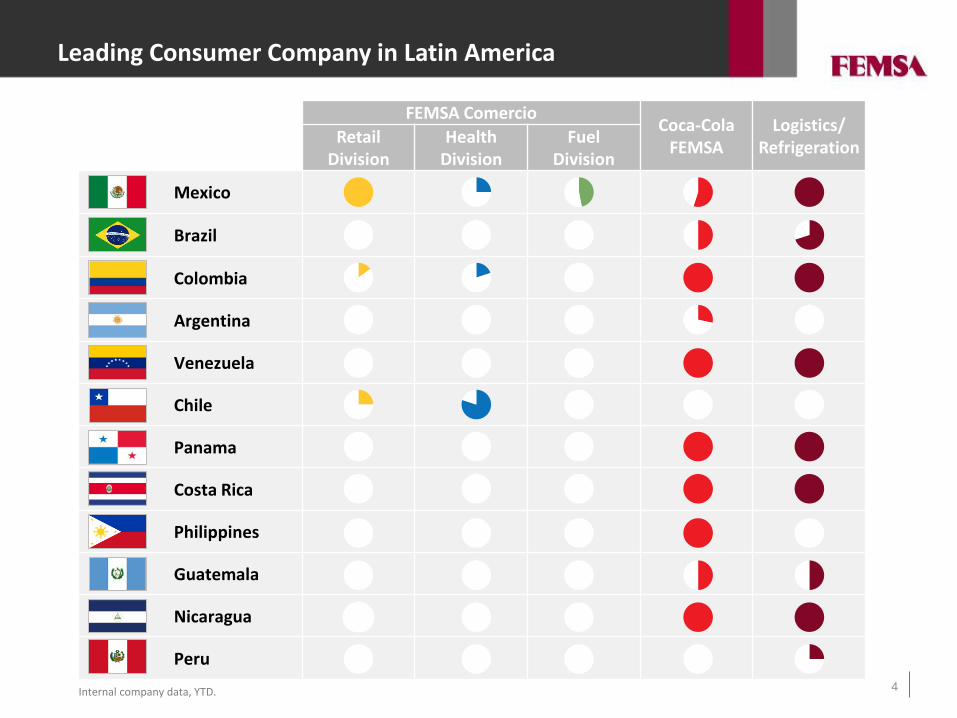
FEMSA ComercioCoca-Cola
FEMSALogistics/
RefrigerationRetail
DivisionHealth
DivisionFuel
Division
Mexico
Brazil
Colombia
Argentina
Venezuela
Chile
Panama
Costa Rica
Philippines
Guatemala
Nicaragua
Peru
4
Leading Consumer Company in Latin America
Internal company data, YTD.
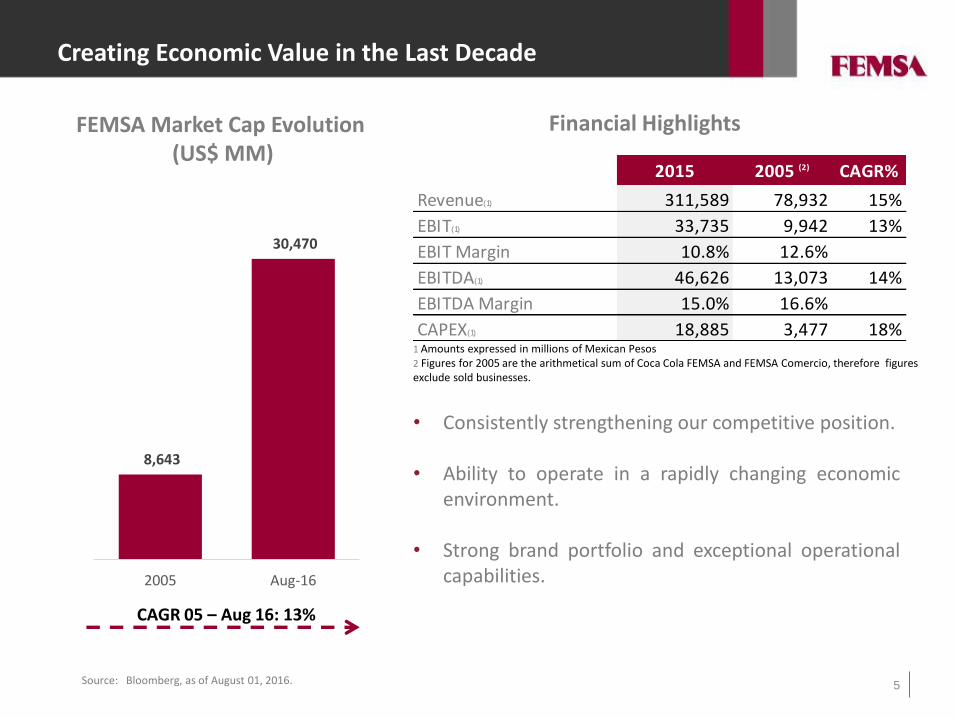
8,643
30,470
2005 Aug-16
5
Creating Economic Value in the Last Decade
Source: Bloomberg, as of August 01, 2016.
FEMSA Market Cap Evolution (US$ MM)
CAGR 05 – Aug 16: 13%
1 Amounts expressed in millions of Mexican Pesos2 Figures for 2005 are the arithmetical sum of Coca Cola FEMSA and FEMSA Comercio, therefore figures exclude sold businesses.
• Consistently strengthening our competitive position.
• Ability to operate in a rapidly changing economicenvironment.
• Strong brand portfolio and exceptional operationalcapabilities.
Financial Highlights
2015 2005 (2) CAGR%
Revenue(1) 311,589 78,932 15%
EBIT(1) 33,735 9,942 13%
EBIT Margin 10.8% 12.6%
EBITDA(1) 46,626 13,073 14%
EBITDA Margin 15.0% 16.6%
CAPEX(1) 18,885 3,477 18%
6
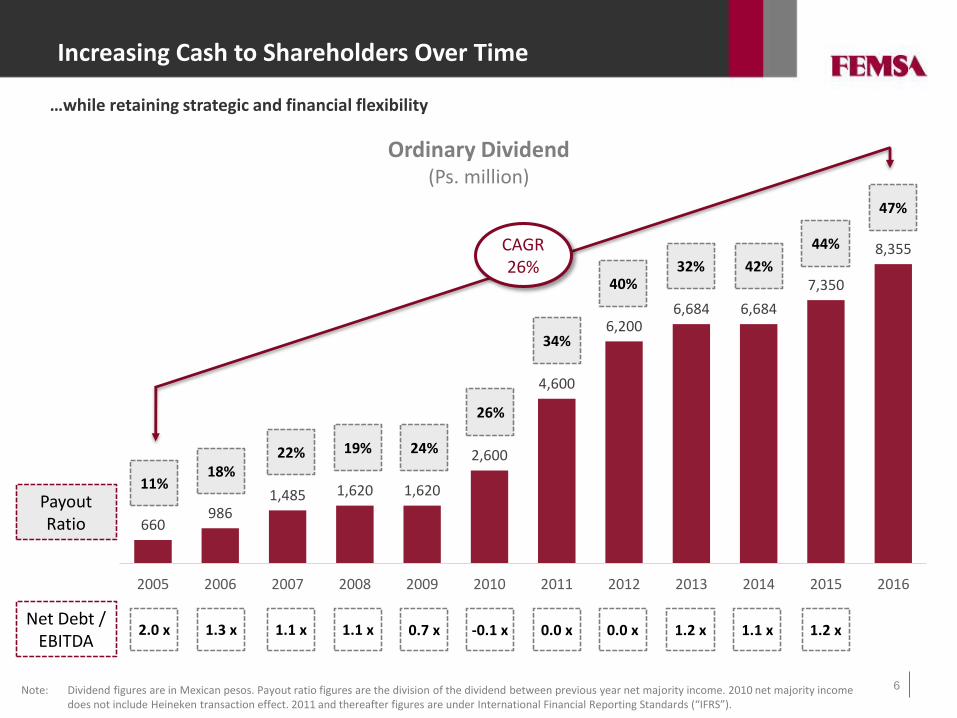
Increasing Cash to Shareholders Over Time
660986
1,485 1,620 1,620
2,600
4,600
6,2006,684 6,684
7,350
8,355
2005 2006 2007 2008 2009 2010 2011 2012 2013 2014 2015 2016
Ordinary Dividend(Ps. million)
Note: Dividend figures are in Mexican pesos. Payout ratio figures are the division of the dividend between previous year net majority income. 2010 net majority income does not include Heineken transaction effect. 2011 and thereafter figures are under International Financial Reporting Standards (“IFRS”).
…while retaining strategic and financial flexibility
2.0 xNet Debt /
EBITDA
11%PayoutRatio
18%22% 19% 24%
26%
34%
40%32% 42%
44%
47%
1.3 x 1.1 x 1.1 x 0.7 x -0.1 x 0.0 x 0.0 x 1.2 x 1.1 x 1.2 x
CAGR 26%
7
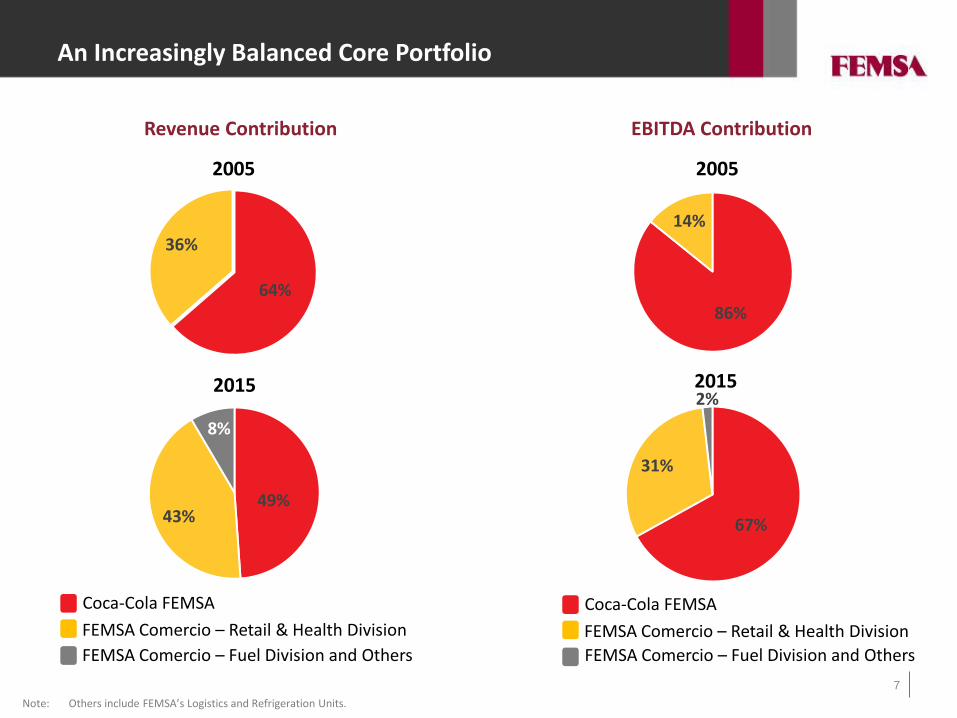
An Increasingly Balanced Core Portfolio
49%43%
8%
64%
36%
67%
31%
2%
86%
14%
Revenue Contribution EBITDA Contribution
2005
2015
2005
2015
Coca-Cola FEMSA
FEMSA Comercio – Retail & Health Division
Note: Others include FEMSA’s Logistics and Refrigeration Units.
Coca-Cola FEMSA
FEMSA Comercio – Retail & Health Division
FEMSA Comercio – Fuel Division and Others FEMSA Comercio – Fuel Division and Others
9
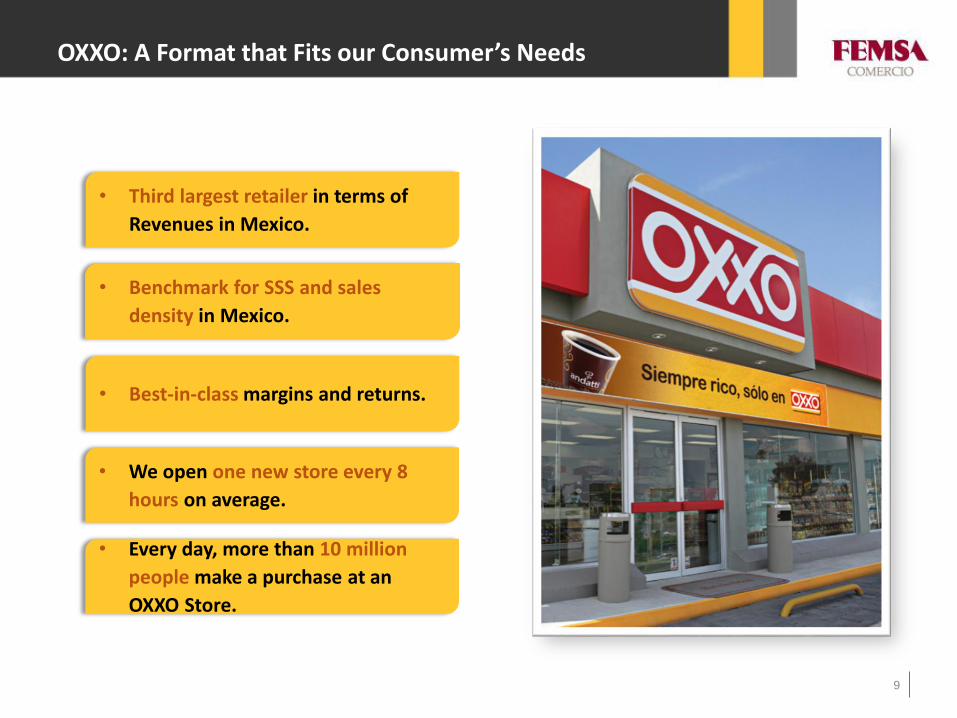
• Third largest retailer in terms of
Revenues in Mexico.
• Benchmark for SSS and sales
density in Mexico.
• Best-in-class margins and returns.
• We open one new store every 8
hours on average.
• Every day, more than 10 million
people make a purchase at an
OXXO Store.
OXXO: A Format that Fits our Consumer’s Needs
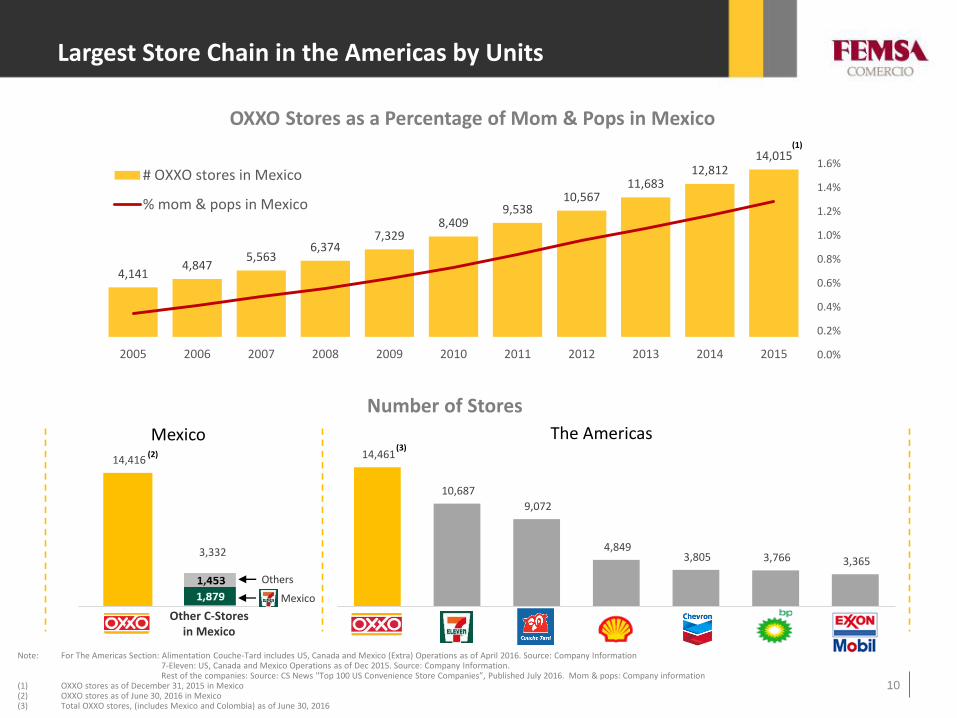
14,461
10,687
9,072
4,849 3,805 3,766 3,365
1 2 3 4 5 6 7
14,416
3,332
1 2
Mexico
10
4,1414,847
5,5636,374
7,3298,409
9,53810,567
11,68312,812
14,015
0.0%
0.2%
0.4%
0.6%
0.8%
1.0%
1.2%
1.4%
1.6%
2005 2006 2007 2008 2009 2010 2011 2012 2013 2014 2015
# OXXO stores in Mexico
% mom & pops in Mexico
The Americas
Note: For The Americas Section: Alimentation Couche-Tard includes US, Canada and Mexico (Extra) Operations as of April 2016. Source: Company Information7-Eleven: US, Canada and Mexico Operations as of Dec 2015. Source: Company Information.Rest of the companies: Source: CS News "Top 100 US Convenience Store Companies”, Published July 2016. Mom & pops: Company information
(1) OXXO stores as of December 31, 2015 in Mexico(2) OXXO stores as of June 30, 2016 in Mexico (3) Total OXXO stores, (includes Mexico and Colombia) as of June 30, 2016
Other C-Storesin Mexico
Others
Mexico
(2)
(1)
OXXO Stores as a Percentage of Mom & Pops in Mexico
Number of Stores
(3)
Largest Store Chain in the Americas by Units
11
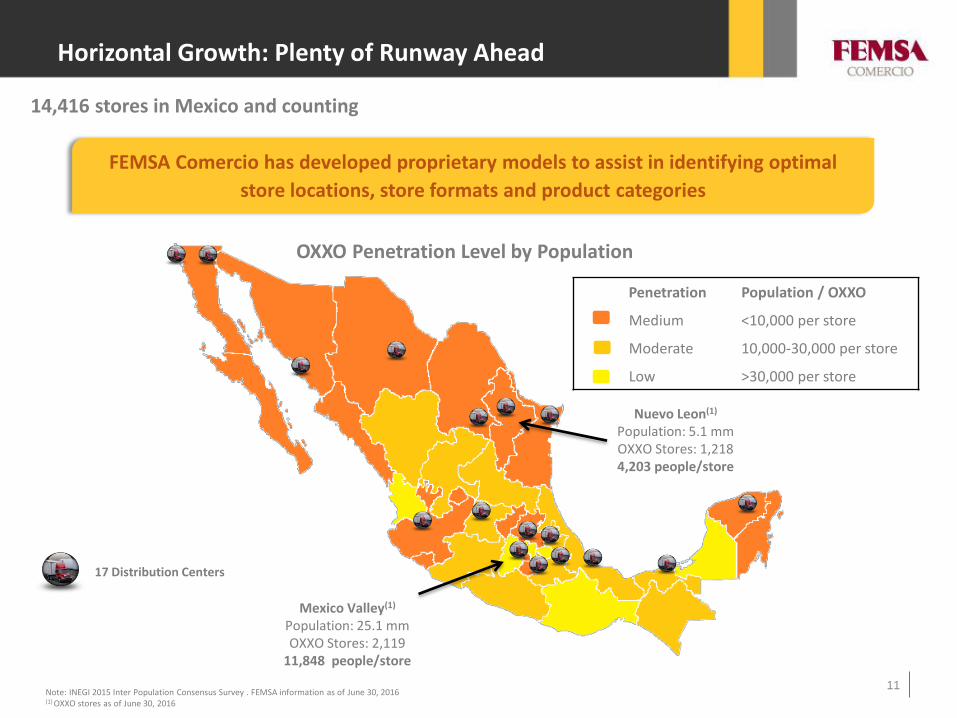
14,416 stores in Mexico and counting
OXXO Penetration Level by Population
17 Distribution Centers
Penetration Population / OXXO
Medium <10,000 per store
Moderate 10,000-30,000 per store
Low >30,000 per store
Nuevo Leon(1)
Population: 5.1 mmOXXO Stores: 1,2184,203 people/store
Note: INEGI 2015 Inter Population Consensus Survey . FEMSA information as of June 30, 2016(1) OXXO stores as of June 30, 2016
Mexico Valley(1)
Population: 25.1 mmOXXO Stores: 2,119
11,848 people/store
Horizontal Growth: Plenty of Runway Ahead
FEMSA Comercio has developed proprietary models to assist in identifying optimal
store locations, store formats and product categories
12
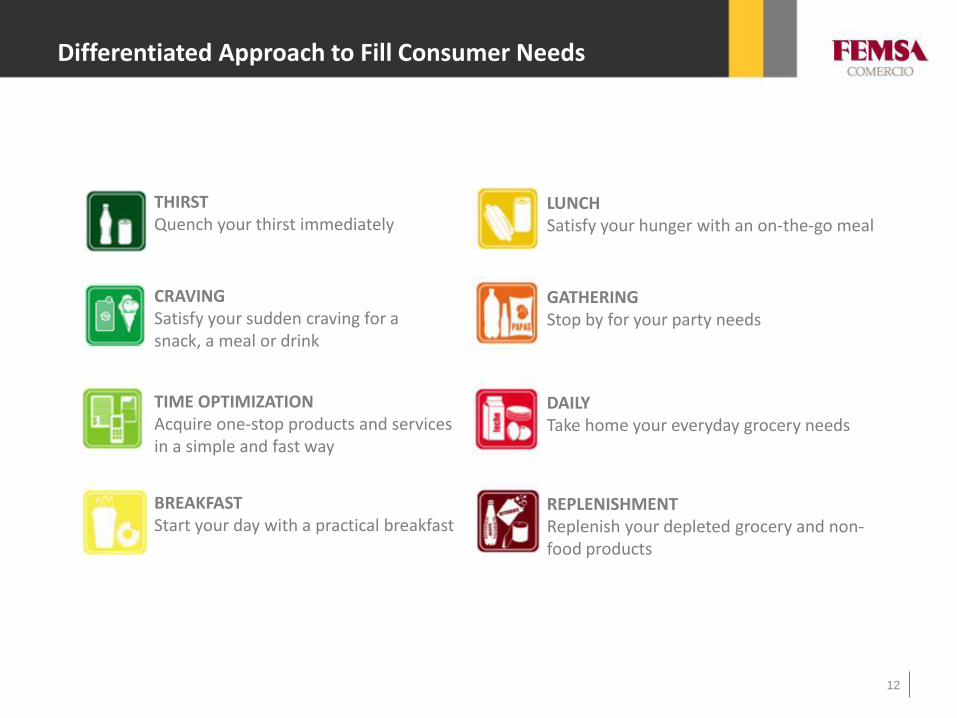
THIRSTQuench your thirst immediately
TIME OPTIMIZATIONAcquire one-stop products and services in a simple and fast way
DAILYTake home your everyday grocery needs
BREAKFASTStart your day with a practical breakfast
REPLENISHMENTReplenish your depleted grocery and non-food products
LUNCHSatisfy your hunger with an on-the-go meal
CRAVINGSatisfy your sudden craving for a snack, a meal or drink
GATHERINGStop by for your party needs
Differentiated Approach to Fill Consumer Needs
13
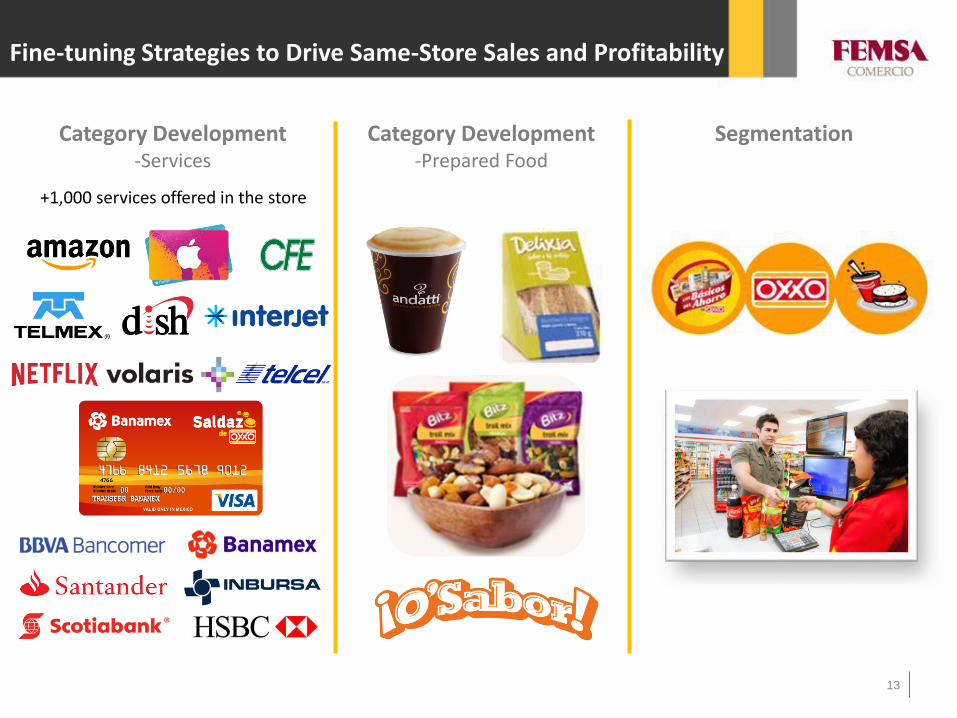
Fine-tuning Strategies to Drive Same-Store Sales and Profitability
SegmentationCategory Development -Prepared Food
Category Development -Services
+1,000 services offered in the store
14
Note: Numbers as of March 31th 2016
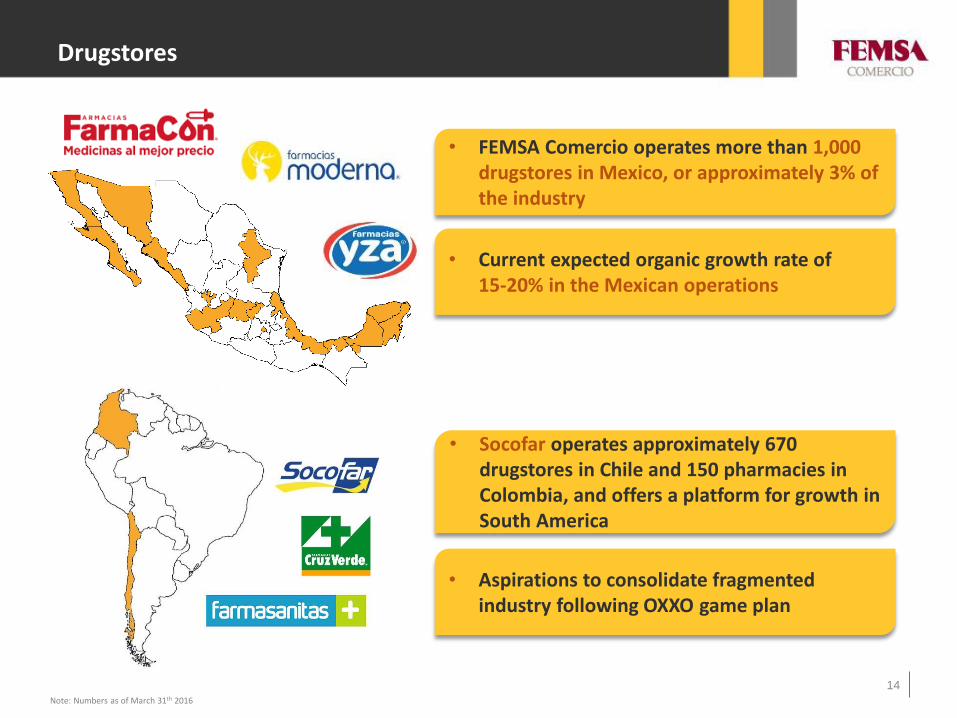
Drugstores
• FEMSA Comercio operates more than 1,000 drugstores in Mexico, or approximately 3% of the industry
• Current expected organic growth rate of 15-20% in the Mexican operations
• Socofar operates approximately 670 drugstores in Chile and 150 pharmacies in Colombia, and offers a platform for growth in South America
• Aspirations to consolidate fragmented industry following OXXO game plan
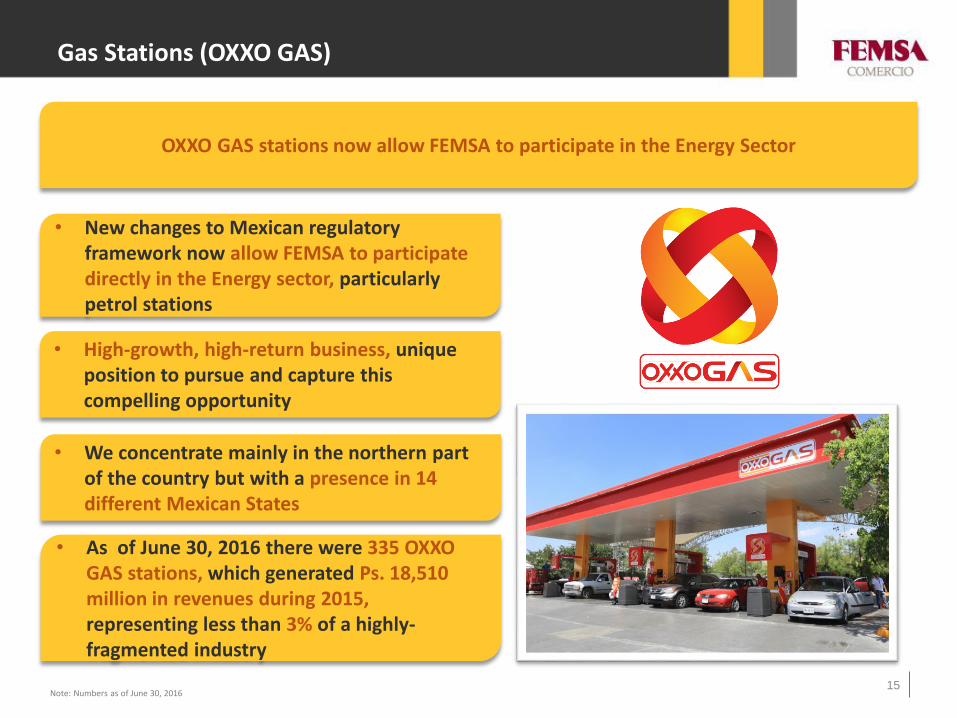
OXXO GAS stations now allow FEMSA to participate in the Energy Sector
15
Gas Stations (OXXO GAS)
Note: Numbers as of June 30, 2016
• New changes to Mexican regulatory framework now allow FEMSA to participate directly in the Energy sector, particularly petrol stations
• High-growth, high-return business, unique position to pursue and capture this compelling opportunity
• We concentrate mainly in the northern part of the country but with a presence in 14 different Mexican States
• As of June 30, 2016 there were 335 OXXO GAS stations, which generated Ps. 18,510 million in revenues during 2015, representing less than 3% of a highly-fragmented industry
16
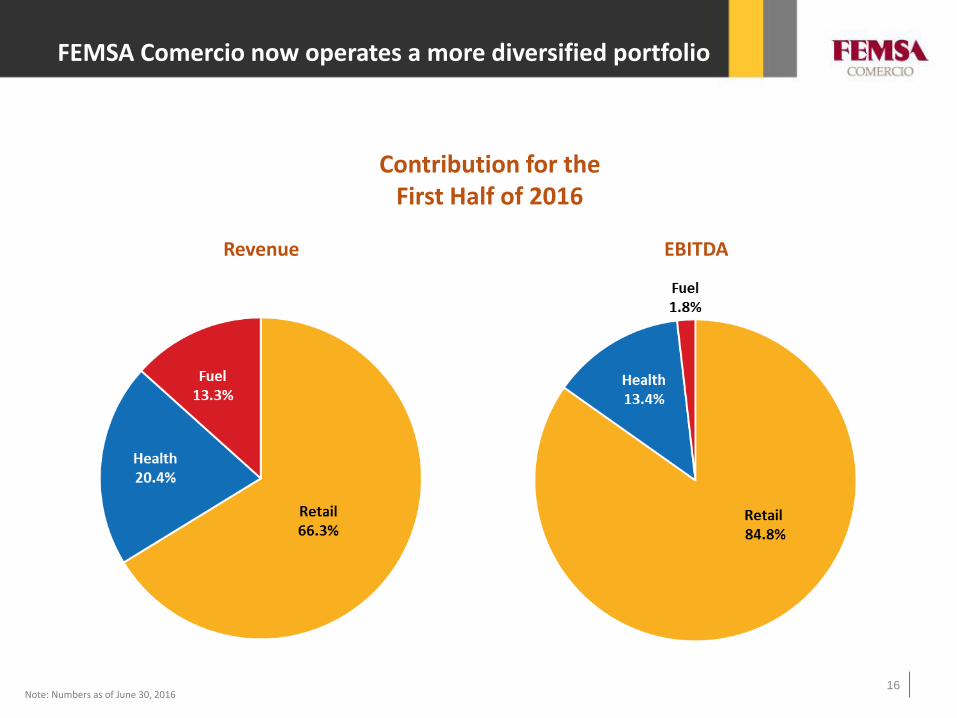
FEMSA Comercio now operates a more diversified portfolio
Note: Numbers as of June 30, 2016
Contribution for the First Half of 2016
Revenue EBITDA
$-
$2,000
$4,000
$6,000
$8,000
$10,000
$12,000
$14,000
$16,000
2005 2006 2007 2008 2009 2010 2011 2012 2013 2014 2015
17
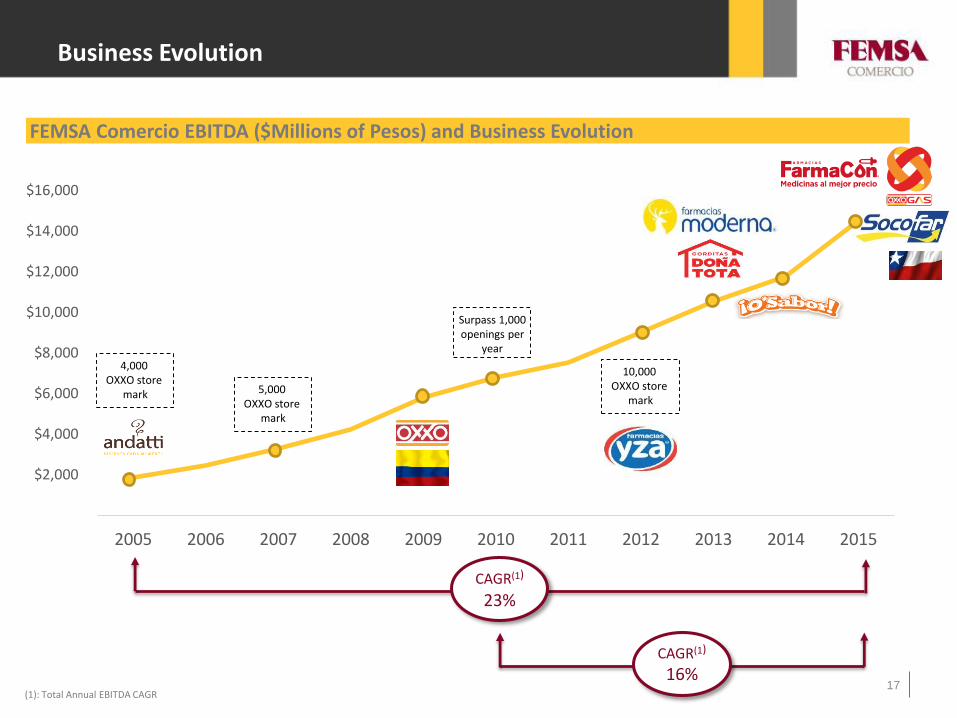
FEMSA Comercio EBITDA ($Millions of Pesos) and Business Evolution
Business Evolution
CAGR(1)
23%
CAGR(1)
16%(1): Total Annual EBITDA CAGR
4,000 OXXO store
mark 5,000 OXXO store
mark
Surpass 1,000openings per
year
10,000 OXXO store
mark
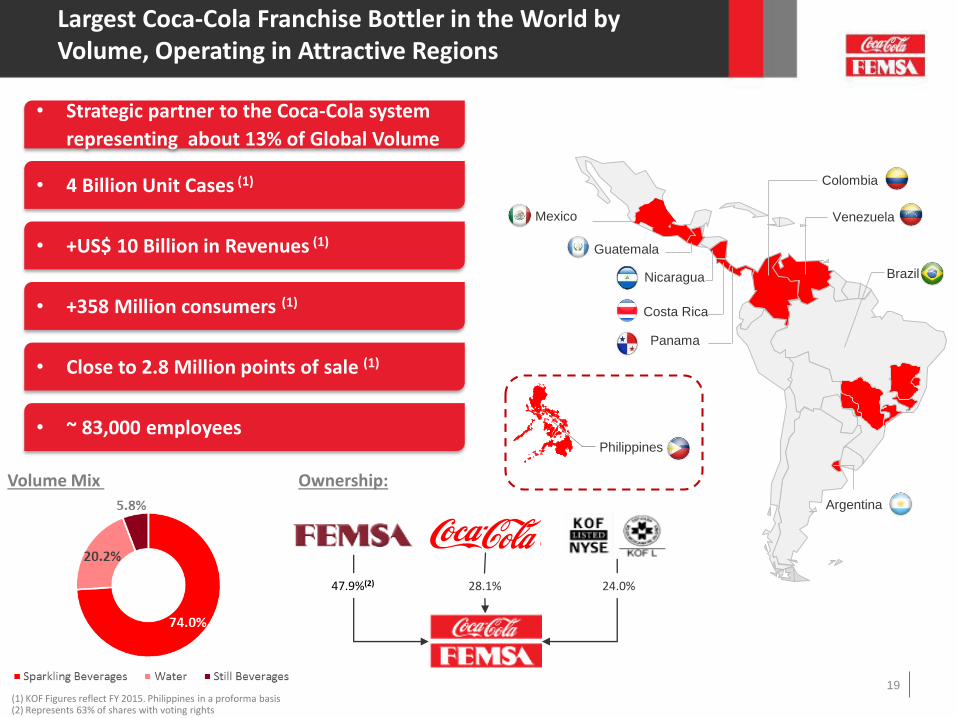
Largest Coca-Cola Franchise Bottler in the World by Volume, Operating in Attractive Regions
19
47.9%(2) 28.1% 24.0%
Volume Mix
(1) KOF Figures reflect FY 2015. Philippines in a proforma basis(2) Represents 63% of shares with voting rights
Ownership:
Mexico
Guatemala
Colombia
Venezuela
BrazilNicaragua
Costa Rica
Panama
Argentina
Philippines
• 4 Billion Unit Cases (1)
• +US$ 10 Billion in Revenues (1)
• +358 Million consumers (1)
• Close to 2.8 Million points of sale (1)
• ~ 83,000 employees
• Strategic partner to the Coca-Cola system
representing about 13% of Global Volume
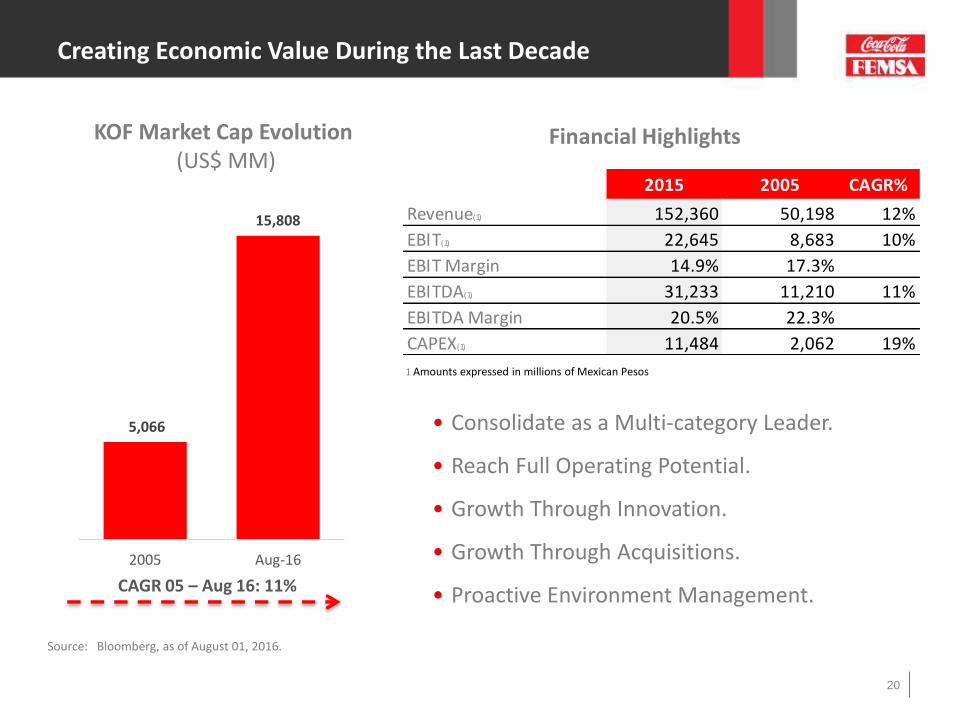
Creating Economic Value During the Last Decade
20
Source: Bloomberg, as of August 01, 2016.
KOF Market Cap Evolution (US$ MM)
• Consolidate as a Multi-category Leader.
• Reach Full Operating Potential.
• Growth Through Innovation.
• Growth Through Acquisitions.
• Proactive Environment Management.CAGR 05 – Aug 16: 11%
1 Amounts expressed in millions of Mexican Pesos
Financial Highlights
2015 2005 CAGR%
Revenue(1) 152,360 50,198 12%
EBIT(1) 22,645 8,683 10%
EBIT Margin 14.9% 17.3%
EBITDA(1) 31,233 11,210 11%
EBITDA Margin 20.5% 22.3%
CAPEX(1) 11,484 2,062 19%
5,066
15,808
2005 Aug-16
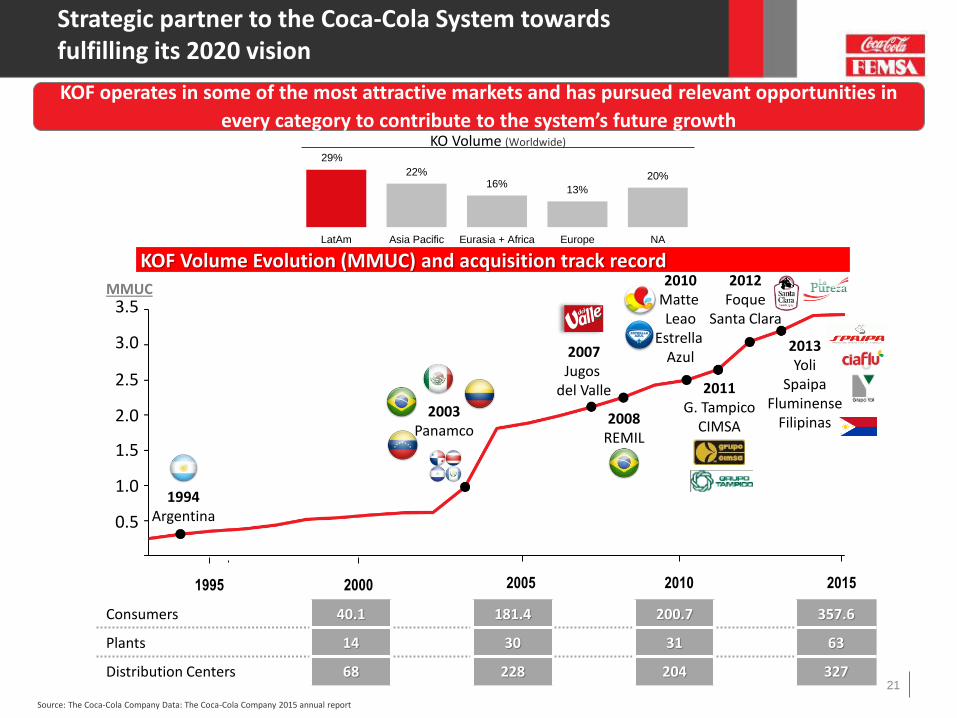
Strategic partner to the Coca-Cola System towards fulfilling its 2020 vision
21
29%
22%16%
13%
20%
LatAm Asia Pacific Eurasia + Africa Europe NA
Source: The Coca-Cola Company Data: The Coca-Cola Company 2015 annual report
KO Volume (Worldwide)
KOF Volume Evolution (MMUC) and acquisition track record
Consumers 40.1 181.4 200.7 357.6
Plants 14 30 31 63
Distribution Centers 68 228 204 327
2.0
1.0
3.0
2.5
3.5
1.5
0.5
MMUC
1994Argentina
2003Panamco
2007Jugos
del Valle
2008REMIL
2010Matte Leao
Estrella Azul
2011G. Tampico
CIMSA
2012Foque
Santa Clara
2013Yoli
SpaipaFluminense
Filipinas
20152010200520001995
KOF operates in some of the most attractive markets and has pursued relevant opportunities in
every category to contribute to the system’s future growth
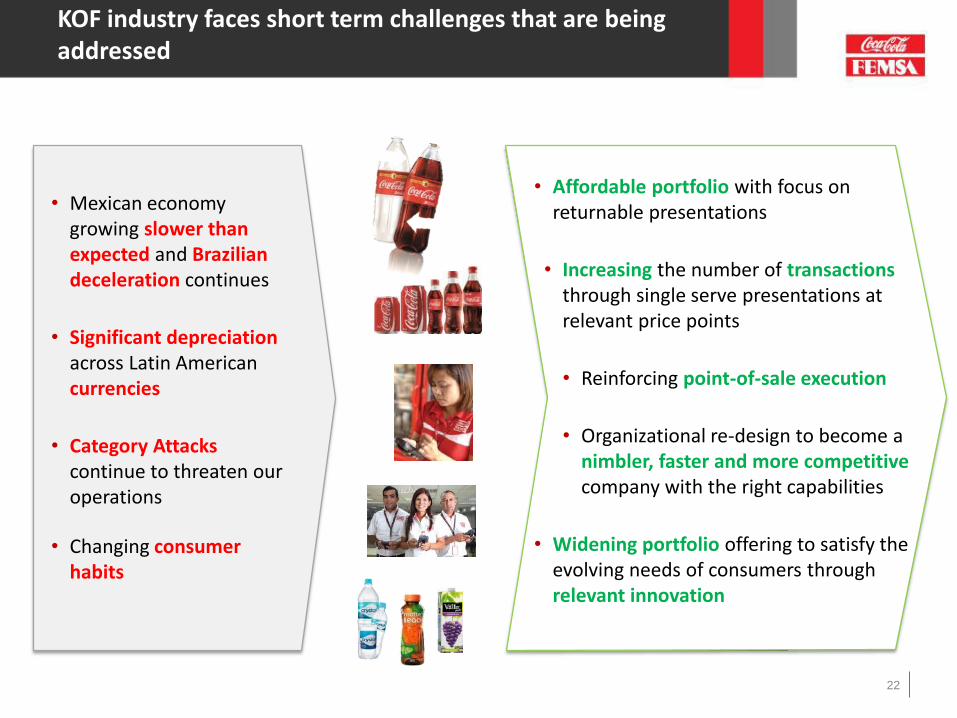
KOF industry faces short term challenges that are being addressed
22
• Mexican economy growing slower than expected and Brazilian deceleration continues
• Significant depreciation across Latin Americancurrencies
• Category Attacks continue to threaten our operations
• Changing consumer habits
• Affordable portfolio with focus on returnable presentations
• Increasing the number of transactionsthrough single serve presentations at relevant price points
• Reinforcing point-of-sale execution
• Organizational re-design to become a nimbler, faster and more competitivecompany with the right capabilities
• Widening portfolio offering to satisfy the evolving needs of consumers through relevant innovation
23
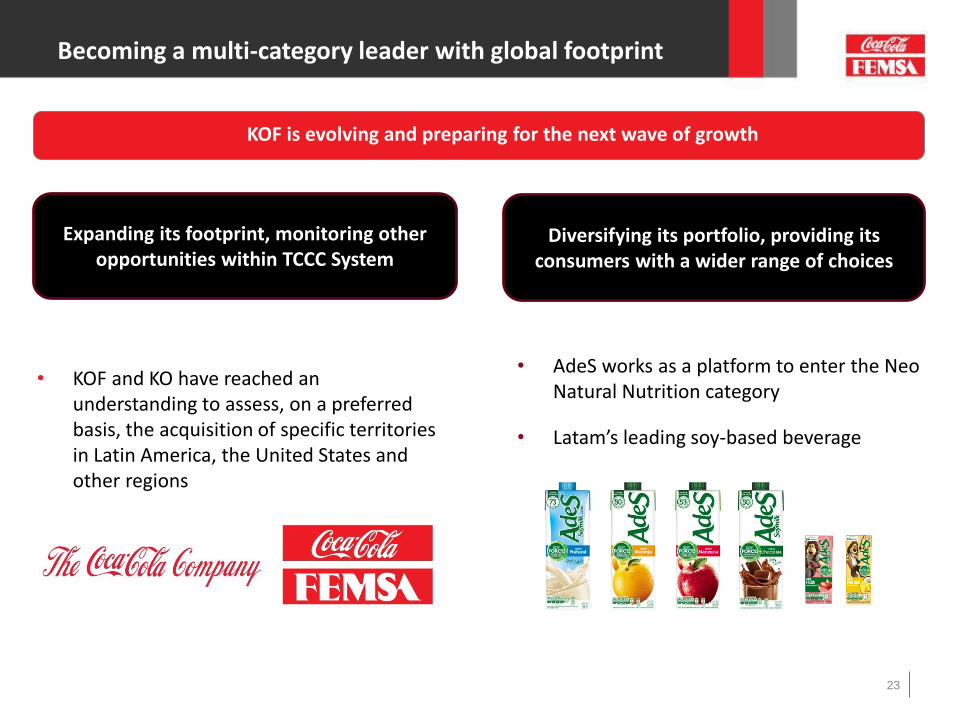
• KOF and KO have reached an understanding to assess, on a preferred basis, the acquisition of specific territories in Latin America, the United States and other regions
Expanding its footprint, monitoring other opportunities within TCCC System
• AdeS works as a platform to enter the Neo Natural Nutrition category
• Latam’s leading soy-based beverage
Diversifying its portfolio, providing its consumers with a wider range of choices
Becoming a multi-category leader with global footprint
KOF is evolving and preparing for the next wave of growth
Sustainability Strategy: Structure
25
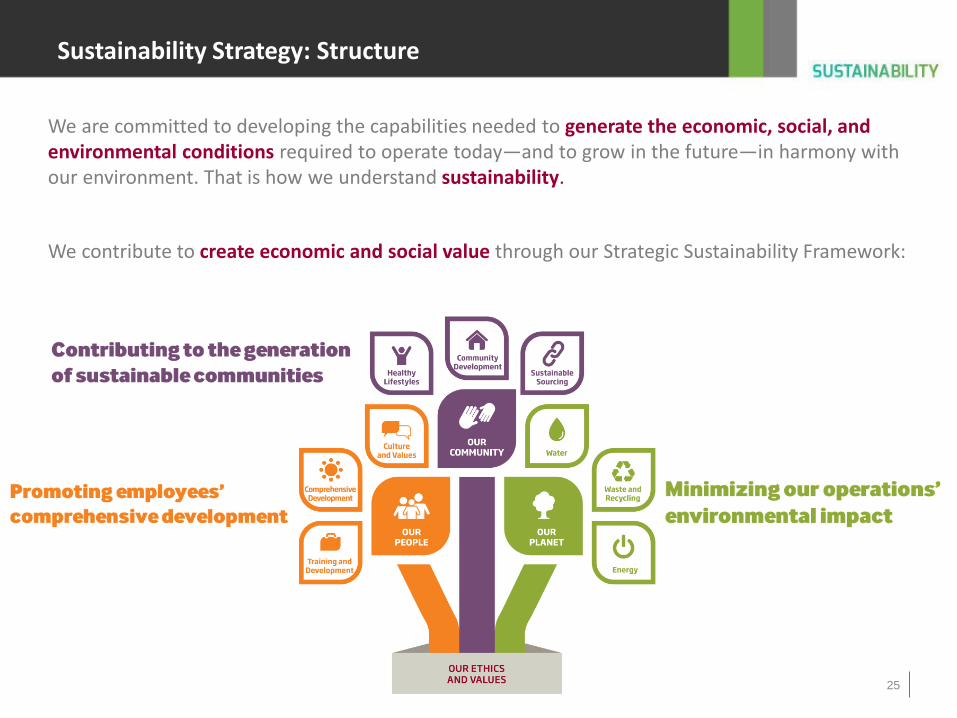
We are committed to developing the capabilities needed to generate the economic, social, and environmental conditions required to operate today—and to grow in the future—in harmony with our environment. That is how we understand sustainability.
We contribute to create economic and social value through our Strategic Sustainability Framework:
Selected Sustainability Achievements 2015
26
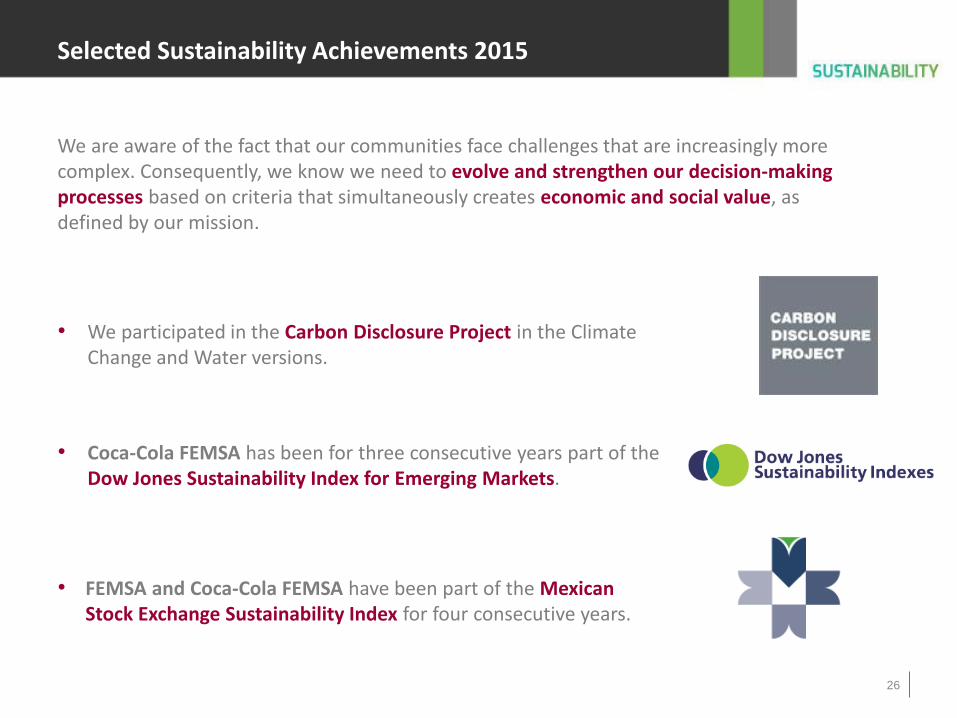
We are aware of the fact that our communities face challenges that are increasingly more complex. Consequently, we know we need to evolve and strengthen our decision-making processes based on criteria that simultaneously creates economic and social value, as defined by our mission.
• Coca-Cola FEMSA has been for three consecutive years part of the Dow Jones Sustainability Index for Emerging Markets.
• FEMSA and Coca-Cola FEMSA have been part of the Mexican Stock Exchange Sustainability Index for four consecutive years.
• We participated in the Carbon Disclosure Project in the Climate Change and Water versions.
2010 2011 2012 2013 2014 2015
USD
Mill
ion
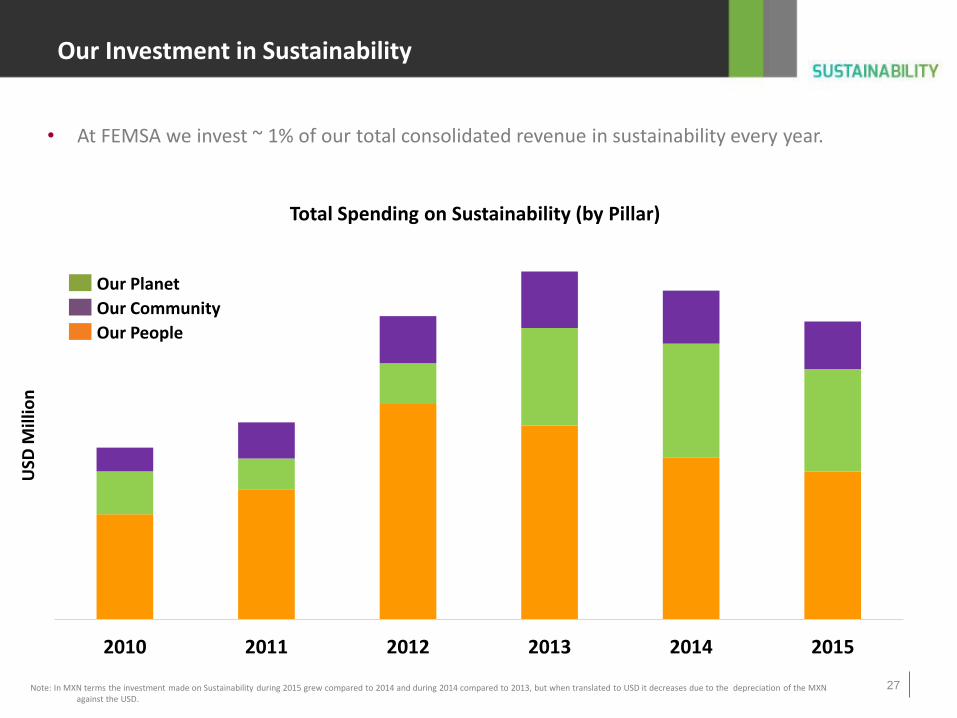
Total Spending on Sustainability (by Pillar)
Our People
Our Community
Our Planet
Our Investment in Sustainability
27
• At FEMSA we invest ~ 1% of our total consolidated revenue in sustainability every year.
Note: In MXN terms the investment made on Sustainability during 2015 grew compared to 2014 and during 2014 compared to 2013, but when translated to USD it decreases due to the depreciation of the MXN against the USD.
28
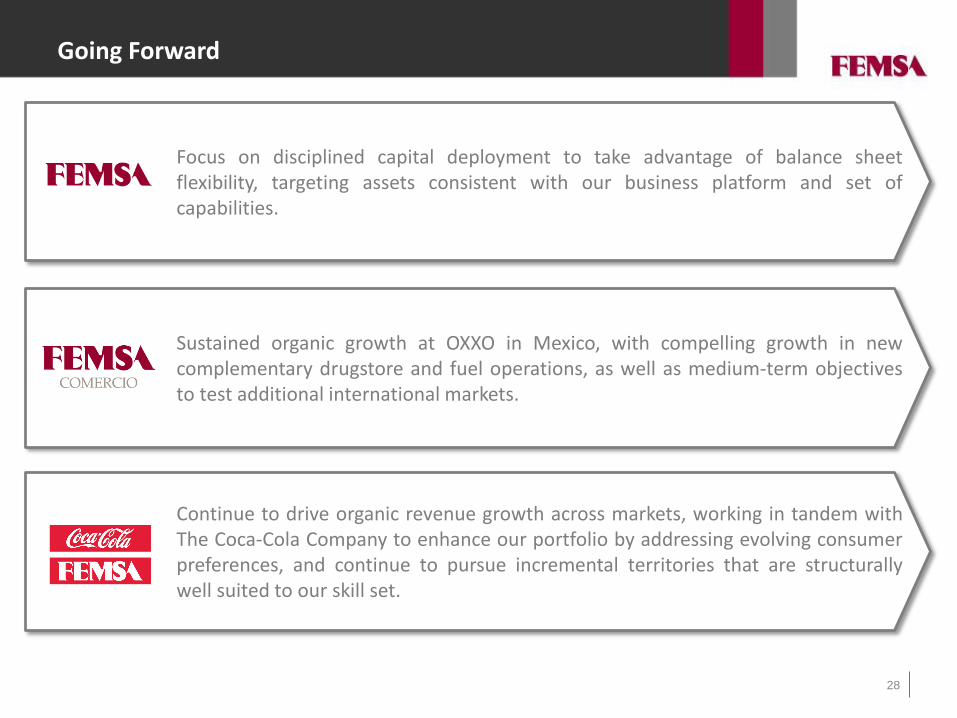
Going Forward
Sustained organic growth at OXXO in Mexico, with compelling growth in newcomplementary drugstore and fuel operations, as well as medium-term objectivesto test additional international markets.
Focus on disciplined capital deployment to take advantage of balance sheetflexibility, targeting assets consistent with our business platform and set ofcapabilities.
Continue to drive organic revenue growth across markets, working in tandem withThe Coca-Cola Company to enhance our portfolio by addressing evolving consumerpreferences, and continue to pursue incremental territories that are structurallywell suited to our skill set.
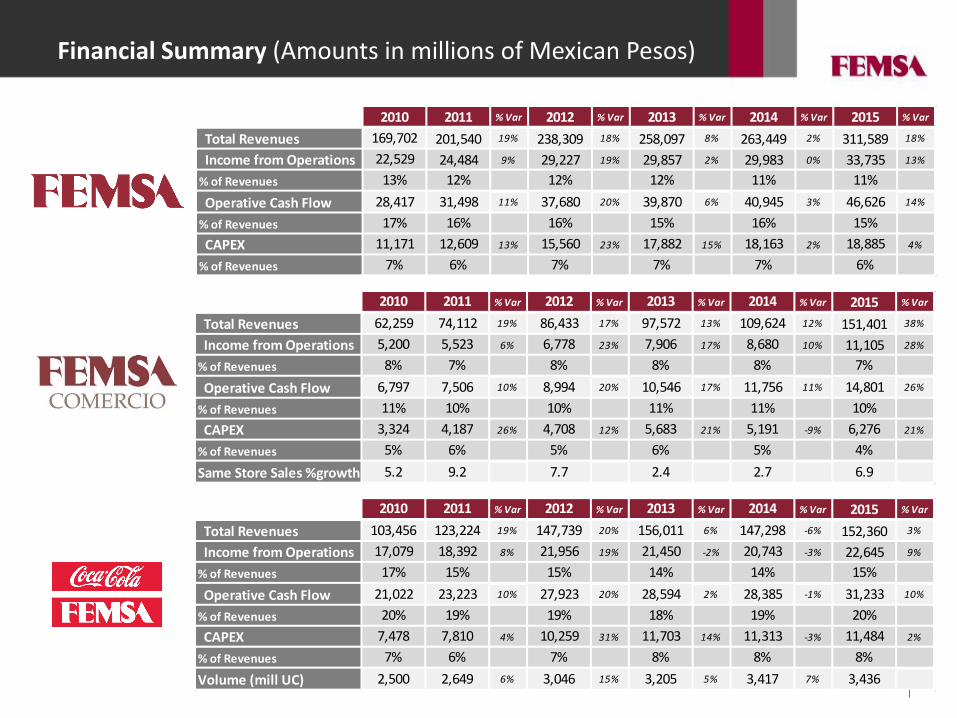
Financial Summary (Amounts in millions of Mexican Pesos)
29
2010 2011 % Var 2012 % Var 2013 % Var 2014 % Var 2015 % Var
Total Revenues 169,702 201,540 19% 238,309 18% 258,097 8% 263,449 2% 311,589 18%
Income from Operations 22,529 24,484 9% 29,227 19% 29,857 2% 29,983 0% 33,735 13%
% of Revenues 13% 12% 12% 12% 11% 11%
Operative Cash Flow 28,417 31,498 11% 37,680 20% 39,870 6% 40,945 3% 46,626 14%
% of Revenues 17% 16% 16% 15% 16% 15%
CAPEX 11,171 12,609 13% 15,560 23% 17,882 15% 18,163 2% 18,885 4%
% of Revenues 7% 6% 7% 7% 7% 6%
2010 2011 % Var 2012 % Var 2013 % Var 2014 % Var 2015 % Var
Total Revenues 62,259 74,112 19% 86,433 17% 97,572 13% 109,624 12% 151,401 38%
Income from Operations 5,200 5,523 6% 6,778 23% 7,906 17% 8,680 10% 11,105 28%
% of Revenues 8% 7% 8% 8% 8% 7%
Operative Cash Flow 6,797 7,506 10% 8,994 20% 10,546 17% 11,756 11% 14,801 26%
% of Revenues 11% 10% 10% 11% 11% 10%
CAPEX 3,324 4,187 26% 4,708 12% 5,683 21% 5,191 -9% 6,276 21%
% of Revenues 5% 6% 5% 6% 5% 4%
Same Store Sales %growth 5.2 9.2 7.7 2.4 2.7 6.9
2010 2011 % Var 2012 % Var 2013 % Var 2014 % Var 2015 % Var
Total Revenues 103,456 123,224 19% 147,739 20% 156,011 6% 147,298 -6% 152,360 3%
Income from Operations 17,079 18,392 8% 21,956 19% 21,450 -2% 20,743 -3% 22,645 9%
% of Revenues 17% 15% 15% 14% 14% 15%
Operative Cash Flow 21,022 23,223 10% 27,923 20% 28,594 2% 28,385 -1% 31,233 10%
% of Revenues 20% 19% 19% 18% 19% 20%
CAPEX 7,478 7,810 4% 10,259 31% 11,703 14% 11,313 -3% 11,484 2%
% of Revenues 7% 6% 7% 8% 8% 8%
Volume (mill UC) 2,500 2,649 6% 3,046 15% 3,205 5% 3,417 7% 3,436
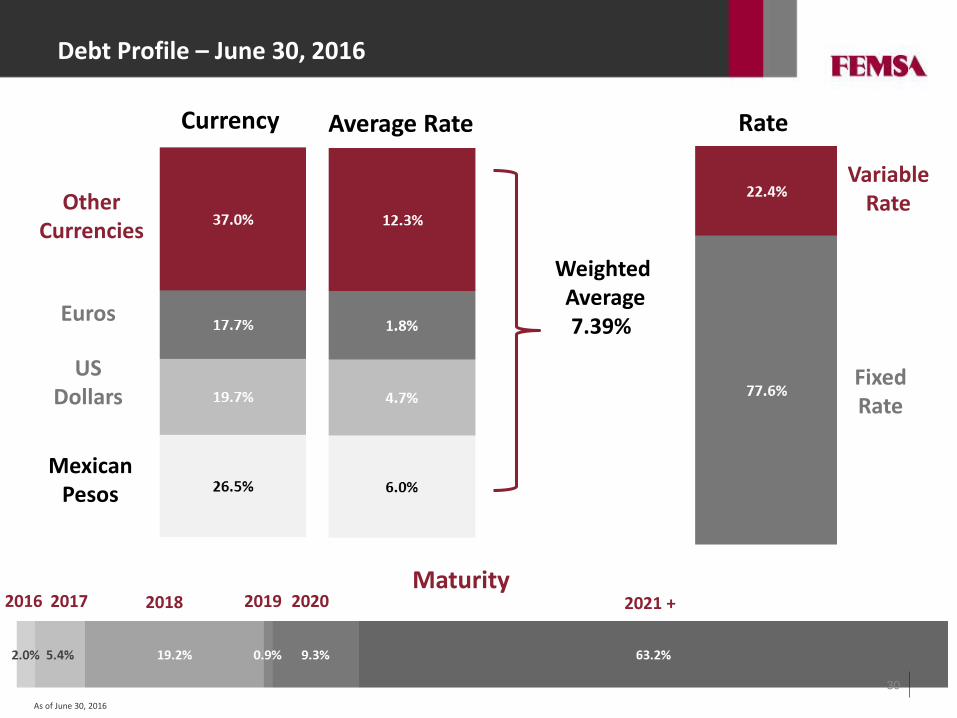
Debt Profile – June 30, 2016
30
Other Currencies
Euros
Mexican Pesos
Currency Average Rate
7.39%
Weighted Average
Rate
Variable Rate
FixedRate
Maturity2016 2017 2018 2019 2020 2021 +
US Dollars
As of June 30, 2016
Contact Information
[email protected]: (52) 818328-6167
Stock Information
Bolsa Mexicana de Valores (BMV): FEMSAUBDNew York Stock Exchange, Inc (NYSE): FMXADR 10:1