Embed Size (px)
Citation preview
Investor Presentation &
Business UpdateSeptember 2021
Forward-Looking Statements
Various statements contained in this presentation, including those that express a belief, expectation or intention, as well as those that are not statements of historical fact, are forward-
looking statements. These forward-looking statements may include projections and estimates concerning the timing and success of our strategies, plans or intentions. Forward-looking
statements are generally accompanied by words such as “estimate,” “project,” “predict,” “believe,” “expect,” “intend,” “anticipate,” “potential,” “plan,” “goal,” “guidance,” “outlook” or other
words that convey the uncertainty of future events or outcomes. Examples of forward-looking statements contained in this presentation include, among others, our 2021 Guidance, our
expectations with respect to the impacts of the COVID-19 pandemic, our belief that our acquisition and homebuilding programs will result in continued growth and the estimated timing and
volume of our development deliveries. We have based these forward-looking statements on our current expectations and assumptions about future events. These assumptions include,
among others, our projections and expectations regarding: market trends in the single-family home rental industry and in the local markets where we operate, our ability to institutionalize a
historically fragmented business model, our business strengths, our ideal tenant profile, the quality and location of our properties in attractive neighborhoods, the scale advantage of our
national platform and the superiority of our operational infrastructure, the effectiveness of our investment philosophy and diversified acquisition strategy, our ability to expand our
development program, our ability to grow our portfolio and to create a cash flow opportunity with attractive current yields and upside from increasing rents and cost efficiencies and our
understanding of our competition and general economic, demographic, regulatory and real estate conditions that may impact our business. While we consider these expectations and
assumptions to be reasonable, they are inherently subject to significant business, economic, competitive, regulatory and other risks, contingencies and uncertainties, most of which are
difficult to predict and many of which are beyond our control and could cause actual results to differ materially from any future results, performance or achievements expressed or implied by
these forward-looking statements. Investors should not place undue reliance on these forward-looking statements, which speak only as of the date of this presentation, September 20, 2021.
We undertake no obligation to update any forward-looking statements to conform to actual results or changes in our expectations, unless required by applicable law. Currently, one of the
most significant factors that could cause actual outcomes to differ materially from our forward-looking statements is the adverse effect of the COVID-19 pandemic on us, our tenants, the
economy and financial markets. The extent to which COVID-19 will impact our future financial results will depend on future developments, which are highly uncertain and cannot be
predicted with confidence, including the scope, severity and duration of the pandemic, including resurgences, new variants or strains, such as the Delta variant, the impact of government
regulations, vaccine adoption rates, the effectiveness of vaccines, and the direct and indirect economic effects of the pandemic and containment measures, among others. For a further
description of the risks and uncertainties that could cause actual results to differ from those expressed in these forward-looking statements, as well as risks relating to the business of the
Company in general, see the “Risk Factors” disclosed in the Company’s Annual Report on Form 10-K for the year ended December 31, 2020, Quarterly Report on Form 10-Q for the quarter
ended June 30, 2021, and in the Company’s subsequent filings with the Securities and Exchange Commission.
Non-GAAP Financial Measures
This presentation includes certain financial measures that were not prepared in accordance with U.S. generally accepted accounting principles (GAAP) because we believe they help investors
understand our performance. Any non-GAAP financial measures presented are not, and should not be viewed as, substitutes for financial measures required by U.S. GAAP and may not be
comparable to the calculation of similar measures of other companies. Definitions of these non-GAAP financial measures and a reconciliation of these measures to GAAP is included in the
Defined Terms and Non-GAAP Reconciliations section of this presentation, as well as the 2Q21 Supplemental Information Package available on our website at www.americanhomes4rent.com
under “For Investors.”
About American Homes 4 Rent
American Homes 4 Rent (NYSE: AMH) is a leader in the single-family home rental industry and “American Homes 4 Rent” is a nationally recognized brand for rental homes, known for high-
quality, good value and resident satisfaction. We are an internally managed Maryland real estate investment trust, or REIT, focused on acquiring, developing, renovating, leasing, and
operating attractive, single-family homes as rental properties. As of June 30, 2021 we owned 54,785 single-family properties in selected submarkets in 22 states.
2
Legal Disclosures
Contacts
American Homes 4 Rent Investor Relations
Phone: (855) 794-2447 / Email: [email protected]
American Homes 4 Rent Media Relations
Phone: (805) 413-5088 / Email: [email protected]
3
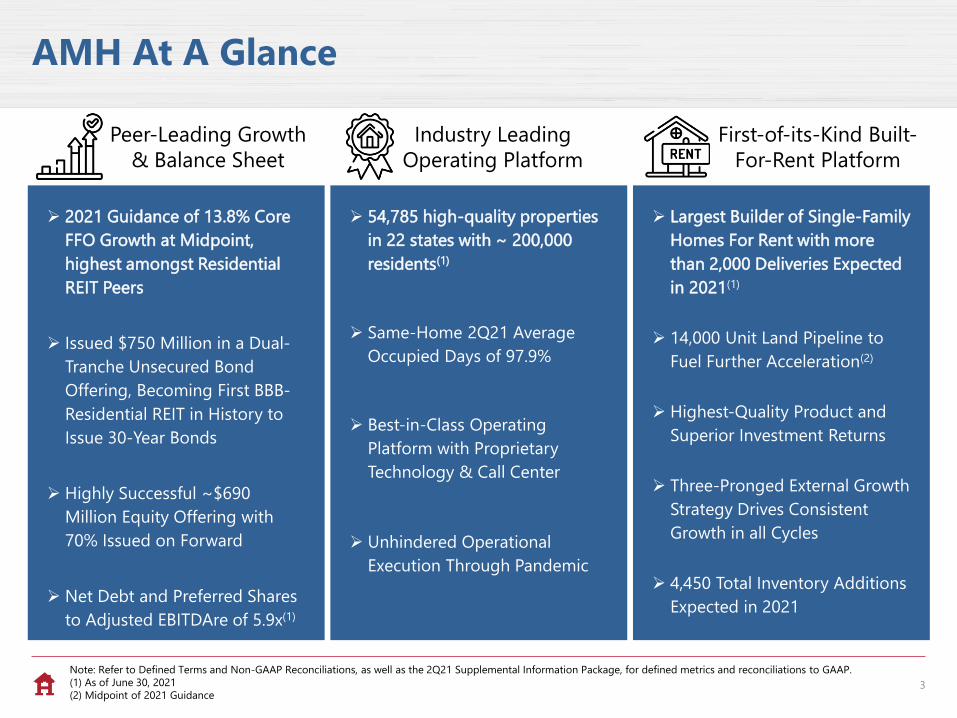
➢ Largest Builder of Single-Family
Homes For Rent with more
than 2,000 Deliveries Expected
in 2021(1)
➢ 14,000 Unit Land Pipeline to
Fuel Further Acceleration(2)
➢ Highest-Quality Product and
Superior Investment Returns
➢ Three-Pronged External Growth
Strategy Drives Consistent
Growth in all Cycles
➢ 4,450 Total Inventory Additions
Expected in 2021
➢ 54,785 high-quality properties
in 22 states with ~ 200,000
residents(1)
➢ Same-Home 2Q21 Average
Occupied Days of 97.9%
➢ Best-in-Class Operating
Platform with Proprietary
Technology & Call Center
➢ Unhindered Operational
Execution Through Pandemic
➢ 2021 Guidance of 13.8% Core
FFO Growth at Midpoint,
highest amongst Residential
REIT Peers
➢ Issued $750 Million in a Dual-
Tranche Unsecured Bond
Offering, Becoming First BBB-
Residential REIT in History to
Issue 30-Year Bonds
➢ Highly Successful ~$690
Million Equity Offering with
70% Issued on Forward
➢ Net Debt and Preferred Shares
to Adjusted EBITDAre of 5.9x(1)
Industry Leading
Operating Platform
Peer-Leading Growth
& Balance Sheet
First-of-its-Kind Built-
For-Rent Platform
Note: Refer to Defined Terms and Non-GAAP Reconciliations, as well as the 2Q21 Supplemental Information Package, for defined metrics and reconciliations to GAAP.
(1) As of June 30, 2021
(2) Midpoint of 2021 Guidance
AMH At A Glance
4
AMH Today
The Market Opportunity
Differentiated Growth Strategy: AMH Development
Strong Governance Practices
5
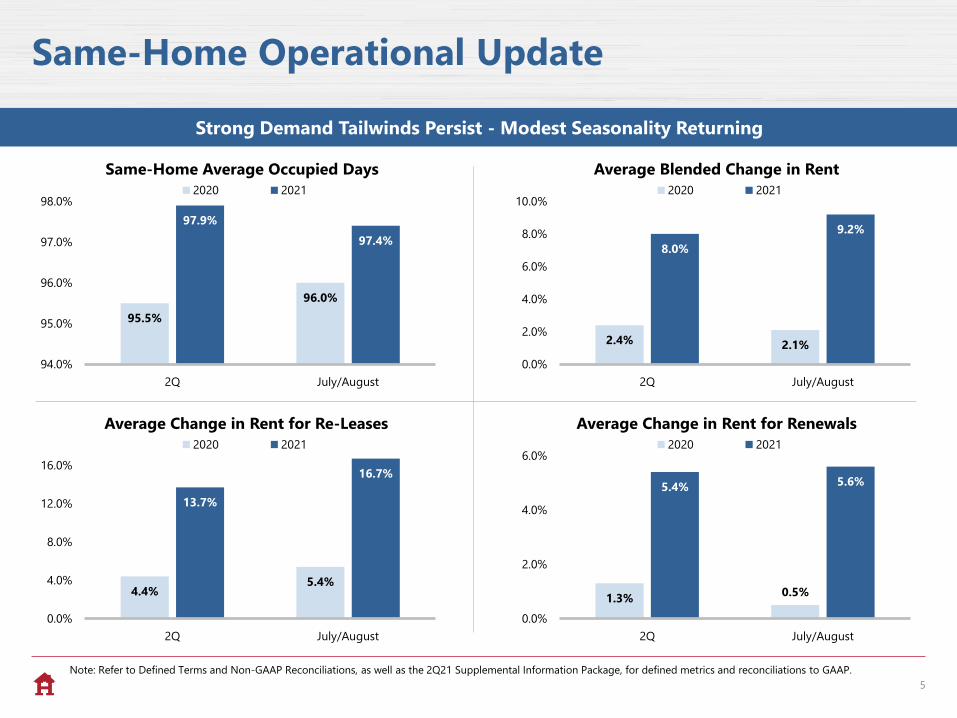
Same-Home Operational Update
Strong Demand Tailwinds Persist - Modest Seasonality Returning
95.5%
96.0%
97.9%
97.4%
94.0%
95.0%
96.0%
97.0%
98.0%
2Q July/August
Same-Home Average Occupied Days
2020 2021
2.4% 2.1%
8.0%
9.2%
0.0%
2.0%
4.0%
6.0%
8.0%
10.0%
2Q July/August
Average Blended Change in Rent
2020 2021
4.4%5.4%
13.7%
16.7%
0.0%
4.0%
8.0%
12.0%
16.0%
2Q July/August
Average Change in Rent for Re-Leases
2020 2021
1.3%0.5%
5.4% 5.6%
0.0%
2.0%
4.0%
6.0%
2Q July/August
Average Change in Rent for Renewals
2020 2021
Note: Refer to Defined Terms and Non-GAAP Reconciliations, as well as the 2Q21 Supplemental Information Package, for defined metrics and reconciliations to GAAP.
6
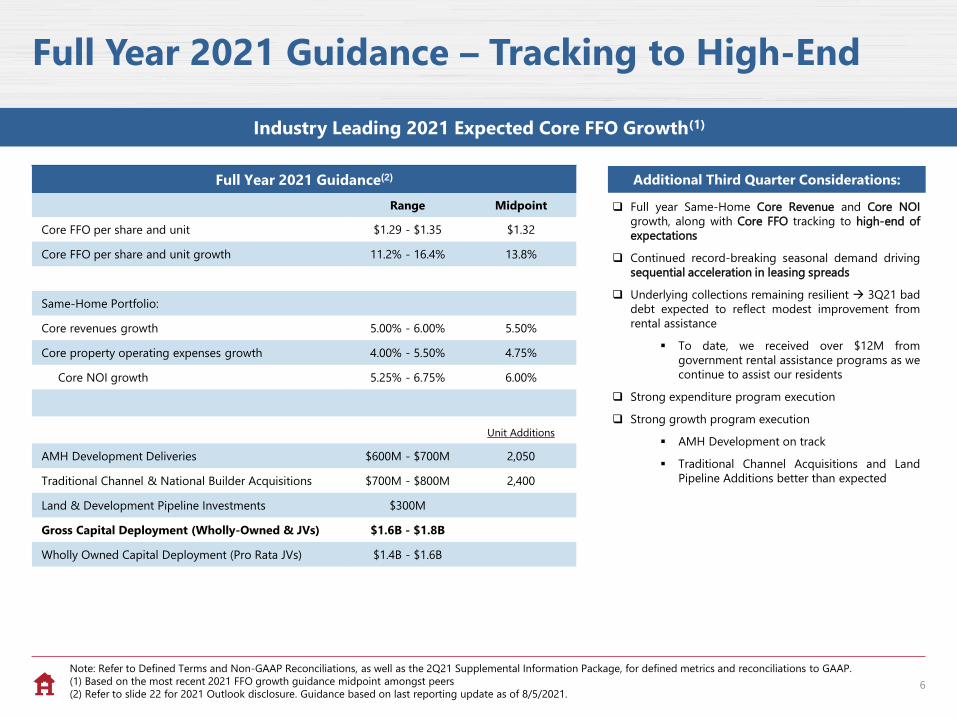
Full Year 2021 Guidance – Tracking to High-End
Full Year 2021 Guidance(2)
Range Midpoint
Core FFO per share and unit $1.29 - $1.35 $1.32
Core FFO per share and unit growth 11.2% - 16.4% 13.8%
Same-Home Portfolio:
Core revenues growth 5.00% - 6.00% 5.50%
Core property operating expenses growth 4.00% - 5.50% 4.75%
Core NOI growth 5.25% - 6.75% 6.00%
Unit Additions
AMH Development Deliveries $600M - $700M 2,050
Traditional Channel & National Builder Acquisitions $700M - $800M 2,400
Land & Development Pipeline Investments $300M
Gross Capital Deployment (Wholly-Owned & JVs) $1.6B - $1.8B
Wholly Owned Capital Deployment (Pro Rata JVs) $1.4B - $1.6B
Industry Leading 2021 Expected Core FFO Growth(1)
Note: Refer to Defined Terms and Non-GAAP Reconciliations, as well as the 2Q21 Supplemental Information Package, for defined metrics and reconciliations to GAAP.
(1) Based on the most recent 2021 FFO growth guidance midpoint amongst peers
(2) Refer to slide 22 for 2021 Outlook disclosure. Guidance based on last reporting update as of 8/5/2021.
❑ Full year Same-Home Core Revenue and Core NOI
growth, along with Core FFO tracking to high-end of
expectations
❑ Continued record-breaking seasonal demand driving
sequential acceleration in leasing spreads
❑ Underlying collections remaining resilient → 3Q21 bad
debt expected to reflect modest improvement from
rental assistance
▪ To date, we received over $12M from
government rental assistance programs as we
continue to assist our residents
❑ Strong expenditure program execution
❑ Strong growth program execution
▪ AMH Development on track
▪ Traditional Channel Acquisitions and Land
Pipeline Additions better than expected
Additional Third Quarter Considerations:
7
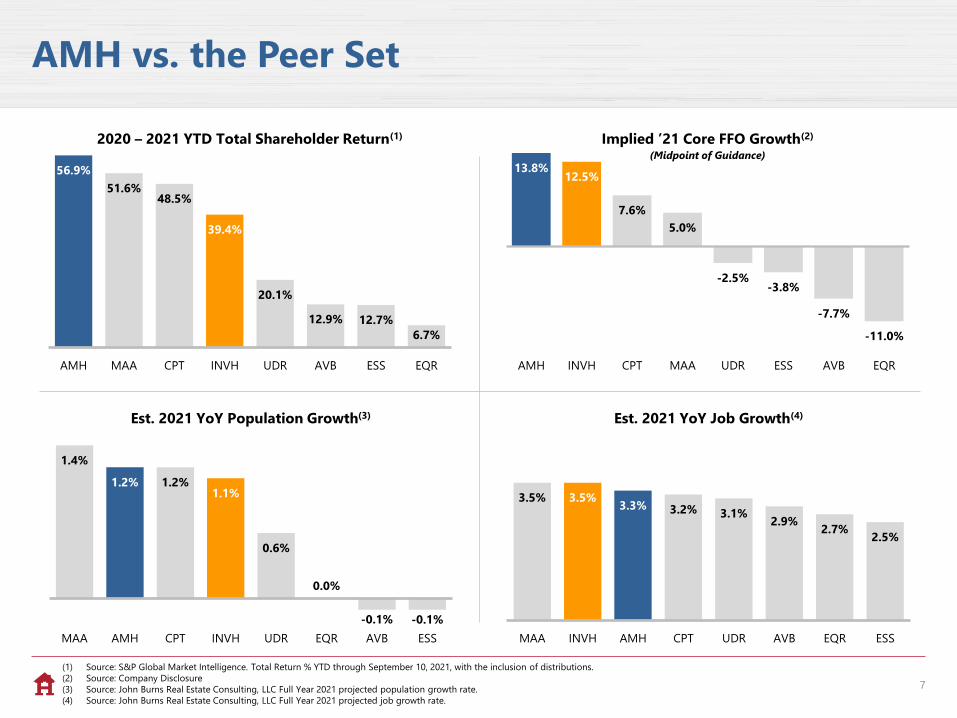
AMH vs. the Peer Set
(1) Source: S&P Global Market Intelligence. Total Return % YTD through September 10, 2021, with the inclusion of distributions.
(2) Source: Company Disclosure
(3) Source: John Burns Real Estate Consulting, LLC Full Year 2021 projected population growth rate.
(4) Source: John Burns Real Estate Consulting, LLC Full Year 2021 projected job growth rate.
56.9%
51.6%48.5%
39.4%
20.1%
12.9% 12.7%
6.7%
AMH MAA CPT INVH UDR AVB ESS EQR
2020 – 2021 YTD Total Shareholder Return(1)
13.8%12.5%
7.6%
5.0%
-2.5%-3.8%
-7.7%
-11.0%
AMH INVH CPT MAA UDR ESS AVB EQR
Implied ’21 Core FFO Growth(2)
(Midpoint of Guidance)
1.4%
1.2% 1.2%1.1%
0.6%
0.0%
-0.1% -0.1%
MAA AMH CPT INVH UDR EQR AVB ESS
Est. 2021 YoY Population Growth(3)
3.5% 3.5%3.3% 3.2% 3.1%
2.9%2.7%
2.5%
MAA INVH AMH CPT UDR AVB EQR ESS
Est. 2021 YoY Job Growth(4)
8
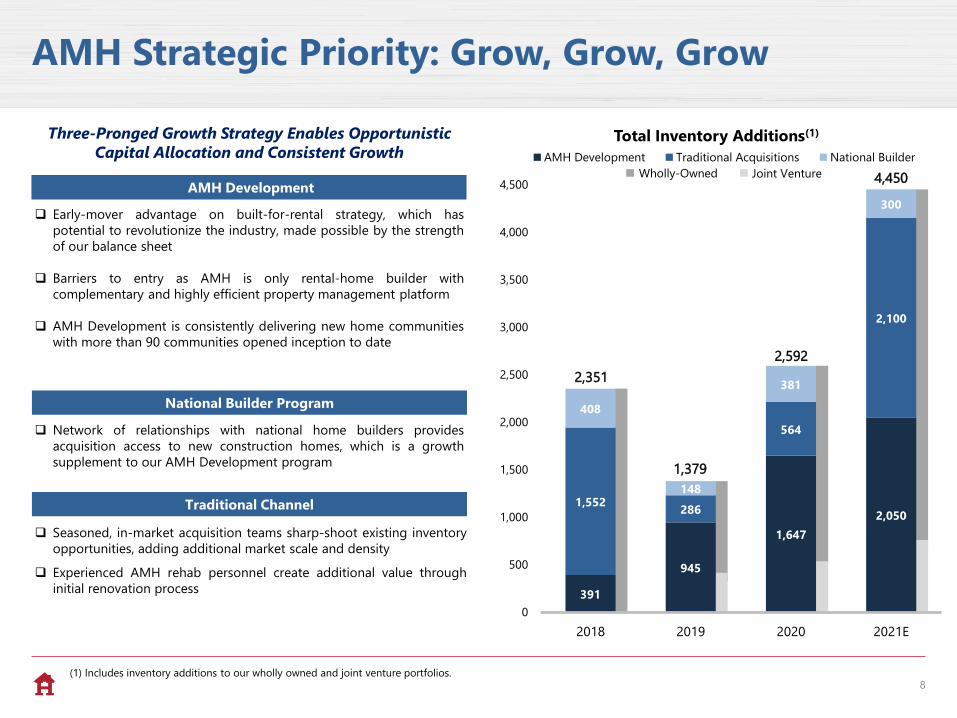
AMH Development
National Builder Program
Traditional Channel
❑ Network of relationships with national home builders provides
acquisition access to new construction homes, which is a growth
supplement to our AMH Development program
❑ Seasoned, in-market acquisition teams sharp-shoot existing inventory
opportunities, adding additional market scale and density
❑ Experienced AMH rehab personnel create additional value through
initial renovation process
(1) Includes inventory additions to our wholly owned and joint venture portfolios.
❑ Early-mover advantage on built-for-rental strategy, which has
potential to revolutionize the industry, made possible by the strength
of our balance sheet
❑ Barriers to entry as AMH is only rental-home builder with
complementary and highly efficient property management platform
❑ AMH Development is consistently delivering new home communities
with more than 90 communities opened inception to date
Three-Pronged Growth Strategy Enables Opportunistic
Capital Allocation and Consistent Growth
AMH Strategic Priority: Grow, Grow, Grow
2,351
1,379
2,592
4,450Wholly-Owned Joint Venture
391
945
1,647
2,0501,552
286
564
2,100
408
148
381
300
0
500
1,000
1,500
2,000
2,500
3,000
3,500
4,000
4,500
2018 2019 2020 2021E
Total Inventory Additions(1)
AMH Development Traditional Acquisitions National Builder
Unsecured Senior Notes Asset-backed Securitizations
Revolving Credit Facility Liquidity - Outstanding Forward Shares
Liquidity - Undrawn Revolving Credit Facility Liquidity - Cash and Cash Equivalents
9
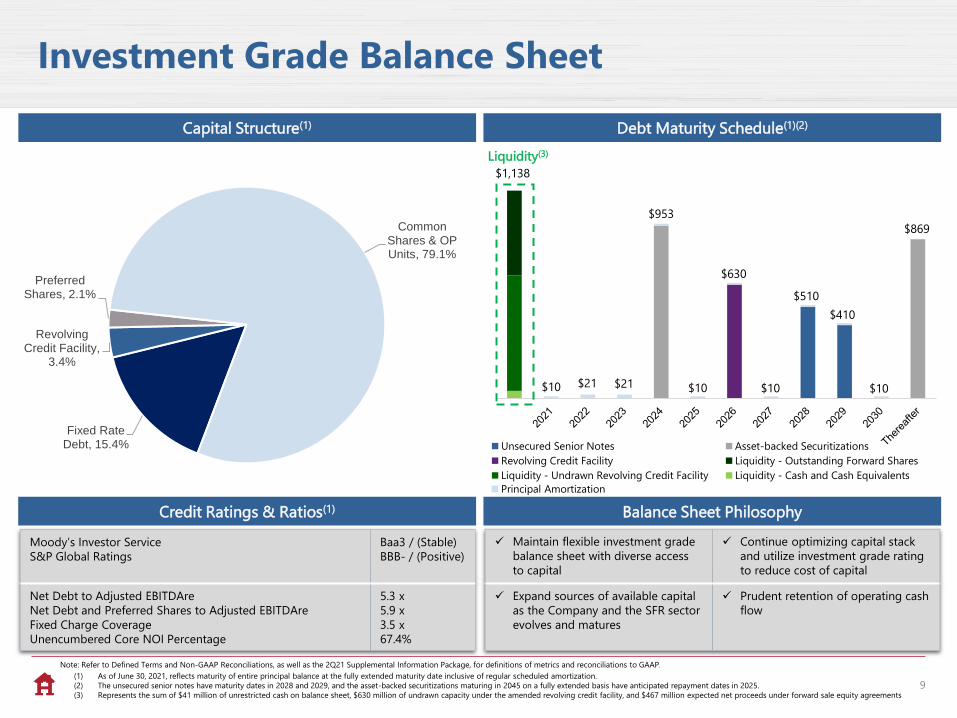
Investment Grade Balance Sheet
Capital Structure(1) Debt Maturity Schedule(1)(2)
Balance Sheet Philosophy
✓ Maintain flexible investment grade
balance sheet with diverse access
to capital
✓ Continue optimizing capital stack
and utilize investment grade rating
to reduce cost of capital
✓ Expand sources of available capital
as the Company and the SFR sector
evolves and matures
✓ Prudent retention of operating cash
flow
Credit Ratings & Ratios(1)
Moody’s Investor Service
S&P Global Ratings
Baa3 / (Stable)
BBB- / (Positive)
Net Debt to Adjusted EBITDAre
Net Debt and Preferred Shares to Adjusted EBITDAre
Fixed Charge Coverage
Unencumbered Core NOI Percentage
5.3 x
5.9 x
3.5 x
67.4%
(1) As of June 30, 2021, reflects maturity of entire principal balance at the fully extended maturity date inclusive of regular scheduled amortization.
(2) The unsecured senior notes have maturity dates in 2028 and 2029, and the asset-backed securitizations maturing in 2045 on a fully extended basis have anticipated repayment dates in 2025.
(3) Represents the sum of $41 million of unrestricted cash on balance sheet, $630 million of undrawn capacity under the amended revolving credit facility, and $467 million expected net proceeds under forward sale equity agreements
Note: Refer to Defined Terms and Non-GAAP Reconciliations, as well as the 2Q21 Supplemental Information Package, for definitions of metrics and reconciliations to GAAP.
Fixed Rate Debt, 15.4%
Revolving Credit Facility,
3.4%
Preferred Shares, 2.1%
Common Shares & OP Units, 79.1%
Liquidity(3)
$1,138
$10 $21 $21
$953
$630
$510
$410
$10 $10 $10
$869
Principal Amortization
10
AMH Today
The Market Opportunity
Differentiated Growth Strategy: AMH Development
Strong Governance Practices
11
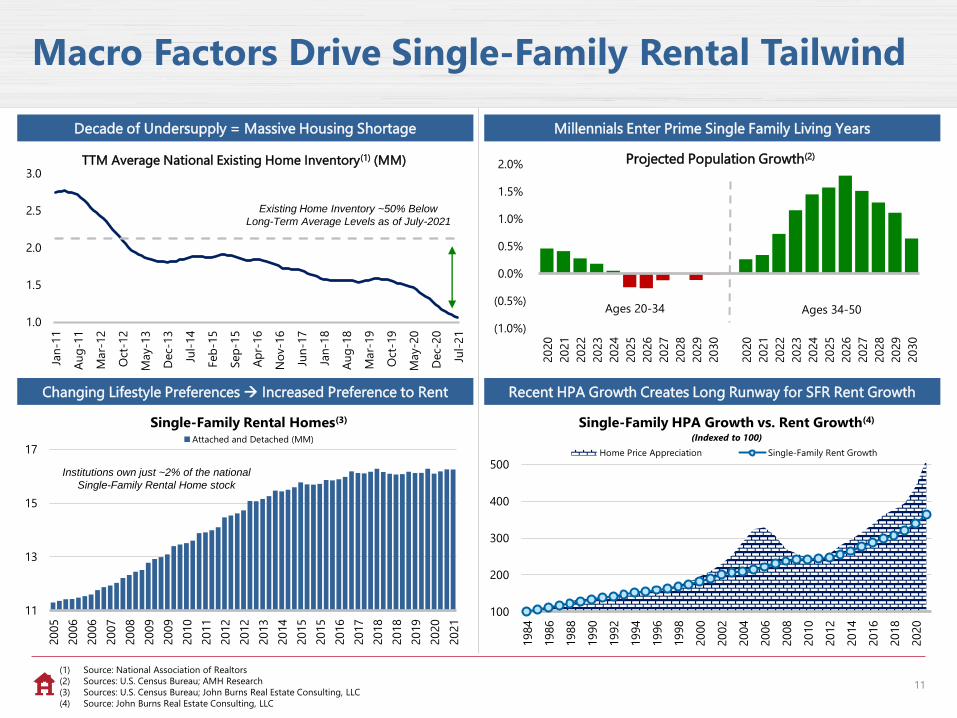
Millennials Enter Prime Single Family Living YearsDecade of Undersupply = Massive Housing Shortage
Changing Lifestyle Preferences → Increased Preference to Rent Recent HPA Growth Creates Long Runway for SFR Rent Growth
(1.0%)
(0.5%)
0.0%
0.5%
1.0%
1.5%
2.0%
2020
2021
2022
2023
2024
2025
2026
2027
2028
2029
2030
2020
2021
2022
2023
2024
2025
2026
2027
2028
2029
2030
Projected Population Growth(2)
Ages 34-50Ages 20-34
(1) Source: National Association of Realtors
(2) Sources: U.S. Census Bureau; AMH Research
(3) Sources: U.S. Census Bureau; John Burns Real Estate Consulting, LLC
(4) Source: John Burns Real Estate Consulting, LLC
1.0
1.5
2.0
2.5
3.0
Jan
-11
Au
g-1
1
Mar-
12
Oct
-12
May-1
3
Dec-
13
Jul-
14
Feb
-15
Sep
-15
Ap
r-16
No
v-1
6
Jun
-17
Jan
-18
Au
g-1
8
Mar-
19
Oct
-19
May-2
0
Dec-
20
Jul-
21
TTM Average National Existing Home Inventory(1) (MM)
Existing Home Inventory ~50% Below
Long-Term Average Levels as of July-2021
11
13
15
17
2005
2006
2006
2007
2008
2009
2009
2010
2011
2012
2012
2013
2014
2015
2015
2016
2017
2018
2018
2019
2020
2021
Single-Family Rental Homes(3)
Attached and Detached (MM)
Macro Factors Drive Single-Family Rental Tailwind
Institutions own just ~2% of the national
Single-Family Rental Home stock
100
200
300
400
500
1984
1986
1988
1990
1992
1994
1996
1998
2000
2002
2004
2006
2008
2010
2012
2014
2016
2018
2020
Single-Family HPA Growth vs. Rent Growth(4)
(Indexed to 100)
Home Price Appreciation Single-Family Rent Growth
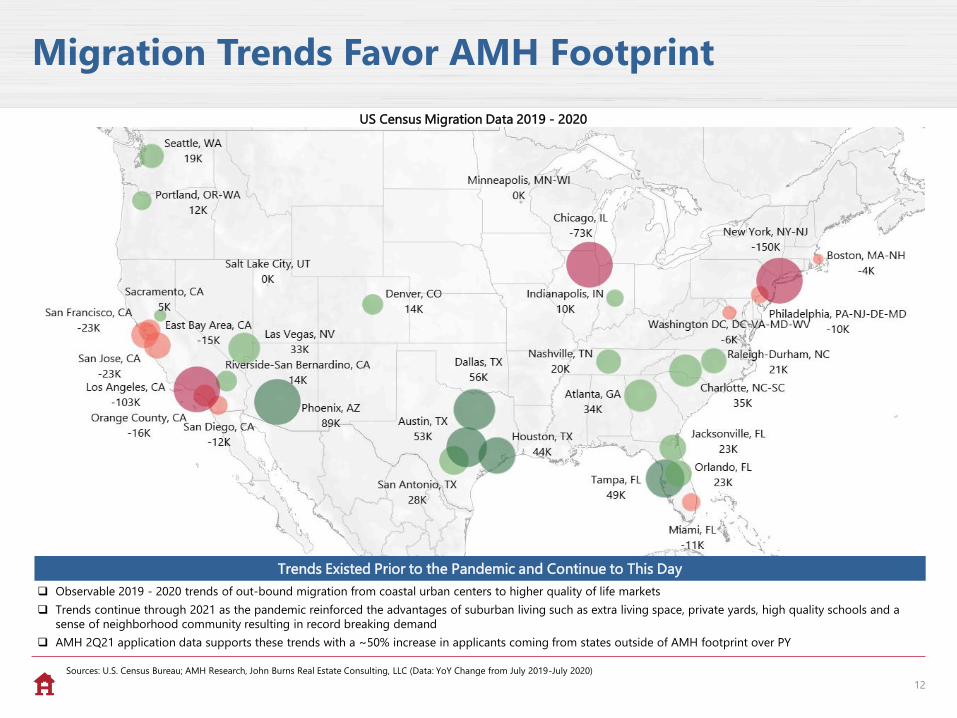
Migration Trends Favor AMH Footprint
12
Sources: U.S. Census Bureau; AMH Research, John Burns Real Estate Consulting, LLC (Data: YoY Change from July 2019-July 2020)
US Census Migration Data 2019 - 2020
Trends Existed Prior to the Pandemic and Continue to This Day
❑ Observable 2019 - 2020 trends of out-bound migration from coastal urban centers to higher quality of life markets
❑ Trends continue through 2021 as the pandemic reinforced the advantages of suburban living such as extra living space, private yards, high quality schools and a
sense of neighborhood community resulting in record breaking demand
❑ AMH 2Q21 application data supports these trends with a ~50% increase in applicants coming from states outside of AMH footprint over PY
13
AMH Today
The Market Opportunity
Differentiated Growth Strategy: AMH Development
Strong Governance Practices
14
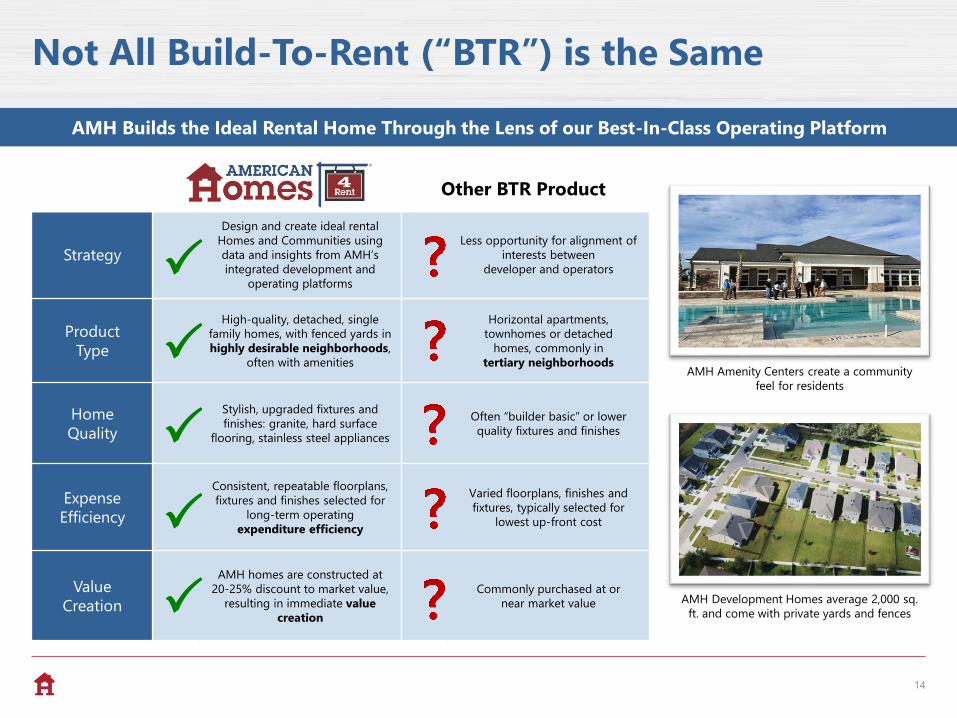
Strategy
Design and create ideal rental
Homes and Communities using
data and insights from AMH’s
integrated development and
operating platforms
Less opportunity for alignment of
interests between
developer and operators
Product
Type
High-quality, detached, single
family homes, with fenced yards in
highly desirable neighborhoods,
often with amenities
Horizontal apartments,
townhomes or detached
homes, commonly in
tertiary neighborhoods
Home
Quality
Stylish, upgraded fixtures and
finishes: granite, hard surface
flooring, stainless steel appliances
Often “builder basic” or lower
quality fixtures and finishes
Expense
Efficiency
Consistent, repeatable floorplans,
fixtures and finishes selected for
long-term operating
expenditure efficiency
Varied floorplans, finishes and
fixtures, typically selected for
lowest up-front cost
Value
Creation
AMH homes are constructed at
20-25% discount to market value,
resulting in immediate value
creation
Commonly purchased at or
near market value
AMH Builds the Ideal Rental Home Through the Lens of our Best-In-Class Operating Platform
Not All Build-To-Rent (“BTR”) is the Same
AMH Amenity Centers create a community
feel for residents
AMH Development Homes average 2,000 sq.
ft. and come with private yards and fences
Other BTR Product
15
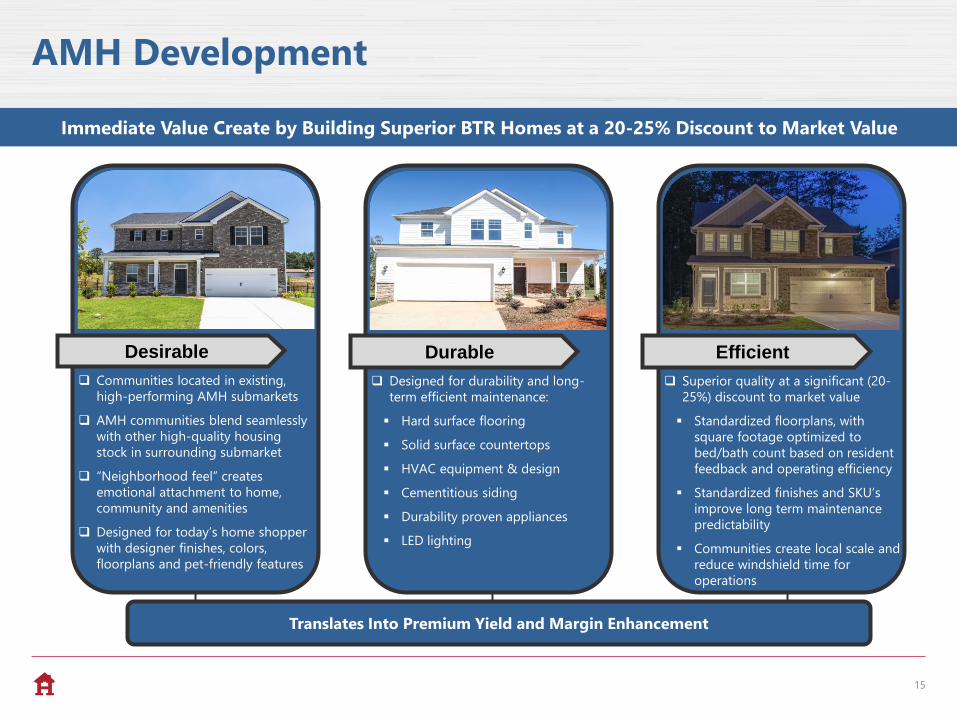
AMH Development
Desirable
❑ Communities located in existing,
high-performing AMH submarkets
❑ AMH communities blend seamlessly
with other high-quality housing
stock in surrounding submarket
❑ “Neighborhood feel” creates
emotional attachment to home,
community and amenities
❑ Designed for today’s home shopper
with designer finishes, colors,
floorplans and pet-friendly features
Immediate Value Create by Building Superior BTR Homes at a 20-25% Discount to Market Value
Translates Into Premium Yield and Margin Enhancement
Durable
❑ Designed for durability and long-
term efficient maintenance:
▪ Hard surface flooring
▪ Solid surface countertops
▪ HVAC equipment & design
▪ Cementitious siding
▪ Durability proven appliances
▪ LED lighting
Efficient
❑ Superior quality at a significant (20-
25%) discount to market value
▪ Standardized floorplans, with
square footage optimized to
bed/bath count based on resident
feedback and operating efficiency
▪ Standardized finishes and SKU’s
improve long term maintenance
predictability
▪ Communities create local scale and
reduce windshield time for
operations
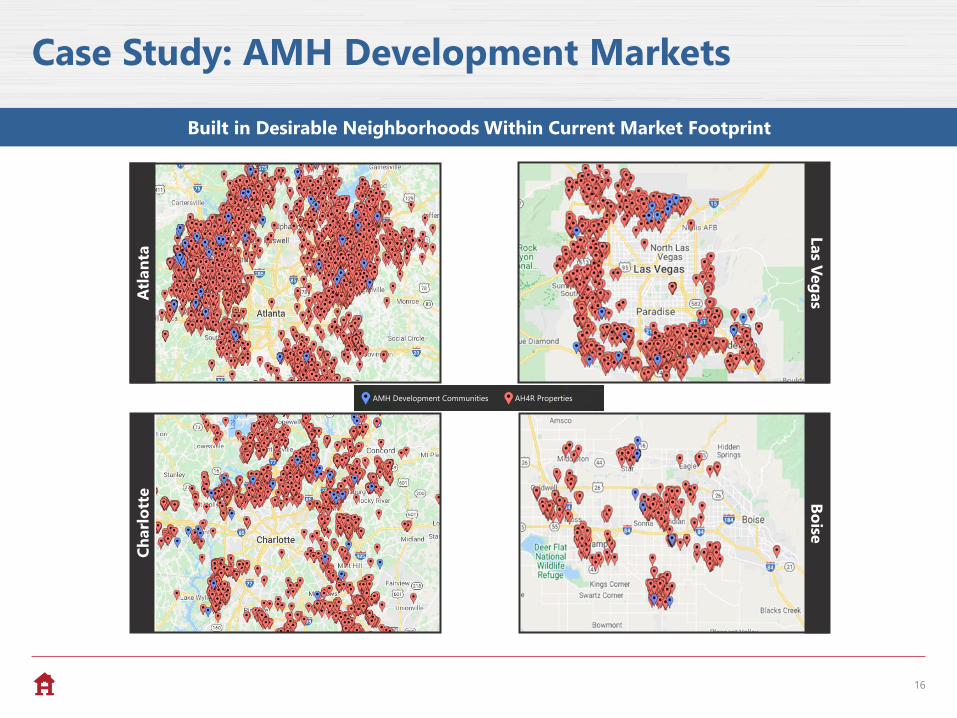
16
Built in Desirable Neighborhoods Within Current Market Footprint
Case Study: AMH Development Markets
Ch
arl
ott
eLas V
eg
as
Bo
iseA
tlan
ta
AMH Development Communities AH4R Properties
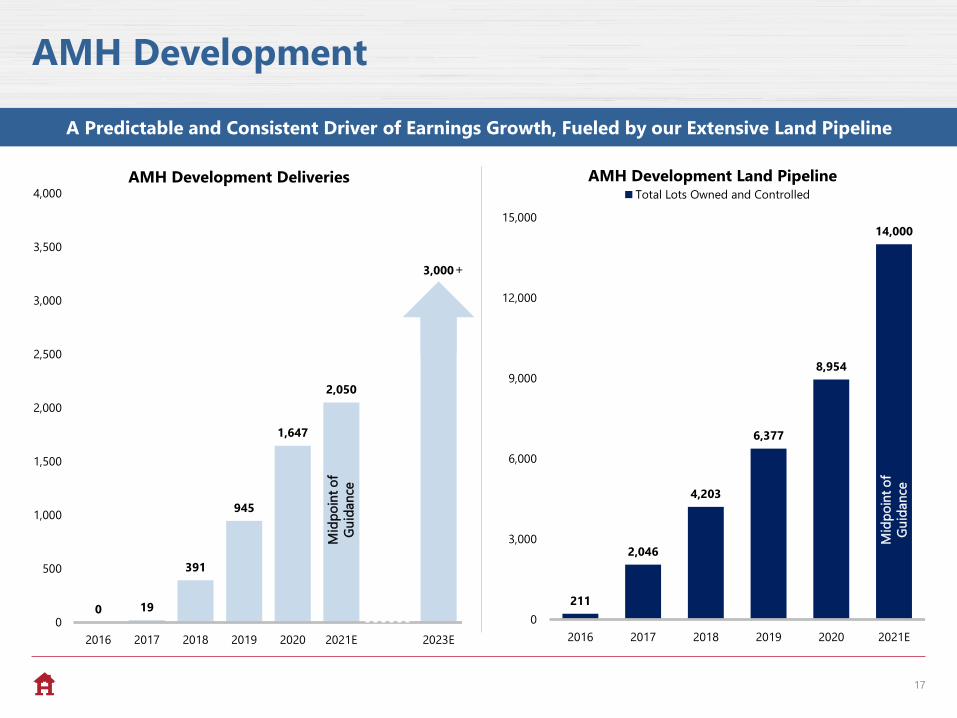
211
2,046
4,203
6,377
8,954
14,000
0
3,000
6,000
9,000
12,000
15,000
2016 2017 2018 2019 2020 2021E
AMH Development Land PipelineTotal Lots Owned and Controlled
0 19
391
945
1,647
2,050
3,000
0
500
1,000
1,500
2,000
2,500
3,000
3,500
4,000
2016 2017 2018 2019 2020 2021E 2023E
AMH Development Deliveries
17
AMH Development
+
Mid
po
int
of
Gu
idan
ce
A Predictable and Consistent Driver of Earnings Growth, Fueled by our Extensive Land Pipeline
Mid
po
int
of
Gu
idan
ce
18
AMH Today
The Market Opportunity
Differentiated Growth Strategy: AMH Development
Strong Governance Practices
19
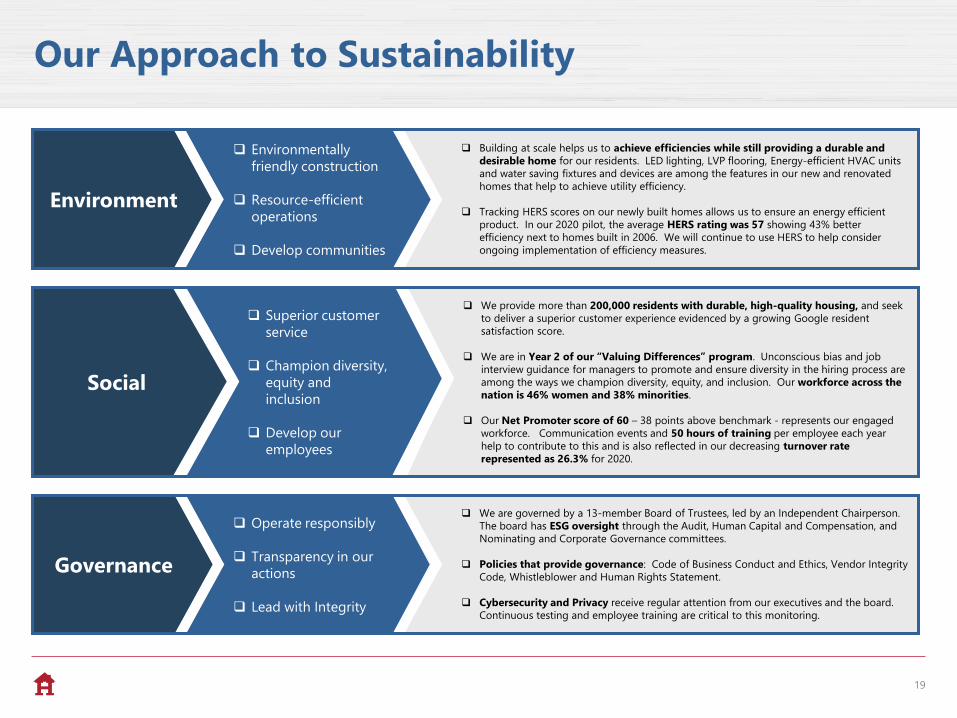
❑ Operate responsibly
❑ Transparency in our
actions
❑ Lead with Integrity
Governance
❑ We are governed by a 13-member Board of Trustees, led by an Independent Chairperson.
The board has ESG oversight through the Audit, Human Capital and Compensation, and
Nominating and Corporate Governance committees.
❑ Policies that provide governance: Code of Business Conduct and Ethics, Vendor Integrity
Code, Whistleblower and Human Rights Statement.
❑ Cybersecurity and Privacy receive regular attention from our executives and the board.
Continuous testing and employee training are critical to this monitoring.
❑ Superior customer
service
❑ Champion diversity,
equity and
inclusion
❑ Develop our
employees
Social
❑ We provide more than 200,000 residents with durable, high-quality housing, and seek
to deliver a superior customer experience evidenced by a growing Google resident
satisfaction score.
❑ We are in Year 2 of our “Valuing Differences” program. Unconscious bias and job
interview guidance for managers to promote and ensure diversity in the hiring process are
among the ways we champion diversity, equity, and inclusion. Our workforce across the
nation is 46% women and 38% minorities.
❑ Our Net Promoter score of 60 – 38 points above benchmark - represents our engaged
workforce. Communication events and 50 hours of training per employee each year
help to contribute to this and is also reflected in our decreasing turnover rate
represented as 26.3% for 2020.
❑ Environmentally
friendly construction
❑ Resource-efficient
operations
❑ Develop communities
Environment
❑ Building at scale helps us to achieve efficiencies while still providing a durable and
desirable home for our residents. LED lighting, LVP flooring, Energy-efficient HVAC units
and water saving fixtures and devices are among the features in our new and renovated
homes that help to achieve utility efficiency.
❑ Tracking HERS scores on our newly built homes allows us to ensure an energy efficient
product. In our 2020 pilot, the average HERS rating was 57 showing 43% better
efficiency next to homes built in 2006. We will continue to use HERS to help consider
ongoing implementation of efficiency measures.
Our Approach to Sustainability
20
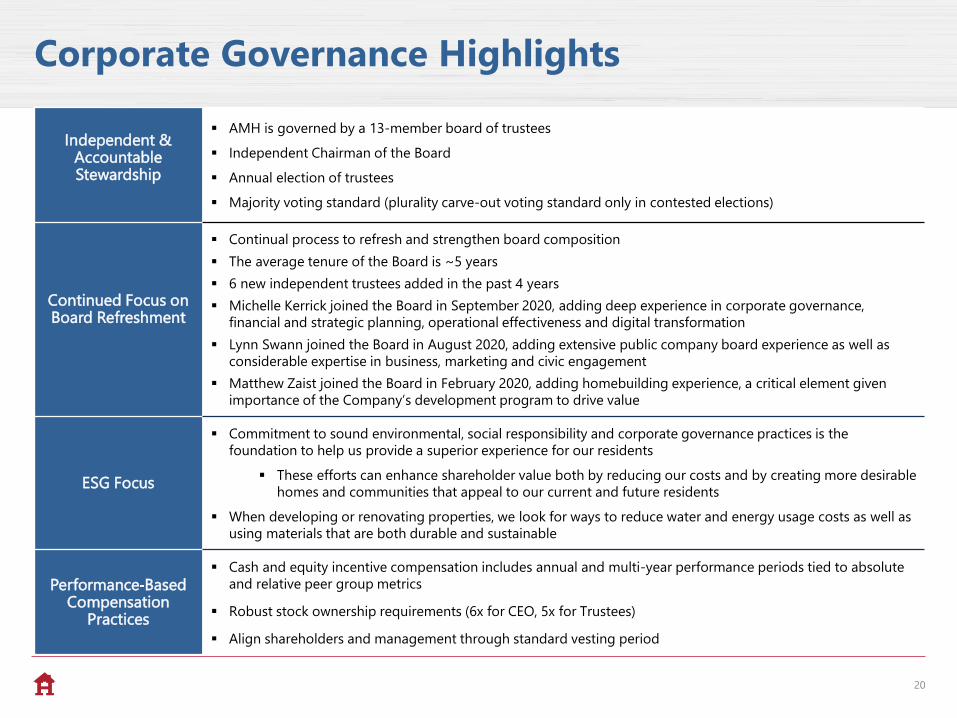
Corporate Governance Highlights
Independent & Accountable Stewardship
▪ AMH is governed by a 13‐member board of trustees
▪ Independent Chairman of the Board
▪ Annual election of trustees
▪ Majority voting standard (plurality carve‐out voting standard only in contested elections)
Continued Focus on Board Refreshment
▪ Continual process to refresh and strengthen board composition
▪ The average tenure of the Board is ~5 years
▪ 6 new independent trustees added in the past 4 years
▪ Michelle Kerrick joined the Board in September 2020, adding deep experience in corporate governance,
financial and strategic planning, operational effectiveness and digital transformation
▪ Lynn Swann joined the Board in August 2020, adding extensive public company board experience as well as
considerable expertise in business, marketing and civic engagement
▪ Matthew Zaist joined the Board in February 2020, adding homebuilding experience, a critical element given
importance of the Company’s development program to drive value
ESG Focus
▪ Commitment to sound environmental, social responsibility and corporate governance practices is the
foundation to help us provide a superior experience for our residents
▪ These efforts can enhance shareholder value both by reducing our costs and by creating more desirable
homes and communities that appeal to our current and future residents
▪ When developing or renovating properties, we look for ways to reduce water and energy usage costs as well as
using materials that are both durable and sustainable
Performance-BasedCompensation
Practices
▪ Cash and equity incentive compensation includes annual and multi-year performance periods tied to absolute
and relative peer group metrics
▪ Robust stock ownership requirements (6x for CEO, 5x for Trustees)
▪ Align shareholders and management through standard vesting period

Appendix
21
22
Defined Terms and Non-GAAP Reconciliations
2021 Guidance
The Company does not provide guidance for the most comparable GAAP financial measures of net income or loss, rents and other single-family
property revenues and property operating expenses, or a reconciliation of the forward-looking non-GAAP financial measures to the comparable GAAP
financial measures because we are unable to reasonably predict certain items contained in the GAAP measures, including non-recurring and infrequent
items that are not indicative of the Company’s ongoing operations. Such items include, but are not limited to, net gain or loss on sales and impairment
of single-family properties, casualty loss, Non-Same-Home revenues and Non-Same-Home property operating expenses. These items are uncertain,
depend on various factors and could have a material impact on our GAAP results for the guidance period.
Average Blended Change in Rent
The percentage change in rent on all non-month-to-month lease renewals and re-leases during the period, compared to the annual rent of the
previous expired non-month-to-month comparable long-term lease for each individual property.
Average Change in Rent for Re-Leases
The percentage change in annual rent on properties re-leased during the period, compared to the annual rent of the comparable long-term previous
expired lease for each individual property.
Average Change in Rent for Renewals
The percentage change in rent on non-month-to-month comparable long-term lease renewals during the period.
Average Occupied Days Percentage
The number of days a property is occupied in the period divided by the total number of days the property is owned during the same period after
initially being placed in-service. This calculation excludes properties classified as held for sale.
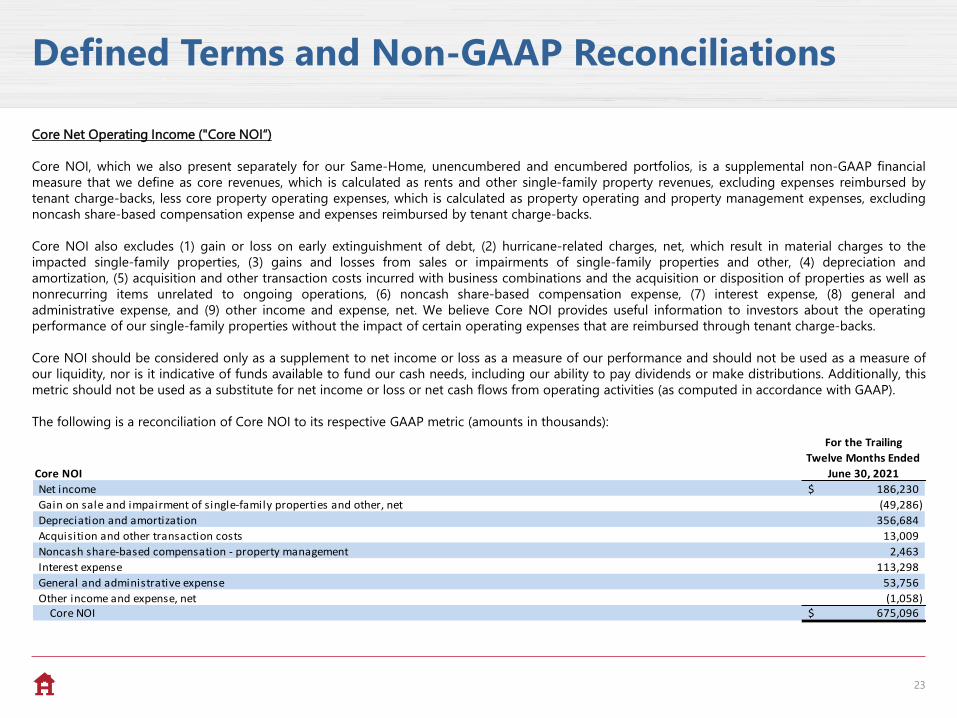
Core Net Operating Income ("Core NOI“)
Core NOI, which we also present separately for our Same-Home, unencumbered and encumbered portfolios, is a supplemental non-GAAP financial
measure that we define as core revenues, which is calculated as rents and other single-family property revenues, excluding expenses reimbursed by
tenant charge-backs, less core property operating expenses, which is calculated as property operating and property management expenses, excluding
noncash share-based compensation expense and expenses reimbursed by tenant charge-backs.
Core NOI also excludes (1) gain or loss on early extinguishment of debt, (2) hurricane-related charges, net, which result in material charges to the
impacted single-family properties, (3) gains and losses from sales or impairments of single-family properties and other, (4) depreciation and
amortization, (5) acquisition and other transaction costs incurred with business combinations and the acquisition or disposition of properties as well as
nonrecurring items unrelated to ongoing operations, (6) noncash share-based compensation expense, (7) interest expense, (8) general and
administrative expense, and (9) other income and expense, net. We believe Core NOI provides useful information to investors about the operating
performance of our single-family properties without the impact of certain operating expenses that are reimbursed through tenant charge-backs.
Core NOI should be considered only as a supplement to net income or loss as a measure of our performance and should not be used as a measure of
our liquidity, nor is it indicative of funds available to fund our cash needs, including our ability to pay dividends or make distributions. Additionally, this
metric should not be used as a substitute for net income or loss or net cash flows from operating activities (as computed in accordance with GAAP).
The following is a reconciliation of Core NOI to its respective GAAP metric (amounts in thousands):
23
Core NOI
For the Trailing
Twelve Months Ended
June 30, 2021
Net income 186,230$
Gain on sale and impairment of single-family properties and other, net (49,286)
Depreciation and amortization 356,684
Acquisition and other transaction costs 13,009
Noncash share-based compensation - property management 2,463
Interest expense 113,298
General and administrative expense 53,756
Other income and expense, net (1,058) Core NOI 675,096$
Defined Terms and Non-GAAP Reconciliations
24
Defined Terms and Non-GAAP Reconciliations
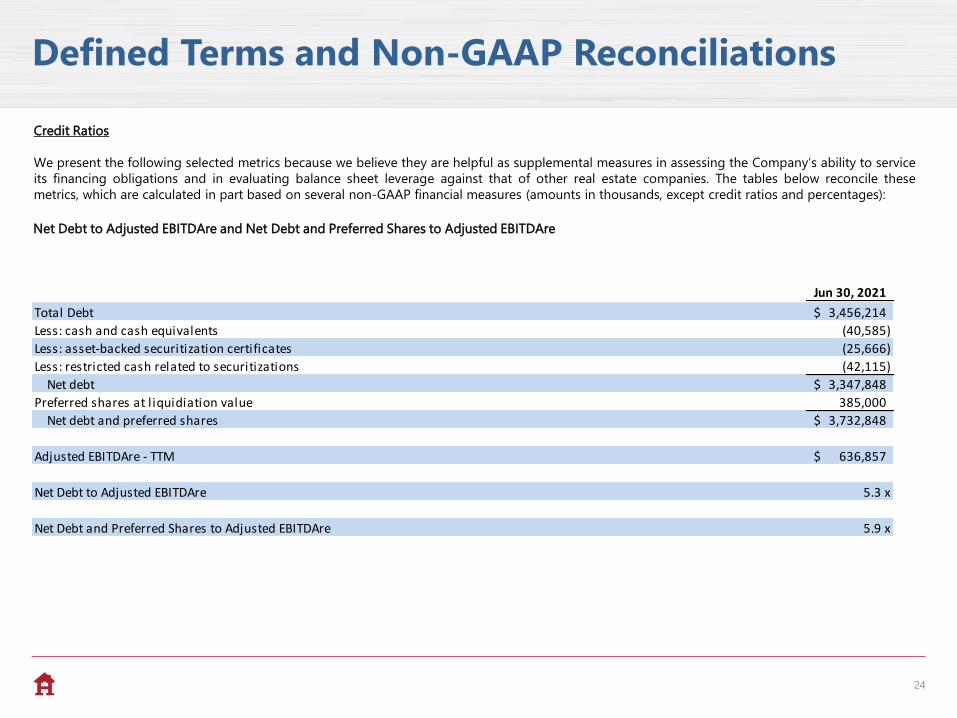
Credit Ratios
We present the following selected metrics because we believe they are helpful as supplemental measures in assessing the Company’s ability to service
its financing obligations and in evaluating balance sheet leverage against that of other real estate companies. The tables below reconcile these
metrics, which are calculated in part based on several non-GAAP financial measures (amounts in thousands, except credit ratios and percentages):
Net Debt to Adjusted EBITDAre and Net Debt and Preferred Shares to Adjusted EBITDAre
Jun 30, 2021
Total Debt 3,456,214$
Less: cash and cash equivalents (40,585)
Less: asset-backed securitization certificates (25,666)
Less: restricted cash related to securitizations (42,115)
Net debt 3,347,848$
Preferred shares at l iquidiation value 385,000
Net debt and preferred shares 3,732,848$
Adjusted EBITDAre - TTM 636,857$
Net Debt to Adjusted EBITDAre 5.3 x
Net Debt and Preferred Shares to Adjusted EBITDAre 5.9 x
25
Defined Terms and Non-GAAP Reconciliations
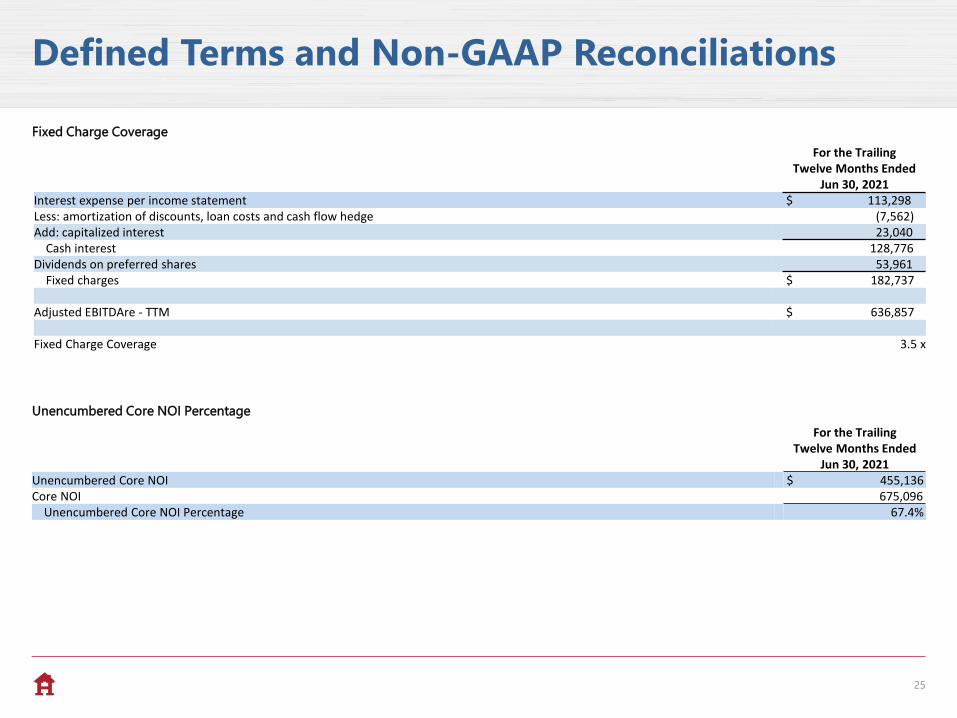
Unencumbered Core NOI Percentage
For the Trailing Twelve Months Ended
Jun 30, 2021Unencumbered Core NOI $ 455,136Core NOI 675,096
Unencumbered Core NOI Percentage 67.4%
Fixed Charge Coverage
For the Trailing Twelve Months Ended
Jun 30, 2021Interest expense per income statement $ 113,298Less: amortization of discounts, loan costs and cash flow hedge (7,562)Add: capitalized interest 23,040
Cash interest 128,776 Dividends on preferred shares 53,961
Fixed charges $ 182,737
Adjusted EBITDAre - TTM $ 636,857
Fixed Charge Coverage 3.5 x
26
Defined Terms and Non-GAAP Reconciliations
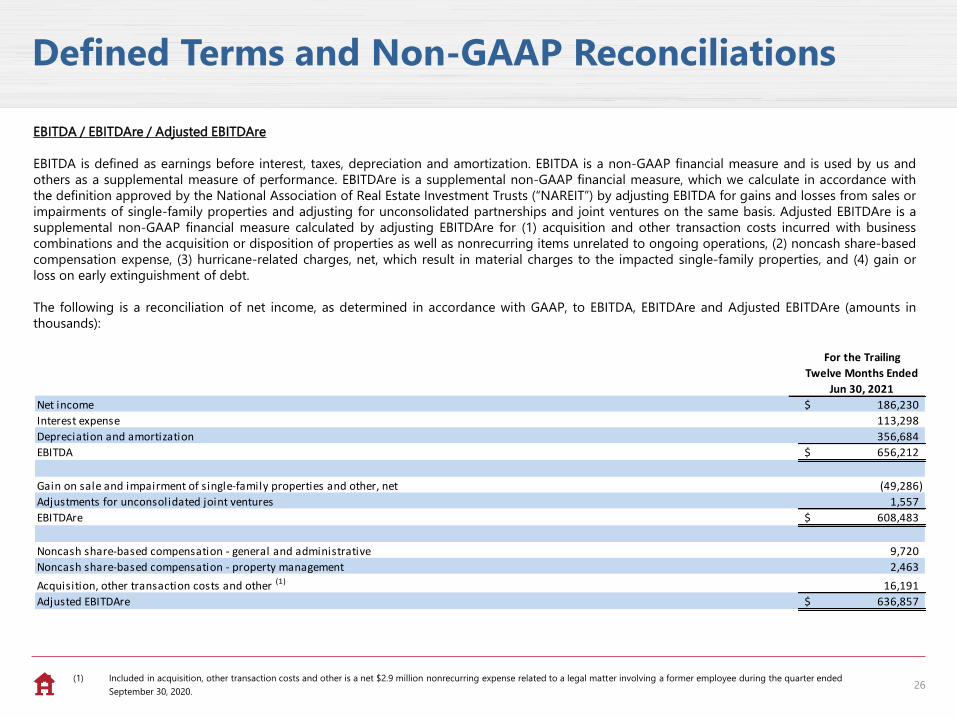
EBITDA / EBITDAre / Adjusted EBITDAre
EBITDA is defined as earnings before interest, taxes, depreciation and amortization. EBITDA is a non-GAAP financial measure and is used by us and
others as a supplemental measure of performance. EBITDAre is a supplemental non-GAAP financial measure, which we calculate in accordance with
the definition approved by the National Association of Real Estate Investment Trusts (“NAREIT”) by adjusting EBITDA for gains and losses from sales or
impairments of single-family properties and adjusting for unconsolidated partnerships and joint ventures on the same basis. Adjusted EBITDAre is a
supplemental non-GAAP financial measure calculated by adjusting EBITDAre for (1) acquisition and other transaction costs incurred with business
combinations and the acquisition or disposition of properties as well as nonrecurring items unrelated to ongoing operations, (2) noncash share-based
compensation expense, (3) hurricane-related charges, net, which result in material charges to the impacted single-family properties, and (4) gain or
loss on early extinguishment of debt.
The following is a reconciliation of net income, as determined in accordance with GAAP, to EBITDA, EBITDAre and Adjusted EBITDAre (amounts in
thousands):
For the Trailing
Twelve Months Ended
Jun 30, 2021
Net income 186,230$
Interest expense 113,298
Depreciation and amortization 356,684
EBITDA 656,212$
Gain on sale and impairment of single-family properties and other, net (49,286)
Adjustments for unconsolidated joint ventures 1,557
EBITDAre 608,483$
Noncash share-based compensation - general and administrative 9,720
Noncash share-based compensation - property management 2,463
Acquisition, other transaction costs and other (1) 16,191
Adjusted EBITDAre 636,857$
(1) Included in acquisition, other transaction costs and other is a net $2.9 million nonrecurring expense related to a legal matter involving a former employee during the quarter ended
September 30, 2020.
27
Defined Terms and Non-GAAP Reconciliations
Funds from Operations (“FFO”) / Core FFO attributable to common share and unit holders
FFO attributable to common share and unit holders is a non-GAAP financial measure that we calculate in accordance with the definition approved by
NAREIT, which defines FFO as net income or loss calculated in accordance with GAAP, excluding gains and losses from sales or impairment of real estate,
plus real estate-related depreciation and amortization (excluding amortization of deferred financing costs and depreciation of non-real estate assets),
and after adjustments for unconsolidated partnerships and joint ventures to reflect FFO on the same basis.
Core FFO attributable to common share and unit holders is a non-GAAP financial measure that we use as a supplemental measure of our performance.
We compute this metric by adjusting FFO attributable to common share and unit holders for (1) acquisition and other transaction costs incurred with
business combinations and the acquisition or disposition of properties as well as nonrecurring items unrelated to ongoing operations, (2) noncash
share-based compensation expense, (3) hurricane-related charges, net, which result in material charges to the impacted single-family properties, (4) gain
or loss on early extinguishment of debt and (5) the allocation of income to our perpetual preferred shares in connection with their redemption.
We present FFO attributable to common share and unit holders, as well as on a per FFO share and unit basis, because we consider this metric to be an
important measure of the performance of real estate companies, as do many investors and analysts in evaluating the Company. We believe that FFO
attributable to common share and unit holders provides useful information to investors because this metric excludes depreciation, which is included in
computing net income and assumes the value of real estate diminishes predictably over time. We believe that real estate values fluctuate due to market
conditions and in response to inflation. We also believe that Core FFO attributable to common share and unit holders, as well as on a per FFO share and
unit basis, provides useful information to investors because it allows investors to compare our operating performance to prior reporting periods without
the effect of certain items that, by nature, are not comparable from period to period.
FFO and Core FFO attributable to common share and unit holders are not a substitute for net income or net cash provided by operating activities, each
as determined in accordance with GAAP, as a measure of our operating performance, liquidity or ability to pay dividends. These metrics also are not
necessarily indicative of cash available to fund future cash needs. Because other REITs may not compute these measures in the same manner, they may
not be comparable among REITs.
28
Defined Terms and Non-GAAP Reconciliations
Same-Home Property
A property is classified as Same-Home if it has been stabilized longer than 90 days prior to the beginning of the earliest period presented under
comparison. A property is removed from Same-Home if it has been classified as held for sale or has been taken out of service as a result of a casualty
loss.
Stabilized Property
A property acquired individually (i.e., not through a bulk purchase) is classified as stabilized once it has been renovated by the Company or newly
constructed and then initially leased or available for rent for a period greater than 90 days. Properties acquired through a bulk purchase are first
considered non-stabilized, as an entire group, until (1) we have owned them for an adequate period of time to allow for complete on-boarding to our
operating platform, and (2) a substantial portion of the properties have experienced tenant turnover at least once under our ownership, providing the
opportunity for renovations and improvements to meet our property standards. After such time has passed, properties acquired through a bulk
purchase are then evaluated on an individual property basis under our standard stabilization criteria.
Total Debt
Includes principal balances on asset-backed securitizations, unsecured senior notes and borrowings outstanding under our revolving credit facility as
of period end, and excludes unamortized discounts and unamortized deferred financing costs.


![Investor Presentation - December 2015 [Company Update]](https://img.pdfslide.us/doc/110x75/577ca6e21a28abea748c142b/investor-presentation-december-2015-company-update.jpg)
![Investor Presentation - February 2016 [Company Update]](https://img.pdfslide.us/doc/110x75/577c879f1a28abe054c4c05b/investor-presentation-february-2016-company-update.jpg)


![Analyst/ Institutional Investor Presentation [Company Update]](https://img.pdfslide.us/doc/110x75/577c7ba71a28abe0549824fd/analyst-institutional-investor-presentation-company-update.jpg)

![Investor Presentation - Update on NCE and NDDS programs [Company Update]](https://img.pdfslide.us/doc/110x75/577cb4b61a28aba7118ca04e/investor-presentation-update-on-nce-and-ndds-programs-company-update.jpg)
![Investor Presentation - January 2016 [Company Update]](https://img.pdfslide.us/doc/110x75/577ca5ff1a28abea748bb872/investor-presentation-january-2016-company-update-578a28a425aa8.jpg)
![Updated Investor Presentation [Company Update]](https://img.pdfslide.us/doc/110x75/577c830b1a28abe054b355cf/updated-investor-presentation-company-update.jpg)
![Investor Presentation & Results Press Release [Company Update]](https://img.pdfslide.us/doc/110x75/577ca7ad1a28abea748c82ed/investor-presentation-results-press-release-company-update.jpg)

![Revised Investor Meet Presentation [Company Update]](https://img.pdfslide.us/doc/110x75/577c876c1a28abe054c45af9/revised-investor-meet-presentation-company-update.jpg)


![Investor Presentation - March 2015 [Company Update]](https://img.pdfslide.us/doc/110x75/577cb4871a28aba7118c7f75/investor-presentation-march-2015-company-update.jpg)
![Investor Conference - Presentation [Company Update]](https://img.pdfslide.us/doc/110x75/577c982e1a28ab163a8b47da/investor-conference-presentation-company-update.jpg)
![Investor Presentation November 2015 [Company Update]](https://img.pdfslide.us/doc/110x75/577ca78f1a28abea748c745e/investor-presentation-november-2015-company-update.jpg)


![Investor Update/ Presentation [Company Update]](https://img.pdfslide.us/doc/110x75/577ca57b1a28abea748b8d65/investor-update-presentation-company-update.jpg)


![Investor Presentation - October 2015 [Company Update]](https://img.pdfslide.us/doc/110x75/577cb10b1a28aba7118b79f0/investor-presentation-october-2015-company-update.jpg)
![Revised Investor Presentation [Company Update]](https://img.pdfslide.us/doc/110x75/577cb4161a28aba7118c4bab/revised-investor-presentation-company-update.jpg)
![Investor presentation for Q2-2016 [Company Update]](https://img.pdfslide.us/doc/110x75/577ca7cd1a28abea748c90d1/investor-presentation-for-q2-2016-company-update.jpg)
![Investor/Analyst Presentation [Company Update]](https://img.pdfslide.us/doc/110x75/577ca56c1a28abea748b87af/investoranalyst-presentation-company-update.jpg)
![Investor Presentation - Revised [Company Update]](https://img.pdfslide.us/doc/110x75/577c84cd1a28abe054ba6996/investor-presentation-revised-company-update.jpg)