Embed Size (px)
Citation preview
Investor Presentation
May 2017
Safe Harbor
2
This Presentation (references to which and to any information contained herein shall be deemed to include information which has been or may be supplied in writing or orally in connection herewith or in connection with any further enquiries) is provided for the sole purpose of providing general information to assist the recipient in deciding whether it wishes to proceed with a further investigation for investing in Israel Chemicals Ltd. and/or its affiliates (hereinafter jointly referred to as the “Company” or “ICL”). This Presentation shall not form the basis of, or be relied upon in connection with, any contract or commitment whatsoever, and it does not purport to be comprehensive or to contain all the information that the recipient may need in order to evaluate the Company and/or its assets.
No representation, warranty or undertaking, express or implied, is given by ICL and/or any member of the ICL Group or their respective directors, officers, employees, agents, representatives and/or advisers as to or in relation to the accuracy, completeness or sufficiency of the information contained in this Presentation or as to the reasonableness of any assumption contained therein. To the maximum extent permitted by law the Company and its respective directors, officers, employees, agents, representatives and/or advisers expressly disclaim any and all liability which may arise from this Presentation and any errors contained therein and/or omissions therefrom or from any use of this Presentation or its contents or otherwise in connection therewith.
No representation or warranty is given as to the achievement or reasonableness of, and no reliance should be placed on, any valuations, forecasts, estimates, opinions and projections contained in this Presentation. In all cases, recipients should conduct their own investigation on any analysis of the Company and/or its assets and the information contained in this Presentation. Nothing in this Presentation constitutes an investment advice and any opinions or recommendations that may be contained herein have not been based upon a consideration of financial situation or particular needs of any specific recipient. Any prospective investor interested in buying Company’s securities or evaluating the Company and/or its assets is recommended to seek its own financial and other professional advice.
This Presentation and/or other oral or written statements made by ICL during its presentation or from time to time, may contain forward-looking statements within the meaning of the United States Private Securities Litigation Reform Act of 1995 and other applicable securities laws. Whenever words such as "believe," "expect," "anticipate," "intend," "plan," "estimate", “predict” or similar expressions are used, the Company is making forward-looking statements. Such forward-looking statements may include, but are not limited to, those that discuss strategies, goals, financial outlooks, corporate initiatives, existing or new products, existing or new markets, operating efficiencies, or other non-historical matters.
These forward-looking statements and projections are not guarantees of future performance and are subject to a number of assumptions, risks, projections and uncertainties, many of which are beyond the Company’s control, which could cause actual results, performance or achievements to differ materially from those described in or implied by such statements or projections. Because such statements deal with future events and are based on ICL’s current expectations, they could be impacted or be subject to various risks and uncertainties, including those discussed in the "Risk Factors" section and elsewhere in our Annual Report on Form 20-F for the year ended December 31, 2015, and in subsequent filings with the Tel Aviv Securities Exchange (TASE) and/or the U.S. Securities and Exchange Commission (SEC). Although the Company believes that the expectations reflected in such forward-looking statements are based on reasonable assumptions, it can provide no assurance that expectations will be achieved. Except as otherwise required by law, ICL disclaims any intention or obligation to update or revise any forward-looking statements, which speak only as of the date hereof, whether as a result of new information, future events or circumstances or otherwise. Readers, listeners and viewers are cautioned to consider these risks and uncertainties and to not place undue reliance on such information.
Certain market and/or industry data used in this Presentation were obtained from internal estimates and studies, where appropriate, as well as from market research and publicly available information. Such information may include data obtained from sources believed to be reliable, however ICL disclaims the accuracy and completeness of such information which is not guaranteed. Internal estimates and studies, which we believe to be reliable, have not been independently verified. We cannot assure that such data is accurate or complete.
Included in this presentation are certain non-GAAP financial measures, such as Adjusted Operating income and Adjusted Net income, designed to complement the financial information presented in accordance with IFRS because management believes such measures are useful to investors. These non-GAAP financial measures should be considered only as supplemental to, and not superior to, financial measures provided in accordance with GAAP. Please refer to our Annual Report on Form 20-F for the year ended December 31, 2016 filed with TASE and the SEC for a reconciliation of the non-GAAP financial measures included in this presentation to the most directly comparable financial measures prepared in accordance with GAAP.
3
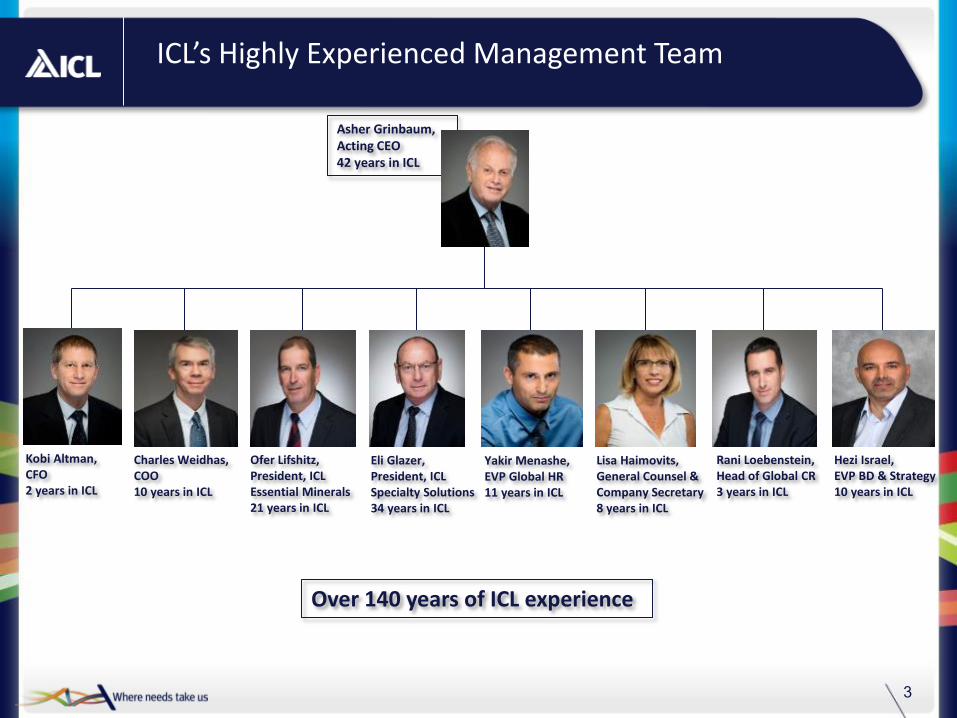
ICL’s Highly Experienced Management Team
Asher Grinbaum, Acting CEO 42 years in ICL
Kobi Altman, CFO 2 years in ICL
Charles Weidhas, COO 10 years in ICL
Ofer Lifshitz, President, ICL Essential Minerals 21 years in ICL
Yakir Menashe, EVP Global HR 11 years in ICL
Lisa Haimovits, General Counsel & Company Secretary 8 years in ICL
Rani Loebenstein, Head of Global CR 3 years in ICL
Hezi Israel, EVP BD & Strategy 10 years in ICL
Eli Glazer, President, ICL Specialty Solutions 34 years in ICL
Over 140 years of ICL experience
Our Vision: Fulfilling Humanity’s Essential Needs
4
Rise of the middle class and standard of living across the globe
Increased demand for and use of natural resources
Environmental stewardship and sustainability
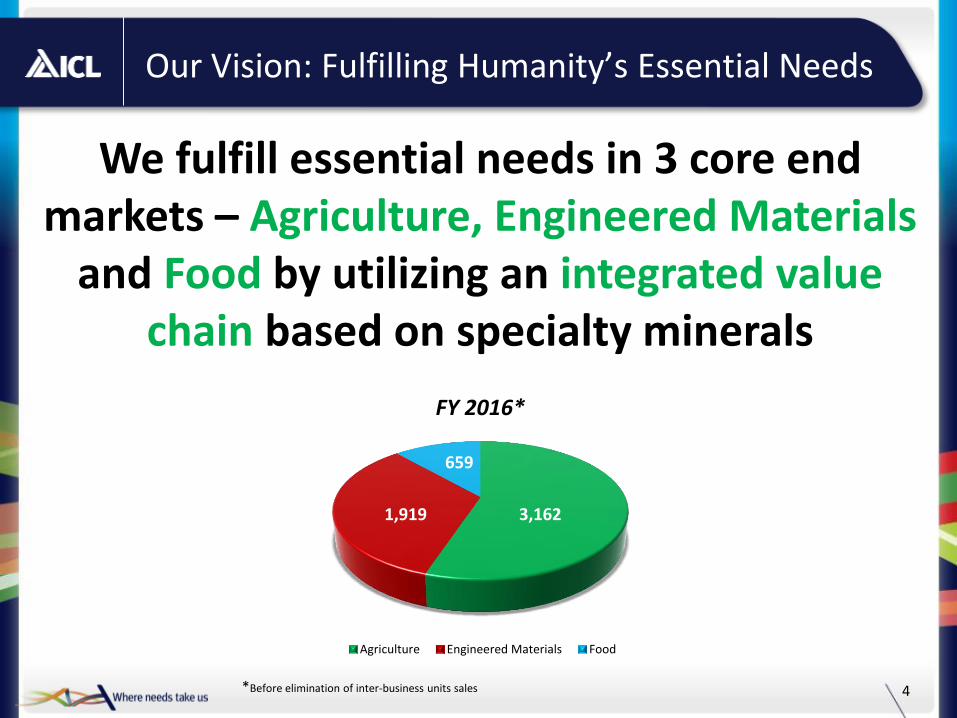
We fulfill essential needs in 3 core end markets – Agriculture, Engineered Materials
and Food by utilizing an integrated value chain based on specialty minerals
*Before elimination of inter-business units sales
3,162 1,919
659
FY 2016*
Agriculture Engineered Materials Food
5 5
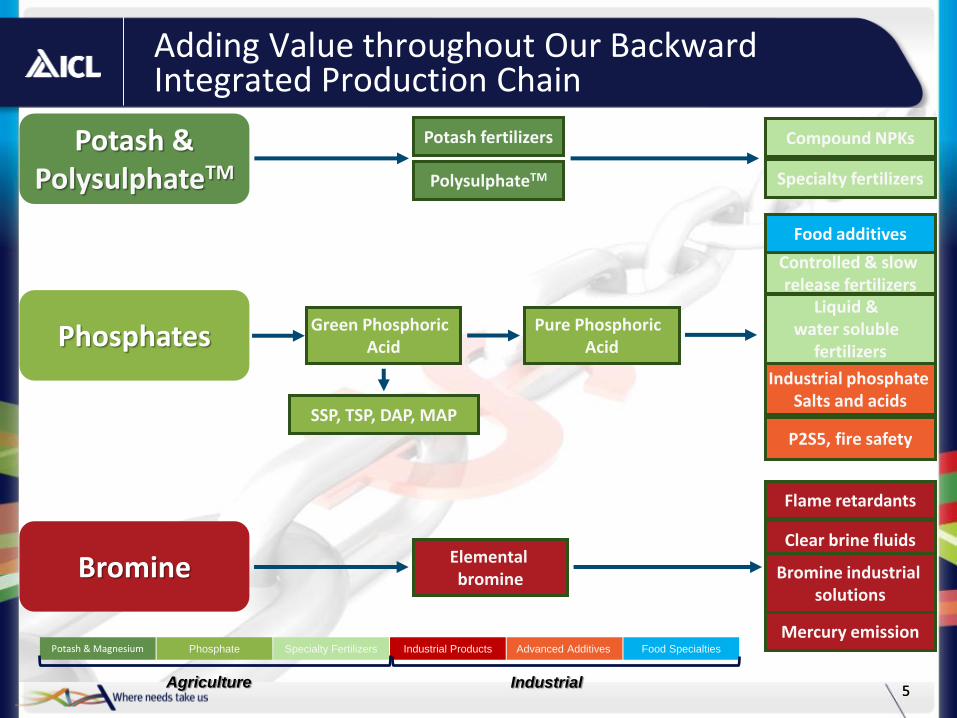
Adding Value throughout Our Backward Integrated Production Chain
Potash & PolysulphateTM
Phosphates
Bromine
Potash fertilizers
PolysulphateTM Specialty fertilizers
Compound NPKs
Green Phosphoric Acid
SSP, TSP, DAP, MAP
Pure Phosphoric Acid
Food additives
Controlled & slow release fertilizers
Clear brine fluids Elemental bromine
Mercury emission
Flame retardants
Liquid & water soluble
fertilizers
Industrial phosphate Salts and acids
P2S5, fire safety
Bromine industrial solutions
Potash & Magnesium Advanced Additives Phosphate Food Specialties Specialty Fertilizers Industrial Products
Agriculture Industrial
6
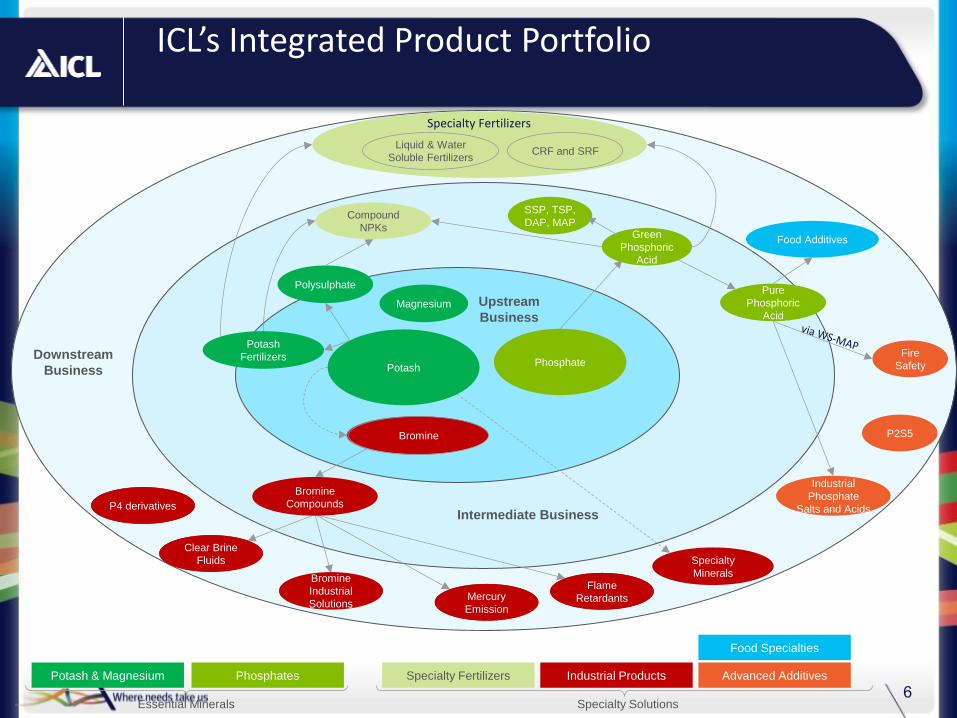
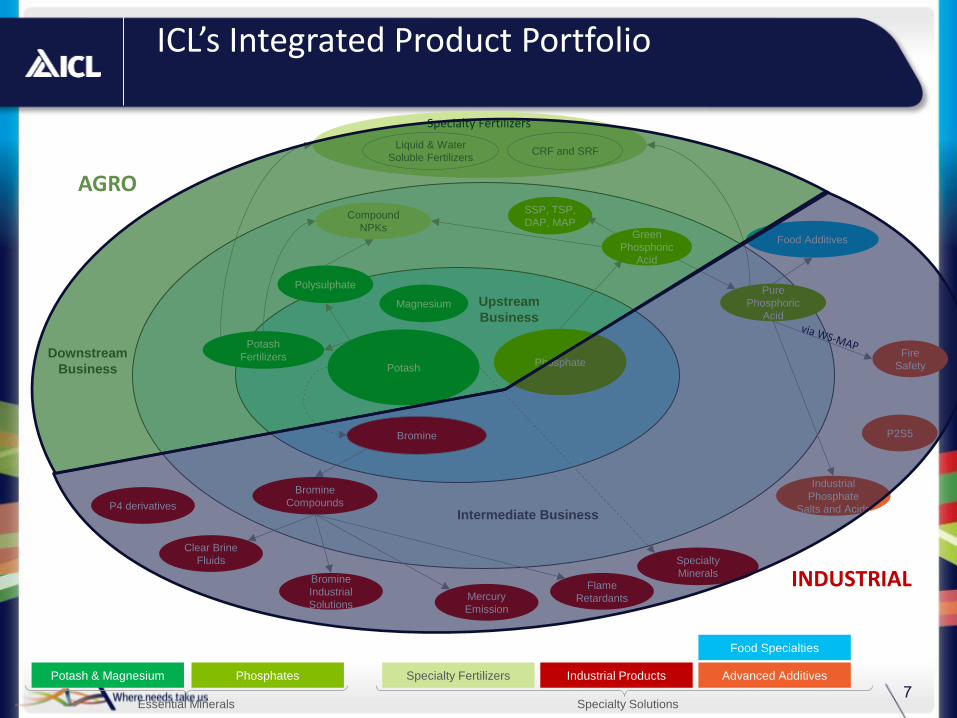
ICL’s Integrated Product Portfolio
Food Specialties
Advanced Additives Industrial Products Specialty Fertilizers Phosphates Potash & Magnesium
Mercury
Emission
Bromine
Industrial
Solutions
Clear Brine
Fluids
Flame
Retardants
Fire
Safety
Industrial
Phosphate
Salts and Acids
Liquid & Water
Soluble Fertilizers CRF and SRF
Food Additives
Compound
NPKs
Bromine
Compounds
Pure
Phosphoric
Acid
SSP, TSP,
DAP, MAP Green
Phosphoric
Acid
Polysulphate
Potash
Fertilizers
Bromine
Phosphate Potash
Essential Minerals Specialty Solutions
Magnesium
P2S5
Upstream
Business
Intermediate Business
Downstream
Business
21 Selected Strategic Considerations
Specialty Fertilizers
Specialty
Minerals
P4 derivatives
Mercury
Emission
Bromine
Industrial
Solutions
Clear Brine
Fluids
Flame
Retardants
Bromine
Compounds
Bromine
P4 derivatives
7
ICL’s Integrated Product Portfolio
Food Specialties
Advanced Additives Industrial Products Specialty Fertilizers Phosphates Potash & Magnesium
Mercury
Emission
Bromine
Industrial
Solutions
Clear Brine
Fluids
Flame
Retardants
Fire
Safety
Industrial
Phosphate
Salts and Acids
Liquid & Water
Soluble Fertilizers CRF and SRF
Food Additives
Compound
NPKs
Bromine
Compounds
Pure
Phosphoric
Acid
SSP, TSP,
DAP, MAP Green
Phosphoric
Acid
Polysulphate
Potash
Fertilizers
Bromine
Phosphate Potash
Essential Minerals Specialty Solutions
Magnesium
P2S5
Upstream
Business
Intermediate Business
Downstream
Business
21 Selected Strategic Considerations
Specialty Fertilizers
Specialty
Minerals
P4 derivatives
INDUSTRIAL
AGRO
8
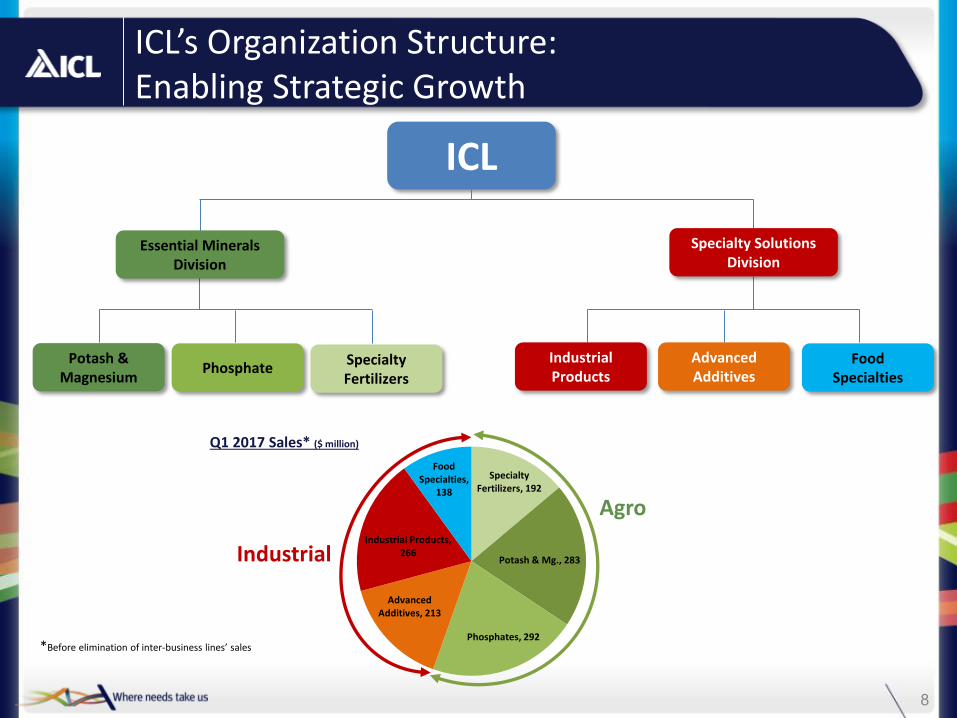
Q1 2017 Sales* ($ million)
*Before elimination of inter-business lines’ sales
ICL’s Organization Structure: Enabling Strategic Growth
ICL
Essential Minerals Division
Specialty Solutions Division
Specialty Fertilizers
Phosphate Potash &
Magnesium Food
Specialties
Advanced Additives
Industrial Products
Specialty Fertilizers, 192
Potash & Mg., 283
Phosphates, 292
Advanced Additives, 213
Industrial Products, 266
Food Specialties,
138
Agro
Industrial
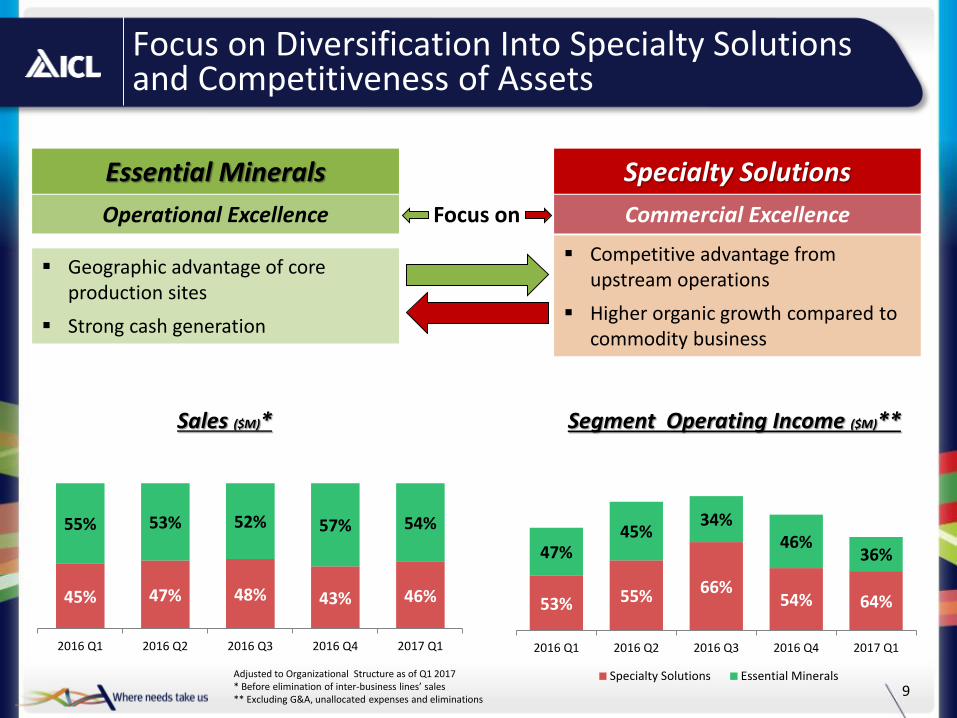
Focus on Diversification Into Specialty Solutions and Competitiveness of Assets
9
Essential Minerals Specialty Solutions
Geographic advantage of core production sites
Strong cash generation
Competitive advantage from upstream operations
Higher organic growth compared to commodity business
Operational Excellence Commercial Excellence Focus on
Segment Operating Income ($M)** Sales ($M)*
Adjusted to Organizational Structure as of Q1 2017 * Before elimination of inter-business lines’ sales ** Excluding G&A, unallocated expenses and eliminations
45% 47% 48% 43% 46%
55% 53% 52% 57% 54%
2016 Q1 2016 Q2 2016 Q3 2016 Q4 2017 Q1
53% 55% 66% 54% 64%
47% 45%
34% 46%
36%
2016 Q1 2016 Q2 2016 Q3 2016 Q4 2017 Q1
Specialty Solutions Essential Minerals
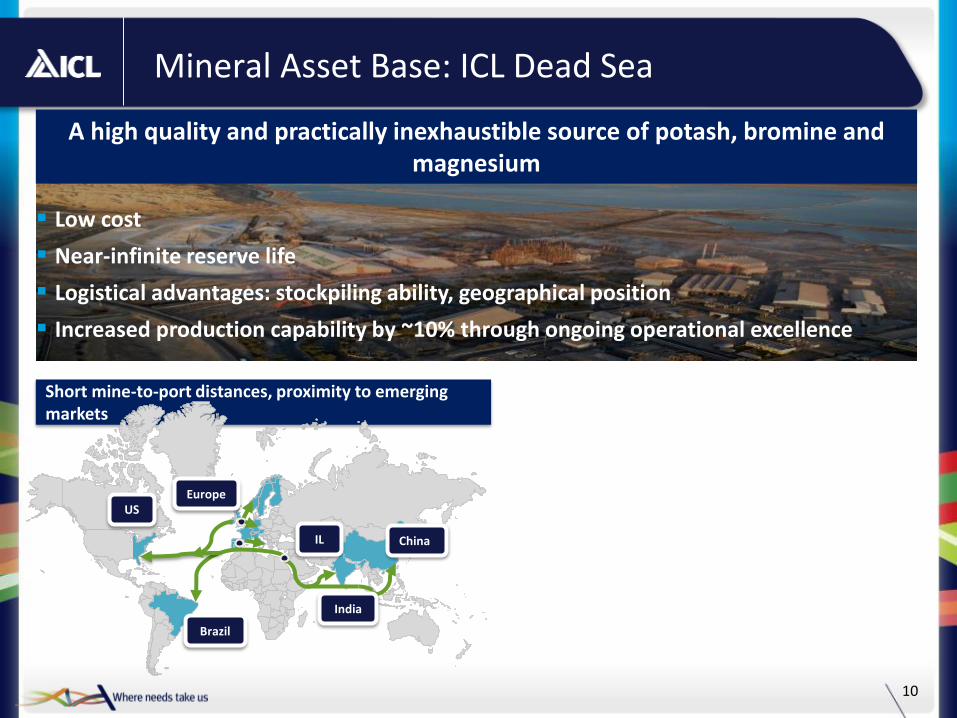
Short mine-to-port distances, proximity to emerging markets
Mineral Asset Base: ICL Dead Sea
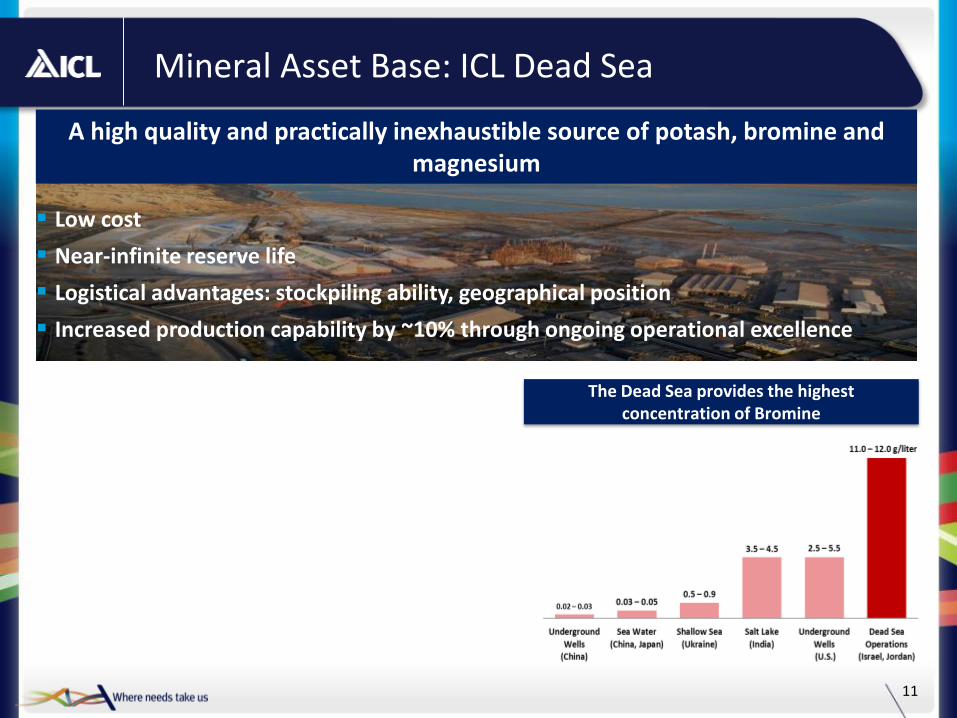
A high quality and practically inexhaustible source of potash, bromine and magnesium
Low cost
Near-infinite reserve life
Logistical advantages: stockpiling ability, geographical position
Increased production capability by ~10% through ongoing operational excellence
China
India
IL
Europe
Brazil
US
10
Mineral Asset Base: ICL Dead Sea
11
A high quality and practically inexhaustible source of potash, bromine and magnesium
Low cost
Near-infinite reserve life
Logistical advantages: stockpiling ability, geographical position
Increased production capability by ~10% through ongoing operational excellence
The Dead Sea provides the highest concentration of Bromine
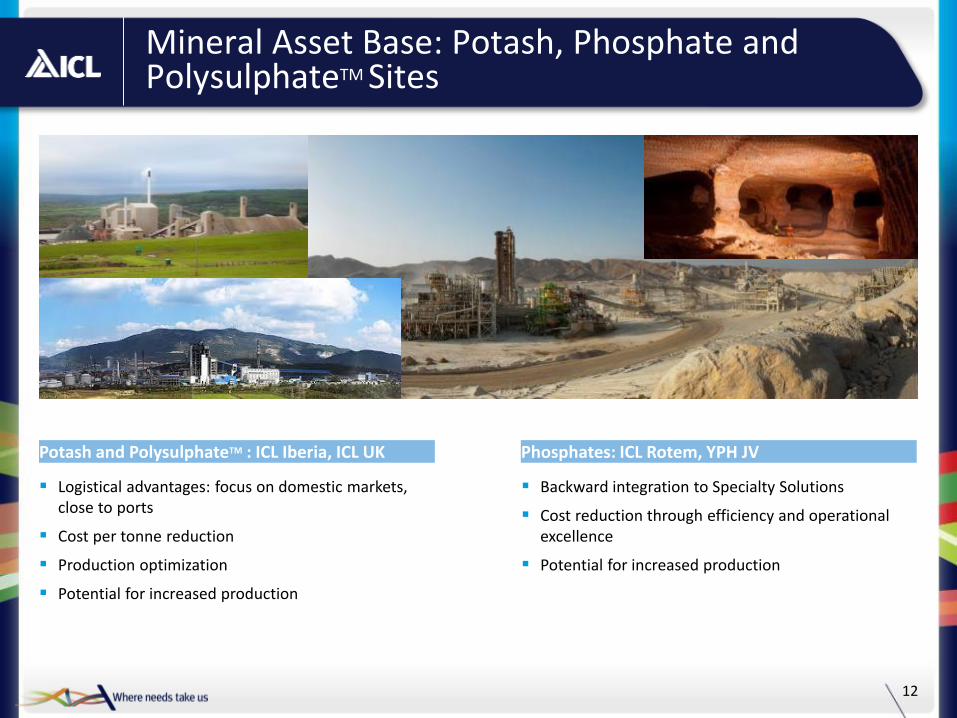
Mineral Asset Base: Potash, Phosphate and PolysulphateTM Sites
12
Logistical advantages: focus on domestic markets, close to ports
Cost per tonne reduction
Production optimization
Potential for increased production
Potash and PolysulphateTM : ICL Iberia, ICL UK
Backward integration to Specialty Solutions
Cost reduction through efficiency and operational excellence
Potential for increased production
Phosphates: ICL Rotem, YPH JV
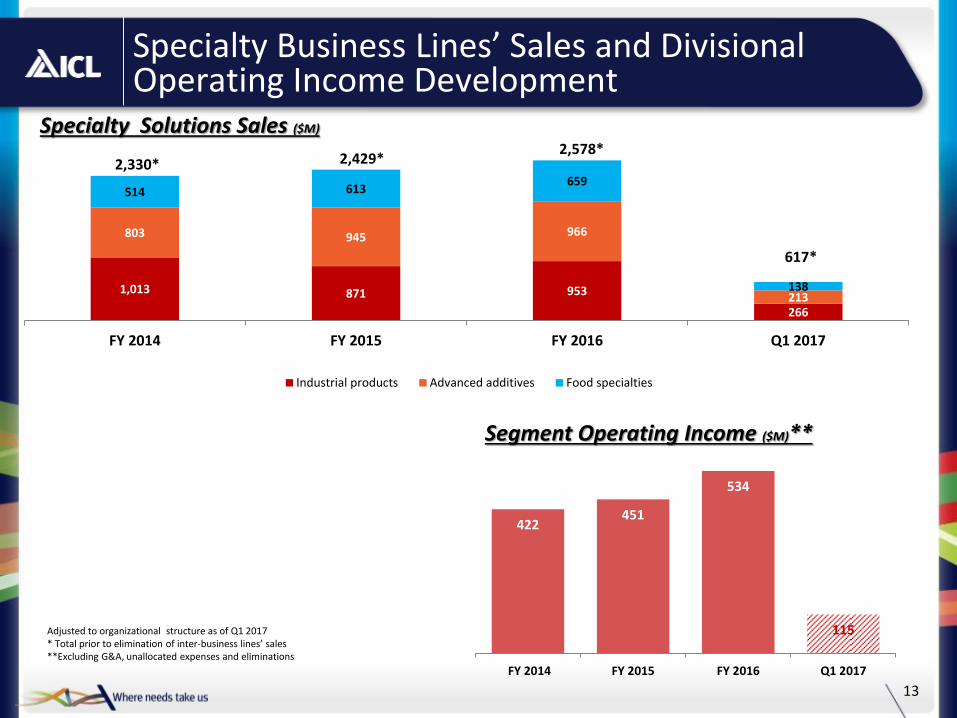
1,013 871 953
266
803 945 966
213
514 613 659
138
FY 2014 FY 2015 FY 2016 Q1 2017
Industrial products Advanced additives Food specialties
Specialty Business Lines’ Sales and Divisional Operating Income Development
13
Specialty Solutions Sales ($M)
Segment Operating Income ($M)**
Adjusted to organizational structure as of Q1 2017 * Total prior to elimination of inter-business lines’ sales **Excluding G&A, unallocated expenses and eliminations
2,429* 2,578*
2,330*
617*
422 451
534
115
FY 2014 FY 2015 FY 2016 Q1 2017
Financials
1,265 1,295
55 30
115
115 116
55
21 10 8
14
25
40
15
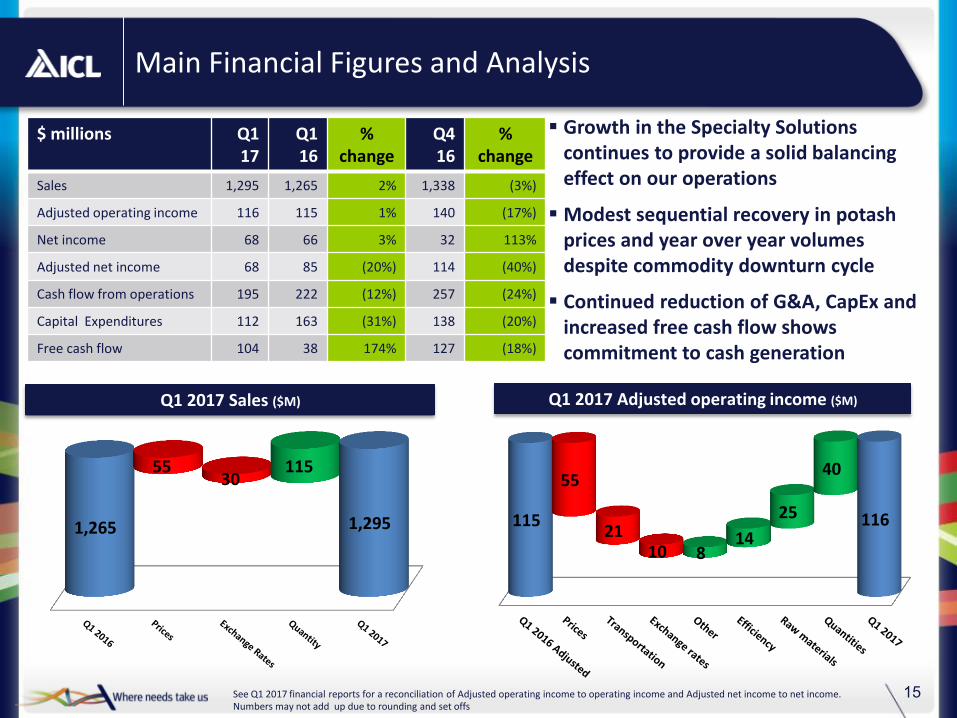
Main Financial Figures and Analysis
Q1 2017 Sales ($M) Q1 2017 Adjusted operating income ($M)
Numbers may not add up due to rounding and set offs See Q1 2017 financial reports for a reconciliation of Adjusted operating income to operating income and Adjusted net income to net income.
$ millions Q1 17
Q1 16
% change
Q4 16
% change
Sales 1,295 1,265 2% 1,338 (3%)
Adjusted operating income 116 115 1% 140 (17%)
Net income 68 66 3% 32 113%
Adjusted net income 68 85 (20%) 114 (40%)
Cash flow from operations 195 222 (12%) 257 (24%)
Capital Expenditures 112 163 (31%) 138 (20%)
Free cash flow 104 38 174% 127 (18%)
Growth in the Specialty Solutions continues to provide a solid balancing effect on our operations
Modest sequential recovery in potash prices and year over year volumes despite commodity downturn cycle
Continued reduction of G&A, CapEx and increased free cash flow shows commitment to cash generation
16
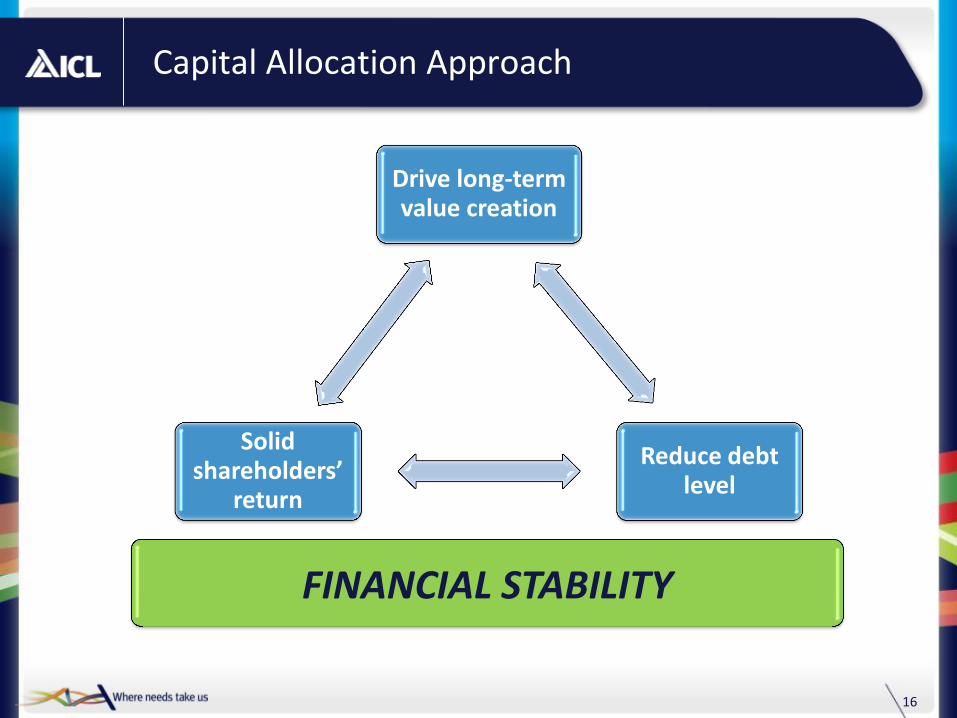
Capital Allocation Approach
Drive long-term value creation
Reduce debt level
Solid shareholders’
return
FINANCIAL STABILITY
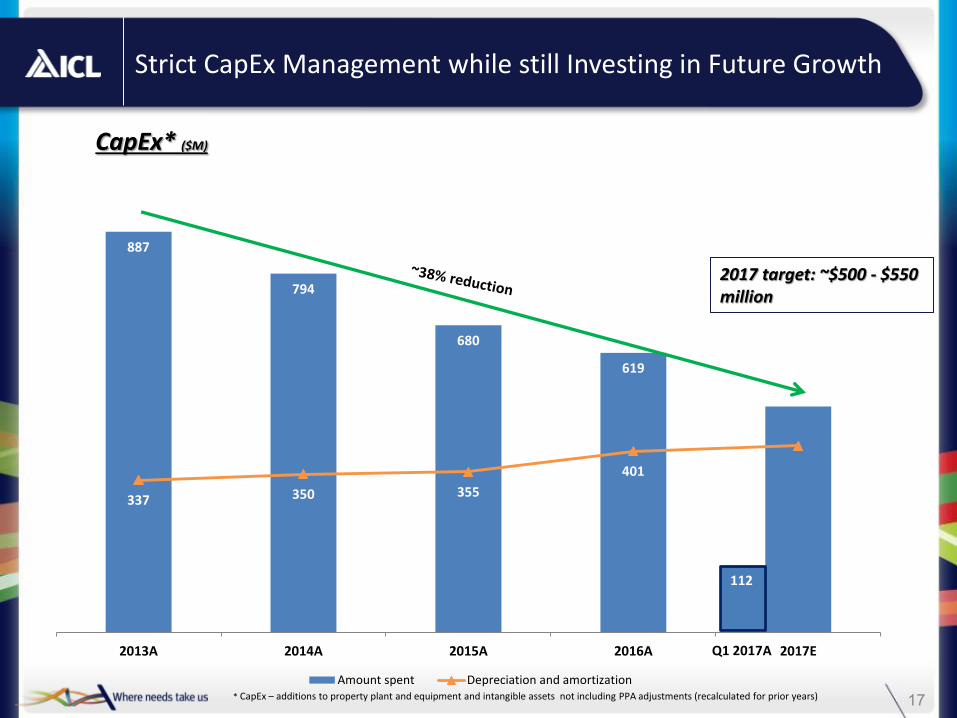
619
680
794
887
401
355 350 337
2017E2016A2015A2014A2013A
Amount spent Depreciation and amortization
Strict CapEx Management while still Investing in Future Growth
17
CapEx* ($M)
* CapEx – additions to property plant and equipment and intangible assets not including PPA adjustments (recalculated for prior years)
2017 target: ~$500 - $550 million
112
Q1 2017A
2017E2016A2015ASpecialty Solutions Essential Minerals
18
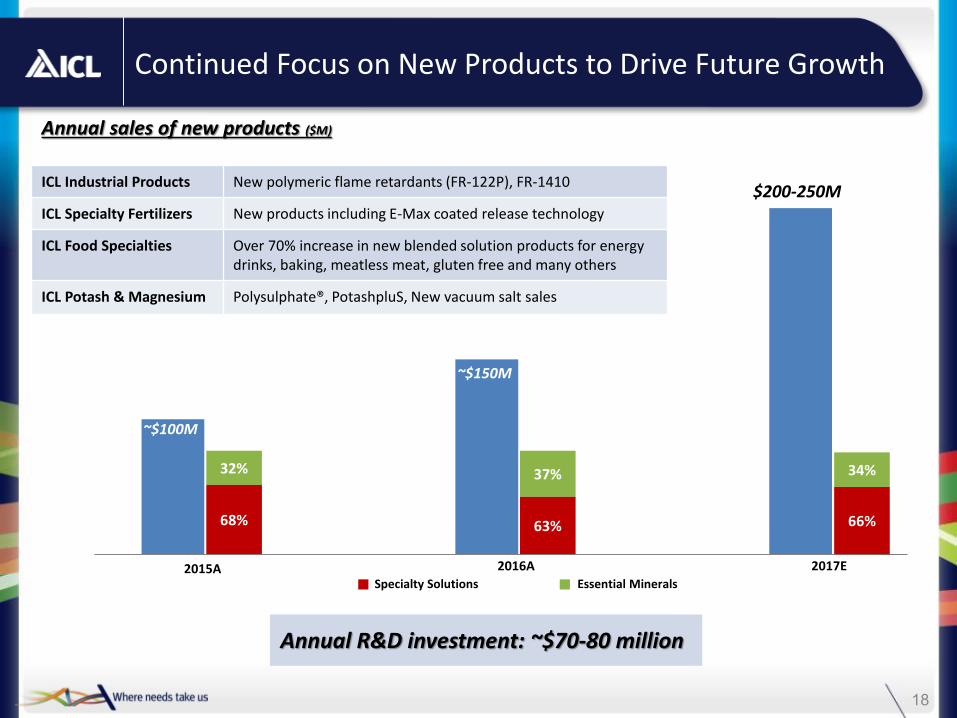
Annual R&D investment: ~$70-80 million
ICL Industrial Products New polymeric flame retardants (FR-122P), FR-1410
ICL Specialty Fertilizers New products including E-Max coated release technology
ICL Food Specialties
Over 70% increase in new blended solution products for energy drinks, baking, meatless meat, gluten free and many others
ICL Potash & Magnesium Polysulphate®, PotashpluS, New vacuum salt sales
Annual sales of new products ($M)
~$150M
~$100M
2015A 2016A 2017E
Continued Focus on New Products to Drive Future Growth
~82%
~18% ~21%
~79% ~78%
~22% 32% 37%
68%
34%
63% 66%
$200-250M
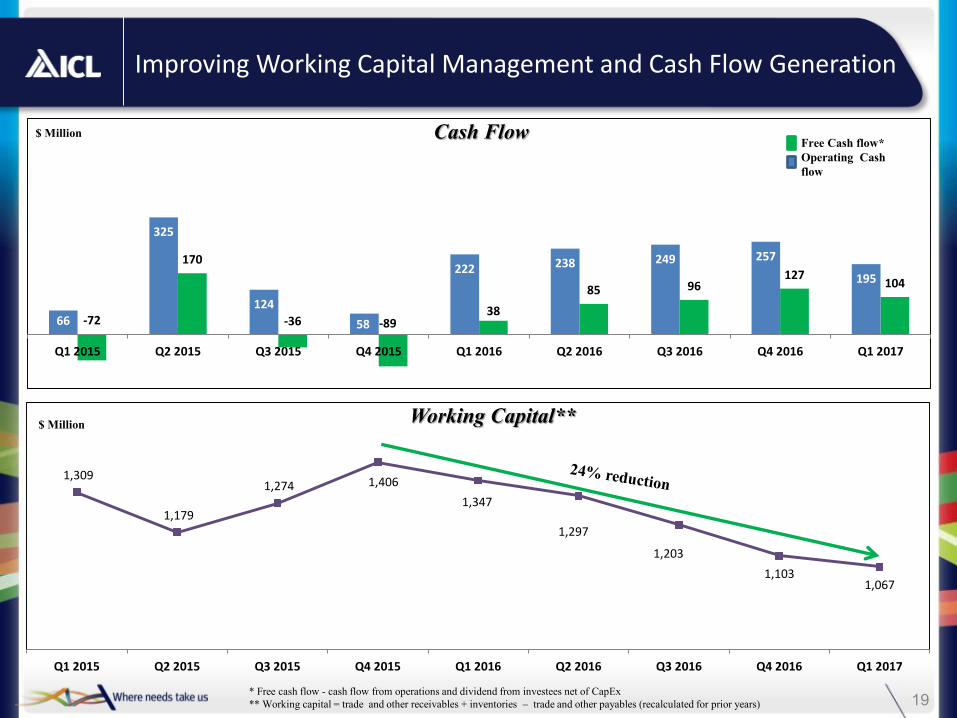
1,067 1,103
1,203
1,297
1,347
1,406 1,274
1,179
1,309
Q1 2017Q4 2016Q3 2016Q2 2016Q1 2016Q4 2015Q3 2015Q2 2015Q1 2015
104 127
96 85
38 -89 -36
170
-72
195
257 249 238 222
58
124
325
66
Q1 2017Q4 2016Q3 2016Q2 2016Q1 2016Q4 2015Q3 2015Q2 2015Q1 2015
19
Improving Working Capital Management and Cash Flow Generation
$ Million
* Free cash flow - cash flow from operations and dividend from investees net of CapEx
** Working capital = trade and other receivables + inventories – trade and other payables (recalculated for prior years)
Cash Flow
Working Capital** $ Million
Free Cash flow*
Operating Cash
flow
20
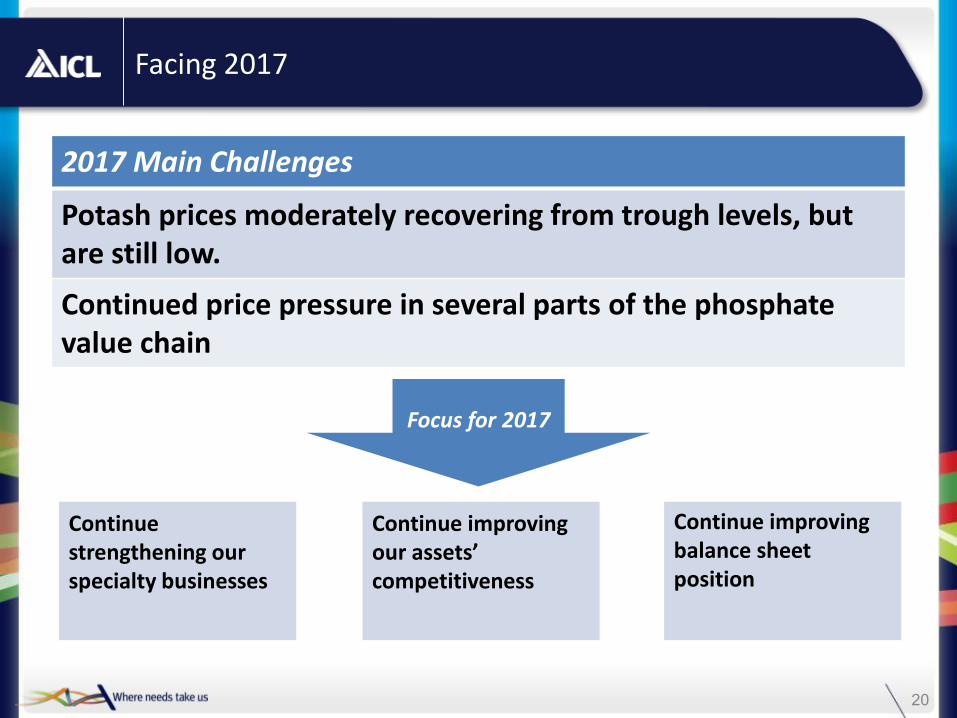
Facing 2017
2017 Main Challenges
Potash prices moderately recovering from trough levels, but are still low.
Continued price pressure in several parts of the phosphate value chain
Focus for 2017
Continue improving our assets’ competitiveness
Continue improving balance sheet position
Continue strengthening our specialty businesses
Committed to Responsible Value Creation
Thank you
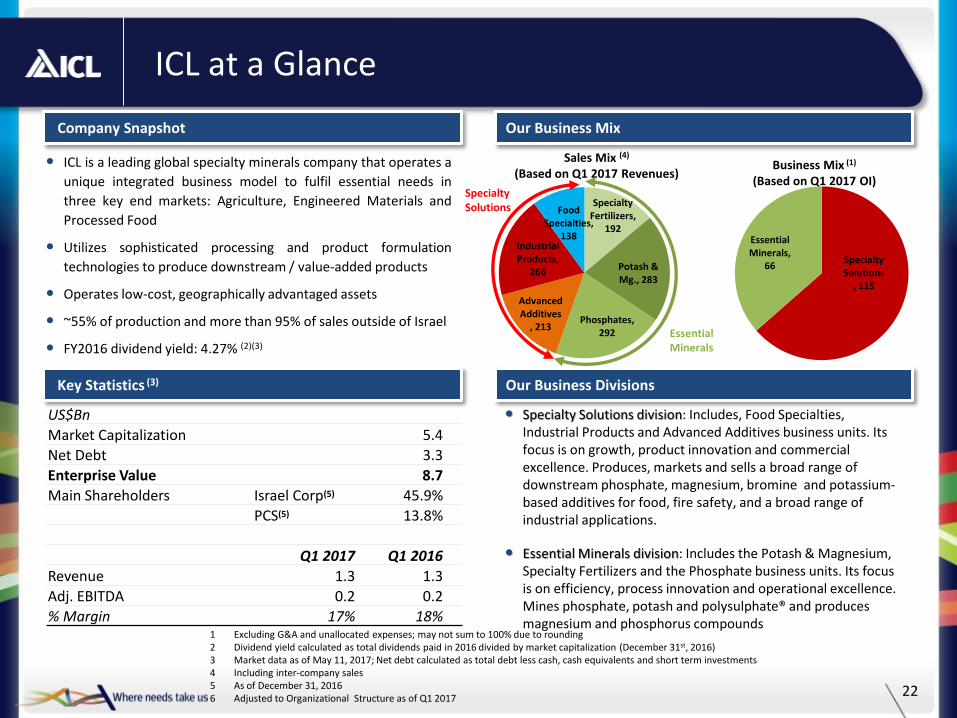
Specialty Fertilizers,
192
Potash & Mg., 283
Phosphates, 292
Advanced Additives
, 213
Industrial Products,
266
Food Specialties,
138
Specialty Solutions
, 115
Essential Minerals,
66
ICL at a Glance
22
ICL is a leading global specialty minerals company that operates a
unique integrated business model to fulfil essential needs in
three key end markets: Agriculture, Engineered Materials and
Processed Food
Utilizes sophisticated processing and product formulation
technologies to produce downstream / value-added products
Operates low-cost, geographically advantaged assets
~55% of production and more than 95% of sales outside of Israel
FY2016 dividend yield: 4.27% (2)(3)
Company Snapshot
Key Statistics (3) Our Business Divisions
US$Bn
Market Capitalization 5.4
Net Debt 3.3
Enterprise Value 8.7
Main Shareholders Israel Corp(5) 45.9%
PCS(5) 13.8%
Q1 2017 Q1 2016
Revenue 1.3 1.3
Adj. EBITDA 0.2 0.2
% Margin 17% 18%
Specialty Solutions division: Includes, Food Specialties, Industrial Products and Advanced Additives business units. Its focus is on growth, product innovation and commercial excellence. Produces, markets and sells a broad range of downstream phosphate, magnesium, bromine and potassium-based additives for food, fire safety, and a broad range of industrial applications.
Essential Minerals division: Includes the Potash & Magnesium, Specialty Fertilizers and the Phosphate business units. Its focus is on efficiency, process innovation and operational excellence. Mines phosphate, potash and polysulphate® and produces magnesium and phosphorus compounds
1 Excluding G&A and unallocated expenses; may not sum to 100% due to rounding 2 Dividend yield calculated as total dividends paid in 2016 divided by market capitalization (December 31st, 2016) 3 Market data as of May 11, 2017; Net debt calculated as total debt less cash, cash equivalents and short term investments 4 Including inter-company sales 5 As of December 31, 2016 6 Adjusted to Organizational Structure as of Q1 2017
Our Business Mix
Specialty Solutions
Business Mix (1) (Based on Q1 2017 OI)
Sales Mix (4)
(Based on Q1 2017 Revenues)
Essential Minerals

Appendices
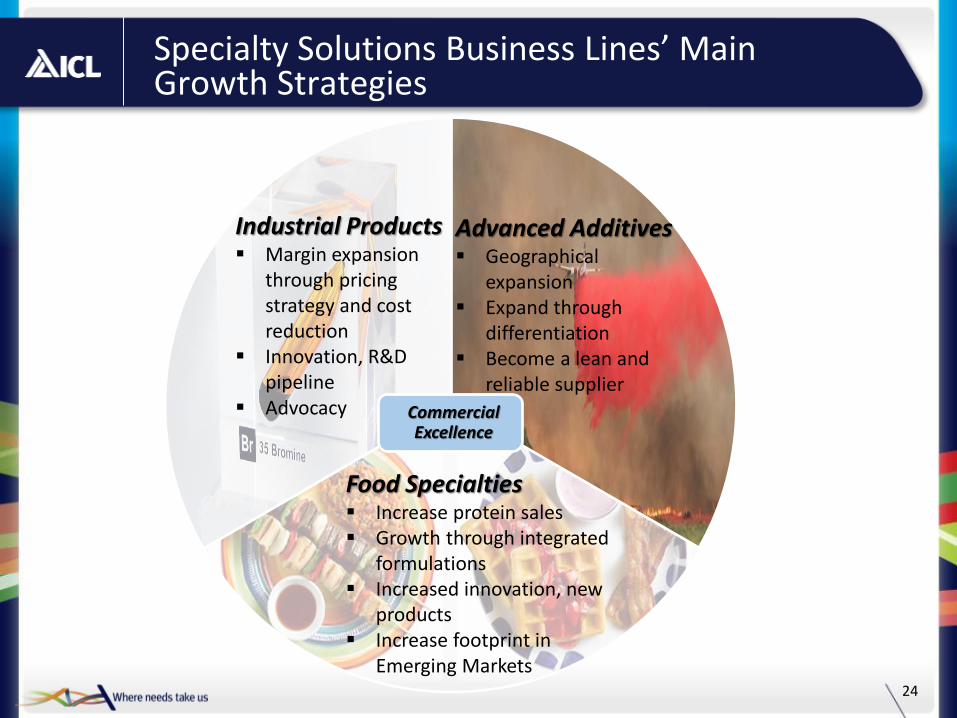
Specialty Solutions Business Lines’ Main Growth Strategies
24
Commercial Excellence
Industrial Products Margin expansion
through pricing strategy and cost reduction
Innovation, R&D pipeline
Advocacy
Food Specialties Increase protein sales Growth through integrated
formulations Increased innovation, new
products Increase footprint in
Emerging Markets
Advanced Additives Geographical
expansion Expand through
differentiation Become a lean and
reliable supplier
25
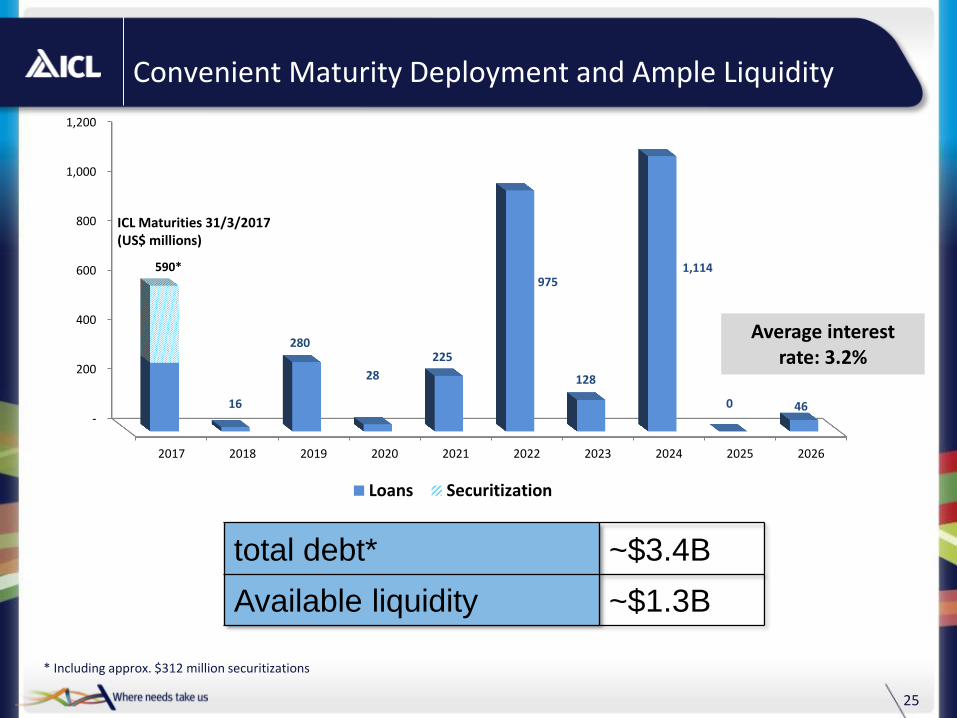
Convenient Maturity Deployment and Ample Liquidity
ICL Maturities 31/3/2017 (US$ millions)
Average interest rate: 3.2%
total debt* ~$3.4B
Available liquidity ~$1.3B
* Including approx. $312 million securitizations
-
200
400
600
800
1,000
1,200
2017 2018 2019 2020 2021 2022 2023 2024 2025 2026
16
280
28
225
975
128
1,114
0 46
Loans Securitization
590*

Essential Minerals Division

Market Data
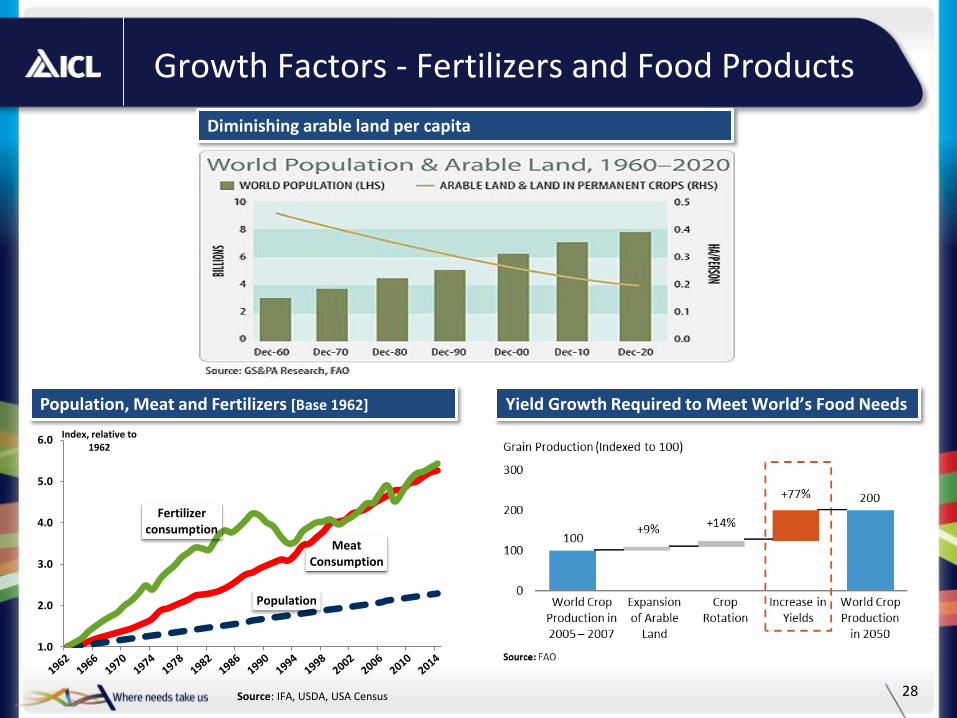
Growth Factors - Fertilizers and Food Products
28
Meat Consumption
Population
Fertilizer consumption
1.0
2.0
3.0
4.0
5.0
6.0 Index, relative to 1962
Yield Growth Required to Meet World’s Food Needs Population, Meat and Fertilizers [Base 1962]
Source: IFA, USDA, USA Census
Diminishing arable land per capita
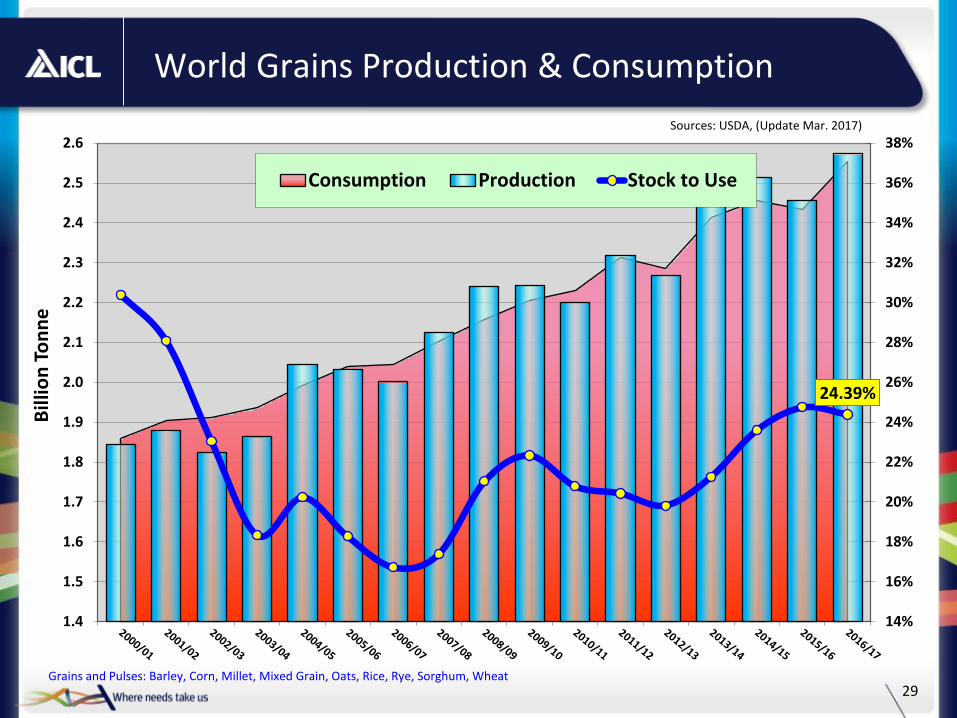
World Grains Production & Consumption
29 Grains and Pulses: Barley, Corn, Millet, Mixed Grain, Oats, Rice, Rye, Sorghum, Wheat
24.39%
14%
16%
18%
20%
22%
24%
26%
28%
30%
32%
34%
36%
38%
1.4
1.5
1.6
1.7
1.8
1.9
2.0
2.1
2.2
2.3
2.4
2.5
2.6
Bill
ion
To
nn
e
Consumption Production Stock to Use
Sources: USDA, (Update Mar. 2017)
$3
$5
$7
$9
$11
$13
$15
$17
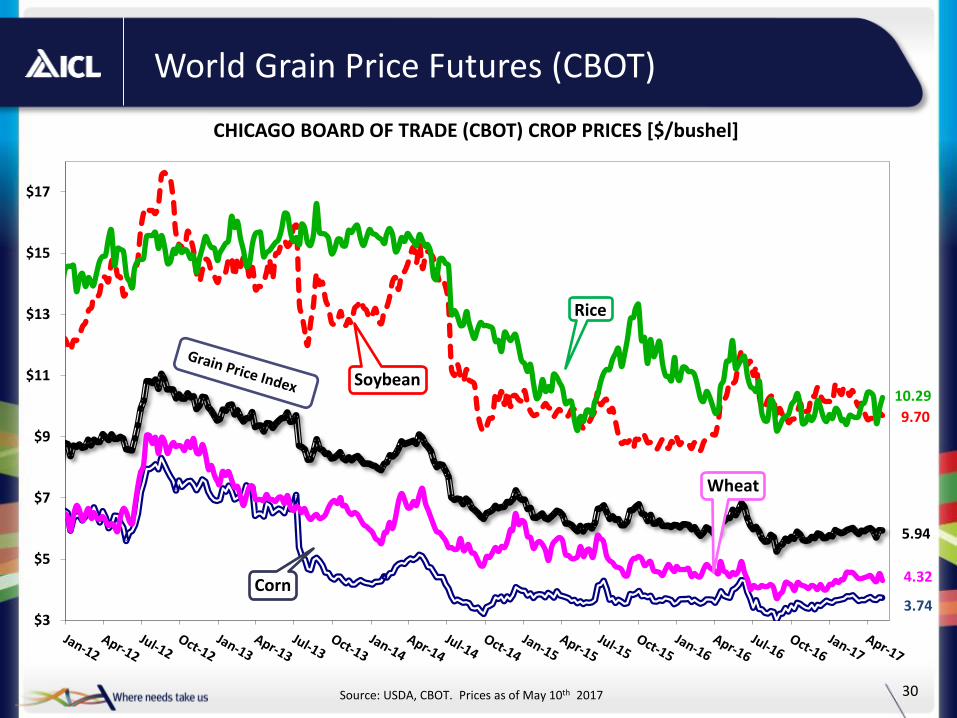
CHICAGO BOARD OF TRADE (CBOT) CROP PRICES [$/bushel]
Corn
Rice
Soybean
Wheat
World Grain Price Futures (CBOT)
30 Source: USDA, CBOT. Prices as of May 10th 2017
10.29
9.70
4.32
3.74
5.94
0
100
200
300
400
500
600
700
200
250
300
350
400
450
500
550
600
650
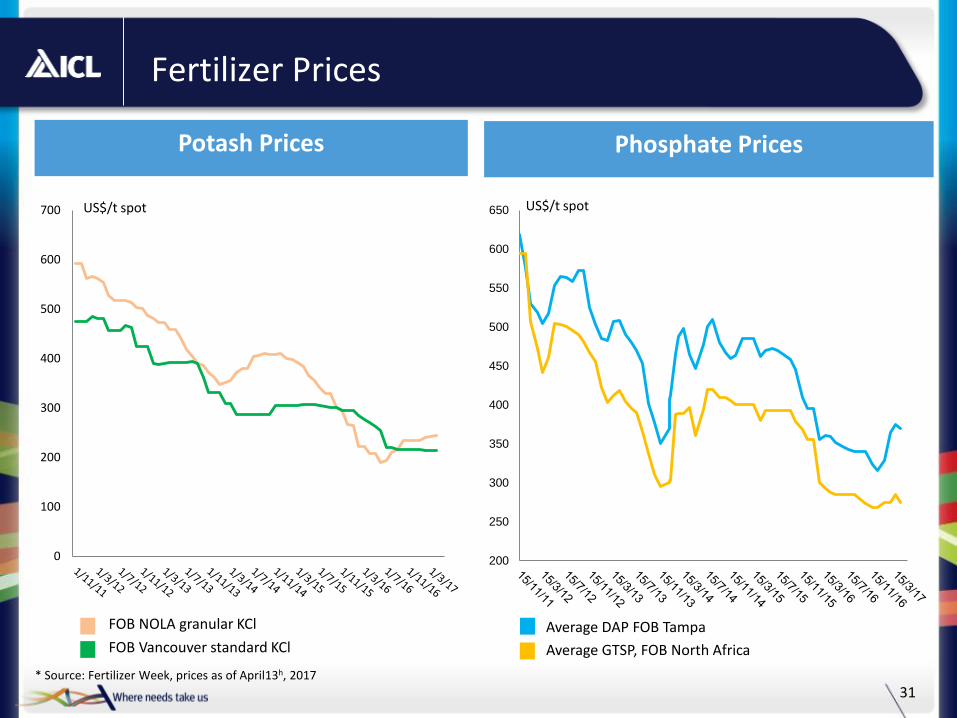
31
Fertilizer Prices
Potash Prices
FOB Vancouver standard KCl
US$/t spot US$/t spot
Average DAP FOB Tampa
Average GTSP, FOB North Africa
Phosphate Prices
* Source: Fertilizer Week, prices as of April13h, 2017
FOB NOLA granular KCl

Potash & Magnesium
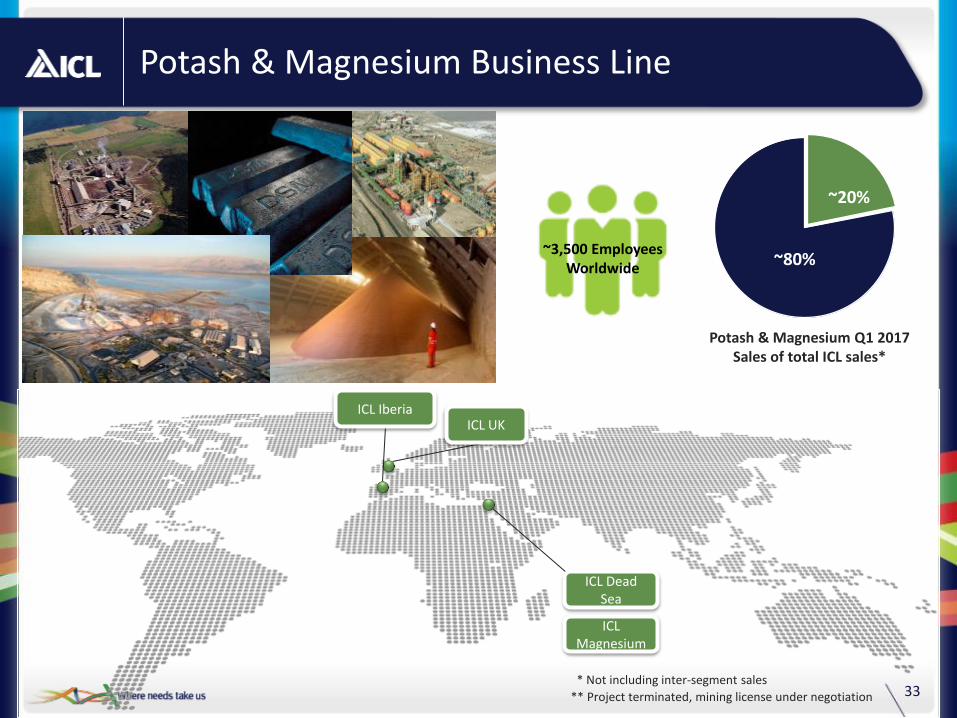
33
Potash & Magnesium Business Line
~80%
Potash & Magnesium Q1 2017 Sales of total ICL sales*
* Not including inter-segment sales
~20%
** Project terminated, mining license under negotiation
ICL Dead Sea
ICL UK ICL Iberia
ICL Magnesium
~3,500 Employees Worldwide
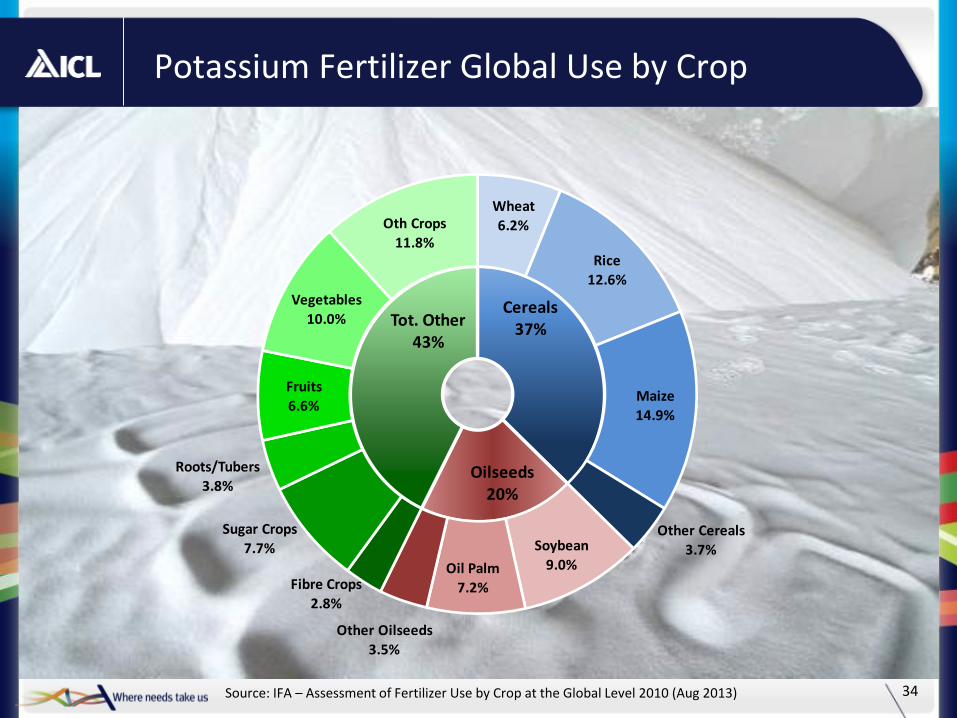
Cereals 37%
Oilseeds 20%
Tot. Other43%
Wheat
6.2%
Rice
12.6%
Maize
14.9%
Other Cereals
3.7%Soybean
9.0%Oil Palm
7.2%
Other Oilseeds
3.5%
Fibre Crops
2.8%
Sugar Crops
7.7%
Roots/Tubers
3.8%
Fruits
6.6%
Vegetables
10.0%
Oth Crops
11.8%
Source: IFA – Assessment of Fertilizer Use by Crop at the Global Level 2010 (Aug 2013)
Potassium Fertilizer Global Use by Crop
34
China China
China China China
India
India
India India
India
Brazil
Brazil
Brazil Brazil
Brazil
USA
USA
USA USA
USA
SE Asia
SE Asia
SE Asia SE Asia
SE Asia
RoW
RoW
RoW RoW
RoW
China India
Brazil
RoW
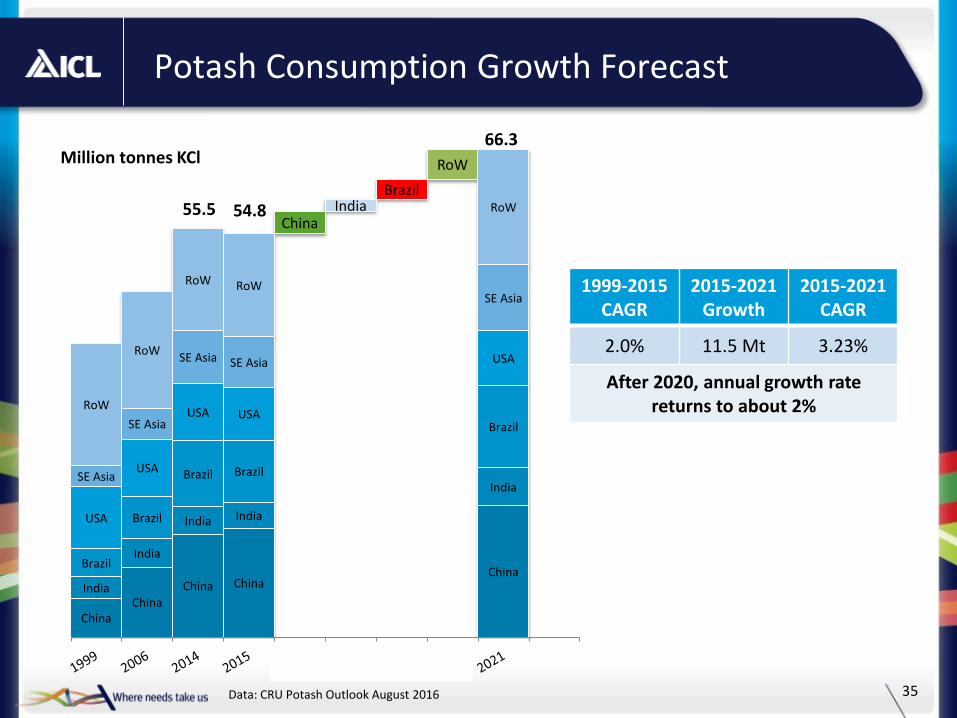
66.3
54.8 55.5
Potash Consumption Growth Forecast
Data: CRU Potash Outlook August 2016
Million tonnes KCl
35
1999-2015 CAGR
2015-2021 Growth
2015-2021 CAGR
2.0% 11.5 Mt 3.23%
After 2020, annual growth rate returns to about 2%
36
1
3
4
5
2
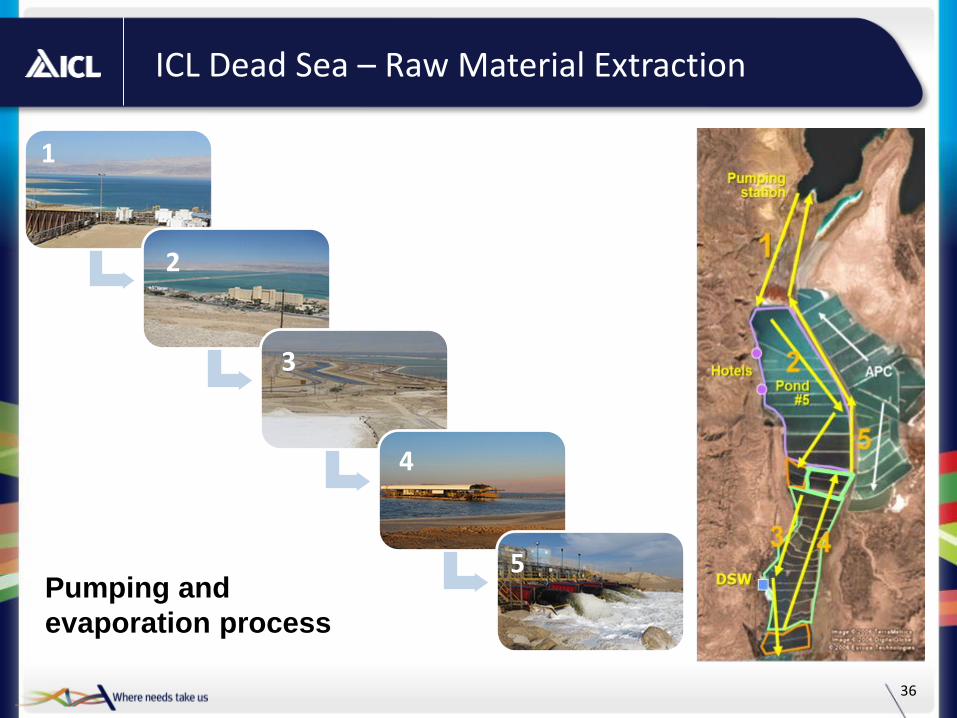
ICL Dead Sea – Raw Material Extraction
Pumping and
evaporation process
1
2
3
4
5
50 120 200
1,000
2014 2015 2016 2020
37
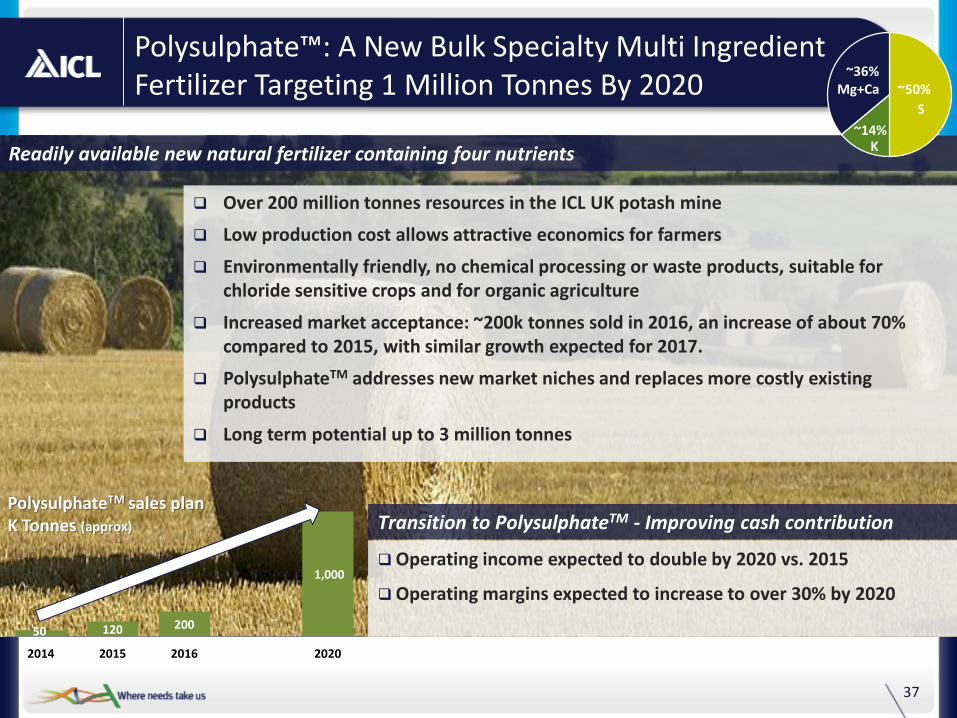
Polysulphate™: A New Bulk Specialty Multi Ingredient Fertilizer Targeting 1 Million Tonnes By 2020
Readily available new natural fertilizer containing four nutrients
~50%
~14% K
S
~36% Mg+Ca
Over 200 million tonnes resources in the ICL UK potash mine
Low production cost allows attractive economics for farmers
Environmentally friendly, no chemical processing or waste products, suitable for chloride sensitive crops and for organic agriculture
Increased market acceptance: ~200k tonnes sold in 2016, an increase of about 70% compared to 2015, with similar growth expected for 2017.
PolysulphateTM addresses new market niches and replaces more costly existing products
Long term potential up to 3 million tonnes
PolysulphateTM sales plan K Tonnes (approx)
Operating income expected to double by 2020 vs. 2015
Operating margins expected to increase to over 30% by 2020
Transition to PolysulphateTM - Improving cash contribution
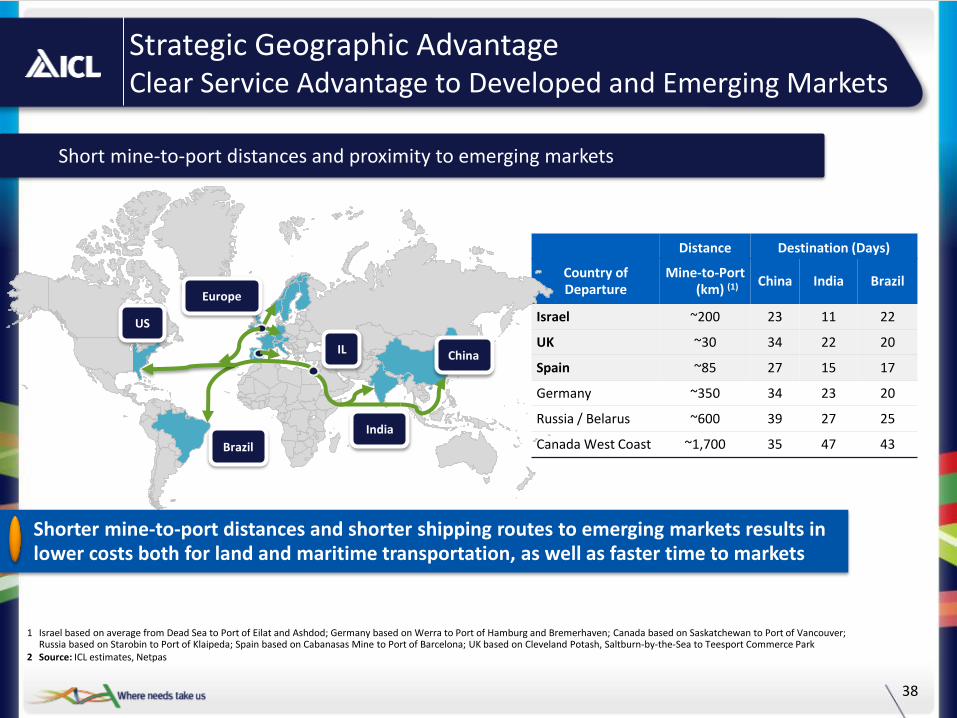
Strategic Geographic Advantage Clear Service Advantage to Developed and Emerging Markets
Distance Destination (Days)
Country of Departure
Mine-to-Port (km) (1)
China India Brazil
Israel ~200 23 11 22
UK ~30 34 22 20
Spain ~85 27 15 17
Germany ~350 34 23 20
Russia / Belarus ~600 39 27 25
Canada West Coast ~1,700 35 47 43
China
India
IL
Europe
Brazil
US
Short mine-to-port distances and proximity to emerging markets
1 Israel based on average from Dead Sea to Port of Eilat and Ashdod; Germany based on Werra to Port of Hamburg and Bremerhaven; Canada based on Saskatchewan to Port of Vancouver; Russia based on Starobin to Port of Klaipeda; Spain based on Cabanasas Mine to Port of Barcelona; UK based on Cleveland Potash, Saltburn-by-the-Sea to Teesport Commerce Park
2 Source: ICL estimates, Netpas
• Shorter mine-to-port distances and shorter shipping routes to emerging markets results in lower costs both for land and maritime transportation, as well as faster time to markets
38

Phosphate
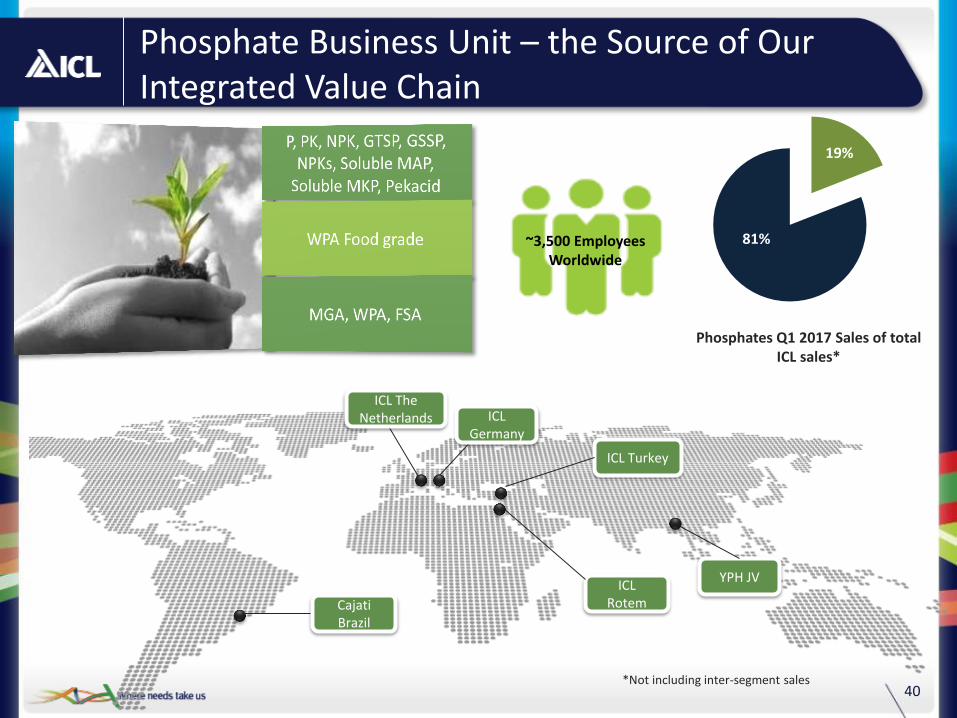
40
ICL Rotem
ICL Turkey
~3,500 Employees Worldwide
ICL Germany
ICL The Netherlands
Phosphate Business Unit – the Source of Our Integrated Value Chain
85%
Phosphates Q1 2017 Sales of total ICL sales*
*Not including inter-segment sales
YPH JV
15%
Cajati Brazil
19%
81%
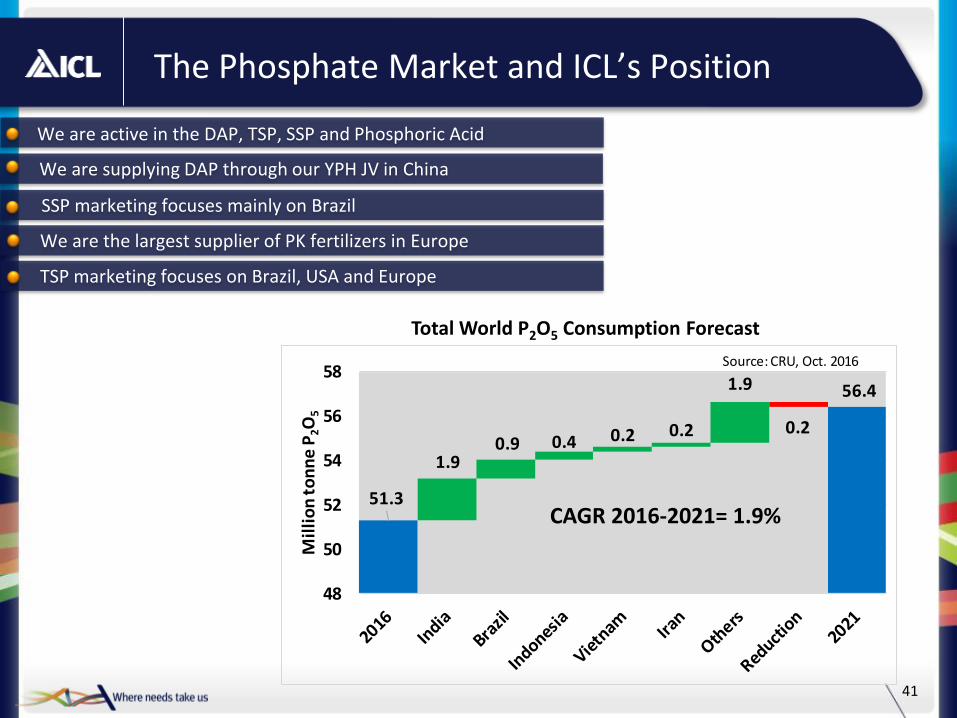
The Phosphate Market and ICL’s Position
41
51.3
56.4
1.90.9 0.4 0.2 0.2
1.9
0.2
48
50
52
54
56
58
Mil
lio
n t
on
ne
P2O
5
Source: CRU, Oct. 2016
Total World P2O5 Consumption Forecast
CAGR 2016-2021= 1.9%
We are active in the DAP, TSP, SSP and Phosphoric Acid
• TSP marketing focuses on Brazil, USA and Europe
SSP marketing focuses mainly on Brazil
• We are the largest supplier of PK fertilizers in Europe
• We are supplying DAP through our YPH JV in China
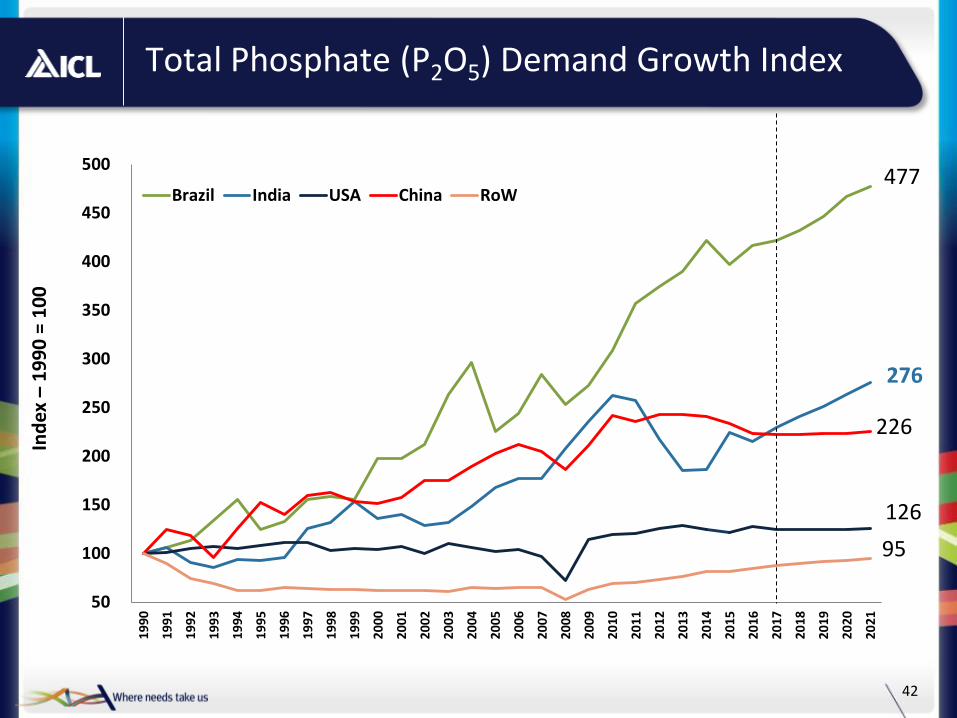
Total Phosphate (P2O5) Demand Growth Index
42
477
276
126
226
95
50
100
150
200
250
300
350
400
450
5001
990
19
91
19
92
19
93
19
94
19
95
19
96
19
97
19
98
19
99
20
00
20
01
20
02
2003
20
04
20
05
20
06
20
07
20
08
20
09
20
10
20
11
20
12
20
13
20
14
20
15
2016
20
17
20
18
20
19
20
20
20
21
Ind
ex –
19
90
= 1
00
Brazil India USA China RoW
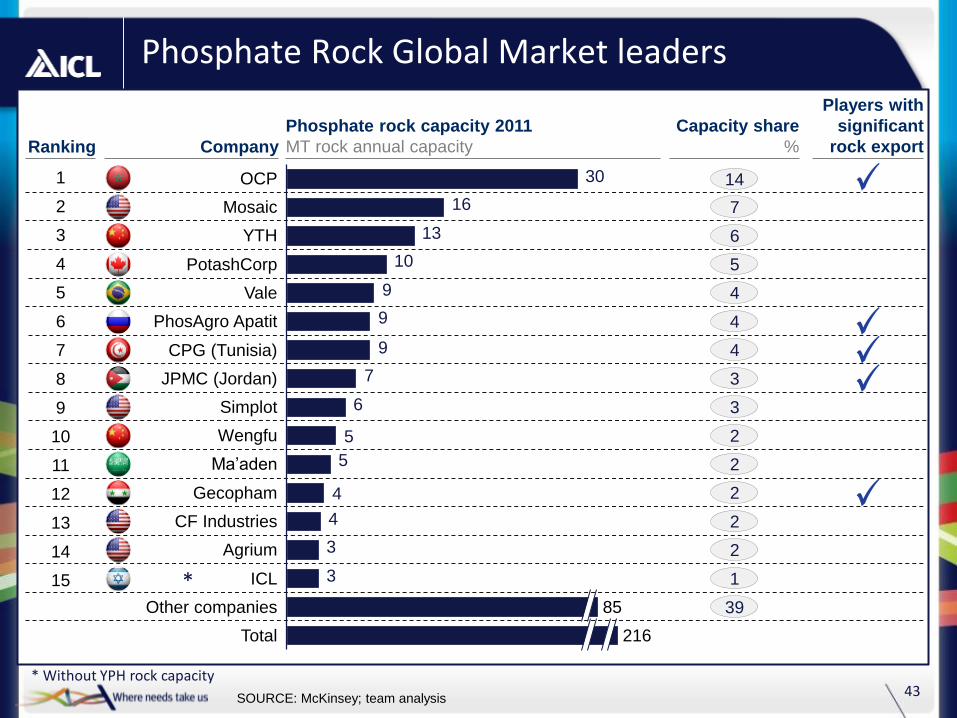
Phosphate Rock Global Market leaders
SOURCE: McKinsey; team analysis
30
16
13
10
9
9
9
7
6
5
5
4
4
3
3
Total
Mosaic
YTH
Gecopham
Ma’aden
CF Industries
Other companies
Agrium
ICL
216
Simplot
JPMC (Jordan)
Wengfu
CPG (Tunisia)
PhosAgro Apatit
Vale
PotashCorp
85
OCP 1
2
3
4
5
6
7
8
9
10
11
12
13
15
14
Phosphate rock capacity 2011
MT rock annual capacity Ranking
Capacity share
% Company
Players with
significant
rock export
14
7
6
5
4
4
4
3
3
2
2
2
2
2
1
39
*
* Without YPH rock capacity 43
780 256 600
1,900
4,000
115
60
700
850
2,500
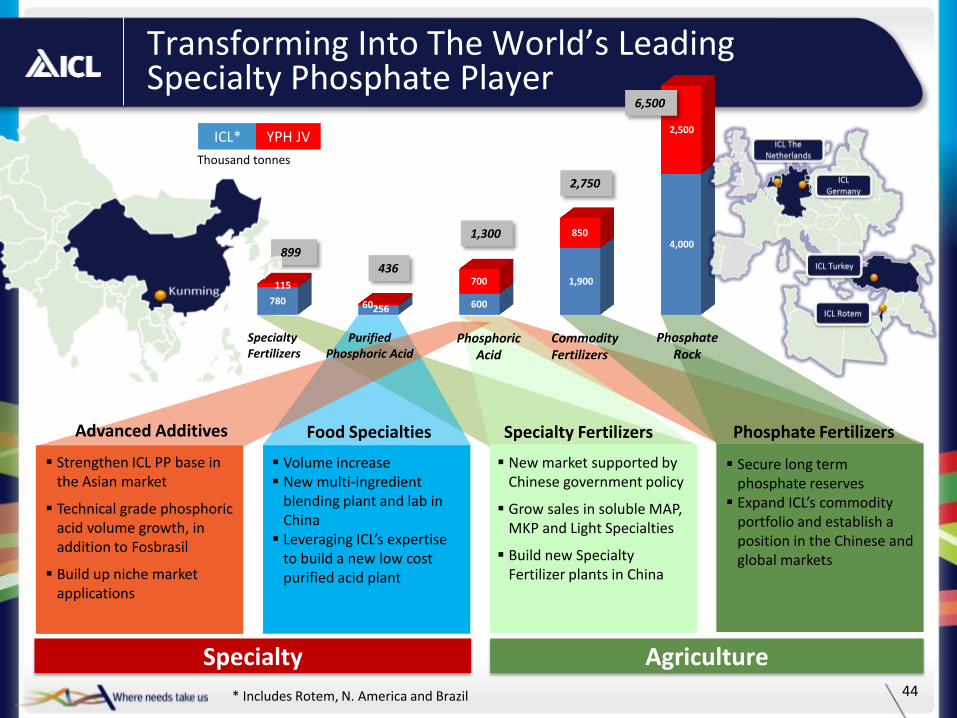
Transforming Into The World’s Leading Specialty Phosphate Player
44
ICL* YPH JV
Thousand tonnes
899 436
1,300
2,750
6,500
Phosphate Fertilizers Food Specialties Specialty Fertilizers
Specialty Agriculture
New market supported by Chinese government policy
Grow sales in soluble MAP, MKP and Light Specialties
Build new Specialty Fertilizer plants in China
Secure long term phosphate reserves
Expand ICL’s commodity portfolio and establish a position in the Chinese and global markets
Kunming
Volume increase New multi-ingredient
blending plant and lab in China
Leveraging ICL’s expertise to build a new low cost purified acid plant
* Includes Rotem, N. America and Brazil
Purified Phosphoric Acid
Phosphoric Acid
Commodity Fertilizers
Phosphate Rock
Specialty Fertilizers
Strengthen ICL PP base in the Asian market
Technical grade phosphoric acid volume growth, in addition to Fosbrasil
Build up niche market applications
Advanced Additives

Specialty Fertilizers
46
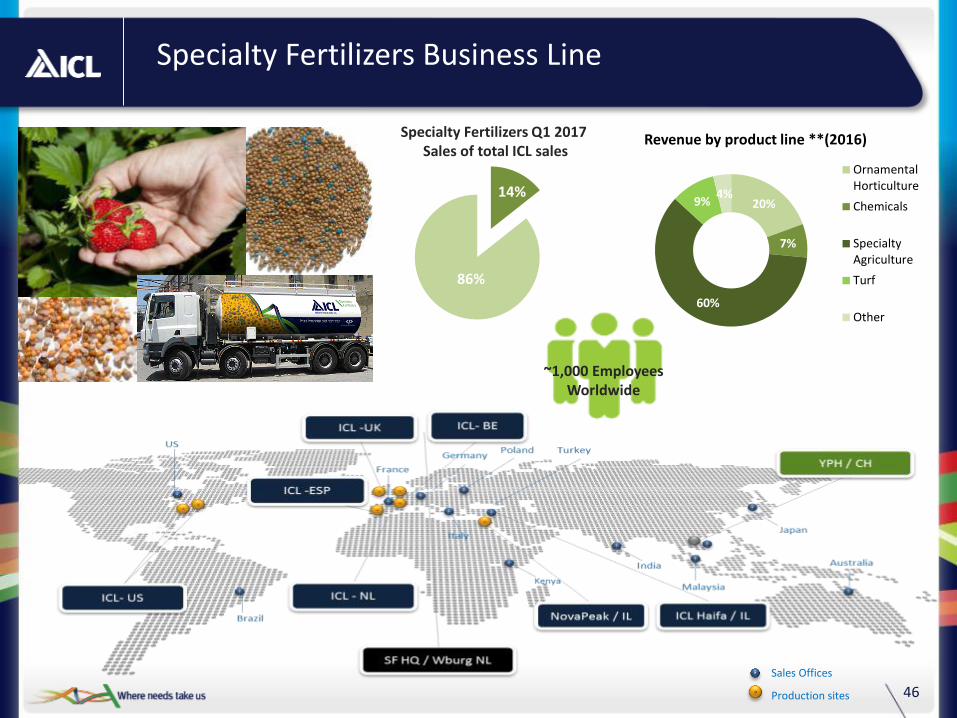
Specialty Fertilizers Business Line
Sales Offices
Production sites
45% 33%
Specialty Fertilizers Q1 2017 Sales of total ICL sales
~$700M
~1,000 Employees Worldwide
20%
7%
60%
9% 4%
Revenue by product line **(2016)
OrnamentalHorticulture
Chemicals
SpecialtyAgriculture
Turf
Other
14%
86%
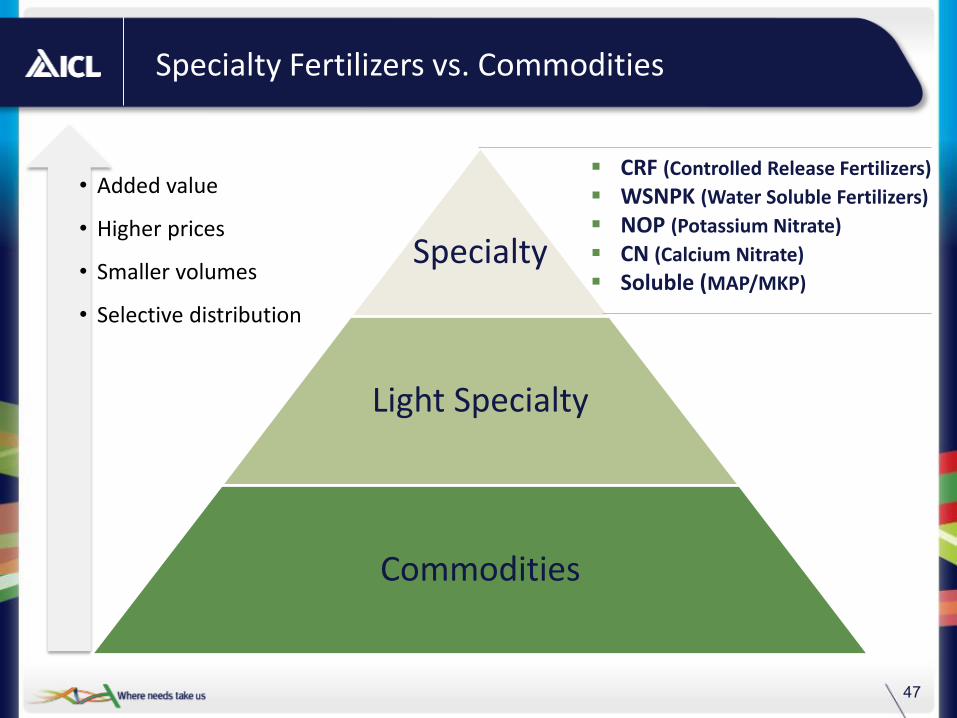
Specialty
Light Specialty
Commodities
47
• Added value
• Higher prices
• Smaller volumes
• Selective distribution
Specialty Fertilizers vs. Commodities
CRF (Controlled Release Fertilizers)
WSNPK (Water Soluble Fertilizers)
NOP (Potassium Nitrate)
CN (Calcium Nitrate)
Soluble (MAP/MKP)
48
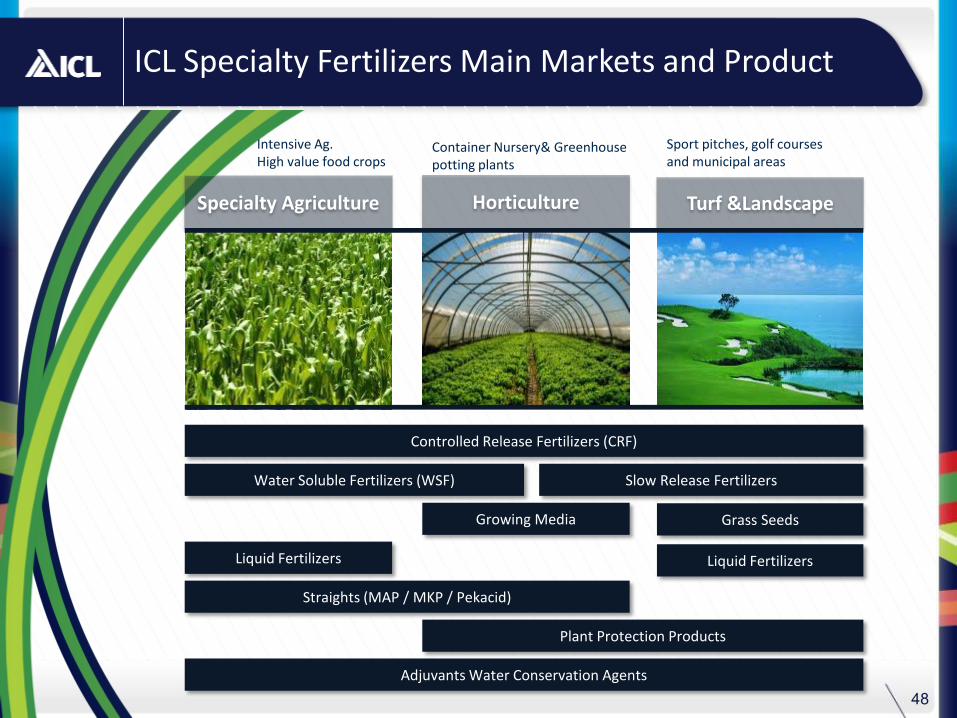
ICL Specialty Fertilizers Main Markets and Product
Liquid Fertilizers
Growing Media Grass Seeds
Water Soluble Fertilizers (WSF)
Controlled Release Fertilizers (CRF)
Straights (MAP / MKP / Pekacid)
Plant Protection Products
Adjuvants Water Conservation Agents
Liquid Fertilizers
Slow Release Fertilizers
Intensive Ag. High value food crops
Container Nursery& Greenhouse potting plants
Sport pitches, golf courses and municipal areas
Specialty Agriculture Horticulture Turf &Landscape
Turf
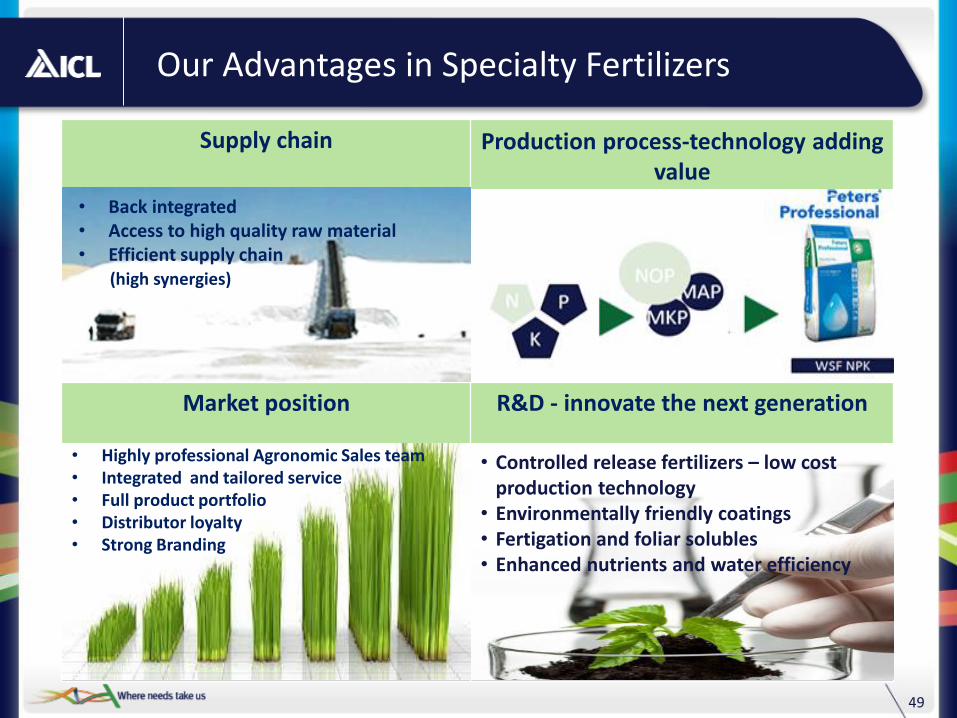
Supply chain Production process-technology adding value
Market position R&D - innovate the next generation
Our Advantages in Specialty Fertilizers
• Back integrated • Access to high quality raw material • Efficient supply chain (high synergies)
• Highly professional Agronomic Sales team • Integrated and tailored service • Full product portfolio • Distributor loyalty • Strong Branding
49
• Controlled release fertilizers – low cost production technology
• Environmentally friendly coatings • Fertigation and foliar solubles • Enhanced nutrients and water efficiency
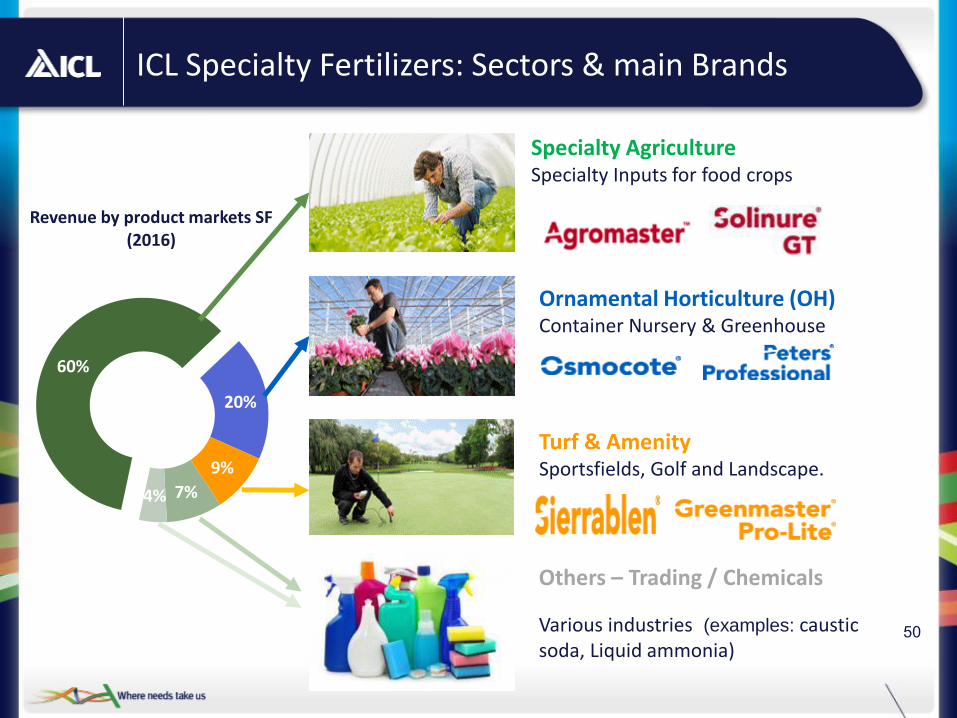
60%
20%
9%
7% 4%
Revenue by product markets SF (2016)
50
ICL Specialty Fertilizers: Sectors & main Brands
Turf & Amenity Sportsfields, Golf and Landscape.
Specialty Agriculture Specialty Inputs for food crops
Ornamental Horticulture (OH) Container Nursery & Greenhouse
Others – Trading / Chemicals
Various industries (examples: caustic soda, Liquid ammonia)
51
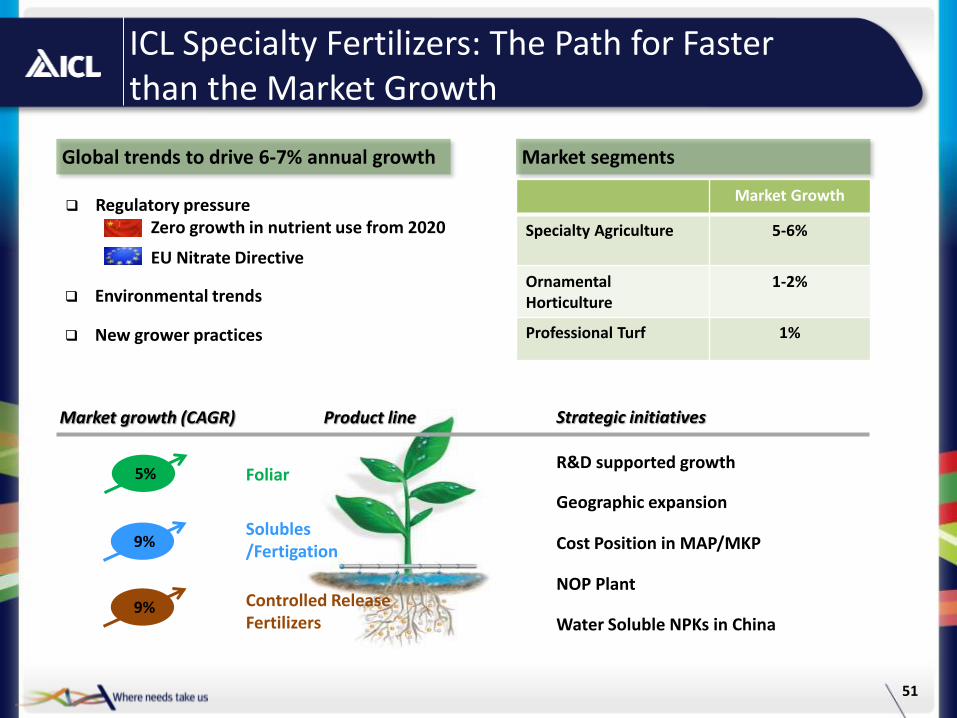
ICL Specialty Fertilizers: The Path for Faster than the Market Growth
Solubles /Fertigation
Foliar
Controlled Release Fertilizers
5%
9%
9%
R&D supported growth
Geographic expansion
Cost Position in MAP/MKP
NOP Plant
Water Soluble NPKs in China
Global trends to drive 6-7% annual growth
Regulatory pressure Zero growth in nutrient use from 2020
EU Nitrate Directive
Environmental trends
New grower practices
Market segments
Market Growth
Specialty Agriculture 5-6%
Ornamental Horticulture
1-2%
Professional Turf 1%
Market growth (CAGR) Product line Strategic initiatives
Specialty Solutions Division

Industrial Products
54
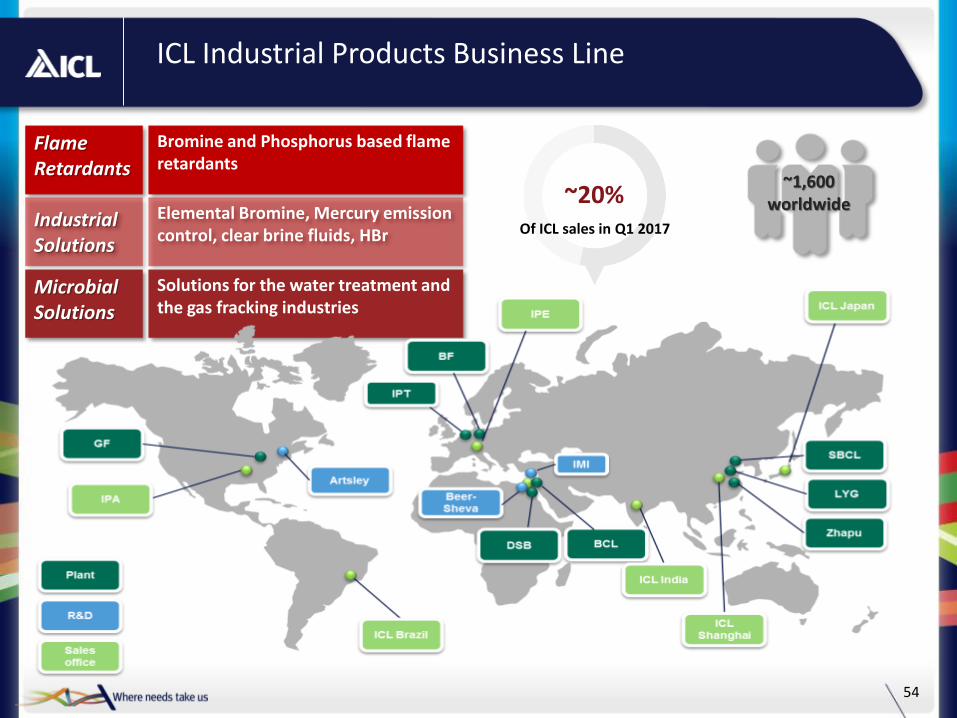
ICL Industrial Products Business Line
~1,600 worldwide
Of ICL sales in Q1 2017
~20%
Bromine and Phosphorus based flame retardants
Elemental Bromine, Mercury emission control, clear brine fluids, HBr
Solutions for the water treatment and the gas fracking industries
Flame Retardants
Microbial Solutions
Industrial Solutions
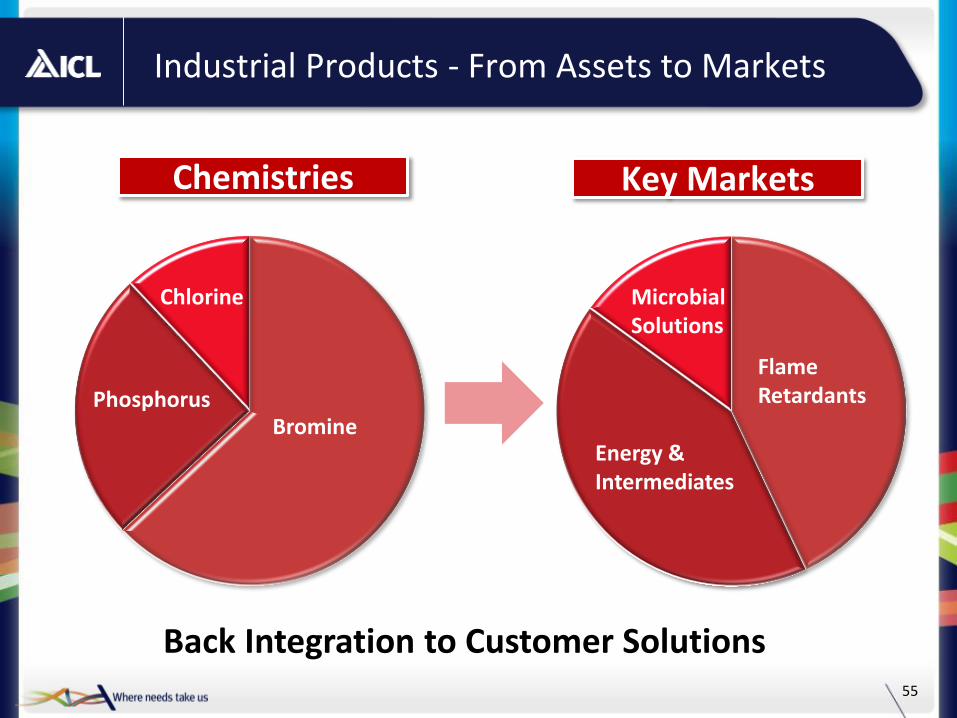
Industrial Products - From Assets to Markets
55
Chemistries Key Markets
Back Integration to Customer Solutions
Flame Retardants
Microbial Solutions
Energy & Intermediates
Bromine
Chlorine
Phosphorus
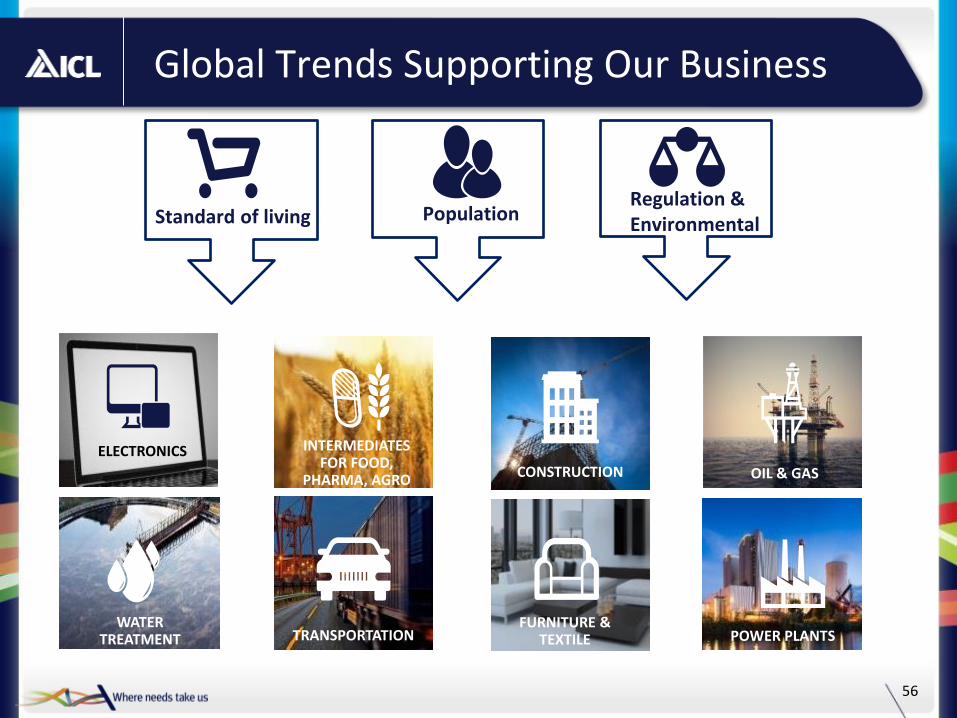
Global Trends Supporting Our Business
56
Population Regulation & Environmental Standard of living
FURNITURE & TEXTILE TRANSPORTATION
WATER TREATMENT
CONSTRUCTION
INTERMEDIATES FOR FOOD,
PHARMA, AGRO OIL & GAS
POWER PLANTS
ELECTRONICS
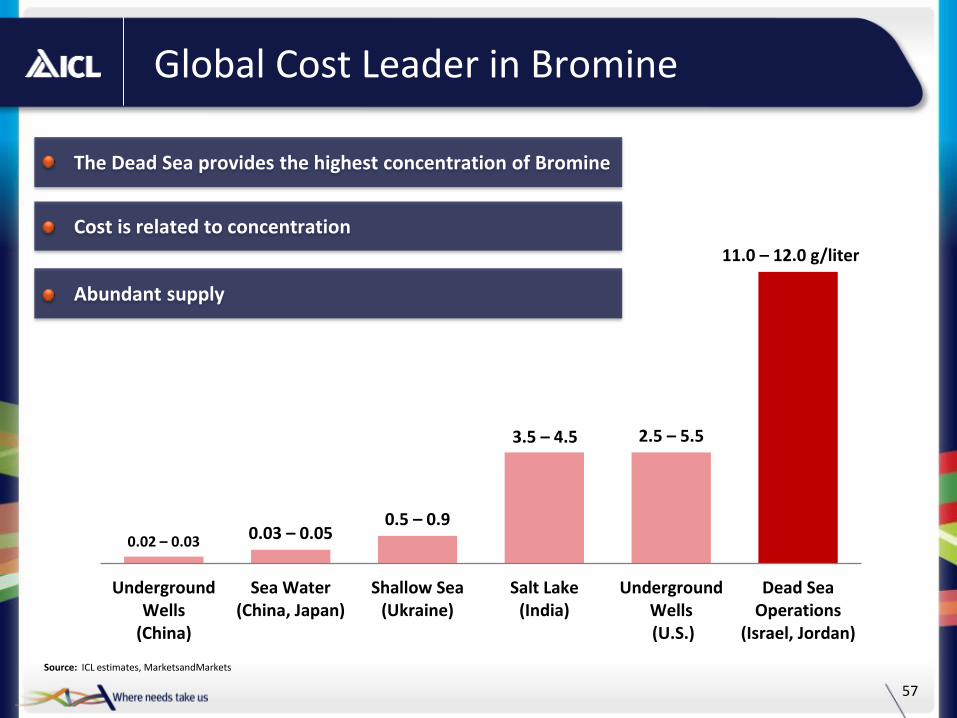
Global Cost Leader in Bromine
57
0.02 – 0.03 0.03 – 0.05 0.5 – 0.9
3.5 – 4.5 2.5 – 5.5
11.0 – 12.0 g/liter
UndergroundWells
(China)
Sea Water(China, Japan)
Shallow Sea(Ukraine)
Salt Lake(India)
UndergroundWells (U.S.)
Dead SeaOperations
(Israel, Jordan)
• The Dead Sea provides the highest concentration of Bromine
• Cost is related to concentration
• Abundant supply
Source: ICL estimates, MarketsandMarkets
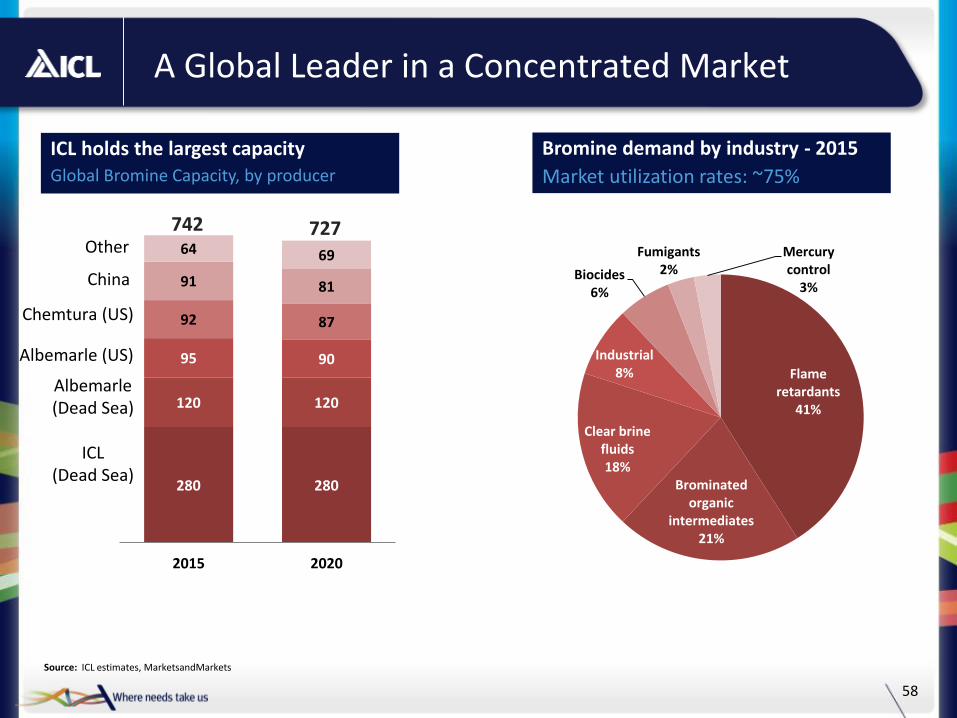
A Global Leader in a Concentrated Market
58
ICL holds the largest capacity Global Bromine Capacity, by producer
280 280
120 120
95 90
92 87
91 81
64 69
2015 2020
Albemarle (Dead Sea)
ICL (Dead Sea)
Other
Albemarle (US)
Chemtura (US)
China
Bromine demand by industry - 2015
Market utilization rates: ~75%
Flame retardants
41%
Brominated organic
intermediates 21%
Clear brine fluids 18%
Industrial 8%
Biocides 6%
Fumigants 2%
Mercury control
3%
742 727
Source: ICL estimates, MarketsandMarkets
1,500
2,000
2,500
3,000
3,500
4,000
59
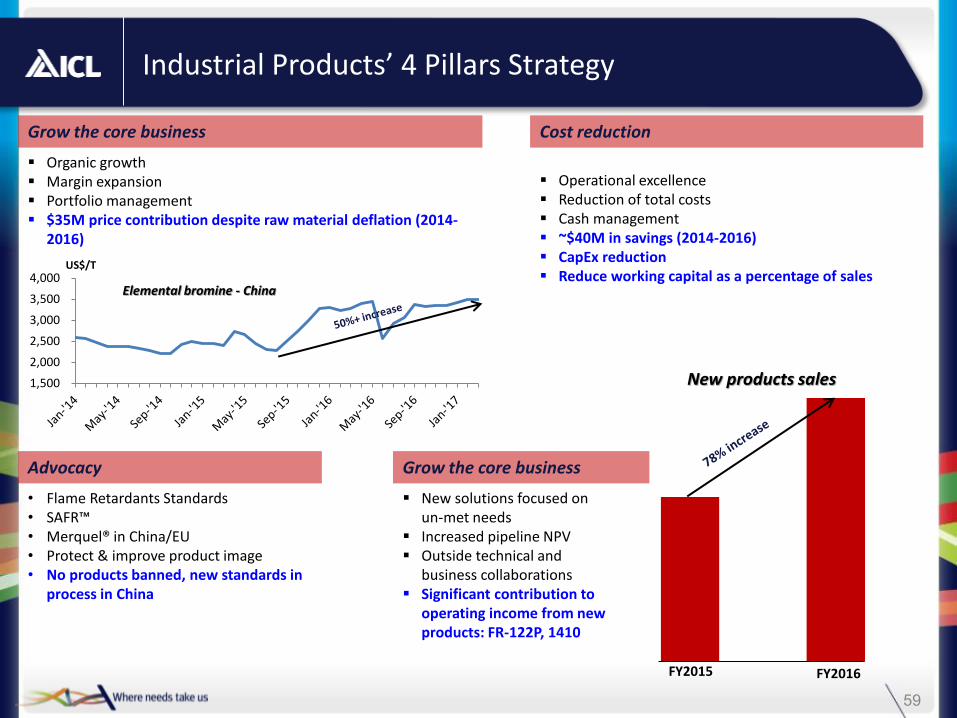
Industrial Products’ 4 Pillars Strategy
Grow the core business
Organic growth Margin expansion Portfolio management $35M price contribution despite raw material deflation (2014-
2016)
US$/T
Elemental bromine - China
Operational excellence Reduction of total costs Cash management ~$40M in savings (2014-2016) CapEx reduction Reduce working capital as a percentage of sales
Cost reduction
• Flame Retardants Standards • SAFR™ • Merquel® in China/EU • Protect & improve product image • No products banned, new standards in
process in China
Advocacy Grow the core business
New solutions focused on un-met needs
Increased pipeline NPV Outside technical and
business collaborations Significant contribution to
operating income from new products: FR-122P, 1410
New products sales
FY2016 FY2015
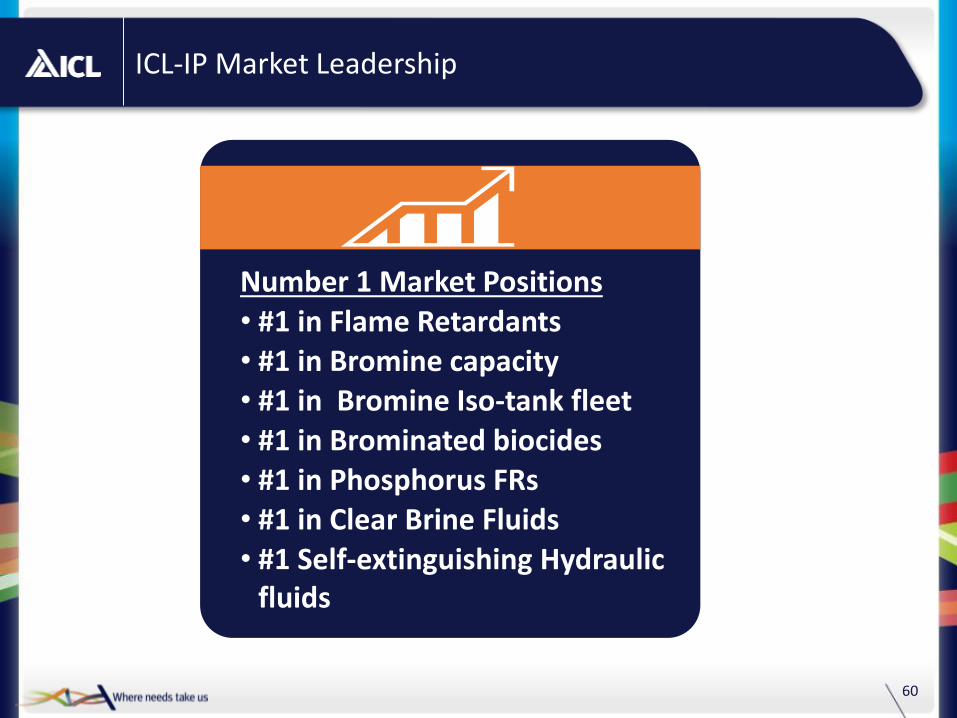
ICL-IP Market Leadership
Number 1 Market Positions • #1 in Flame Retardants • #1 in Bromine capacity • #1 in Bromine Iso-tank fleet • #1 in Brominated biocides • #1 in Phosphorus FRs • #1 in Clear Brine Fluids • #1 Self-extinguishing Hydraulic
fluids
60

Advanced Additives
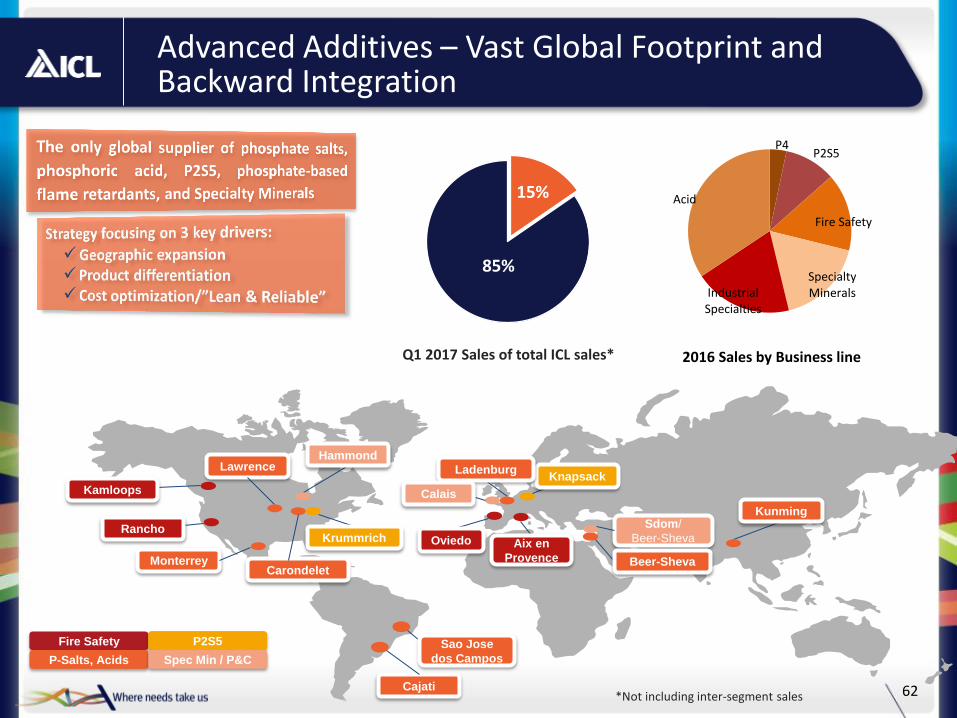
Advanced Additives – Vast Global Footprint and Backward Integration
Kamloops
Rancho Krummrich
Sao Jose
dos Campos
Kunming
Knapsack Lawrence
Carondelet
Aix en
Provence
Oviedo
Sdom/
Beer-Sheva
Monterrey Beer-Sheva
Ladenburg
Calais
Hammond
Cajati 62
Fire Safety
P-Salts, Acids
P2S5
Spec Min / P&C
2016 Sales by Business line Q1 2017 Sales of total ICL sales*
85%
15%
*Not including inter-segment sales
P4 P2S5
Fire Safety
Specialty Minerals Industrial
Specialties
Acid
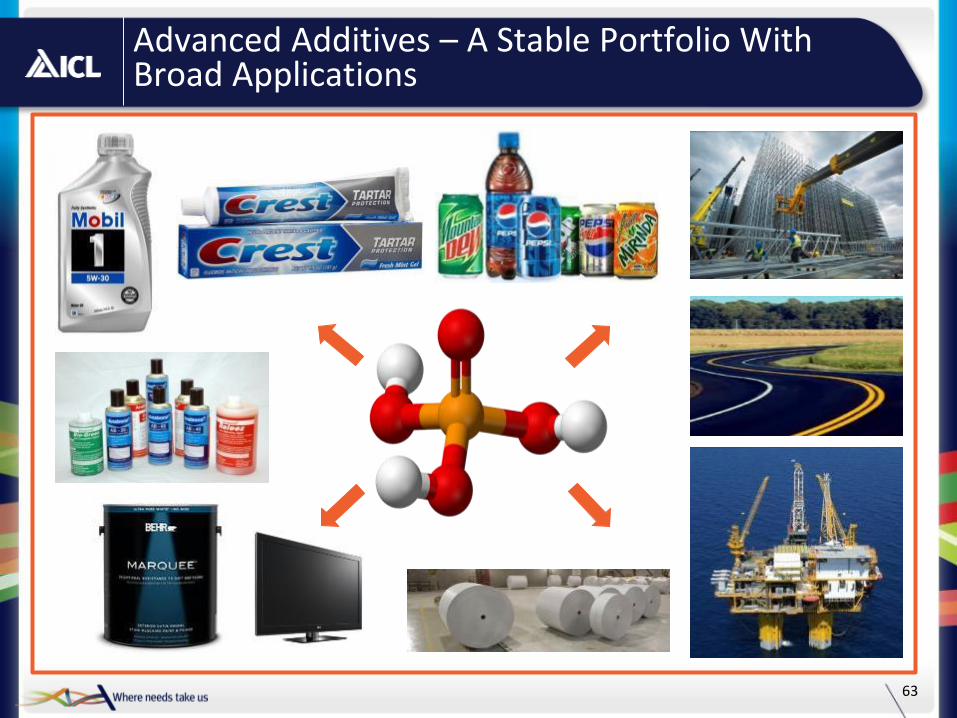
Advanced Additives – A Stable Portfolio With Broad Applications
63
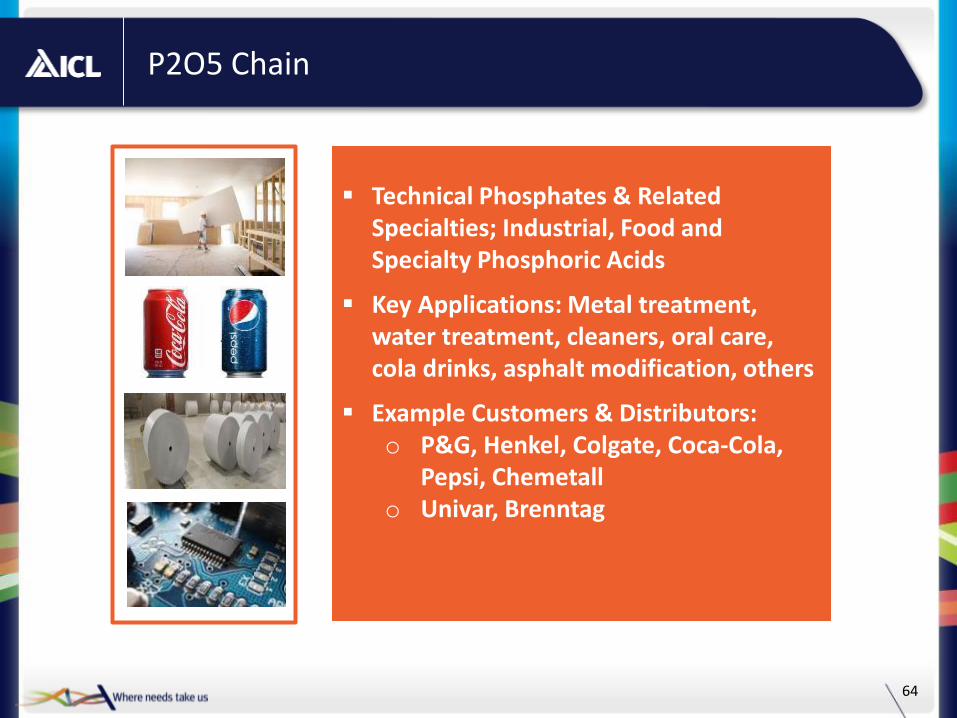
P2O5 Chain
64
Technical Phosphates & Related Specialties; Industrial, Food and Specialty Phosphoric Acids
Key Applications: Metal treatment, water treatment, cleaners, oral care, cola drinks, asphalt modification, others
Example Customers & Distributors: o P&G, Henkel, Colgate, Coca-Cola,
Pepsi, Chemetall o Univar, Brenntag
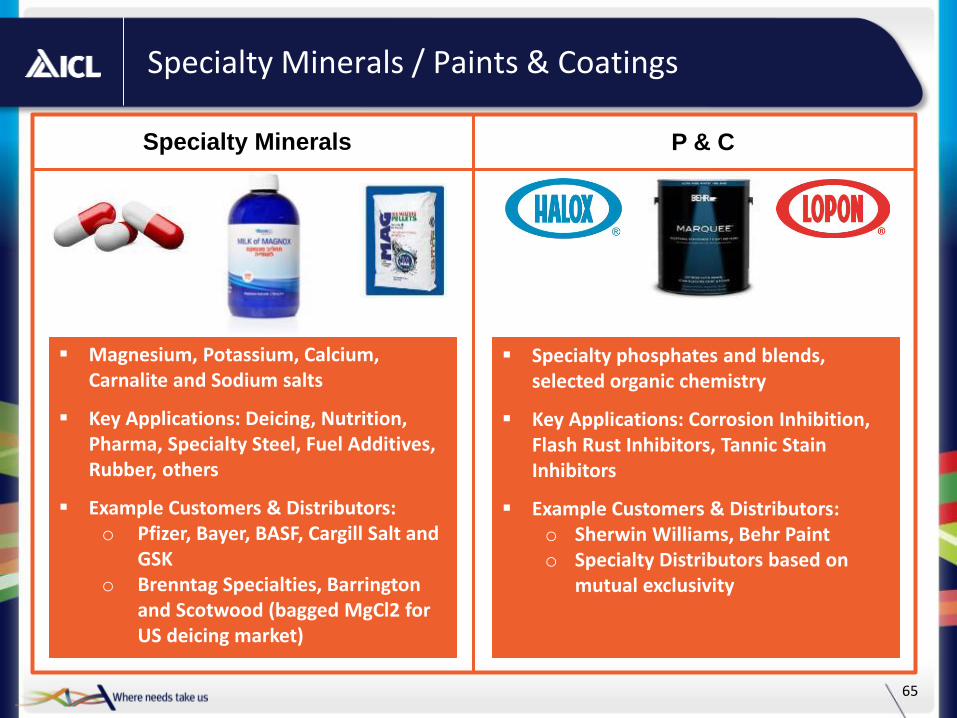
Specialty Minerals / Paints & Coatings
65
Specialty Minerals P & C
Specialty phosphates and blends, selected organic chemistry
Key Applications: Corrosion Inhibition, Flash Rust Inhibitors, Tannic Stain Inhibitors
Example Customers & Distributors: o Sherwin Williams, Behr Paint o Specialty Distributors based on
mutual exclusivity
Magnesium, Potassium, Calcium,
Carnalite and Sodium salts
Key Applications: Deicing, Nutrition, Pharma, Specialty Steel, Fuel Additives, Rubber, others
Example Customers & Distributors: o Pfizer, Bayer, BASF, Cargill Salt and
GSK o Brenntag Specialties, Barrington
and Scotwood (bagged MgCl2 for US deicing market)
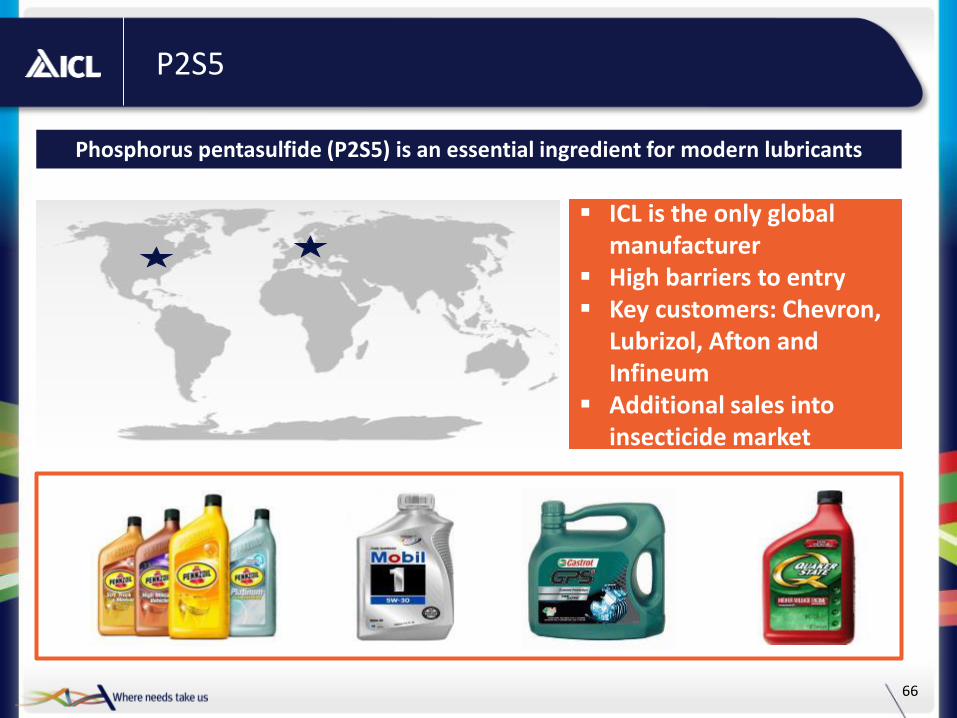
P2S5
66
ICL is the only global manufacturer
High barriers to entry Key customers: Chevron,
Lubrizol, Afton and Infineum
Additional sales into insecticide market
Phosphorus pentasulfide (P2S5) is an essential ingredient for modern lubricants
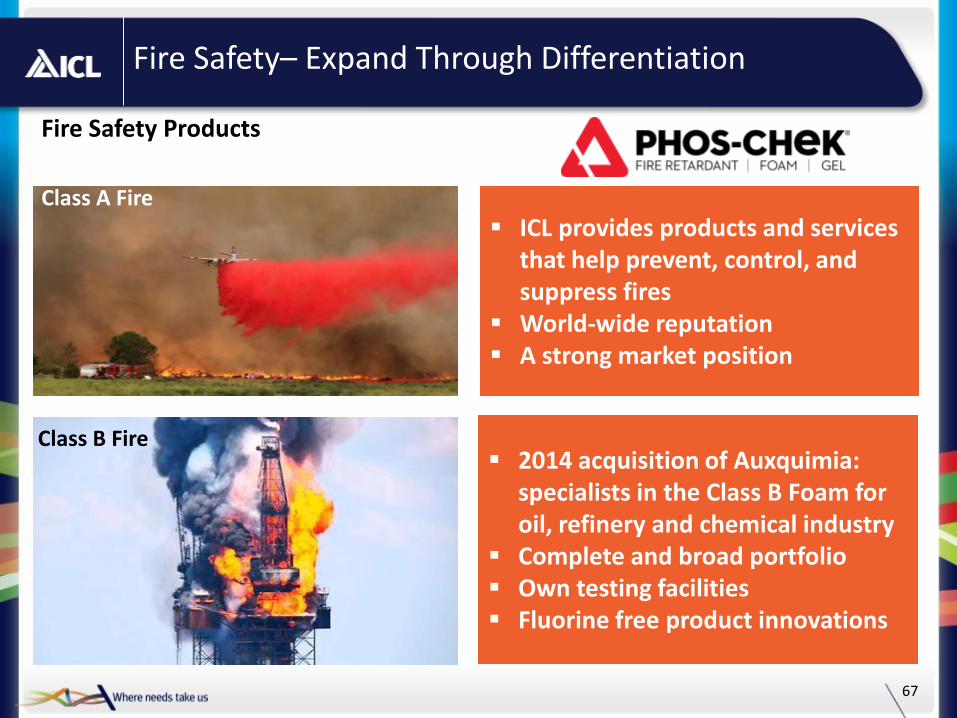
Fire Safety– Expand Through Differentiation
67
Class A Fire
ICL provides products and services that help prevent, control, and suppress fires
World-wide reputation A strong market position
2014 acquisition of Auxquimia: specialists in the Class B Foam for oil, refinery and chemical industry
Complete and broad portfolio Own testing facilities Fluorine free product innovations
Class B Fire
Fire Safety Products
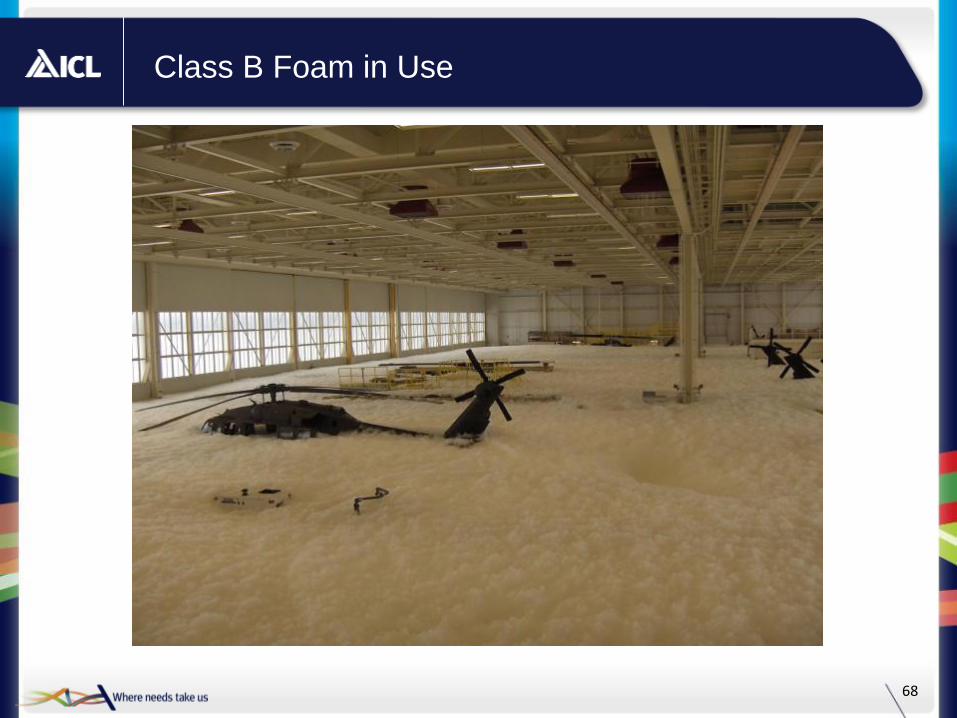
Class B Foam in Use
68

Food Specialties
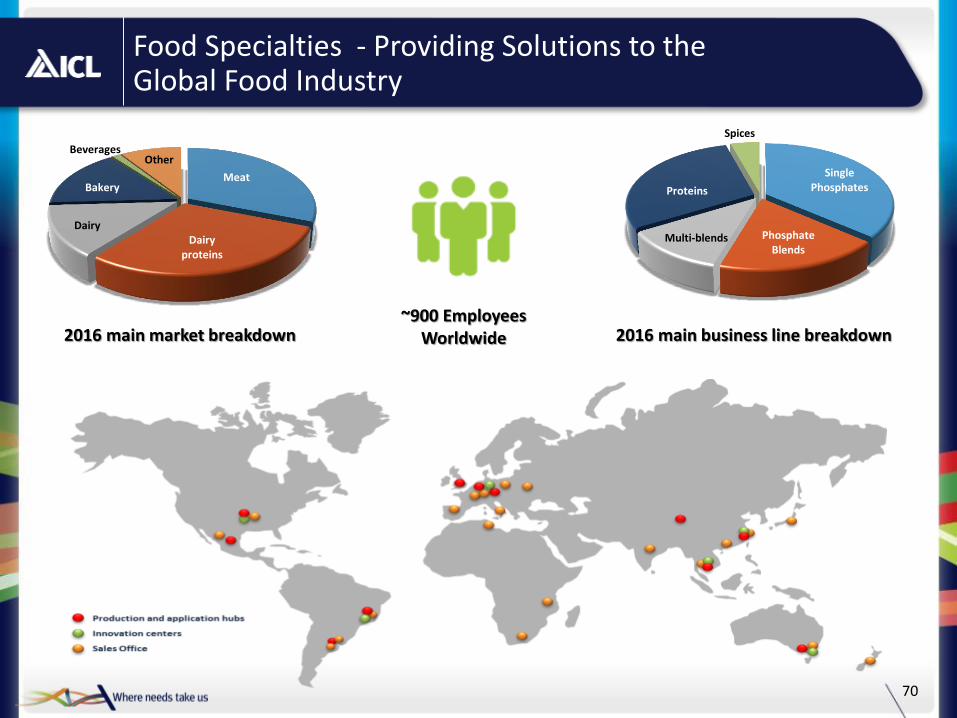
Food Specialties - Providing Solutions to the Global Food Industry
70
Meat
Dairy proteins
Dairy
Bakery
Beverages Other
2016 main market breakdown ~900 Employees
Worldwide 2016 main business line breakdown
Single Phosphates
Phosphate Blends
Multi-blends
Proteins
Spices
71
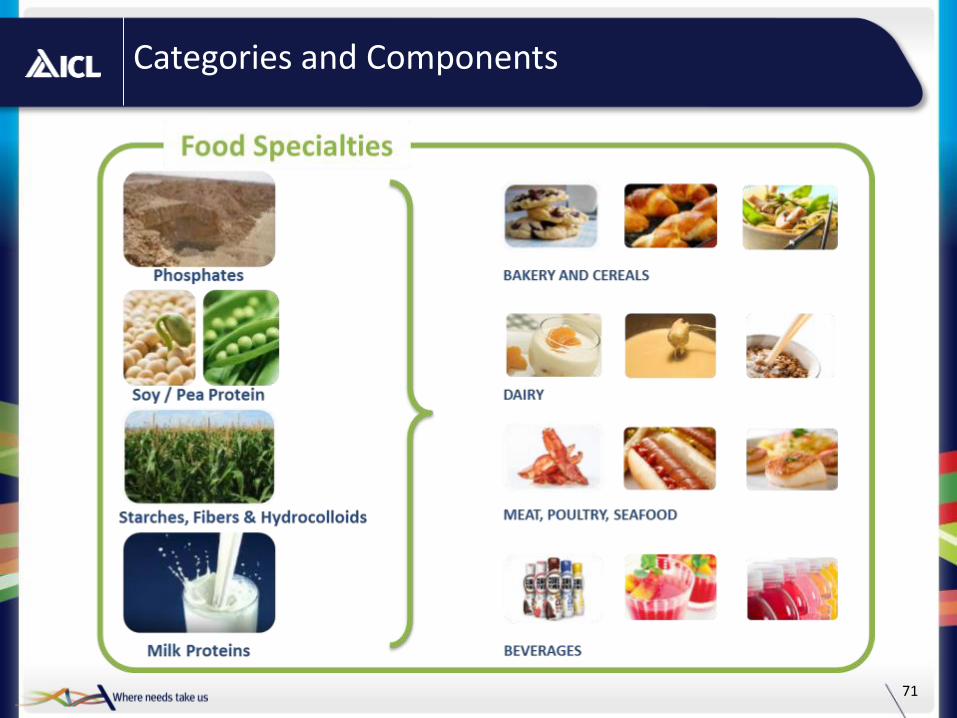
Categories and Components
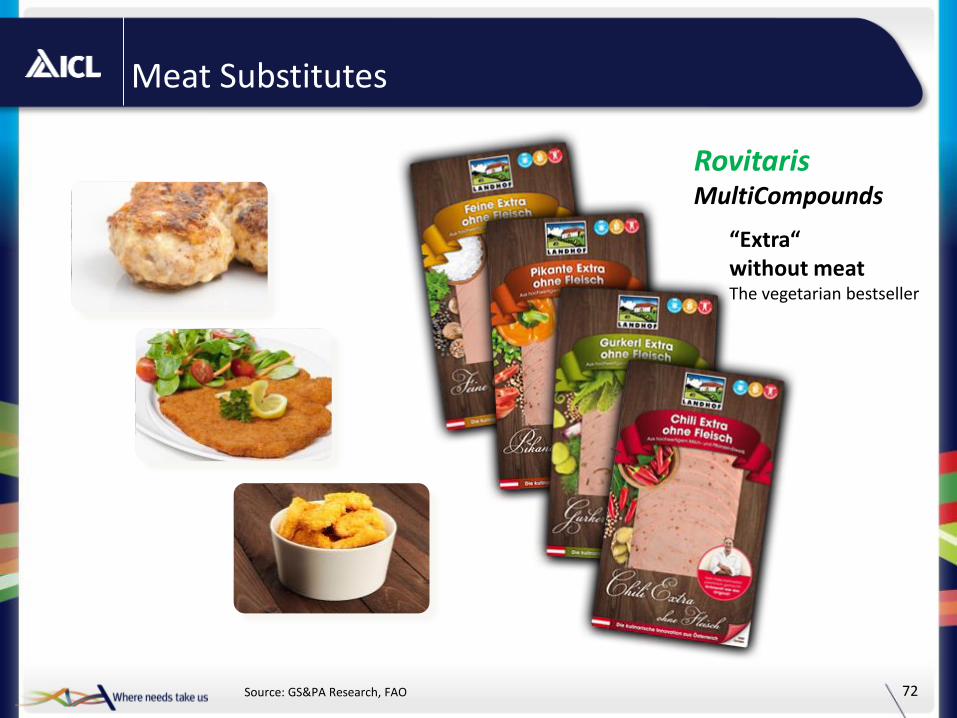
Meat Substitutes
72 Source: GS&PA Research, FAO
“Extra“ without meat The vegetarian bestseller
Rovitaris MultiCompounds
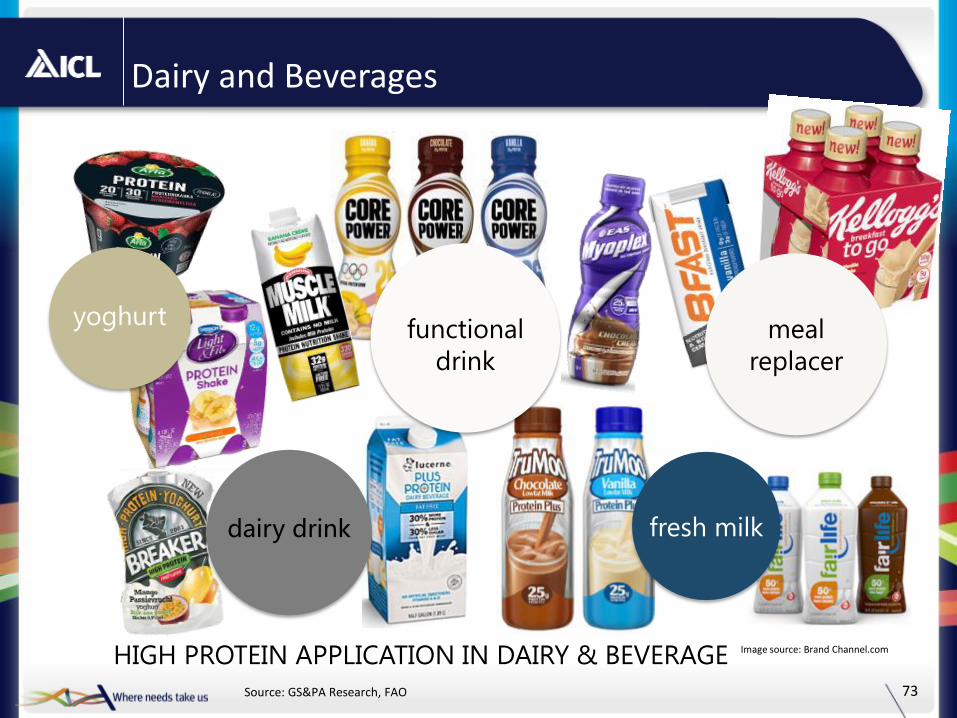
Dairy and Beverages
73 Source: GS&PA Research, FAO
Image source: Brand Channel.com
fresh milk
meal
replacer
yoghurt
dairy drink
functional
drink
HIGH PROTEIN APPLICATION IN DAIRY & BEVERAGE
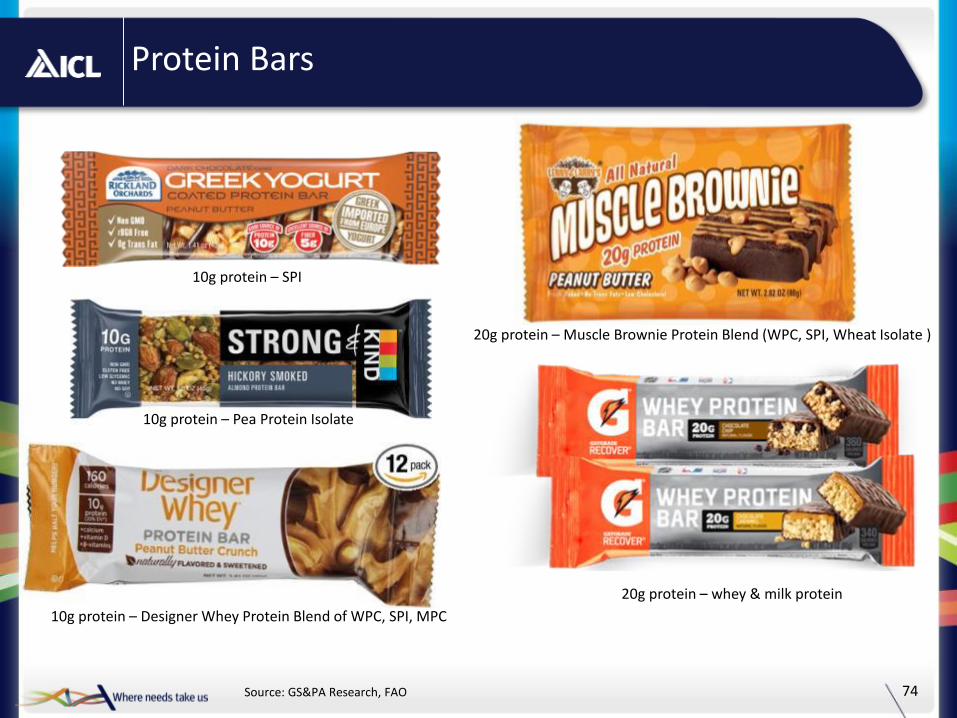
74 Source: GS&PA Research, FAO
10g protein – Designer Whey Protein Blend of WPC, SPI, MPC
10g protein – Pea Protein Isolate
10g protein – SPI
20g protein – Muscle Brownie Protein Blend (WPC, SPI, Wheat Isolate )
20g protein – whey & milk protein
Protein Bars
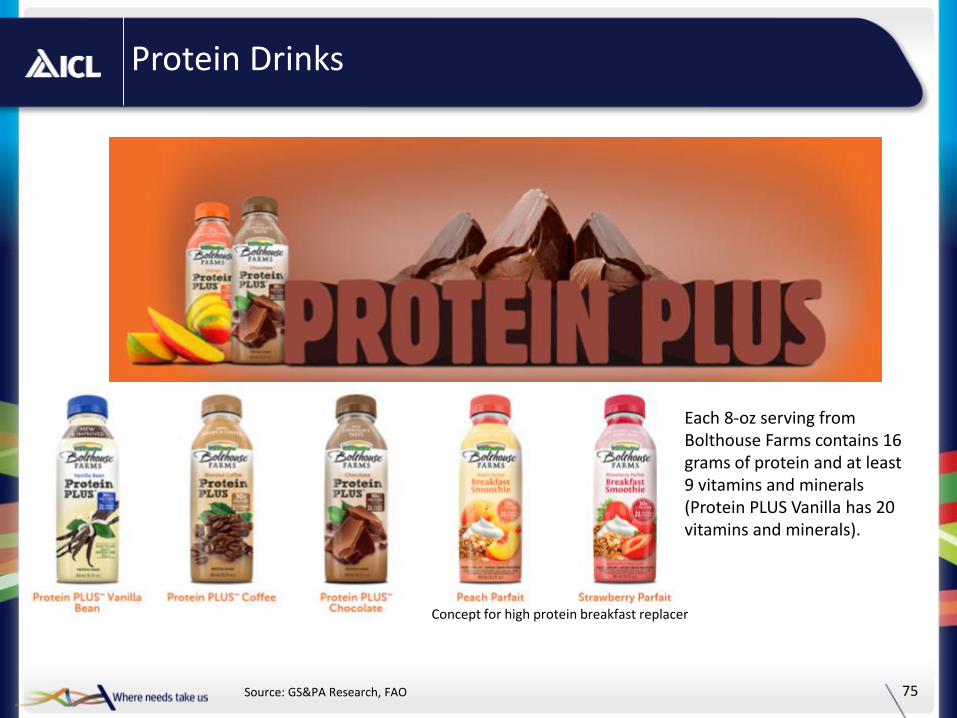
Protein Drinks
75 Source: GS&PA Research, FAO
Each 8-oz serving from Bolthouse Farms contains 16 grams of protein and at least 9 vitamins and minerals (Protein PLUS Vanilla has 20 vitamins and minerals).
Concept for high protein breakfast replacer
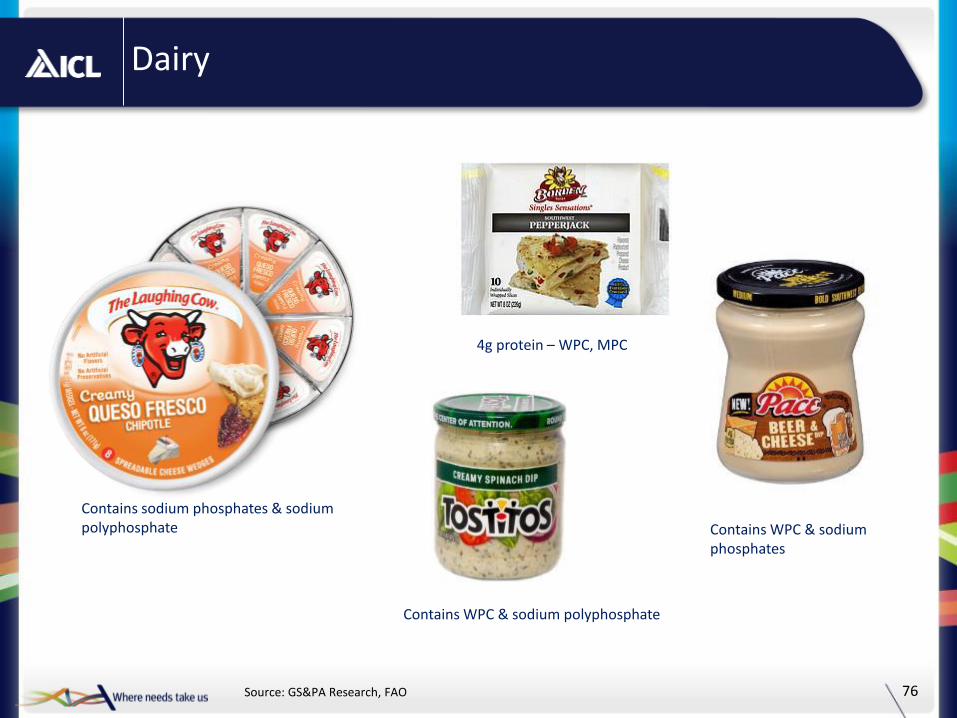
Dairy
76 Source: GS&PA Research, FAO
Contains sodium phosphates & sodium polyphosphate
4g protein – WPC, MPC
Contains WPC & sodium polyphosphate
Contains WPC & sodium phosphates
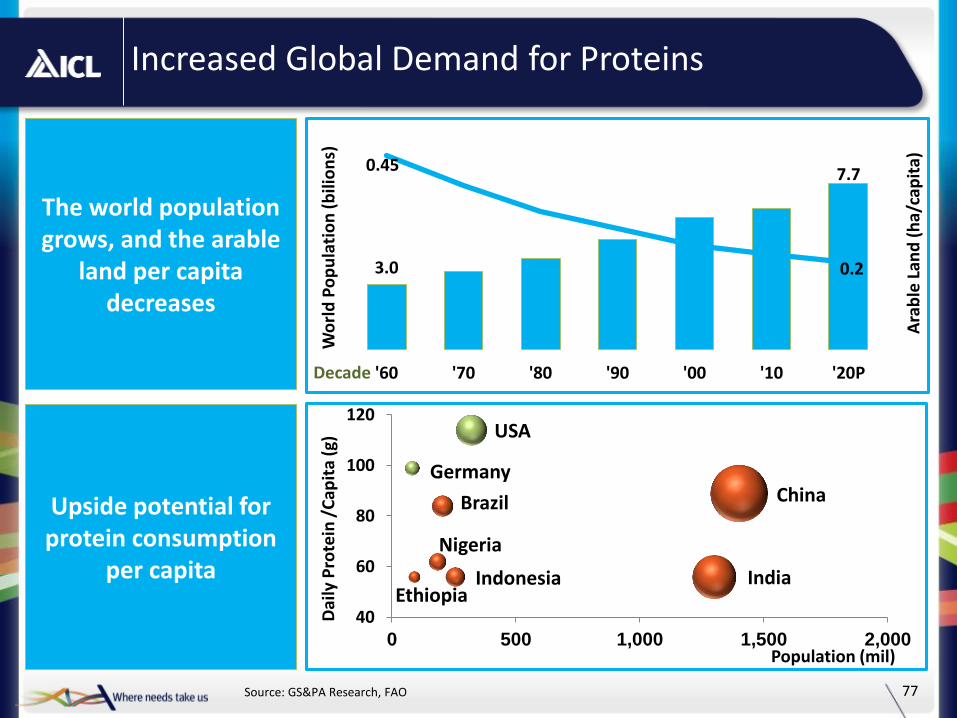
Increased Global Demand for Proteins
77
Upside potential for protein consumption
per capita
Brazil China
Ethiopia
Germany
India Indonesia
Nigeria
USA
40
60
80
100
120
0 500 1,000 1,500 2,000
Dai
ly P
rote
in /
Cap
ita
(g)
Population (mil)
3.0
7.7 0.45
0.2
'60 '70 '80 '90 '00 '10 '20P
Ara
ble
Lan
d (
ha/
cap
ita)
Wo
rld
Po
pu
lati
on
(b
ilio
ns)
The world population grows, and the arable
land per capita decreases
Decade
Source: GS&PA Research, FAO
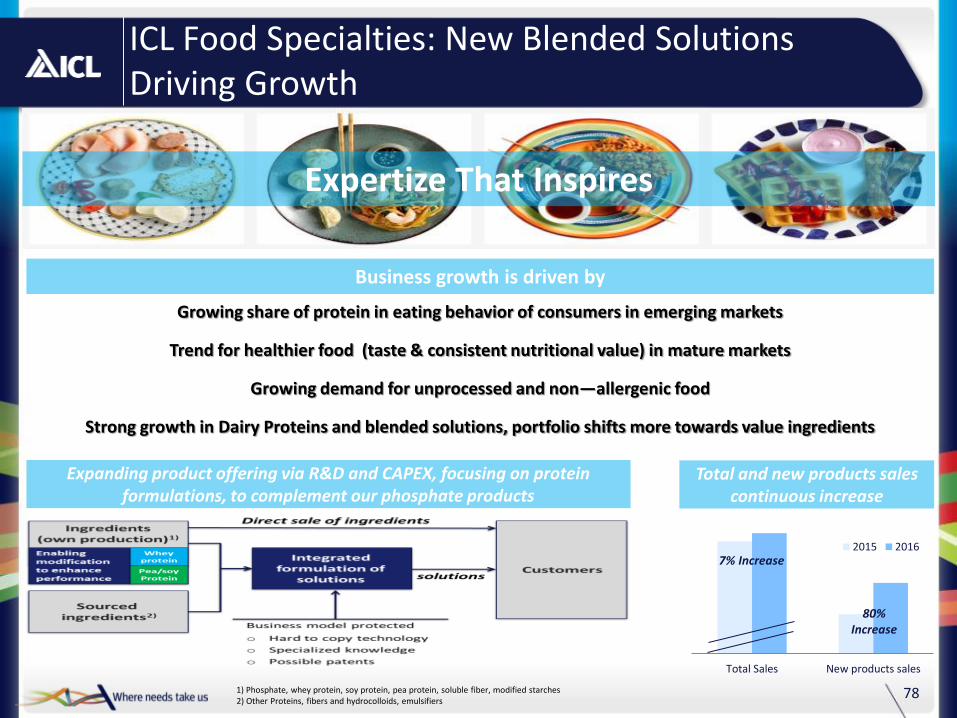
1) Phosphate, whey protein, soy protein, pea protein, soluble fiber, modified starches 2) Other Proteins, fibers and hydrocolloids, emulsifiers
Expanding product offering via R&D and CAPEX, focusing on protein formulations, to complement our phosphate products
Total Sales New products sales
2015 2016
78
ICL Food Specialties: New Blended Solutions Driving Growth
Expertize That Inspires
Total and new products sales continuous increase
80% Increase
7% Increase
Growing share of protein in eating behavior of consumers in emerging markets
Trend for healthier food (taste & consistent nutritional value) in mature markets
Growing demand for unprocessed and non—allergenic food
Strong growth in Dairy Proteins and blended solutions, portfolio shifts more towards value ingredients
Business growth is driven by

Thank you