Embed Size (px)
Citation preview

SOBHA DEVELOPERS LTDSOBHA DEVELOPERS LTD
Investor Presentation – 31stMarch 2012

SOBHA – HIGHLIGHTS OF THE YEAR
ExecutionCompleted over 50 mn. sqft of developable area comprising of 288 number of projects in both Real Estate and Contracts, since inception.
New Launches Launched 10.45 mn.sft of new projects in 6 cities – a record.
Sales Value New sales of Rs.17.01 Billion in value -the best so far.
Brought down the D/E ratio of 0.52 on standalone basis and 0.57 on a consolidated
22 SOBHA
D/E RatioBrought down the D/E ratio of 0.52 on standalone basis and 0.57 on a consolidated basis - the lowest ever.
PBT Achieved Profit Before Tax of Rs.3.18 Billion on a consolidated basis - highest ever.
NETWORTH Net worth of Rs.20 Billion
Customers Crossed more than 10,000 customers base.

PERFORMANCE HIGHLIGHTS FY-2012
� Sold 3.28 mn sq.ft new sales, up by 18%
� Recorded new sales value of Rs.17.01 Billion, up by 50%
� Average price realization has improved to Rs.5,181/ sqft from Rs.4,082 / sq.ft, up by 27%
� Consolidated revenue of Rs.14.14 Billion in FY-12 as against Rs.14 Billion in FY 11.
� Unbilled revenue of Rs.11.14 Billion as on 31st Mar-12 from Real Estate
� Consolidated EBITDA of Rs.4.73 Billion during FY-12 as against Rs.3.65 Billion in FY -11, up by 30%
SALES
REVENUE
33 SOBHA
� Consolidated EBITDA of Rs.4.73 Billion during FY-12 as against Rs.3.65 Billion in FY -11, up by 30%
� Consolidated EBITDA margin of 33%
� Consolidated PBT of Rs.3.18 Billion during FY-12 as against Rs.2.51 Billion in FY-11. Highest ever in the history. Up by 26% yr on yr
� Consolidated PBT margin of 22%
� Consolidated PAT (after minority interest) of Rs.2.06 Billion during FY-12 as against Rs.1.81 Billion in FY-11. Up by 14 % yr on yr
� Consolidated PAT (after minority interest) margin of 15%
EBITDA
PBT
PAT
PERFORMANCE HIGHLIGHTS FY-2012
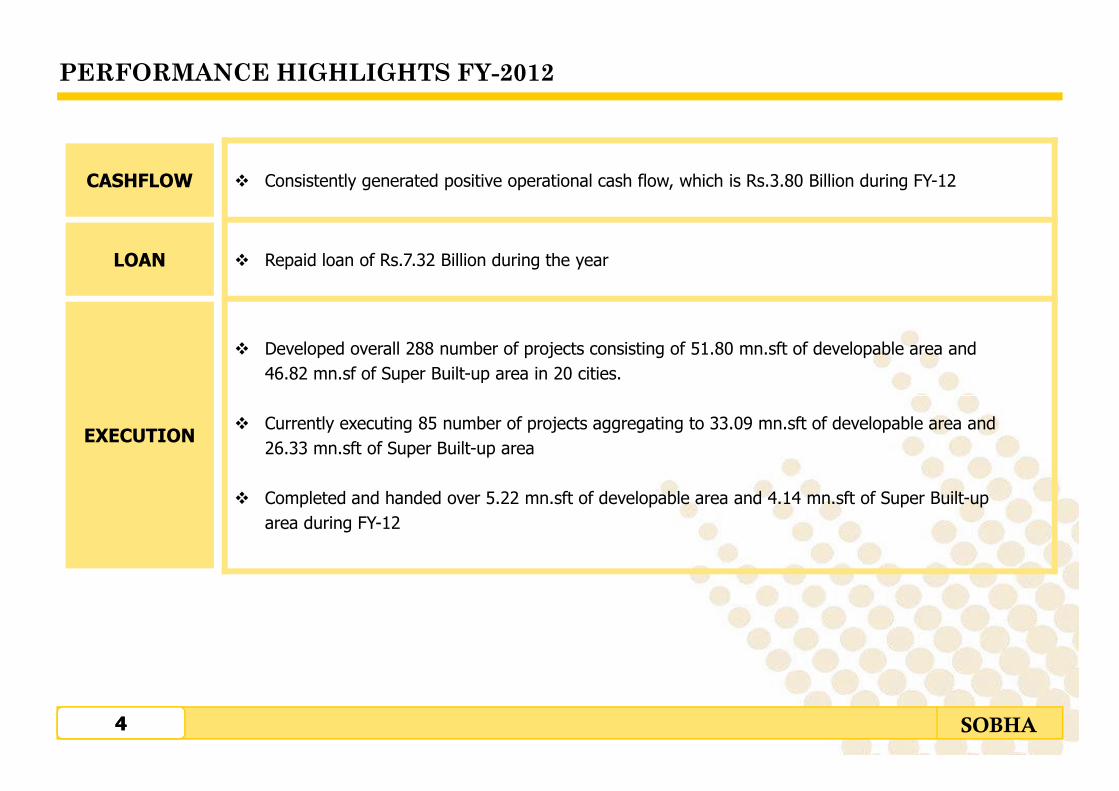
� Consistently generated positive operational cash flow, which is Rs.3.80 Billion during FY-12
� Repaid loan of Rs.7.32 Billion during the year
� Developed overall 288 number of projects consisting of 51.80 mn.sft of developable area and
46.82 mn.sf of Super Built-up area in 20 cities.
CASHFLOW
LOAN
44 SOBHA
� Currently executing 85 number of projects aggregating to 33.09 mn.sft of developable area and
26.33 mn.sft of Super Built-up area
� Completed and handed over 5.22 mn.sft of developable area and 4.14 mn.sft of Super Built-up
area during FY-12
EXECUTION
PERFORMANCE HIGHLIGHTS Q4-2012
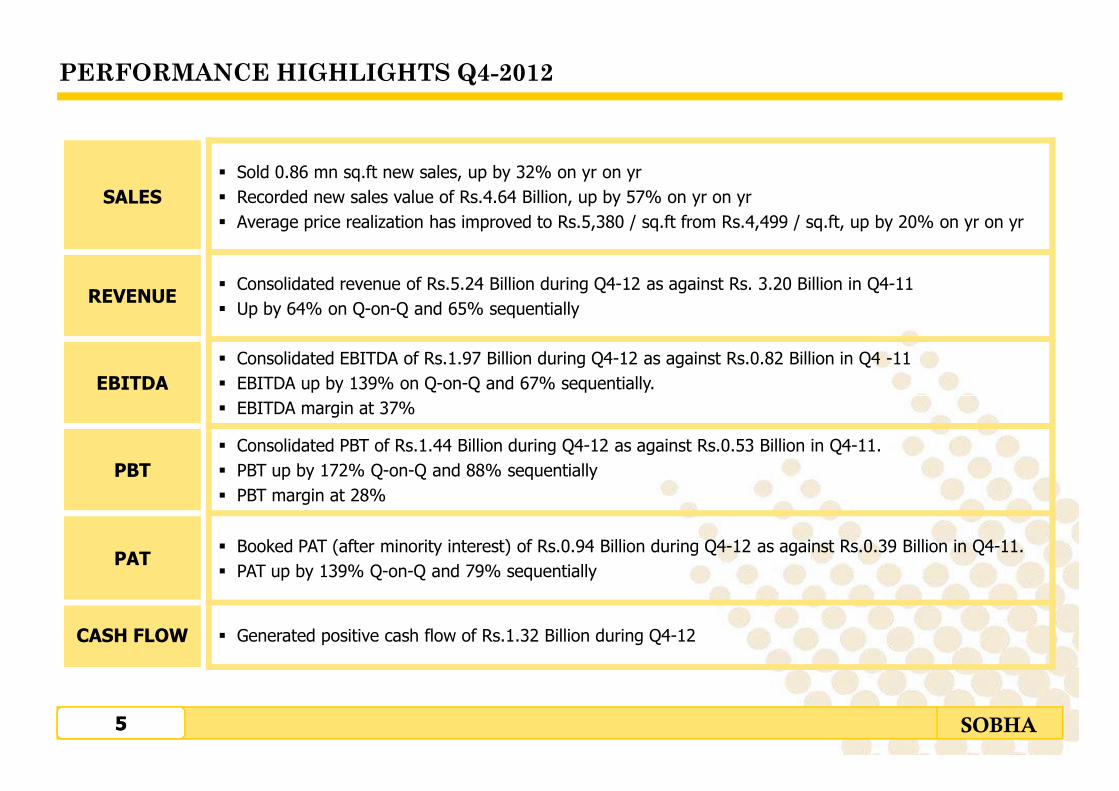
� Sold 0.86 mn sq.ft new sales, up by 32% on yr on yr
� Recorded new sales value of Rs.4.64 Billion, up by 57% on yr on yr
� Average price realization has improved to Rs.5,380 / sq.ft from Rs.4,499 / sq.ft, up by 20% on yr on yr
� Consolidated revenue of Rs.5.24 Billion during Q4-12 as against Rs. 3.20 Billion in Q4-11
� Up by 64% on Q-on-Q and 65% sequentially
� Consolidated EBITDA of Rs.1.97 Billion during Q4-12 as against Rs.0.82 Billion in Q4 -11
� EBITDA up by 139% on Q-on-Q and 67% sequentially.
SALES
REVENUE
EBITDA
55 SOBHA
� EBITDA margin at 37%
� Consolidated PBT of Rs.1.44 Billion during Q4-12 as against Rs.0.53 Billion in Q4-11.
� PBT up by 172% Q-on-Q and 88% sequentially
� PBT margin at 28%
� Booked PAT (after minority interest) of Rs.0.94 Billion during Q4-12 as against Rs.0.39 Billion in Q4-11.
� PAT up by 139% Q-on-Q and 79% sequentially
� Generated positive cash flow of Rs.1.32 Billion during Q4-12
PBT
PAT
CASH FLOW

SALES PERFORMANCE
Locations- FY 12 FY 11 FY 10 FY 09
Bangalore 2,259,337 2,113,836 1,356,744 327,758
NCR (Gurgaon) 322,767 - - -
Chennai 85,213 - - -
Pune 128,709 145,926 104,839 310,317
Thrissur 304,373 382,305 266,871 47,156
Coimbatore 90,988 134,748 351,959 190,886
Mysore 92,823 - - -
Real Estate Sales
66 SOBHA
Mysore 92,823 - - -
TOTAL 3,284,209 2,776,814 2,080,413 876,117
CAGR growth of 55.4%
Average Price Realization
(` per sqft)5,181 4,082 2,647 2,966
Sales Value (Rs.in Billion)
17.01 11.33 5.51 2.60
CAGR growth of 87.1%

IMPROVED SALES PERFORMANCE
3,858 3,684
4,327 4,499 4,551
5,188 5,475 5,380
1.20
1.60
2.00
4,000
5,000
6,000
~ Average volume of 0. 82 mn.sft
Improved sales volume & Average price realization irrespective of adverse macro environment
Avg price realization ` 4,082 /sft
Avg price realization ` 5,181 /sft
77 SOBHA
0.67 0.74 0.71 0.66 0.67
0.94 0.82 0.86
-
0.40
0.80
Q1-11 Q2-11 Q3-11 Q4-11 Q1-12 Q2-12 Q3-12 Q4-12
-
1,000
2,000
3,000~ Average volume of 0.69 mn.sft
FY 2010 -11 FY 2011 - 12

REAL ESTATE - SNAPSHOT
Completed Projects
� 79 Projects aggregating to 20.47 mn.sft of Super Built-up area
� Total area developed * was 25.45 mn.sft
Ongoing Projects
� 38 Projects aggregating to 16.28 mn.sft of Super Built-up area
88 SOBHA
� Total developable* area of 23.04 mn.sft under progress
Forthcoming Projects
� 11 Projects aggregating to ~5.87 mn.sft of Super Built-up area
� Total developable area of ~7.67 mn.sft
* Developed / Developable area includes super built-up area (SBA) sold to the customer plus common area, car parking area, service area, storage area, internal Roads and common amenities

REAL ESTATE - OVERVIEW
� PAN India presence across 7 cities – Bangalore, NCR (Gurgaon), Chennai, Pune, Thrissur, Coimbatore & Mysore
� Product mix includes Multi Storied Apartments (Dreams, Luxury, Super Luxury & Presidential category), Row Houses, Super Luxury Villas and Plotted Developments.
Developed Area : 25.45 mn.sftSuper Built-up area : 20.47 mn.sft
Developable Area : 23.04 mn.sftSuper Built-up area : 16.28 mn.sft
Completed Ongoing
99 SOBHA
Are
a i
n M
n.s
ft
Are
a in
Mn
.sft
Developed / Developable Area Super Built-up area
Gurgaon Pune Coimbatore

REAL ESTATE – FUTURE LAUNCHES
Proposed new launches in next 4 quarters
Sl.No Projects Location TypeSITE Area (in Acres)
~Total SBA (sft)
Sobha share of SBA (sft)
BANGALORE
1 Dairy Circle Property Bannerghatta RoadResidential + Commercial
3.50 436,000 218,000
2 Hosakerehalli Property Hosakerehalli, Mysore Road L+SL Apartments 15.70 1,709,730 1,360,161
3 City Property Minerva Mills, GopalapuraResidential + Commercial
11.37 1,635,600 899,580
4 Hirandahalli Property Off Old Madras Road Villas + Apartments 22.5 453,069 289,964
5 Hosahalli Property Kanakapura Road Residential 3.48 471,479 471,479
1010 SOBHA
5 Hosahalli Property Kanakapura Road Residential 3.48 471,479 471,479
6 St.Mark’s Road Property St.Mark’s Road Commercial 1.84 192,093 96,047
Coimbatore
7 Harishree Gardens – 5 Veerakeralam Super Luxury Villas 10.88 147,715 147,715
Thrissur
8 Sobha Jade Thrissur, Kerala SL Apartments 3.15 495,383 495,383
9 Sobha City-Commercial 2 Thrissur, Kerala Office + Hotel Space 3.36 191,309 191,309
Mysore
10 Nadanahalli property Nadanahalli Plotted Development 6.20 135,036 135,036
TOTAL 81.98 5,867,415 4,304,674
Note: Area details are subject to change

BUYERS PROFILE
Business /
Medical /
Pharmaceuticals
, 4%
IT / ITES
Professionals,
39%
Other
Professionals,
44%
Others, 4%Bank Funding Position
Note: The funding position is considered for cumulative sales period from January-11 to December-11.
Customers applied for Bank Loan 45%
Self Funding 55%
Profession-wise breakup
1111 SOBHA
Business /
Entrepreneurs,
9%
, 4%
Note:
1) Other Professionals includes Manufacturing, Financial Services, Hospitality, Media, Telecom etc
2) Others includes House wives, Agriculturist, Retired, Govt. Employees etc.

PRICE BAND CATEGORY - RESIDENTIAL
Particulars Area in Mn.sft No. of units
Total area sold 3.28 1,605
Less: 1BHK units & Commercial space sold (0.05) (29)
Net residential area sold 3.23 1,576
Category SBA (Mn.sft) Percentage No of units Percentage
1212 SOBHA
50-75 lakhs 0.74 23% 438 28%
75 lakhs to 1cr 1.27 39% 711 45%
1 cr to 2 crs 0.71 22% 305 19%
Above 2 crs 0.51 16% 122 8%
Grand Total 3.23 100% 1,576 100%
CONTRACTS – SNAPSHOT
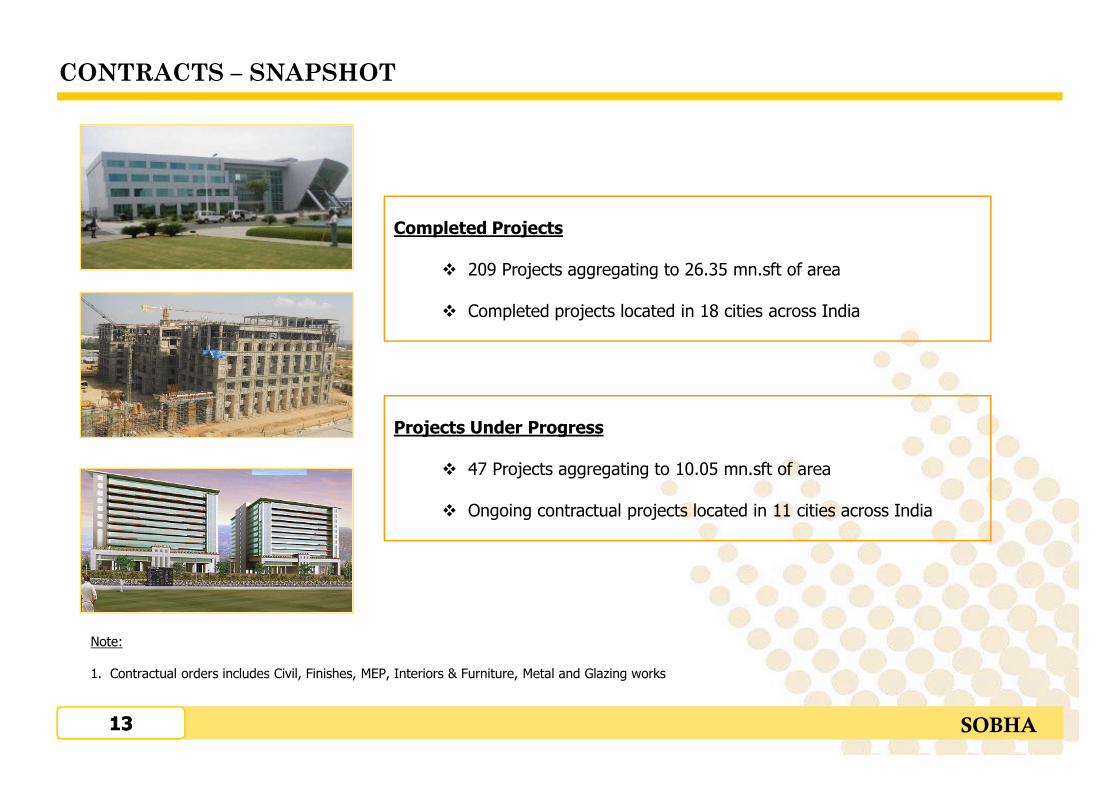
Completed Projects
� 209 Projects aggregating to 26.35 mn.sft of area
� Completed projects located in 18 cities across India
1313 SOBHA
Projects Under Progress
� 47 Projects aggregating to 10.05 mn.sft of area
� Ongoing contractual projects located in 11 cities across India
Note:
1. Contractual orders includes Civil, Finishes, MEP, Interiors & Furniture, Metal and Glazing works

CONTRACTS – OVERVIEW
NCR
Chandigarh
Punchkula (Haryana)
Roorkee (Uttarkhand)
Jaipur
Baadi (H.P)
Contractual Projects - Presence across 21 cities and 11 states
23.07
1.27
2.01
Completed Projects (26.35 mn.sft)
Ongoing Projects (10.05 mn.sft)
1414 SOBHA
Bangalore
Pune
ThrissurCoimbatore
Chennai
Mysore
Kolkata
Bhubaneshwar
Ooty
Trivendrum
Calicut
Hyderabad
Mangalore
Mumbai
Salem • Corporate Clients includes Dell, HP, Timken, Taj, Bayer Material Science, HCL, Bharat Forge, ITC, Biocon, IPE, Bosch, GMR, Hotel Leela Ventures etc
•Other Clients includes Ragsons Electronics, Vakil Housing, Sterling Mac Hotels, Shanthi Hospital, FAME school, Gold Plus Glass Industries and many other Private bunglows.
1.31
1.16
7.58
Infosys
Corporate Clients
Other Clients

CONTRACTS – PROJECTS BREAK-UP
Contractual Projects status as on 31st March-12
S.NO DESCRIPTIONPROJECTS UNDER PROGRESS
No of Projects SBA (Sft )
1 Bangalore 14 2,103,268
2 Hyderabad 10 2,142,888
3 Mysore 4 2,210,834
4 Chennai 6 1,186,480
5 Pune 3 1,119,032
6 Mangalore 5 861,485
1515 SOBHA
Note: • The scope of work varies from Civil, Finishes, MEP, Interiors to Glazing• The Order book value of projects under progress is about Rs. 6.07 Billion
6 Mangalore 5 861,485
7 Coimbatore 1 250,000
8 Salem 1 120,000
9 Trivendrum 1 13,132
10 Ooty 1 13,106
11 Gurgaon, Noida 1 28,583
TOTAL 47 10,048,808
EXECUTION TRACK RECORD
18.72
23.88
33.11
38.99
46.57
51.80
30
40
50
60
70
46.82
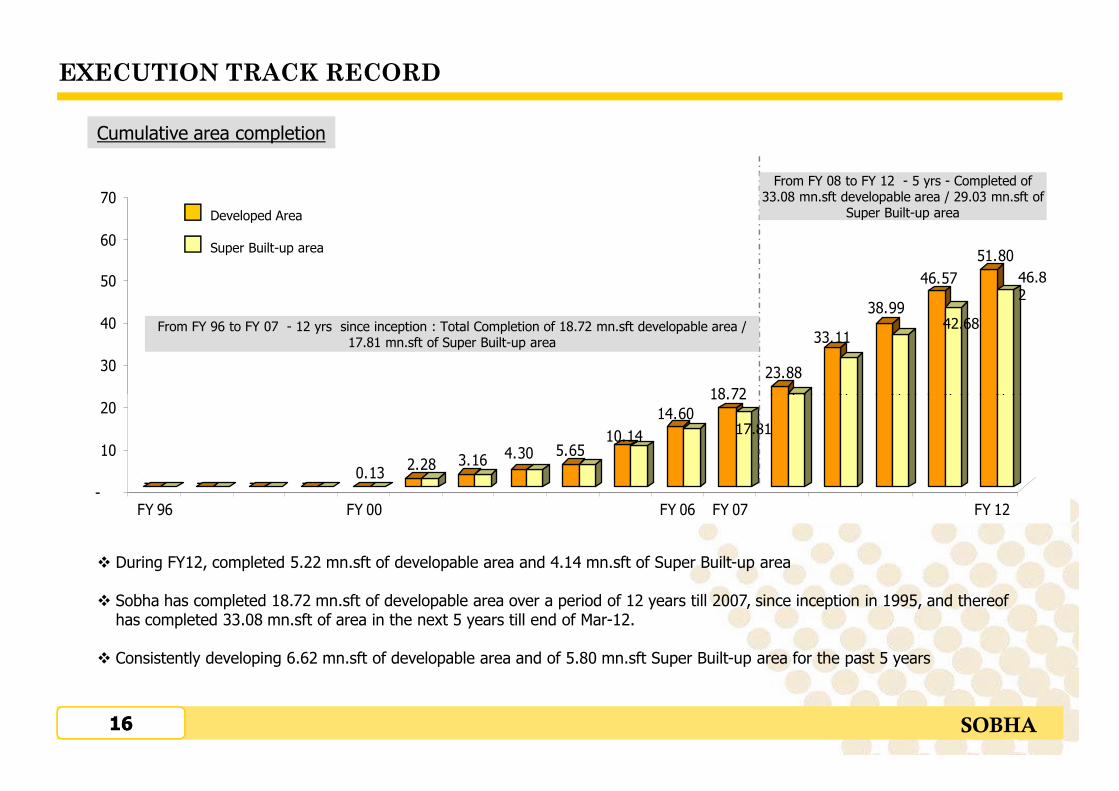
42.68From FY 96 to FY 07 - 12 yrs since inception : Total Completion of 18.72 mn.sft developable area / 17.81 mn.sft of Super Built-up area
From FY 08 to FY 12 - 5 yrs - Completed of 33.08 mn.sft developable area / 29.03 mn.sft of
Super Built-up areaDeveloped Area
Super Built-up area
Cumulative area completion
1616 SOBHA
- - - -0.13
2.28 3.16 4.30 5.6510.14
14.60
18.72
-
10
20
FY 96 FY 00 FY 06 FY 07 FY 12
17.81
� During FY12, completed 5.22 mn.sft of developable area and 4.14 mn.sft of Super Built-up area
� Sobha has completed 18.72 mn.sft of developable area over a period of 12 years till 2007, since inception in 1995, and thereof has completed 33.08 mn.sft of area in the next 5 years till end of Mar-12.
� Consistently developing 6.62 mn.sft of developable area and of 5.80 mn.sft Super Built-up area for the past 5 years

OPERATIONAL CASHFLOW – REAL ESTATE
DescriptionOngoing Projects
Completed Projects
UOM
Total Super Built-up area 16.28 5.43 Mn.sft
Sobha share of Saleable area 14.09 5.19 Mn.sft
Total area sold till 31st March-12 4.39 5.10 Mn.sft
Unsold area 9.70 0.09 Mn.sft
Real Estate Projected Cash flow status as on 31st March-12
1717 SOBHA
Balance construction cost to be spent to complete the entire developments 39,596 432 Rs.Mns
Outstanding receivables + Balance to be billed and collected on sold units 12,896 755 Rs.Mns
Sales value of unsold stock 62,776 451 Rs.Mns
Positive cash flow expected 36,076 774 Rs.Mns
Total Cash flow available from the Real Estate projects 36,850 Rs.Mns

FINANCIAL SNAPSHOT (Consolidated)
9,888
11,337
13,996 14,144
-
2,000
4,000
6,000
8,000
10,000
12,000
14,000
16,000
FY 08-09 FY 09-10 FY 10-11 FY 11-12
Rs. M
illio
ns
2,9362,674
3,652
4,730
-
1,000
2,000
3,000
4,000
5,000
FY 08-09 FY 09-10 FY 10-11 FY 11-12
Rs.M
illi
on
s
REVENUE EBITDA
1818 SOBHA
1,501 1,658
2,514
3,177
-
500
1,000
1,500
2,000
2,500
3,000
3,500
FY 08-09 FY 09-10 FY 10-11 FY 11-12
Rs
.Mil
lio
ns
1,077
1,341
1,813
2,060
-
500
1,000
1,500
2,000
2,500
FY 08-09 FY 09-10 FY 10-11 FY 11-12R
s.M
illi
on
s
PROFIT AFTER TAXPROFIT BEFORE TAX

FINANCIAL SNAPSHOT
1.72
0.800.64 0.57
-
0.40
0.80
1.20
1.60
2.00
D/E Ratio - ConsolidatedD/E Ratio - Standalone
1.72
0.800.64
0.52
-
0.40
0.80
1.20
1.60
2.00
1919 SOBHA
-FY 08-09 FY 09-10 FY 10-11 FY 11-12
Net Worth : Rs. 20.00 Billion
Debt (net) : Rs. 11.44 Billion
D/E ratio : 0.57
Net Worth : Rs. 20.00 Billion
Debt (net) : Rs. 10.35 Billion
D/E ratio : 0.52
-FY 08-09 FY 09-10 FY 10-11 FY 11-12

BALANCE SHEET (Consolidated)
Rs.in Millions
31-Mar-12 31-Mar-11
EQUITY AND LIABILITIES
Shareholders’ funds
Share capital 980.64 980.64
Reserves and surplus 19,016.87 17,527.19
19,997.51 18,507.83
Minority Interest 355.32 324.02
Non-current liabilities
Long Term Borrowings 244.40 20.70
Deferred Tax Liability (net) 330.37 -
Trade Payables 177.62 177.62
Long term provisions 20.68 25.72
773.07 224.04
31-Mar-12 31-Mar-11
ASSETS
Non-current assets
Fixed assets
Tangible assets 2,739.60 1,366.50
Intangible assets 57.93 6.27
Goodwill on consolidation 42.01 -
Capital work-in-progress 12.75 646.51
Non-current investments 0.28 27.16
Deferred tax assets (net) - 73.79
Long-term loans and advances 5,501.94 4,581.72
Inventories 13.50 19.69
2020 SOBHA
773.07 224.04
Current liabilities
Short term borrowings 1,973.38 3,251.17
Trade Payables 3,798.21 3,263.53
Other current liabilities 14,109.38 12,460.16
Short term provisions 1,365.52 915.79
21,246.49 19,890.65
Total 42,372.39 38,946.54
Trade receivables 51.25 25.51
Other non-current assets 101.85 58.33
8,521.11 6,805.48
Current assets
Current investments - 9.95
Inventories 16,745.94 10,664.89
Trade receivables 1,128.63 1,055.85
Cash and bank balances 587.56 230.13
Short-term loans and advances 12,766.52 17,009.99
Other current assets 2,622.63 3,170.25
33,851.28 32,141.06
TOTAL 42,372.39 38,946.54

PROFIT AND LOSS STATEMENT (Consolidated)
Rs. in Millions
Particulars Q4-12 Q4-11 Q3-12 FY 12 FY 11% of
Growth
% of Growth
Q4-12 on
Q3-12
FY 12 on
FY-11
Property Development 3,923 2,129 2,260 10,338 10,763 84% 74% (4%)
Contractual + Manufacturing 1,308 1,038 889 3,741 3,182 26% 47% 18%
Other Income 13 29 27 65 51 (6%) (5%) 27%
Total Revenue 5,244 3,196 3,176 14,144 13,996 64% 65% 1%
Total Expenditure 3,278 2,375 2,002 9,414 10,344
EBITDA 1,966 821 1,174 4,730 3,652 139% 67% 30%
EBIDTA % 37% 26% 37% 33% 26% 42% - 27%
2121 SOBHA
EBIDTA % 37% 26% 37% 33% 26% 42% - 27%
Depreciation & Amortization 116 69 107 388 278
Finance Expenses 406 221 299 1,165 860
PBT 1,444 531 768 3,177 2, 514 172% 88% 26%
PBT % 28% 17% 24% 22% 18% 65% 17% 22%
Provision for Tax 498 137 230 1,077 669
PAT before minority interest 946 394 538 2,100 1,845 140% 76% 14%
Minority Interest 8 1 13 41 32
PAT after minority interest 938 393 525 2,059 1,813 139% 79% 14%
PAT % 18% 12% 17% 15% 13%
CASH FLOW STATEMENT (Consolidated)
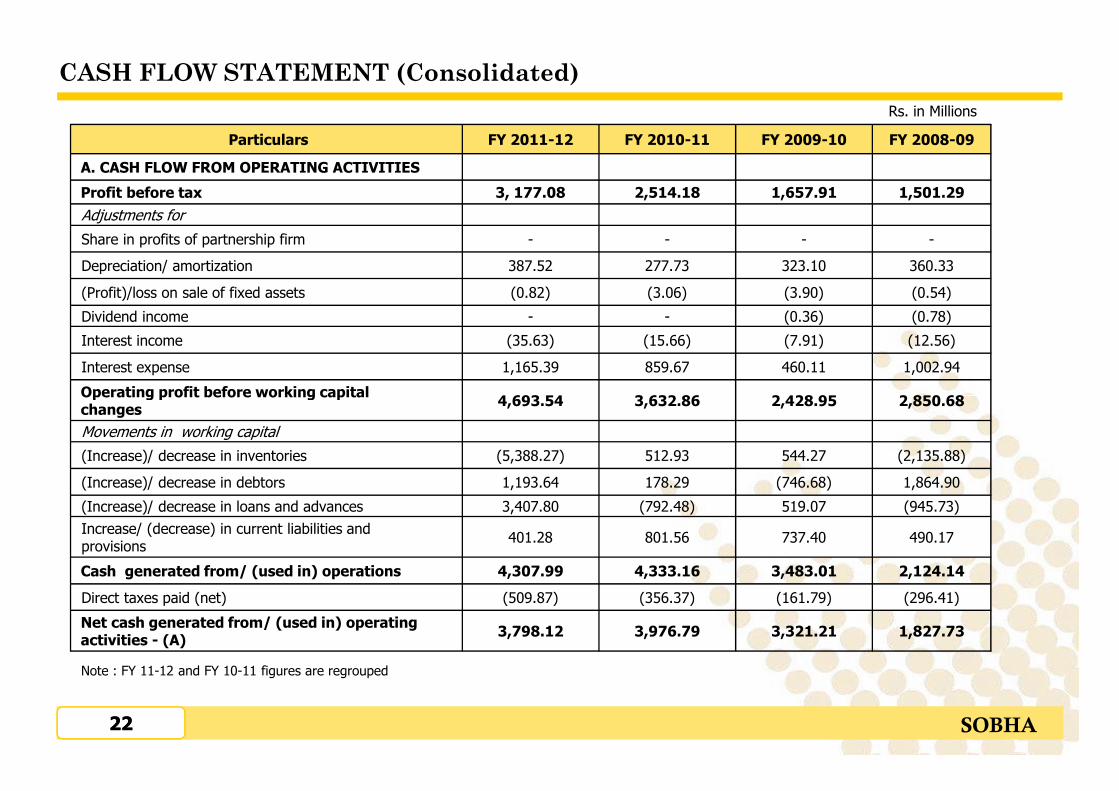
Particulars FY 2011-12 FY 2010-11 FY 2009-10 FY 2008-09
A. CASH FLOW FROM OPERATING ACTIVITIES
Profit before tax 3, 177.08 2,514.18 1,657.91 1,501.29
Adjustments for
Share in profits of partnership firm - - - -
Depreciation/ amortization 387.52 277.73 323.10 360.33
(Profit)/loss on sale of fixed assets (0.82) (3.06) (3.90) (0.54)
Dividend income - - (0.36) (0.78)
Interest income (35.63) (15.66) (7.91) (12.56)
Interest expense 1,165.39 859.67 460.11 1,002.94
Operating profit before working capital 4,693.54 3,632.86 2,428.95 2,850.68
Rs. in Millions
2222 SOBHA
Operating profit before working capital changes
4,693.54 3,632.86 2,428.95 2,850.68
Movements in working capital
(Increase)/ decrease in inventories (5,388.27) 512.93 544.27 (2,135.88)
(Increase)/ decrease in debtors 1,193.64 178.29 (746.68) 1,864.90
(Increase)/ decrease in loans and advances 3,407.80 (792.48) 519.07 (945.73)
Increase/ (decrease) in current liabilities and provisions
401.28 801.56 737.40 490.17
Cash generated from/ (used in) operations 4,307.99 4,333.16 3,483.01 2,124.14
Direct taxes paid (net) (509.87) (356.37) (161.79) (296.41)
Net cash generated from/ (used in) operating activities - (A)
3,798.12 3,976.79 3,321.21 1,827.73
Note : FY 11-12 and FY 10-11 figures are regrouped
CASH FLOW STATEMENT (Consolidated)
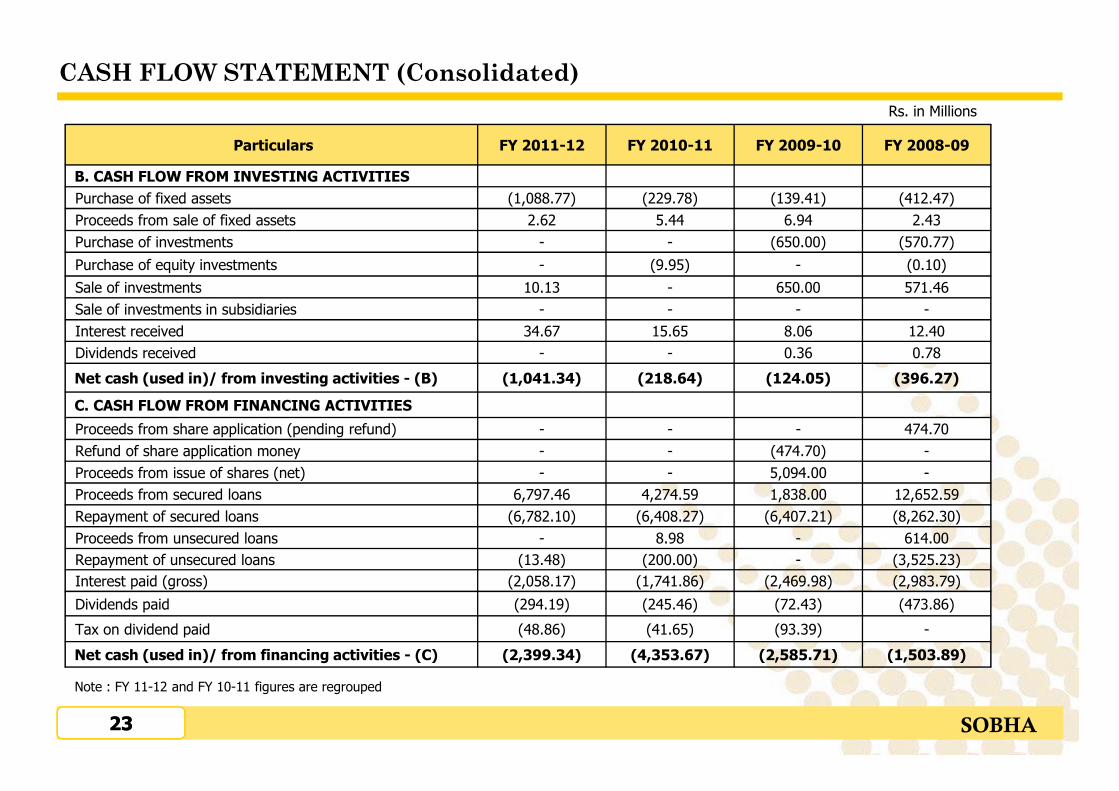
Particulars FY 2011-12 FY 2010-11 FY 2009-10 FY 2008-09
B. CASH FLOW FROM INVESTING ACTIVITIES
Purchase of fixed assets (1,088.77) (229.78) (139.41) (412.47)
Proceeds from sale of fixed assets 2.62 5.44 6.94 2.43
Purchase of investments - - (650.00) (570.77)
Purchase of equity investments - (9.95) - (0.10)
Sale of investments 10.13 - 650.00 571.46
Sale of investments in subsidiaries - - - -
Interest received 34.67 15.65 8.06 12.40
Dividends received - - 0.36 0.78
Net cash (used in)/ from investing activities - (B) (1,041.34) (218.64) (124.05) (396.27)
Rs. in Millions
2323 SOBHA
C. CASH FLOW FROM FINANCING ACTIVITIES
Proceeds from share application (pending refund) - - - 474.70
Refund of share application money - - (474.70) -
Proceeds from issue of shares (net) - - 5,094.00 -
Proceeds from secured loans 6,797.46 4,274.59 1,838.00 12,652.59
Repayment of secured loans (6,782.10) (6,408.27) (6,407.21) (8,262.30)
Proceeds from unsecured loans - 8.98 - 614.00
Repayment of unsecured loans (13.48) (200.00) - (3,525.23)
Interest paid (gross) (2,058.17) (1,741.86) (2,469.98) (2,983.79)
Dividends paid (294.19) (245.46) (72.43) (473.86)
Tax on dividend paid (48.86) (41.65) (93.39) -
Net cash (used in)/ from financing activities - (C) (2,399.34) (4,353.67) (2,585.71) (1,503.89)
Note : FY 11-12 and FY 10-11 figures are regrouped

CASH FLOW STATEMENT (Consolidated)
Particulars FY 2011-12 FY 2010-11 FY 2009-10 FY 2008-09
Net increase/ (decrease) in cash or cash equivalents - (A+B+C)
357.43 (595.52) 611.45 (72.43)
Cash and cash equivalents as at beginning of the year 230.13 825.65 214.20 286.63
Cash and cash equivalents as at the end of the year
587.56 230.13 825.65 214.60
Components of cash and cash equivalents
Cash on hand 3.68 4.37 4.23 2.68
Balances with scheduled banks
Rs. in Millions
2424 SOBHA
Balances with scheduled banks
On current accounts 403.98 164.90 455.46 175.92
On deposit accounts 179.90 60.86 365.96 35.60
587.56 230.13 825.65 214.20
Note : FY 11-12 and FY 10-11 figures are regrouped
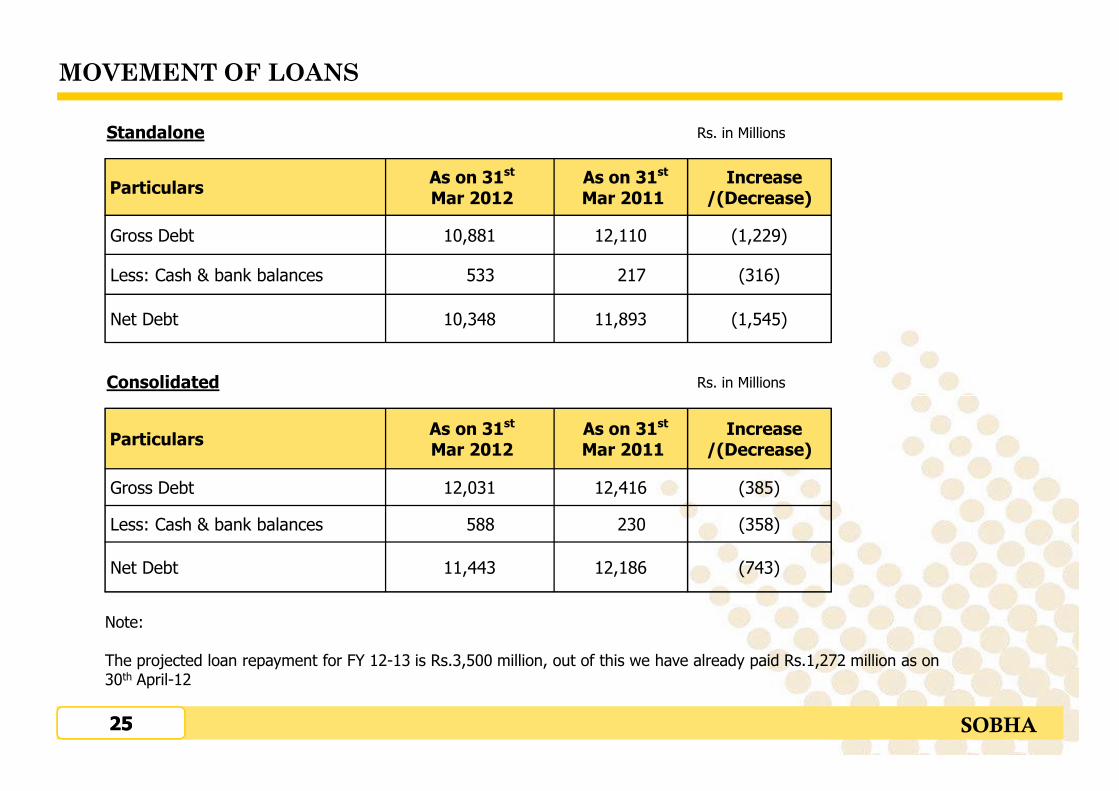
MOVEMENT OF LOANS
ParticularsAs on 31st
Mar 2012As on 31st
Mar 2011Increase
/(Decrease)
Gross Debt 10,881 12,110 (1,229)
Less: Cash & bank balances 533 217 (316)
Net Debt 10,348 11,893 (1,545)
Rs. in MillionsStandalone
Rs. in MillionsConsolidated
2525 SOBHA
ParticularsAs on 31st
Mar 2012As on 31st
Mar 2011Increase
/(Decrease)
Gross Debt 12,031 12,416 (385)
Less: Cash & bank balances 588 230 (358)
Net Debt 11,443 12,186 (743)
Note:
The projected loan repayment for FY 12-13 is Rs.3,500 million, out of this we have already paid Rs.1,272 million as on 30th April-12

LAND BANK STATUS
BANGALORE (851.25 acres)
Developable Area 83.07
Sobha Share 79.83
PUNE (138.61 acres)
Developable Area 6.74
Sobha Share 6.49
16.7%
15.8%
3.2%
3.1%
1.2%
0.8%
Chennai
Hosur
Coimbatore
Pune
Mysore
Thrissur
Distribution based on development potential
2626 SOBHA
MYSORE (32.30 Acres)
Developable Area 2.59
Sobha Share 2.59
THRISSUR (16.64 acres)
Developable Area 1.81
Sobha Share 1.81
COCHIN (435.27 acres)
Developable Area 47.40
Sobha Share 47.40
COIMBATORE (108.26 acres)
Developable Area 7.07
Sobha Share 7.07
HOSUR (484.76 acres)
Developable Area 34.84
Sobha Share 34.84
CHENNAI (511.49 acres)
Developable Area 36.76
Sobha Share 36.63
21.5%
37.7%Bangalore
Cochin
• Total Extent of Land : 2,578.57 acres• Sobha Share of Land : 2,505.87 acres• Total Cost consideration : Rs.18,890.58 mns• Balance payable as on 31.03.12 : Rs.1,151.29 mns• Cost of Sobha Land : Rs.173 /sft• Sobha FSI Cost of Land : Rs.86 /sft

SHARE HOLDING PATTERN
� In the last 1 year FII’s holding has increased by 7.15 %.
� No. of shareholders as on 31st March 2012 is 62,338.
� Market capitalization as on 31st March 2012 is Rs.32.75 Billion.
Promoters,
60.50%
Others,
5.10%
FII's,
32.37%
Mutual
Funds,
2.03%
2727 SOBHA
31st Mar- 12 31st Dec- 11 30th Sep-11 30th Jun-11 31st Mar-11
Promoters Holding 60.50% 60.50% 60.50% 60.50% 60.50%
FII’s 32.37% 32.22% 33.24% 30.21% 30.21%
Mutual Fund 2.03% 1.29% 1.07% 4.04% 4.04%
Others 5.10% 5.99% 5.19% 5.25% 5.25%
Billion.

SOBHA – STOCK PERFORMANCE
No. of Shares 98.06 Million
Market Capitalization Rs 32.75 Billion
Stock Price : 52 week High / Low 334 /179.50
Avg. Daily volume (12 months) 172,523
Status as on: 31st March 12
Source : NSE & BSE index
1 year Chart - Sobha v/s Nifty v/s Realty
-50
-40
-30
-20
-10
0
10
20
Apr-11 May-11 Jun-11 Aug-11 Sep-11 Nov-11 Dec-11 Feb-12 Mar-12
% C
ha
ng
e i
n C
losi
ng
Pri
ce
Sobha Nifty Nse Realty
2828 SOBHA
Sobha stock covered by,
• Morgan Stanley • Jefferies India Ltd • IDBI Capital • IDFC securities
• CLSA India • Enam Securities • Goldman Sachs
• ICICI Securities • Credit Suisse • JM Financials
• TATA Securities • J P Morgan • Prabhudas & Lilladher
• Deutsche India Equities • BNP Paribas • Bank of America (Merrill Lynch)
• Religare Capital Markets • Kotak Securities • Kantilal Chhaganlal Securities
• Ambit Capital • IIFL (India Info Line) • Emkay Global
RECOGNITION
Sobha received overall 30 awards under various category – Highest number of awards
Employer of the Year Award in Real Estate Category by Realty plus.
India’s Top 10 Builders Award received by Construction World
Best Sustainable Project of the Year for Bayer Eco-Commercial Building by Construction Week India
Most Outstanding Structure built in Pune for Infosys Food Court- 3 by Sobha Developers, received from Indian Concrete Institute
2929 SOBHA
Environment Friendly Project of the Year Award in Residential Category to Sobha Forestview by Realty Plus
PRCI Gold Award for “Corporate Film”,PRCI Silver Award for “Annual Report” and PRCI Silver Award for “PR Case Study” BY Public Relations Council of India
Sobha’s “Annual Report” won the LACP 2010 Vision Awards Silver Award for Excellence within Industry (Real Estate) World-wideBronze Award for the Best In-House Annual Report in Asia
---- by League of American Communications Professionals (LACP)
and many more…
THANK YOUTHANK YOU
Sobha Developers Ltd.‘SOBHA’, Sarjapur-Marathahalli Outer Ring
S. BaaskaranChief Financial Officer
K.Bala MuruganManager – MD’s Office
Corporate Office For Investors Contact :
‘SOBHA’, Sarjapur-Marathahalli Outer Ring Road(ORR),Devarabisanahalli, Bellandur Post,Bangalore-560103Phone: +91-80- 49320000, Fax: +91-80- 49320444
Chief Financial OfficerMobile: +91- 98800 80009Email: [email protected] : www.sobha.com
Manager – MD’s OfficeMobile: +91- 98807 30459Email: [email protected]
Disclaimer:The information in this presentation contains certain forward-looking statements. These include statements regarding outlook on future development schedules,
business plans and expectations ofCapital expenditures. These statements are based on current expectations that involve a Number of risks and uncertainties which could cause actual results to differ from those anticipated by the Company.


![Ooty land[1]](https://img.pdfslide.us/doc/110x75/589b42d31a28ab22038b7401/ooty-land1.jpg)