Embed Size (px)
Citation preview
Results Presentation Six months to 31 March 2019
Aristocrat Leisure Limited Investor Presentation 23 May 2019
2 2
Disclaimer This document and any oral presentation accompanying it has been prepared in good faith, however, no express or implied representation or warranty is given as to the accuracy or completeness of the information in this document, in any accompanying presentation or in any other written or oral communication transmitted or made available to any investor or potential investor (collectively, the “Other Materials”). Nothing in this document, in any accompanying presentation or in any Other Materials is, or shall be relied upon as, a promise or representation. All statutory representations and warranties are excluded, and any liability in negligence is excluded, in both cases to the fullest extent permitted by law. No responsibility is assumed for any reliance on this document or the accompanying presentation or any Other Materials.
Without limiting the above, this document, any accompanying presentation and any Other Materials may contain forecasts, forward looking statements or statements as to future affairs which are based on estimates, assumptions and expectations of Aristocrat Leisure Limited or its subsidiaries (collectively, the “Company”) (some or all of which may not be satisfied or may not occur) that, while used in good faith, necessarily involve (i) subjective judgments; (ii) inherent uncertainties; and (iii) significant contingencies, many of which are beyond the Company’s control or reflect future business decisions which are subject to change. Any forecast or financial information presented in this presentation any accompanying presentation and any Other Materials must not be taken as a representation as to future matters.
Therefore, there can be no assurance that such forecasts, forward looking statements or statements as to future affairs will be realised or that the Company's actual or future results, or subsequent forecasts, will not vary significantly from such forecasts, forward looking statements and statements as to future affairs. The actual results may vary from the anticipated results and such variations may be material. Any and all forecasts and financial information in this document, in any accompanying presentation and in any Other Materials are not, and shall not be relied upon as, a promise or representation as to future matters. The Company accepts no responsibility or liability in relation to the accuracy or completeness of any forecasts, forward looking statements or statements as to future affairs, or whether they are achievable. The Company does not assume any obligation to revise or update this document, any accompanying presentation, any Other Materials or any of the estimates, assumptions or expectations underlying such forecasts, forward looking statements and statements as to future affairs. No representations or warranties are made as to the accuracy or reasonableness of such estimates, assumptions or expectations or the forecasts, forward looking statements or statements as to future affairs based thereon. Certain data included herein has been obtained from alternative external sources and as such may be inconsistent given differing underlying assumptions and sources.
Disclosures in this document, the accompanying presentation or any Other Materials are not investment advice and are not intended to be relied upon as advice to investors or potential investors and do not take into account the investment objectives, financial situation or needs of any particular investor. These should be considered, with independent professional advice when deciding if an investment is appropriate.
The information contained in this document (including tables) has not been audited in accordance with the Australian Auditing Standards.
This document remains the property of the Company and the Company reserves the right to require the return of this document (and any copies or extracts hereof) at any time.
The receipt of this document by any investor or potential investor shall constitute such investor’s or potential investor’s acceptance of the foregoing terms and conditions.

Group Results Summary
Results Summary
Outlook
Agenda
Operational Performance
2
3
4
5
6 Q&A
7 Appendices
Strategy Update 1
4 4
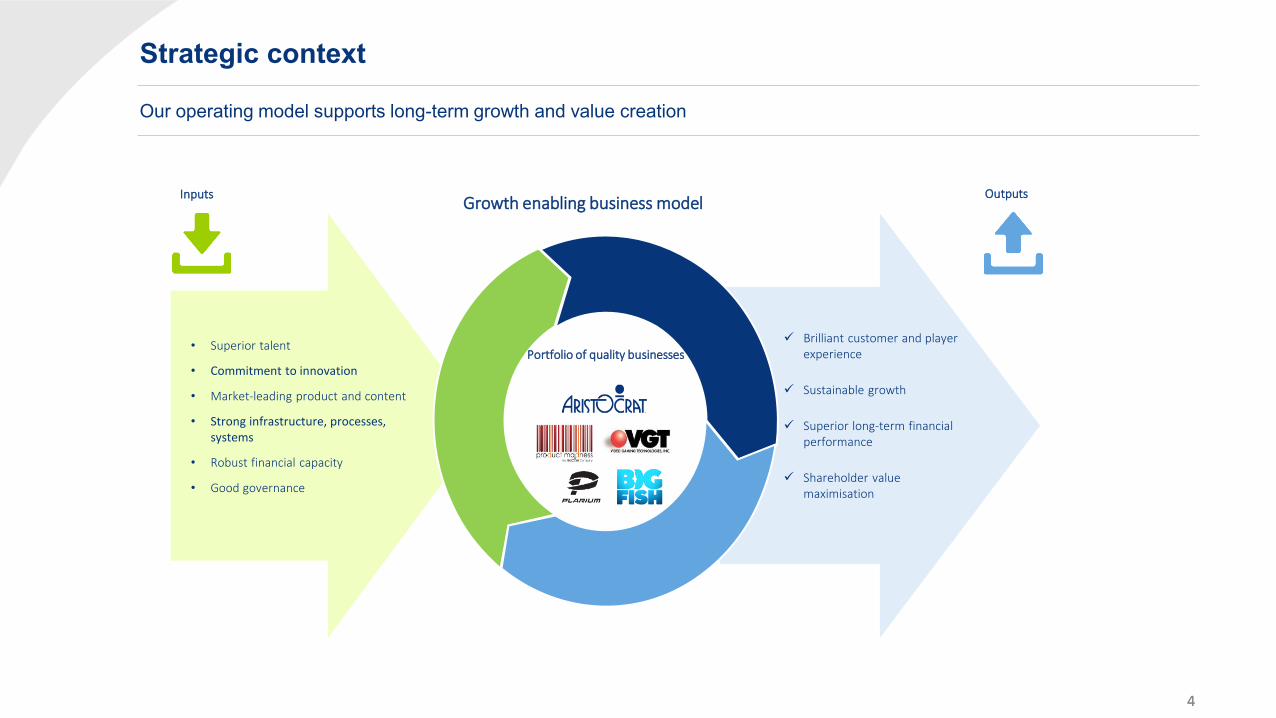
Strategic context
Our operating model supports long-term growth and value creation
Inputs Outputs Growth enabling business model
• Superior talent
• Commitment to innovation
• Market-leading product and content
• Strong infrastructure, processes, systems
• Robust financial capacity
• Good governance
Brilliant customer and player experience
Sustainable growth
Superior long-term financial performance
Shareholder value maximisation
Portfolio of quality businesses
5 5
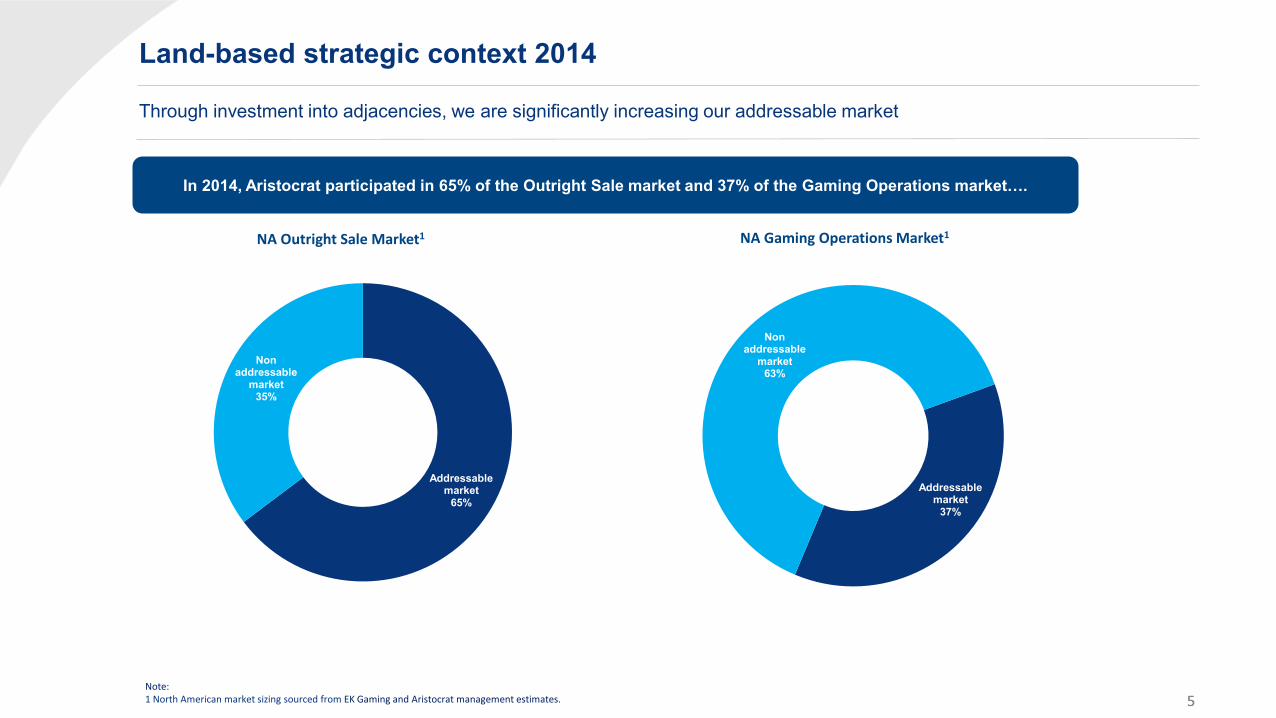
Land-based strategic context 2014
Through investment into adjacencies, we are significantly increasing our addressable market
Addressable market
37%
Non addressable
market 63%
Addressable market
65%
Non addressable
market 35%
In 2014, Aristocrat participated in 65% of the Outright Sale market and 37% of the Gaming Operations market….
NA Outright Sale Market1 NA Gaming Operations Market1
Note: 1 North American market sizing sourced from EK Gaming and Aristocrat management estimates.

6 6
Land-based North American Adjacencies Strong market segmentation and investment leading to successful entry into a number of identified adjacent markets, growing our addressable market and share gain opportunities
Class II Gaming Ops Video
Class III Gaming Ops Stepper Class III Stepper
Video Lottery Terminal
OvationTM RELM XLTM RELMTM VLT
Washington CDS
Bar Top Poker
Bar Top WA CDS ALL Launch: Annual churn: Installed Base: Note: 1 North American FY19F market information sourced from EK Gaming and Aristocrat management estimates.
FY17 n/a 32k
FY18 n/a 10k
FY17 13k
225k
FY19 Entry 4.3k 46k
FY19 Entry 4.3k 31k
FY19/20 Entry 3.0k 98k
Gaming Operations Outright Sales
7 7
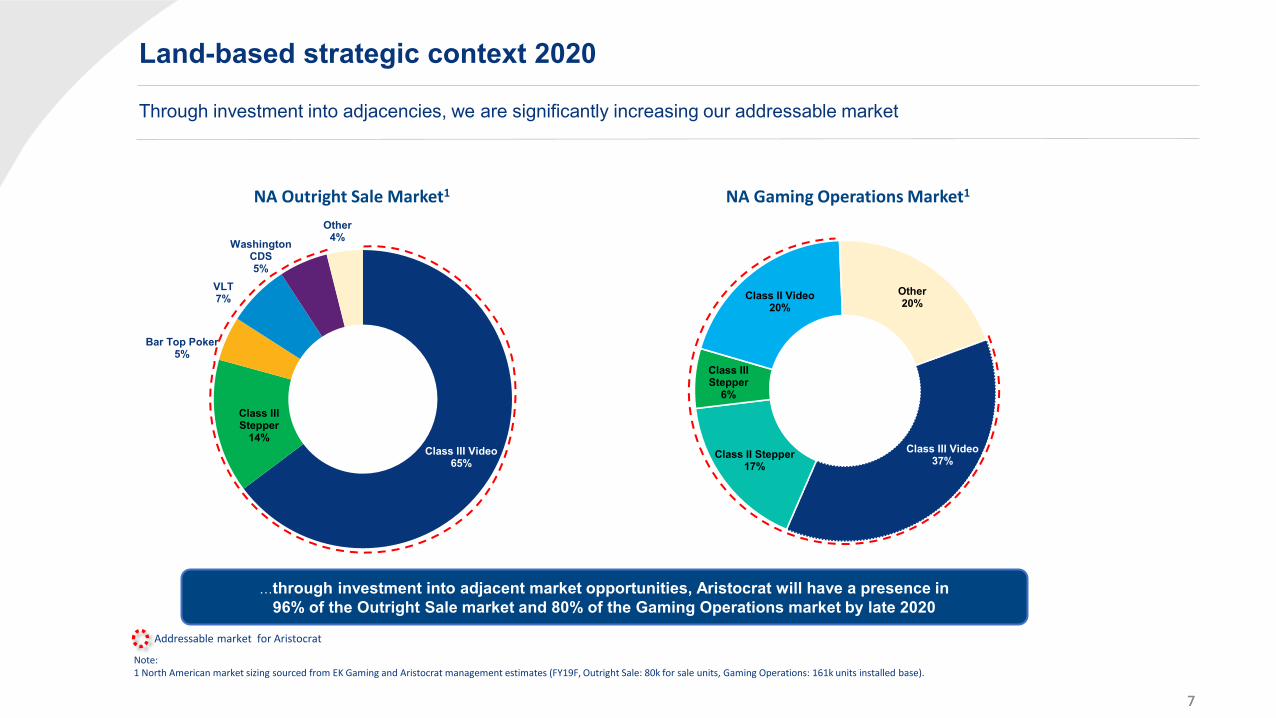
Land-based strategic context 2020
Through investment into adjacencies, we are significantly increasing our addressable market
Class III Video 37% Class II Stepper
17%
Class III Stepper
6%
Class II Video 20%
Other 20%
Class III Video 65%
Class III Stepper
14%
Bar Top Poker 5%
VLT 7%
Washington CDS 5%
Other 4%
…through investment into adjacent market opportunities, Aristocrat will have a presence in 96% of the Outright Sale market and 80% of the Gaming Operations market by late 2020
NA Outright Sale Market1 NA Gaming Operations Market1
Note: 1 North American market sizing sourced from EK Gaming and Aristocrat management estimates (FY19F, Outright Sale: 80k for sale units, Gaming Operations: 161k units installed base).
Addressable market for Aristocrat

8 8
Digital strategic context: Aristocrat’s addressable market In 2014, Aristocrat only participated in the Core Slot segment of Social Casino, which represented an addressable market of less than US$2bn. Through acquisitions of Plarium and Big Fish, Aristocrat is now targeting a US$32bn market opportunity
Social Casino
Match 3
Poker
Bingo
US$4.2b 26% CAGR
Casual
US$6.5b 35% CAGR
Solitaire
PVP RNG
Word
Bubble Popper
Time Manag-ement
Hidden Object
Interactive Fiction
Line Match
Other Endless Runner
Cards
Merge
Dice
Bolt On Meta
Core Slot
Social
Missions
Narrative Progression
IP Driven
Collect
Comps
Other Casino
Casual Builder
MOBA / Arena
MMO
RPG
US$9.2b 20% CAGR
Simulation
US$2.7b 19% CAGR
Strategy
US$4.7b 5% CAGR
Battle Royale
Battle Card
Tower Defence
Survival
Fighting
Shooter
CCG Match-3
RPG CCG
Other
Racing
Sports
Sandbox
Heroes
Clash of Clones
Report based
Action
US$4.7b 65% CAGR
Source: App Annie (includes iOS and Google Stores, but excludes Facebook and other local platforms in Asia) data for CY18 – based on Aristocrat’s segmentation and categorisation of approximately 550 games - CAGR CY2015-CY2018.
Product Madness previously only participated in this segment Acquired capability

9 9
Digital strategic context: how we are leveraging our capabilities
Digital Skills
• Focused on returns across both marketing and development costs
Operational Rigour
• World Class Game Design across core and adjacencies
Game Design
• User Acquisition skills and platform
• Virality and branding
Marketing
• Market intimacy • Portfolio planning
across all studios
Market Intel and Portfolio Planning
• Data Science and product management
• Monetisation and game economy
1
3
4 5
6
• Longevity of franchises, providing strong financial stability
Evergreen Brands 2
• Strong pipeline of content into evergreen franchises
• Execute high quality, new content games
• Rigorous “fill or kill” approach to game development and launch
• 8m DAU; plan to grow further • Leverage data capabilities and share
learnings to drive further scale and optimise existing DAU
• Cross promotion and Platform partnership opportunities
• Marketing Spend (UA e.g. common UA platform management tool)
• Design and Development (D&D)
Portfolio Growth
Leverage Scale
Maximise efficiency
Our Capabilities Our Focus

10 10
Tax update Consistent with the changes in the Group’s business profile, Aristocrat is in the process of implementing changes in the Group structure which is expected to result in reductions in foreign cash tax paid and book tax expense from FY20 onwards
Note: 1 Average Australian tax contribution from Aristocrat from FY16-FY18 according to Voluntary Tax Transparency Code Report.
Large and increasing majority of Aristocrat’s profit is generated from the US (representing 60% of Group revenues)
Changes being implemented to Group structure to ensure it remains fully aligned with underlying business model
Aristocrat continues to be tax resident and to pay taxes in Australia; no impact on the amount of Australian tax the business pays (average > $120m per year1)
Treatment confirmed by private ruling from the Australian Tax Office
Effective tax rate (ETR) expected to reduce by 150 to 250 bps compared to the FY19 ETR
Upon implementation, expect to recognise a material deferred tax asset
Implementation not anticipated until after 30 September 2019 and subject to receipt of gaming regulatory and other necessary approvals
Further market update to be provided, including indicative financial impacts, on completion of steps to implementation after 30 September 2019

Group Results Summary
12 12
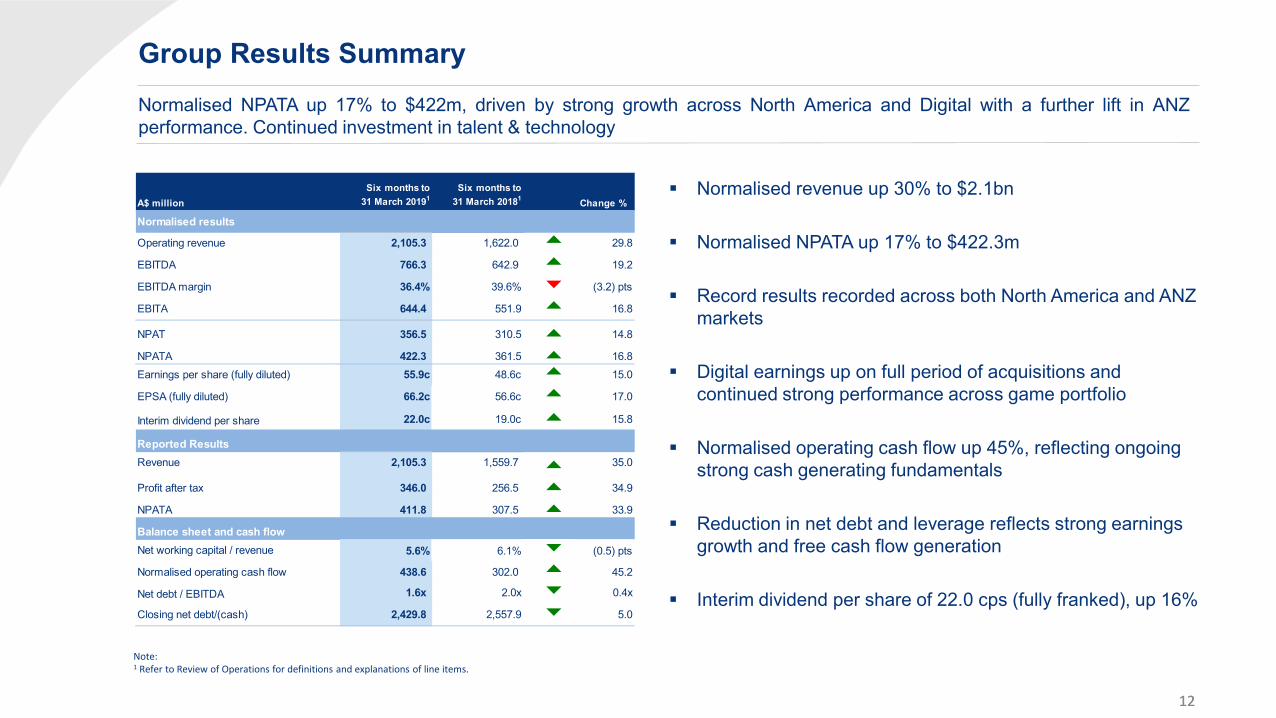
Normalised revenue up 30% to $2.1bn
Normalised NPATA up 17% to $422.3m
Record results recorded across both North America and ANZ markets
Digital earnings up on full period of acquisitions and continued strong performance across game portfolio
Normalised operating cash flow up 45%, reflecting ongoing strong cash generating fundamentals
Reduction in net debt and leverage reflects strong earnings growth and free cash flow generation
Interim dividend per share of 22.0 cps (fully franked), up 16%
Note: 1 Refer to Review of Operations for definitions and explanations of line items.
Six months to Six months toA$ million 31 March 20191 31 March 20181 Change %
Normalised results
Operating revenue 2,105.3 1,622.0 29.8
EBITDA 766.3 642.9 19.2
EBITDA margin 36.4% 39.6% (3.2) pts
EBITA 644.4 551.9 16.8
NPAT 356.5 310.5 14.8
NPATA 422.3 361.5 16.8
Earnings per share (fully diluted) 55.9c 48.6c 15.0
EPSA (fully diluted) 66.2c 56.6c 17.0
Interim dividend per share 22.0c 19.0c 15.8
Reported ResultsRevenue 2,105.3 1,559.7 35.0
Profit after tax 346.0 256.5 34.9
NPATA 411.8 307.5 33.9
Balance sheet and cash flowNet working capital / revenue 5.6% 6.1% (0.5) pts
Normalised operating cash flow 438.6 302.0 45.2
Net debt / EBITDA 1.6x 2.0x 0.4x
Closing net debt/(cash) 2,429.8 2,557.9 5.0
Group Results Summary Normalised NPATA up 17% to $422m, driven by strong growth across North America and Digital with a further lift in ANZ performance. Continued investment in talent & technology

13 13
Financial Performance Earnings growth across both Land-based and Digital markets enabled by D&D investment. International Class III down with no new major casino openings in the period
NPATA bridge (A$m)1
Note: 1 Numbers above are reported on a constant currency basis and are tax effected at the prior year tax rate.
14 14
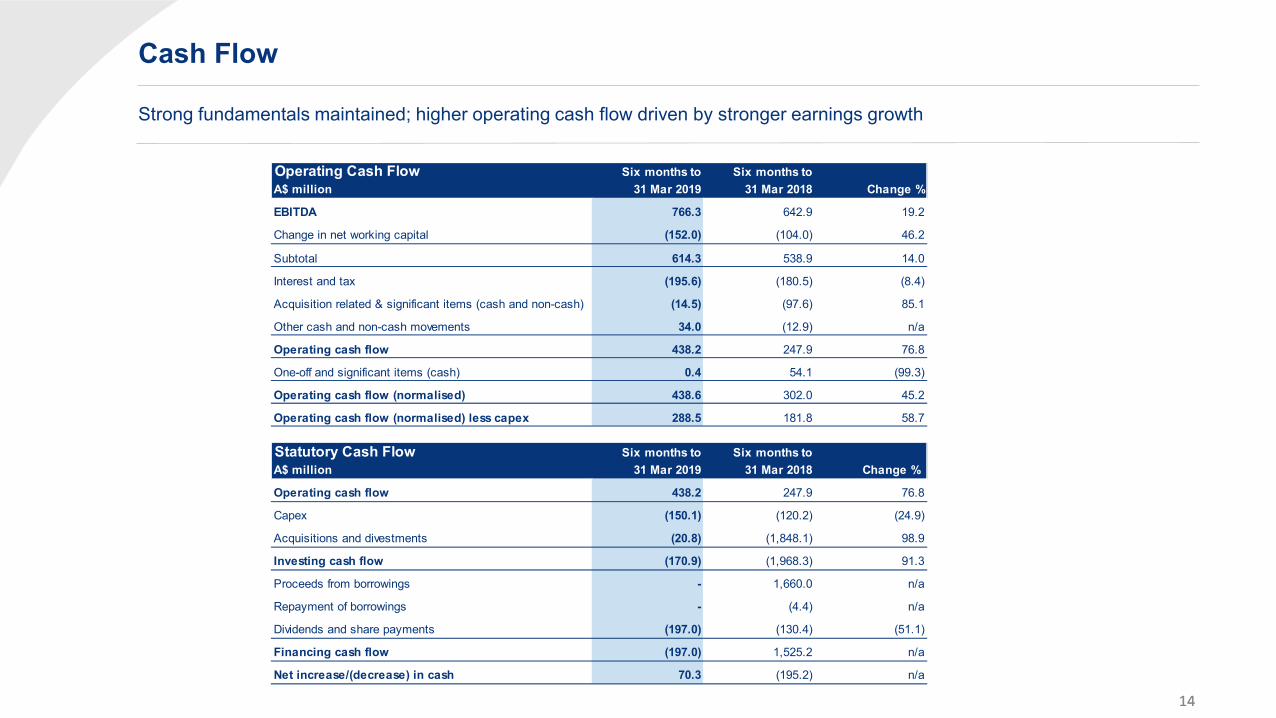
Cash Flow
Strong fundamentals maintained; higher operating cash flow driven by stronger earnings growth
Operating Cash Flow Six months to Six months toA$ million 31 Mar 2019 31 Mar 2018 Change %
EBITDA 766.3 642.9 19.2
Change in net working capital (152.0) (104.0) 46.2
Subtotal 614.3 538.9 14.0
Interest and tax (195.6) (180.5) (8.4)
Acquisition related & significant items (cash and non-cash) (14.5) (97.6) 85.1
Other cash and non-cash movements 34.0 (12.9) n/a
Operating cash flow 438.2 247.9 76.8
One-off and significant items (cash) 0.4 54.1 (99.3)
Operating cash flow (normalised) 438.6 302.0 45.2
Operating cash flow (normalised) less capex 288.5 181.8 58.7
Statutory Cash Flow Six months to Six months toA$ million 31 Mar 2019 31 Mar 2018 Change %
Operating cash flow 438.2 247.9 76.8
Capex (150.1) (120.2) (24.9)
Acquisitions and divestments (20.8) (1,848.1) 98.9
Investing cash flow (170.9) (1,968.3) 91.3
Proceeds from borrowings - 1,660.0 n/a
Repayment of borrowings - (4.4) n/a
Dividends and share payments (197.0) (130.4) (51.1)
Financing cash flow (197.0) 1,525.2 n/a
Net increase/(decrease) in cash 70.3 (195.2) n/a

15 15
Balance Sheet and Debt Profile
Strong balance sheet supportive of Aristocrat’s growth strategy
Note: 1 Refer to Review of Operations for definitions of line items.
Balance sheet strength improved following strong earnings and cash generation
Conservative borrowing metrics maintained
Strong liquidity position
US$100m debt repaid (May 2019) post period end
Term Loan B (TLB) debt remains competitive with long term (>5 years) funding certainty and flexibility maintained
Stable credit ratings maintained
Balance Sheet Statistics1
A$ million 31 Mar 2019 30 Sep 2018 31 Mar 2018
Total debt 2,933.8 2,881.1 2,915.5
Net debt / (cash) 2,429.8 2,453.0 2,557.9
Net debt / EBITDA 1.6x 1.7x 2.0x
Interest Cover 11.7x 11.4x 10.8x
Debt Profile StatisticsA$ million 31 Mar 2019
Total Liquidity A$m 611.8
Debt maturity Years 5.6
Fixed / floating interest rate ratio % 54.0

Operational Performance
17 17
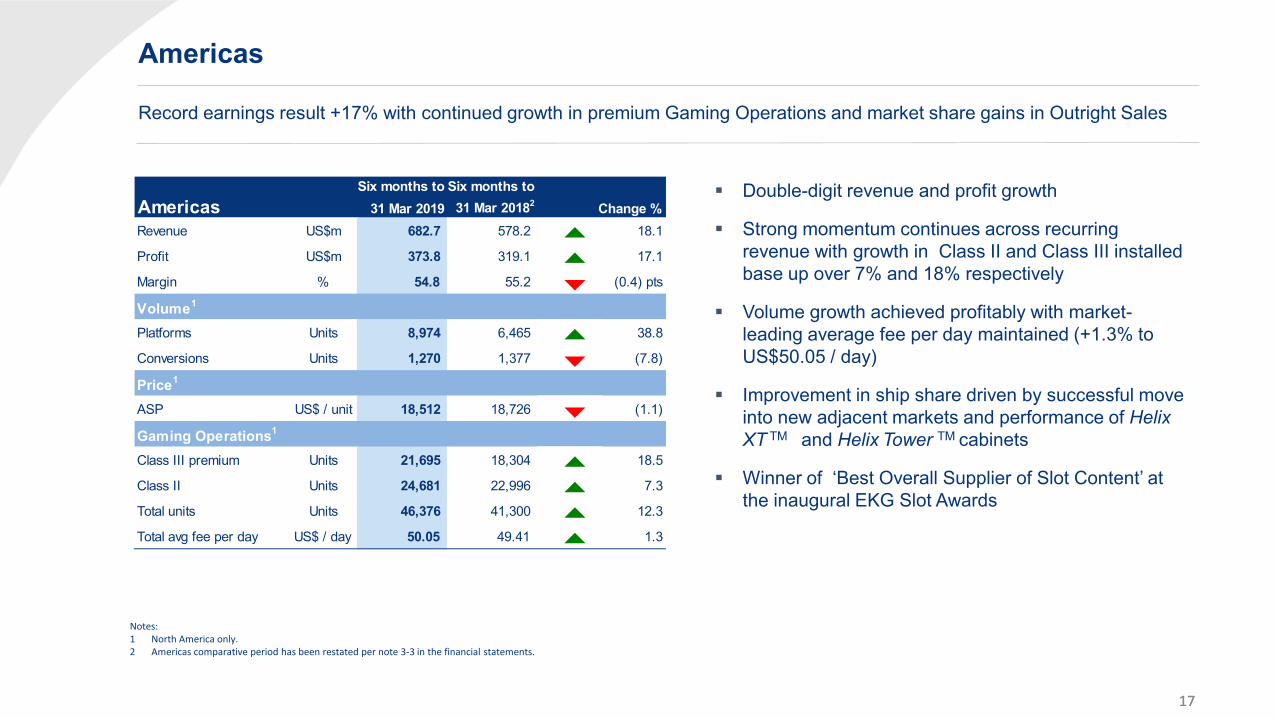
Americas
Record earnings result +17% with continued growth in premium Gaming Operations and market share gains in Outright Sales
Double-digit revenue and profit growth
Strong momentum continues across recurring revenue with growth in Class II and Class III installed base up over 7% and 18% respectively
Volume growth achieved profitably with market-leading average fee per day maintained (+1.3% to US$50.05 / day)
Improvement in ship share driven by successful move into new adjacent markets and performance of Helix
XT TM and Helix Tower TM cabinets
Winner of ‘Best Overall Supplier of Slot Content’ at the inaugural EKG Slot Awards
Notes: 1 North America only. 2 Americas comparative period has been restated per note 3-3 in the financial statements.
Six months to Six months toAmericas 31 Mar 2019 31 Mar 20182 Change %Revenue US$m 682.7 578.2 18.1
Profit US$m 373.8 319.1 17.1
Margin % 54.8 55.2 (0.4) pts
Volume1
Platforms Units 8,974 6,465 38.8
Conversions Units 1,270 1,377 (7.8)
Price1
ASP US$ / unit 18,512 18,726 (1.1)
Gaming Operations1
Class III premium Units 21,695 18,304 18.5
Class II Units 24,681 22,996 7.3
Total units Units 46,376 41,300 12.3
Total avg fee per day US$ / day 50.05 49.41 1.3
18 18
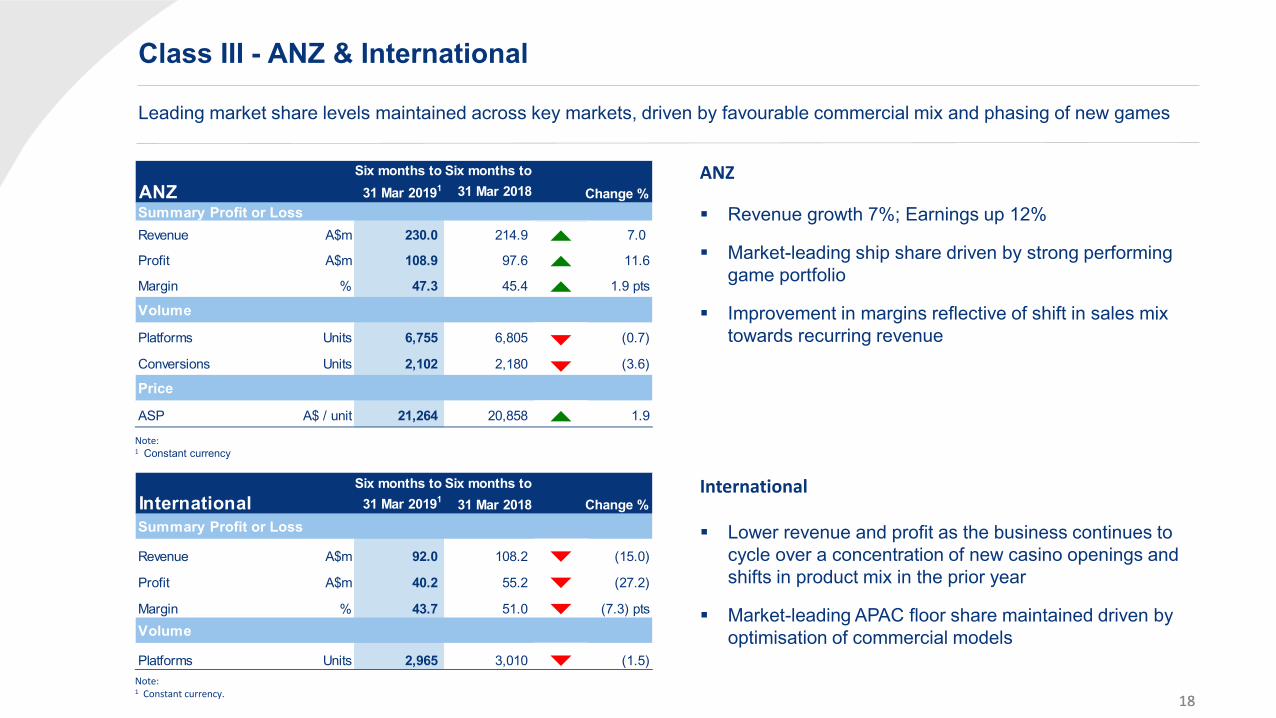
Class III - ANZ & International
Leading market share levels maintained across key markets, driven by favourable commercial mix and phasing of new games
Note: 1 Constant currency
Note: 1 Constant currency.
Six months to Six months toANZ 31 Mar 20191 31 Mar 2018 Change %Summary Profit or LossRevenue A$m 230.0 214.9 7.0
Profit A$m 108.9 97.6 11.6
Margin % 47.3 45.4 1.9 pts
Volume
Platforms Units 6,755 6,805 (0.7)
Conversions Units 2,102 2,180 (3.6)
Price
ASP A$ / unit 21,264 20,858 1.9
Six months to Six months toInternational 31 Mar 20191 31 Mar 2018 Change %Summary Profit or Loss
Revenue A$m 92.0 108.2 (15.0)
Profit A$m 40.2 55.2 (27.2)
Margin % 43.7 51.0 (7.3) ptsVolume
Platforms Units 2,965 3,010 (1.5)
Revenue growth 7%; Earnings up 12%
Market-leading ship share driven by strong performing game portfolio
Improvement in margins reflective of shift in sales mix towards recurring revenue
Lower revenue and profit as the business continues to cycle over a concentration of new casino openings and shifts in product mix in the prior year
Market-leading APAC floor share maintained driven by optimisation of commercial models
ANZ
International

19 19
Digital Summary Revenue growth of 37% reflects a full period of acquisitions and represents 39% of group revenue. Transitioning towards a balanced portfolio approach with new and acquired Social Casual games
Six months to Six months toDigital 31 Mar 2019 31 Mar 2018 Change %
Summary Profit or Loss
Bookings US$m 586.1 435.9 34.5
Revenue US$m 586.8 428.5 36.9
Profit US$m 175.8 150.0 17.2
Margin % 30.0 35.0 (5.0) pts
Key metrics
UA Spend US$m 153.1 104.9 45.9
DAU period end Millions 8.0 8.3 (3.6)
ABPDAU half year US$ 0.38 0.41 (7.3)
Six months to Six months toDigital - Pro-Forma 31 Mar 2019 31 Mar 2018 Change %
Summary Profit or LossBookings US$m 586.1 584.6 0.3
Revenue US$m 586.8 577.7 1.6
Profit US$m 175.8 188.3 (6.6)
Margin % 30.0 32.6 (2.6) pts
Revenues up 37% driven by growth in Product Madness and full period benefit of acquired Plarium and Big Fish businesses
Margin moderated in line with expectations with lower margin acquired businesses, with a greater proportion of casual games
UA spend 46% higher in line with expectations, driven by full period of new businesses and scaling of new and franchise games
Bookings flat on a pro-forma basis, reflective of the investment and transition of our Digital business
Profit on a pro-forma basis declined 6.6% against the PCP, reflects the higher marketing spend behind new games in this transition period, and a decline in Big Fish premium browser and Plarium legacy titles, partially offset by our focus on efficiency
20 20
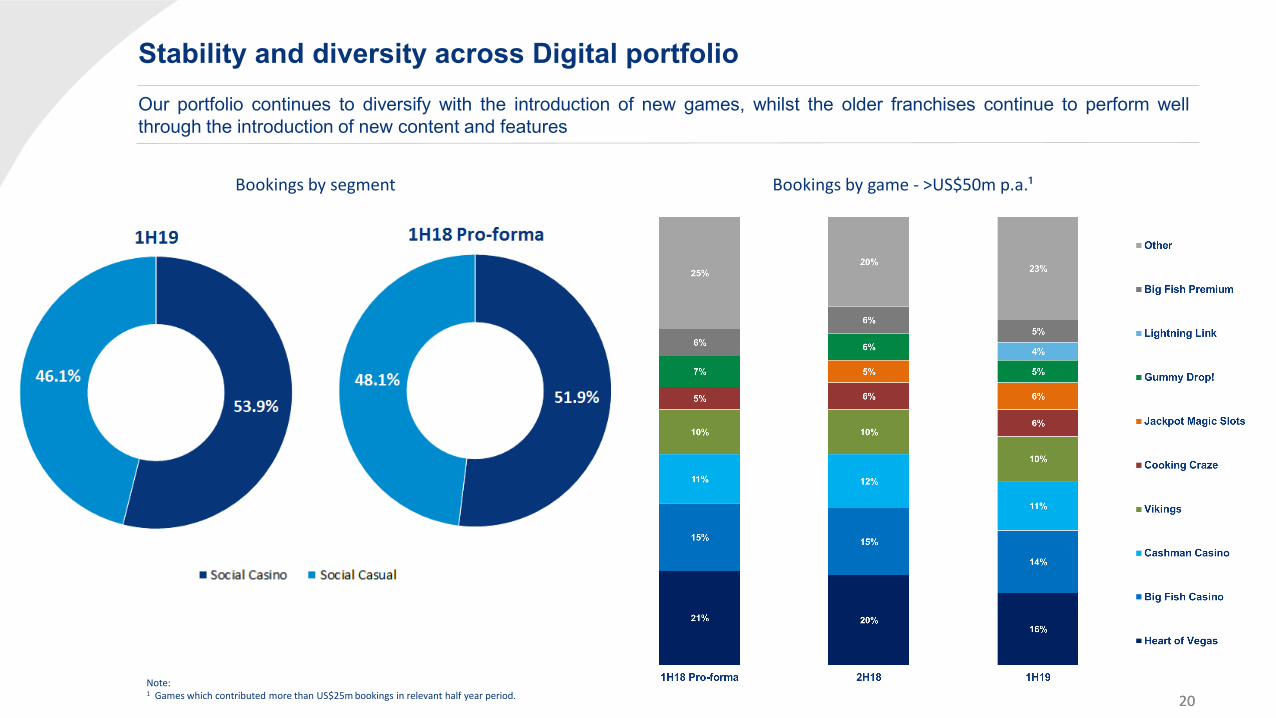
Stability and diversity across Digital portfolio Our portfolio continues to diversify with the introduction of new games, whilst the older franchises continue to perform well through the introduction of new content and features
Bookings by game - >US$50m p.a.¹
Note: 1 Games which contributed more than US$25m bookings in relevant half year period.
Bookings by segment
21 21
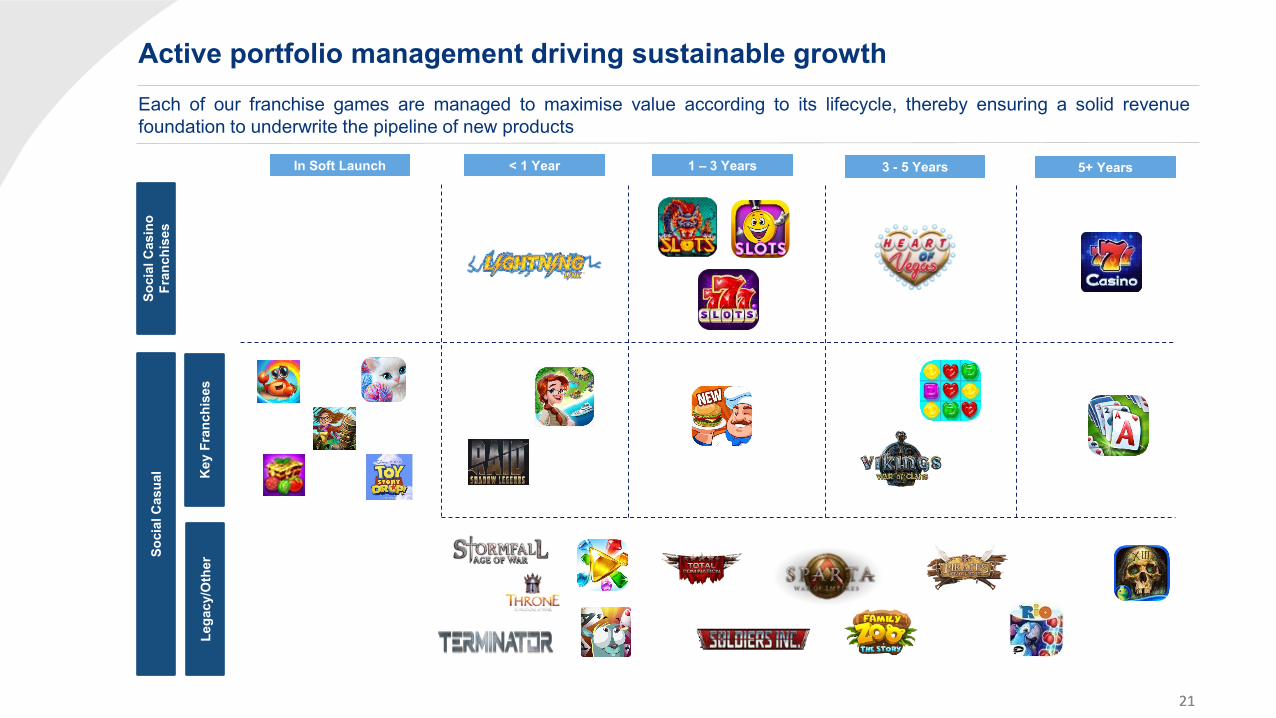
Active portfolio management driving sustainable growth Each of our franchise games are managed to maximise value according to its lifecycle, thereby ensuring a solid revenue foundation to underwrite the pipeline of new products
In Soft Launch < 1 Year 1 – 3 Years 3 - 5 Years So
cial
Cas
ino
Fran
chis
es
Key
Fra
nchi
ses
Lega
cy/O
ther
5+ Years So
cial
Cas
ual
22 22
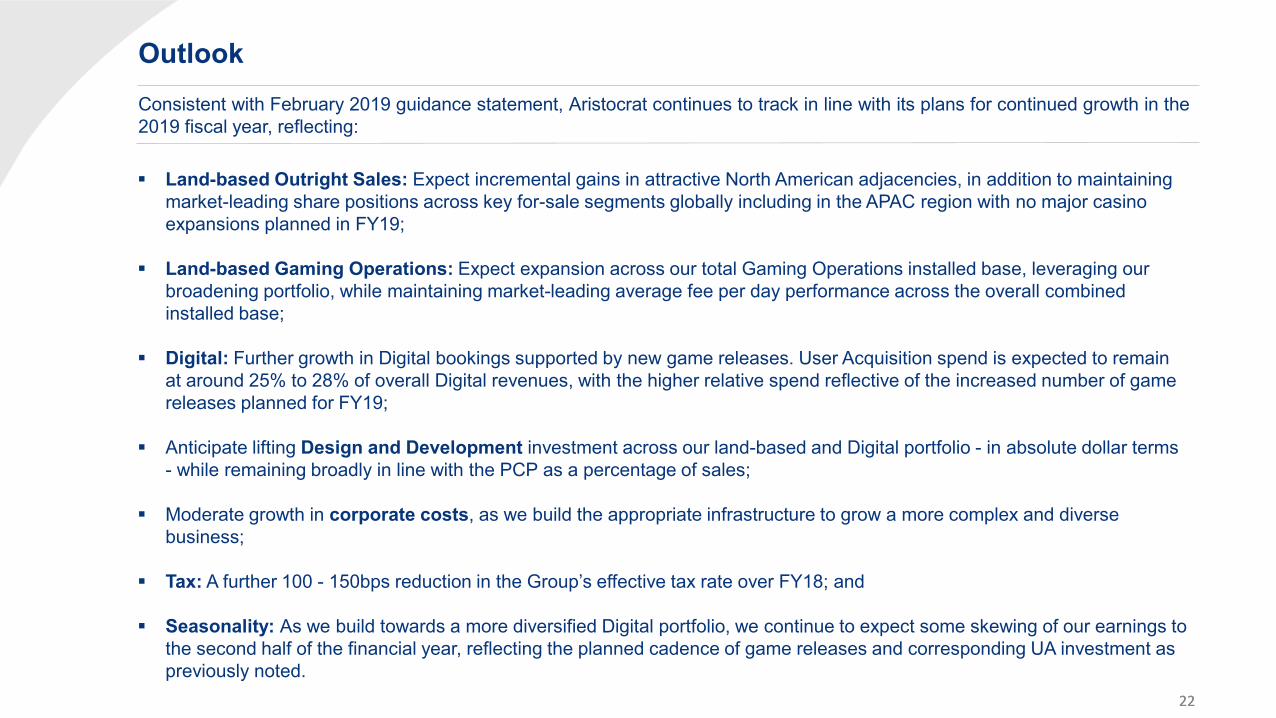
Outlook Consistent with February 2019 guidance statement, Aristocrat continues to track in line with its plans for continued growth in the 2019 fiscal year, reflecting:
Land-based Outright Sales: Expect incremental gains in attractive North American adjacencies, in addition to maintaining market-leading share positions across key for-sale segments globally including in the APAC region with no major casino expansions planned in FY19;
Land-based Gaming Operations: Expect expansion across our total Gaming Operations installed base, leveraging our
broadening portfolio, while maintaining market-leading average fee per day performance across the overall combined installed base;
Digital: Further growth in Digital bookings supported by new game releases. User Acquisition spend is expected to remain
at around 25% to 28% of overall Digital revenues, with the higher relative spend reflective of the increased number of game releases planned for FY19;
Anticipate lifting Design and Development investment across our land-based and Digital portfolio - in absolute dollar terms
- while remaining broadly in line with the PCP as a percentage of sales;
Moderate growth in corporate costs, as we build the appropriate infrastructure to grow a more complex and diverse business;
Tax: A further 100 - 150bps reduction in the Group’s effective tax rate over FY18; and
Seasonality: As we build towards a more diversified Digital portfolio, we continue to expect some skewing of our earnings to the second half of the financial year, reflecting the planned cadence of game releases and corresponding UA investment as previously noted.
23 23
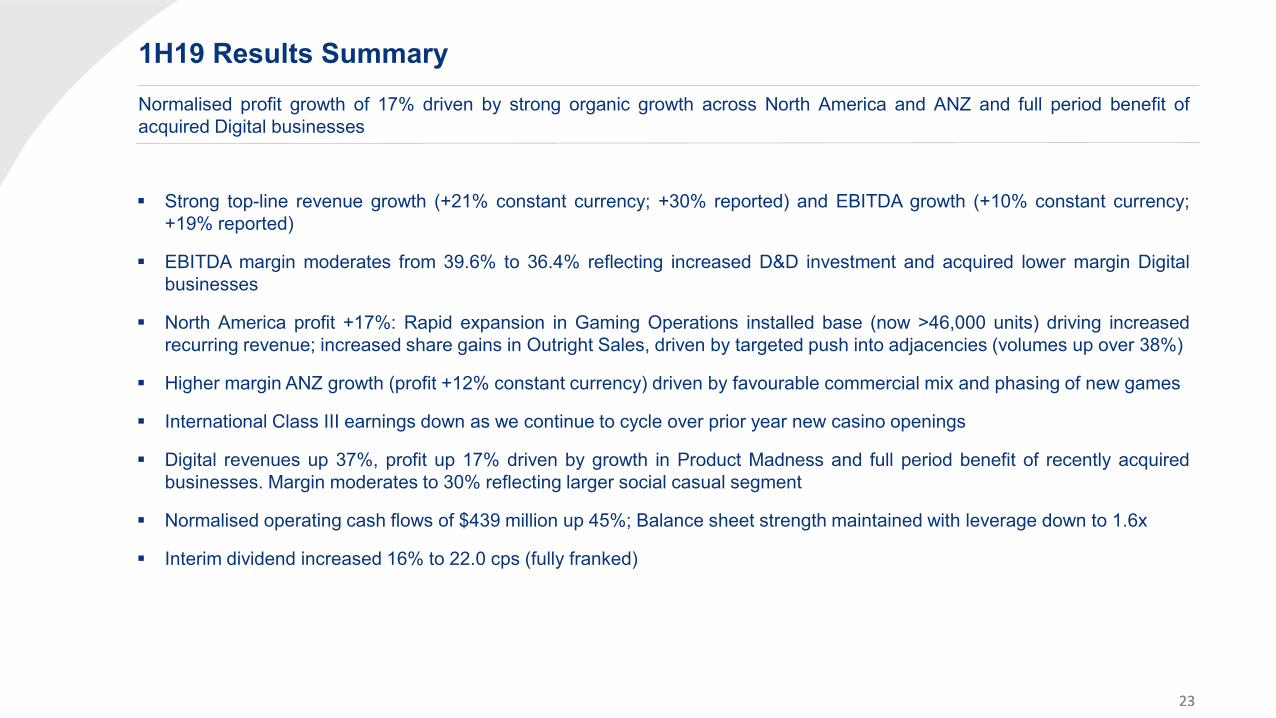
1H19 Results Summary Normalised profit growth of 17% driven by strong organic growth across North America and ANZ and full period benefit of acquired Digital businesses
Strong top-line revenue growth (+21% constant currency; +30% reported) and EBITDA growth (+10% constant currency; +19% reported)
EBITDA margin moderates from 39.6% to 36.4% reflecting increased D&D investment and acquired lower margin Digital businesses
North America profit +17%: Rapid expansion in Gaming Operations installed base (now >46,000 units) driving increased recurring revenue; increased share gains in Outright Sales, driven by targeted push into adjacencies (volumes up over 38%)
Higher margin ANZ growth (profit +12% constant currency) driven by favourable commercial mix and phasing of new games
International Class III earnings down as we continue to cycle over prior year new casino openings
Digital revenues up 37%, profit up 17% driven by growth in Product Madness and full period benefit of recently acquired businesses. Margin moderates to 30% reflecting larger social casual segment
Normalised operating cash flows of $439 million up 45%; Balance sheet strength maintained with leverage down to 1.6x
Interim dividend increased 16% to 22.0 cps (fully franked)
24
Group Results Summary
Results Summary
Outlook
Operational Performance
2
3
4
5
6 Q&A
7 Appendices
Strategy Update 1
25 25
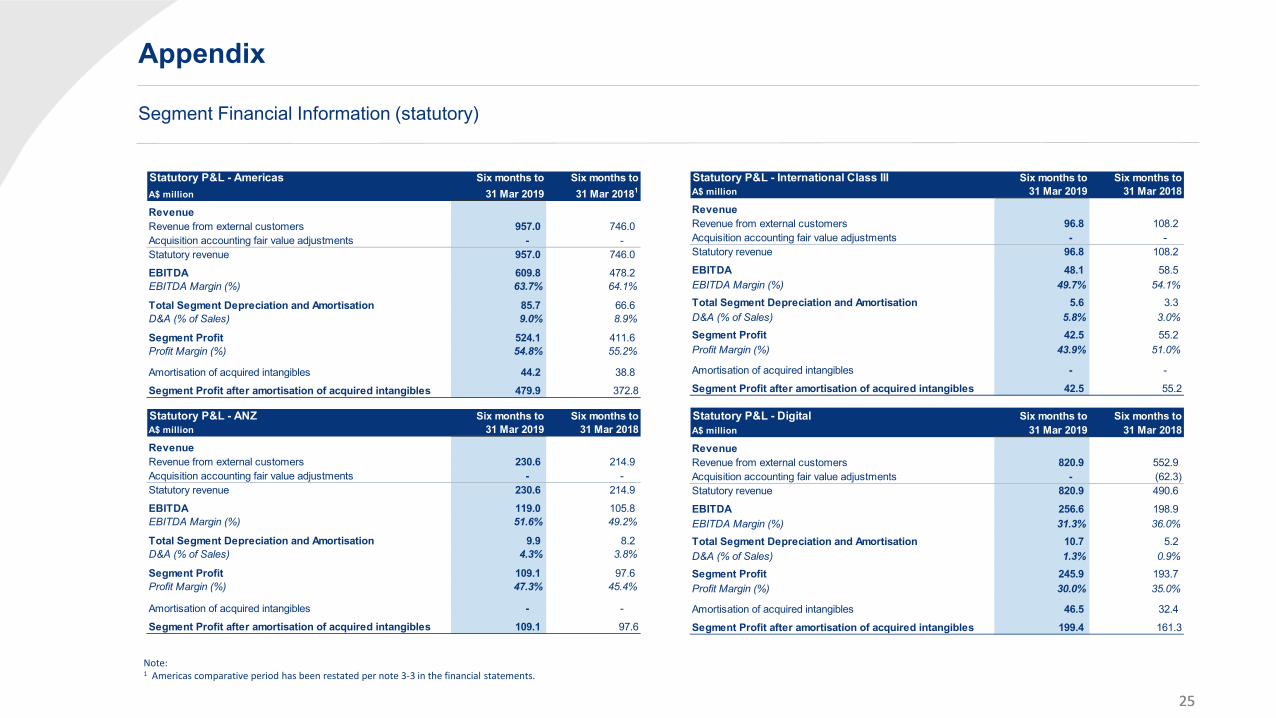
Appendix
Segment Financial Information (statutory)
Note: 1 Americas comparative period has been restated per note 3-3 in the financial statements.
Statutory P&L - Americas Six months to Six months toA$ million 31 Mar 2019 31 Mar 20181
RevenueRevenue from external customers 957.0 746.0 Acquisition accounting fair value adjustments - - Statutory revenue 957.0 746.0
EBITDA 609.8 478.2 EBITDA Margin (%) 63.7% 64.1%
Total Segment Depreciation and Amortisation 85.7 66.6 D&A (% of Sales) 9.0% 8.9%
Segment Profit 524.1 411.6 Profit Margin (%) 54.8% 55.2%
Amortisation of acquired intangibles 44.2 38.8
Segment Profit after amortisation of acquired intangibles 479.9 372.8
Statutory P&L - ANZ Six months to Six months toA$ million 31 Mar 2019 31 Mar 2018RevenueRevenue from external customers 230.6 214.9 Acquisition accounting fair value adjustments - - Statutory revenue 230.6 214.9
EBITDA 119.0 105.8 EBITDA Margin (%) 51.6% 49.2%
Total Segment Depreciation and Amortisation 9.9 8.2 D&A (% of Sales) 4.3% 3.8%
Segment Profit 109.1 97.6 Profit Margin (%) 47.3% 45.4%
Amortisation of acquired intangibles - -
Segment Profit after amortisation of acquired intangibles 109.1 97.6
Statutory P&L - International Class III Six months to Six months toA$ million 31 Mar 2019 31 Mar 2018RevenueRevenue from external customers 96.8 108.2 Acquisition accounting fair value adjustments - - Statutory revenue 96.8 108.2
EBITDA 48.1 58.5 EBITDA Margin (%) 49.7% 54.1%
Total Segment Depreciation and Amortisation 5.6 3.3 D&A (% of Sales) 5.8% 3.0%
Segment Profit 42.5 55.2 Profit Margin (%) 43.9% 51.0%
Amortisation of acquired intangibles - -
Segment Profit after amortisation of acquired intangibles 42.5 55.2
Statutory P&L - Digital Six months to Six months toA$ million 31 Mar 2019 31 Mar 2018RevenueRevenue from external customers 820.9 552.9 Acquisition accounting fair value adjustments - (62.3) Statutory revenue 820.9 490.6
EBITDA 256.6 198.9 EBITDA Margin (%) 31.3% 36.0%
Total Segment Depreciation and Amortisation 10.7 5.2 D&A (% of Sales) 1.3% 0.9%
Segment Profit 245.9 193.7 Profit Margin (%) 30.0% 35.0%
Amortisation of acquired intangibles 46.5 32.4
Segment Profit after amortisation of acquired intangibles 199.4 161.3
26 26
Appendix
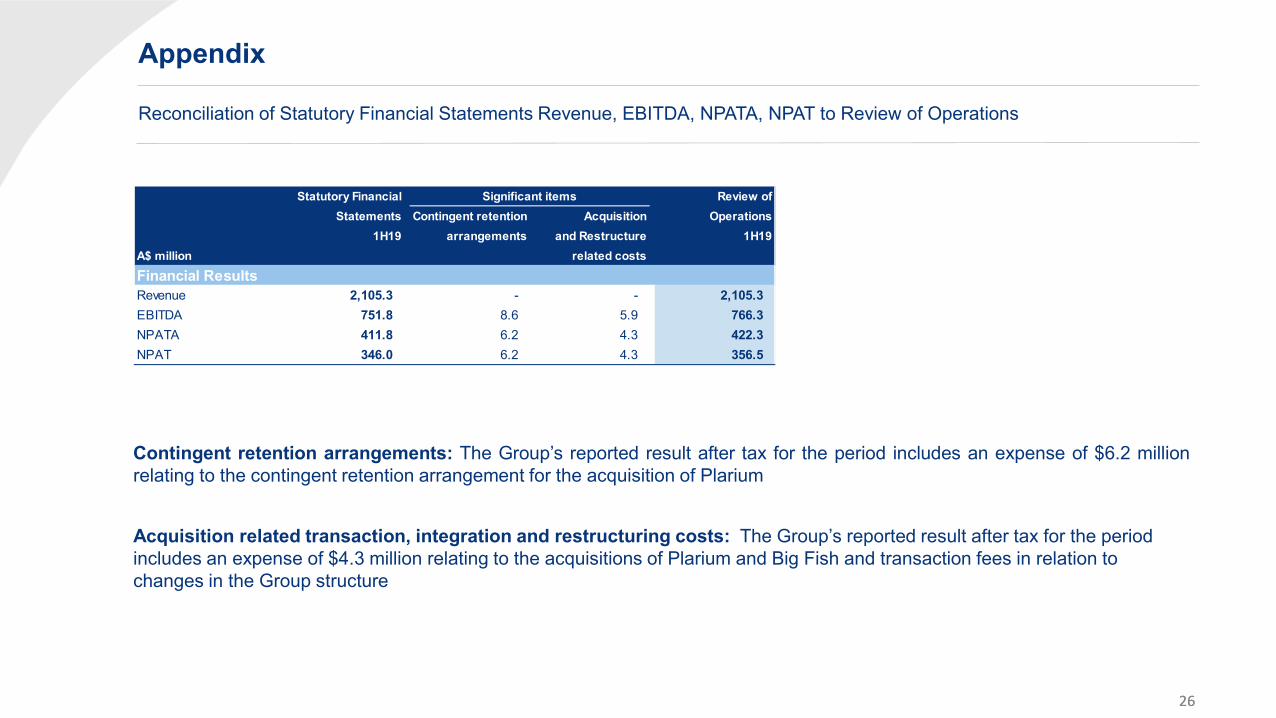
Reconciliation of Statutory Financial Statements Revenue, EBITDA, NPATA, NPAT to Review of Operations
Contingent retention arrangements: The Group’s reported result after tax for the period includes an expense of $6.2 million relating to the contingent retention arrangement for the acquisition of Plarium
Acquisition related transaction, integration and restructuring costs: The Group’s reported result after tax for the period includes an expense of $4.3 million relating to the acquisitions of Plarium and Big Fish and transaction fees in relation to changes in the Group structure
Statutory Financial Review ofStatements Contingent retention Acquisition Operations
1H19 arrangements and Restructure 1H19A$ million related costs
Financial ResultsRevenue 2,105.3 - - 2,105.3EBITDA 751.8 8.6 5.9 766.3NPATA 411.8 6.2 4.3 422.3NPAT 346.0 6.2 4.3 356.5
Significant items