Embed Size (px)
Citation preview

© Vista Outdoor | Proprietary© Vista Outdoor | ProprietaryMay 2018
Investor Overview
© 2018 | Vista Outdoor Presentation 2
Forward Looking Statements
Certain statements in this press release and other oral and written statements made by Vista Outdoor from time to time are forward-looking
statements, including those that discuss, among other things: Vista Outdoor’s plans, objectives, expectations, intentions, strategies, goals,
outlook or other non-historical matters; projections with respect to future revenues, income, earnings per share or other financial measures
for Vista Outdoor; and the assumptions that underlie these matters. The words ‘believe’, ‘expect’, ‘anticipate’, ‘intend’, ‘aim’, ‘should’ and
similar expressions are intended to identify such forward-looking statements. To the extent that any such information is forward-looking, it is
intended to fit within the safe harbor for forward-looking information provided by the Private Securities Litigation Reform Act of 1995.
Numerous risks, uncertainties and other factors could cause Vista Outdoor’s actual results to differ materially from expectations described in
such forward-looking statements, including the following: general economic and business conditions in the U.S. and Vista Outdoor’s other
markets, including conditions affecting employment levels, consumer confidence and spending; Vista Outdoor’s ability to attract and
retain key personnel and maintain and grow its relationships with customers, suppliers and other business partners, including Vista Outdoor’s
ability to obtain acceptable third party licenses; Vista Outdoor’s ability to adapt its products to changes in technology, the marketplace
and customer preferences; Vista Outdoor’s ability to maintain and enhance brand recognition and reputation; use of social media to
disseminate negative commentary and boycotts; reductions, unexpected changes in or our inability to accurately forecast demand for
ammunition, firearms or accessories or other outdoor sports and recreation products; risks associated with Vista Outdoor’s sales to significant
retail customers, including unexpected cancellations, delays and other changes to purchase orders; supplier capacity constraints,
production disruptions or quality or price issues affecting Vista Outdoor’s operating costs; Vista Outdoor’s competitive environment; risks
associated with compliance and diversification into international and commercial markets; the supply, availability and costs of raw
materials and components; increases in commodity, energy and production costs; changes in laws, rules and regulations relating to Vista
Outdoor’s business, such as federal and state firearms and ammunition regulations; Vista Outdoor’s ability to execute its long-term growth
strategy, including our ability to complete and realize expected benefits from acquisitions and integrate acquired businesses; Vista
Outdoor’s ability to take advantage of growth opportunities in international and commercial markets; foreign currency exchange rates and
fluctuations in those rates; the outcome of contingencies, including with respect to litigation and other proceedings relating to intellectual
property, product liability, warranty liability, personal injury and environmental remediation; risks associated with cybersecurity and other
industrial and physical security threats; capital market volatility and the availability of financing; changes to accounting standards or
policies; and changes in tax rules or pronouncements.
Vista Outdoor undertakes no obligation to update any forward-looking statements. For further information on factors that could impact
Vista Outdoor, and statements contained herein, please refer to Vista Outdoor’s filings with the Securities and Exchange Commission.
© 2018 | Vista Outdoor Presentation 3
Non-GAAP Financial Measures
Non-GAAP financial measures such as earnings before interest, tax, depreciation and amortization (“EBITDA”), Adjusted EBITDA, EB ITDA
Margin and Free Cash Flow as included in this Presentation are supplemental measures that are not calculated in accordance with
Generally Accepted Accounting Principles (“GAAP”). Please see the Appendix to this presentation for reconciliations of these Non-GAAP
financial measures to their comparable GAAP financial measures.
We define Adjusted EBITDA as EBITDA adjusted for the impact of costs incurred for contingent consideration, transaction costs, CEO/CFO
transition costs, pension curtailment, goodwill and intangible asset impairment, transition costs, tax reform, reorganization, the impact of a
gain recorded on an acquisition claim settlement, and acquisition inventory step-up. We believe that the presentation of EBITDA and
Adjusted EBITDA helps investors analyze underlying trends in our business, evaluate the performance of our business both on an absolute
basis and relative to our peers and the broader market, provides useful information to both management and investors by excluding
certain items that may not be indicative of the core operating results and operational strength of our business and helps investors evaluate
our ability to service our debt.
We define EBITDA margin as EBITDA divided by net sales. We believe EBITDA margin provides investors with an important perspective on the
company's core profitability and helps investors analyze underlying trends in the company's business and evaluate its performance on an
absolute basis and relative to its peers. EBITDA margin should be considered in addition to, and not as a substitute for, GAAP net profit
margin. Our definition may differ from that used by other companies. Vista Outdoor has not reconciled EBITDA margin guidance to GAAP
net profit margin guidance because Vista Outdoor does not provide guidance for net income, which is a reconciling item between GAAP
net profit margin and non-GAAP EBITDA margin. Accordingly, a reconciliation to net profit margin is not available without unreasonable
effort.
We define Free cash flow as cash provided by (used for) operating activities less capital expenditures and excluding transaction,
contingent consideration, CEO/CFO transition, reorganization, and acquisition claim settlement costs net of taxes incurred to date. Vista
Outdoor management believes free cash flow provides investors with an important perspective on the cash available for debt repayment,
share repurchases and acquisitions after making the capital investments required to support ongoing business operations. Vista Outdoor
management uses free cash flow internally to assess both business performance and overall liquidity.
These non-GAAP financial measures have limitations as analytical and comparative tools and you should consider EBITDA, Adjusted EBITDA,
EBITDA Margin and Free Cash Flow in addition to, and not as a substitute for, operating income, cash from operating activities or any other
measure of financial performance or liquidity reported in accordance with GAAP. Throughout the presentation, certain numbers will not
sum to the total due to rounding.

© 2018 | Vista Outdoor Presentation
Overview and
Investment Highlights
4
© 2018 | Vista Outdoor Presentation 5
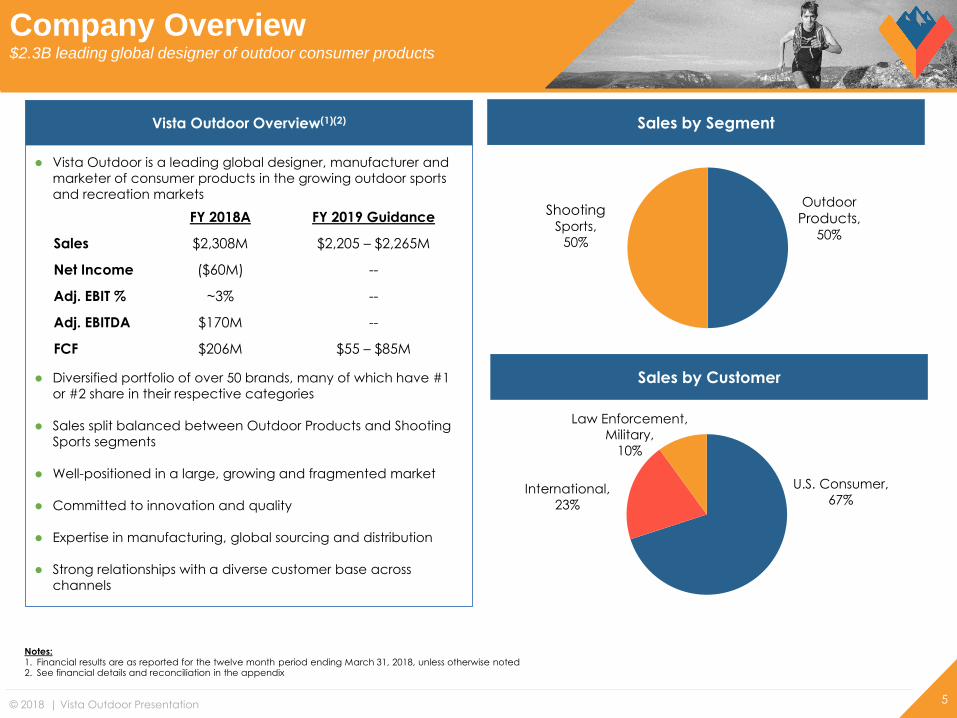
Vista Outdoor is a leading global designer, manufacturer and
marketer of consumer products in the growing outdoor sports
and recreation markets
Diversified portfolio of over 50 brands, many of which have #1
or #2 share in their respective categories
Sales split balanced between Outdoor Products and Shooting
Sports segments
Well-positioned in a large, growing and fragmented market
Committed to innovation and quality
Expertise in manufacturing, global sourcing and distribution
Strong relationships with a diverse customer base across
channels
Vista Outdoor Overview(1)(2)
Company Overview$2.3B leading global designer of outdoor consumer products
Sales by Customer
U.S. Consumer,
67%
Law Enforcement,
Military,
10%
International,
23%
Sales by Segment
ShootingSports,
50%
Outdoor
Products,50%
Notes:1. Financial results are as reported for the twelve month period ending March 31, 2018, unless otherwise noted2. See financial details and reconciliation in the appendix
FY 2018A FY 2019 Guidance
Sales $2,308M $2,205 – $2,265M
Net Income ($60M) --
Adj. EBIT % ~3% --
Adj. EBITDA $170M --
FCF $206M $55 – $85M
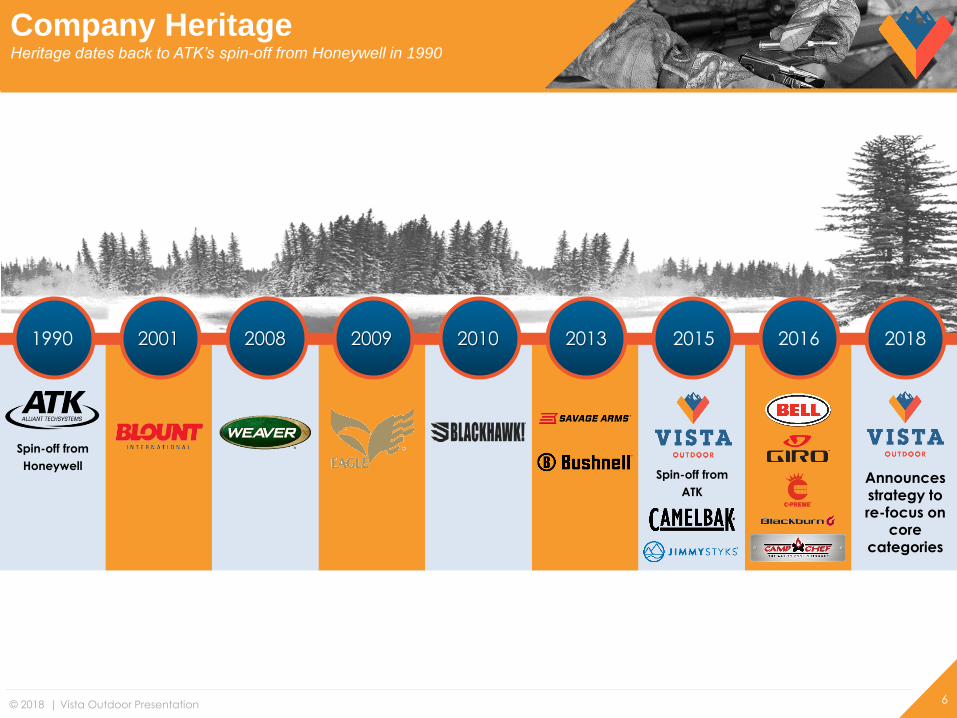
© 2018 | Vista Outdoor Presentation 6
2001 20102008 2013 20151990 2009
Spin-off from
ATK
Spin-off from
Honeywell
2016
Company HeritageHeritage dates back to ATK’s spin-off from Honeywell in 1990
2018
Announces strategy to re-focus on
core categories
© 2018 | Vista Outdoor Presentation 7
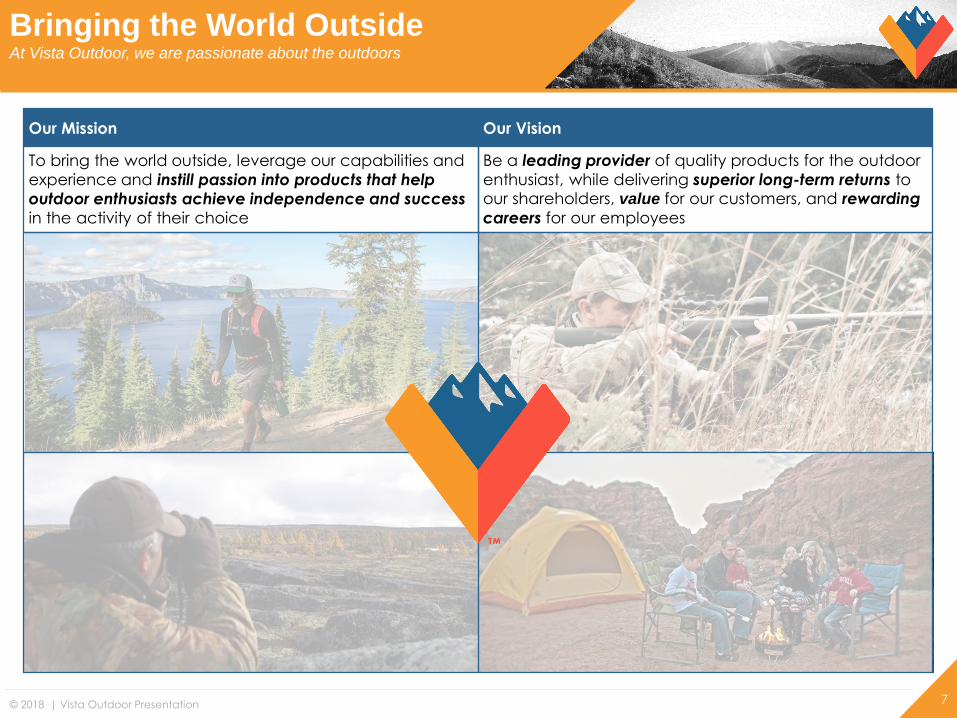
Bringing the World OutsideAt Vista Outdoor, we are passionate about the outdoors
Our Vision
Be a leading provider of quality products for the outdoor
enthusiast, while delivering superior long-term returns to our shareholders, value for our customers, and rewarding
careers for our employees
Our Mission
To bring the world outside, leverage our capabilities and
experience and instill passion into products that help
outdoor enthusiasts achieve independence and success
in the activity of their choice
© 2018 | Vista Outdoor Presentation
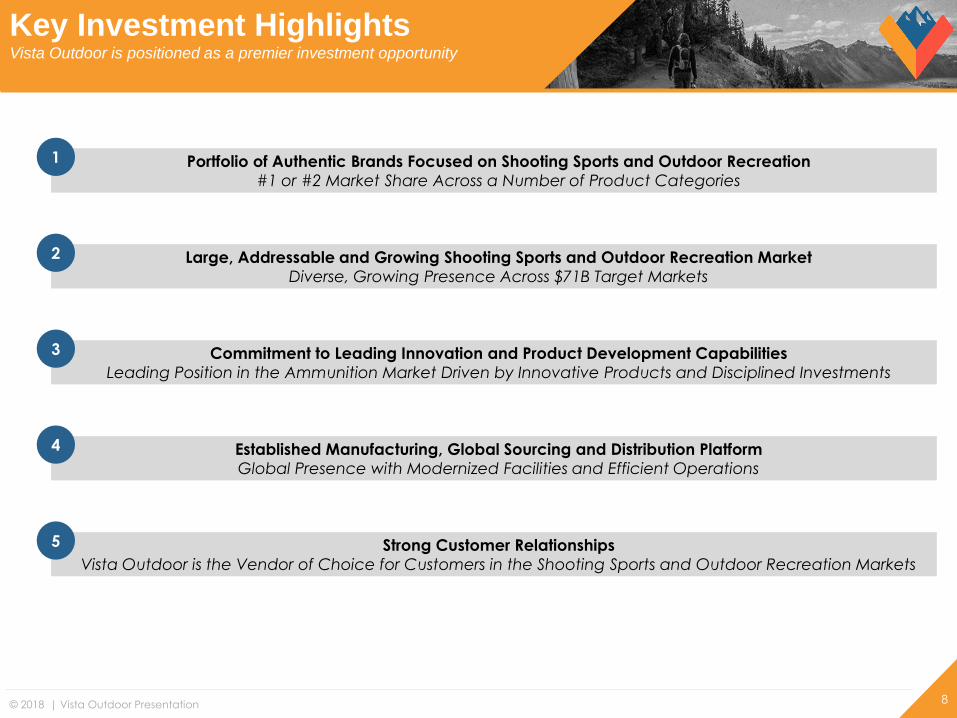
Strong Customer Relationships
Vista Outdoor is the Vendor of Choice for Customers in the Shooting Sports and Outdoor Recreation Markets
5
8
Portfolio of Authentic Brands Focused on Shooting Sports and Outdoor Recreation
#1 or #2 Market Share Across a Number of Product Categories
1
Large, Addressable and Growing Shooting Sports and Outdoor Recreation Market
Diverse, Growing Presence Across $71B Target Markets
2
Commitment to Leading Innovation and Product Development Capabilities
Leading Position in the Ammunition Market Driven by Innovative Products and Disciplined Investments
3
Established Manufacturing, Global Sourcing and Distribution Platform
Global Presence with Modernized Facilities and Efficient Operations
4
Key Investment HighlightsVista Outdoor is positioned as a premier investment opportunity
© 2018 | Vista Outdoor Presentation
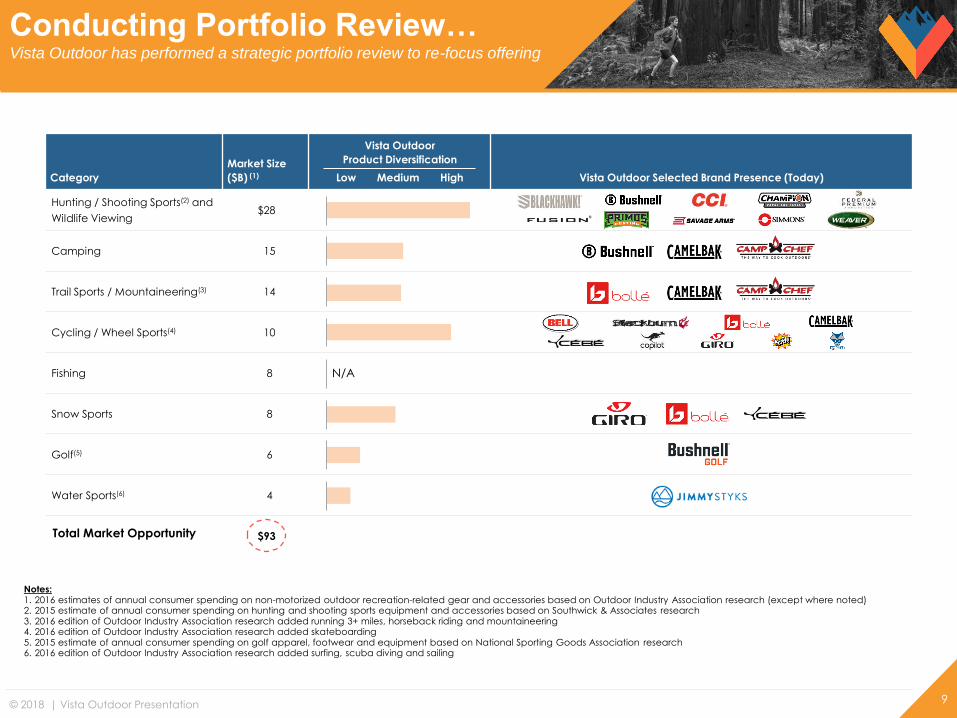
Conducting Portfolio Review…Vista Outdoor has performed a strategic portfolio review to re-focus offering
9
Category
Market Size
($B) (1)
Vista Outdoor
Product Diversification
Low Medium High Vista Outdoor Selected Brand Presence (Today)
Hunting / Shooting Sports(2) and
Wildlife Viewing$28
Camping 15
Trail Sports / Mountaineering(3) 14
Cycling / Wheel Sports(4) 10
Fishing 8
Snow Sports 8
Golf(5) 6
Water Sports(6) 4
$93
Notes:1. 2016 estimates of annual consumer spending on non-motorized outdoor recreation-related gear and accessories based on Outdoor Industry Association research (except where noted)2. 2015 estimate of annual consumer spending on hunting and shooting sports equipment and accessories based on Southwick & Associates research3. 2016 edition of Outdoor Industry Association research added running 3+ miles, horseback riding and mountaineering4. 2016 edition of Outdoor Industry Association research added skateboarding5. 2015 estimate of annual consumer spending on golf apparel, footwear and equipment based on National Sporting Goods Association research6. 2016 edition of Outdoor Industry Association research added surfing, scuba diving and sailing
Total Market Opportunity
N/A
© 2018 | Vista Outdoor Presentation
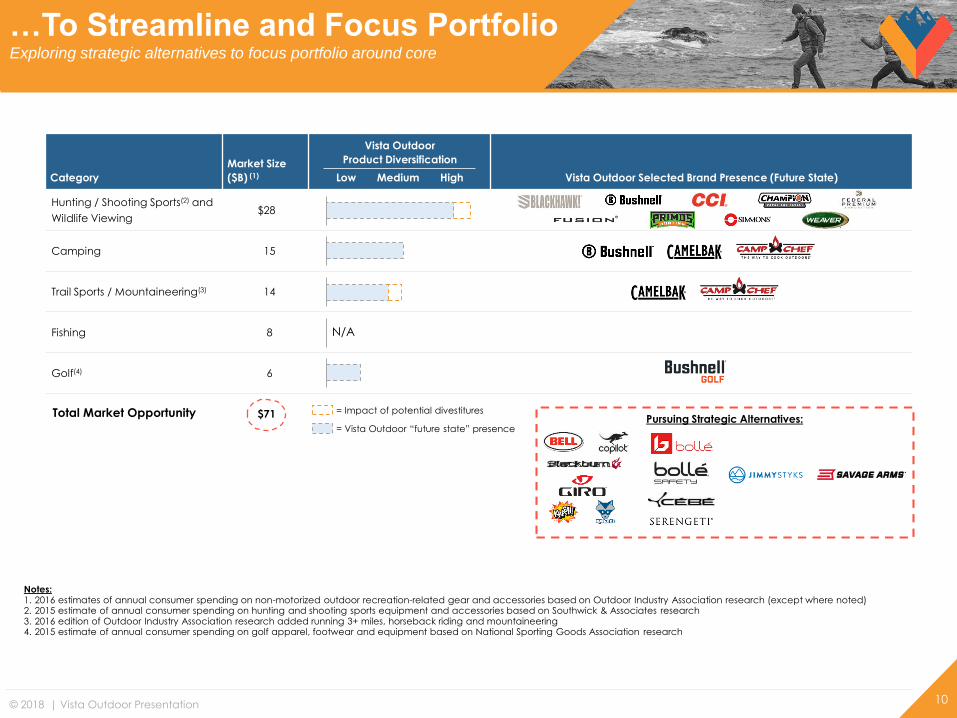
…To Streamline and Focus PortfolioExploring strategic alternatives to focus portfolio around core
10
Category
Market Size
($B) (1)
Vista Outdoor
Product Diversification
Low Medium High Vista Outdoor Selected Brand Presence (Future State)
Hunting / Shooting Sports(2) and
Wildlife Viewing$28
Camping 15
Trail Sports / Mountaineering(3) 14
Fishing 8
Golf(4) 6
$71 = Impact of potential divestituresTotal Market Opportunity
N/A
= Vista Outdoor “future state” presencePursuing Strategic Alternatives:
Notes:1. 2016 estimates of annual consumer spending on non-motorized outdoor recreation-related gear and accessories based on Outdoor Industry Association research (except where noted)2. 2015 estimate of annual consumer spending on hunting and shooting sports equipment and accessories based on Southwick & Associates research3. 2016 edition of Outdoor Industry Association research added running 3+ miles, horseback riding and mountaineering4. 2015 estimate of annual consumer spending on golf apparel, footwear and equipment based on National Sporting Goods Association research
© 2018 | Vista Outdoor Presentation
$0.0
$0.5
$1.0
$1.5
$2.0
$2.5
$3.0
$3.5
19
92
19
93
19
94
19
95
19
96
19
97
19
98
19
99
20
00
20
01
20
02
20
03
20
04
20
05
20
06
20
07
20
08
20
09
20
10
20
11
20
12
20
13
20
14
20
15
20
16
LTM
Se
p-1
7
11
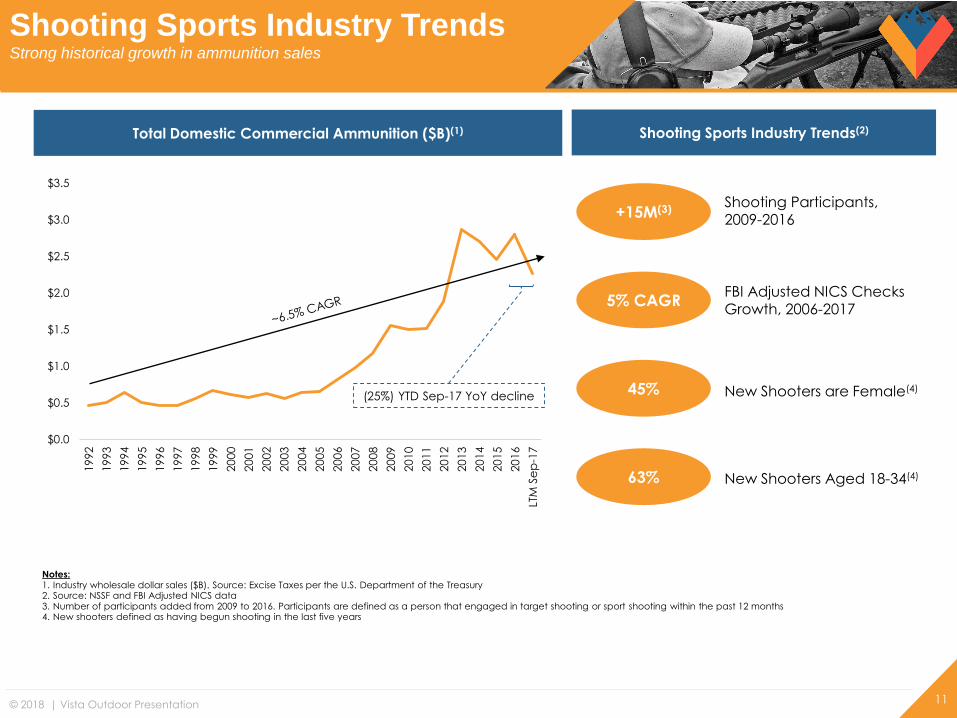
Shooting Sports Industry TrendsStrong historical growth in ammunition sales
Total Domestic Commercial Ammunition ($B)(1) Shooting Sports Industry Trends(2)
+15M(3)
45%
5% CAGR
63%
Shooting Participants,2009-2016
FBI Adjusted NICS Checks
Growth, 2006-2017
New Shooters are Female(4)
New Shooters Aged 18-34(4)
Notes:1. Industry wholesale dollar sales ($B). Source: Excise Taxes per the U.S. Department of the Treasury2. Source: NSSF and FBI Adjusted NICS data3. Number of participants added from 2009 to 2016. Participants are defined as a person that engaged in target shooting or sport shooting within the past 12 months4. New shooters defined as having begun shooting in the last five years
(25%) YTD Sep-17 YoY decline
© 2018 | Vista Outdoor Presentation
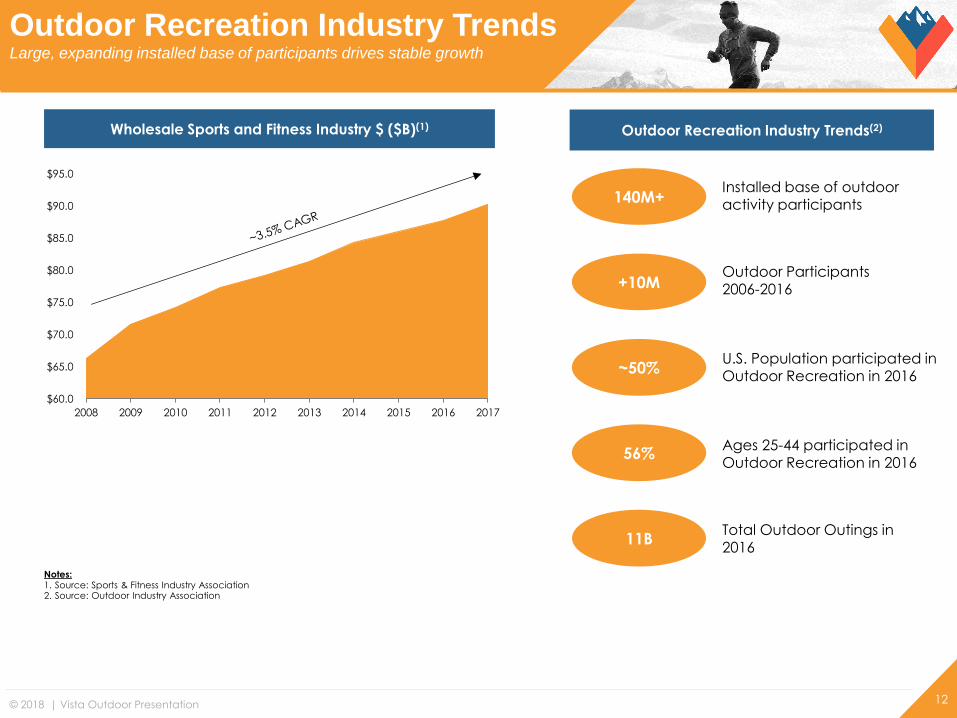
$60.0
$65.0
$70.0
$75.0
$80.0
$85.0
$90.0
$95.0
2008 2009 2010 2011 2012 2013 2014 2015 2016 2017
12
Outdoor Recreation Industry TrendsLarge, expanding installed base of participants drives stable growth
Outdoor Recreation Industry Trends(2)
+10MOutdoor Participants2006-2016
11BTotal Outdoor Outings in 2016
~50%U.S. Population participated in Outdoor Recreation in 2016
56%Ages 25-44 participated in Outdoor Recreation in 2016
140M+Installed base of outdoor activity participants
Notes:1. Source: Sports & Fitness Industry Association2. Source: Outdoor Industry Association
Wholesale Sports and Fitness Industry $ ($B)(1)
© 2018 | Vista Outdoor Presentation
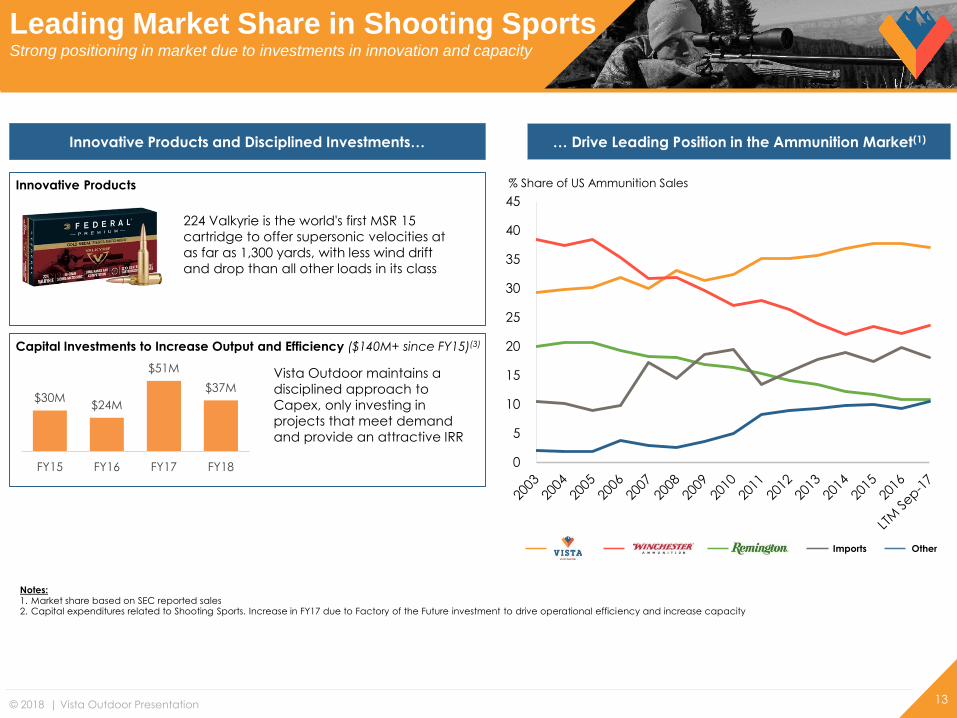
$30M$24M
$51M
$37M
FY15 FY16 FY17 FY18
13
Innovative Products and Disciplined Investments…
Notes:1. Market share based on SEC reported sales2. Capital expenditures related to Shooting Sports. Increase in FY17 due to Factory of the Future investment to drive operational efficiency and increase capacity
Innovative Products
224 Valkyrie is the world's first MSR 15
cartridge to offer supersonic velocities at
as far as 1,300 yards, with less wind drift
and drop than all other loads in its class
Capital Investments to Increase Output and Efficiency ($140M+ since FY15)(3)
Vista Outdoor maintains a
disciplined approach to
Capex, only investing in
projects that meet demand
and provide an attractive IRR
Leading Market Share in Shooting SportsStrong positioning in market due to investments in innovation and capacity
0
5
10
15
20
25
30
35
40
45
… Drive Leading Position in the Ammunition Market(1)
% Share of US Ammunition Sales
Imports Other
© 2018 | Vista Outdoor Presentation
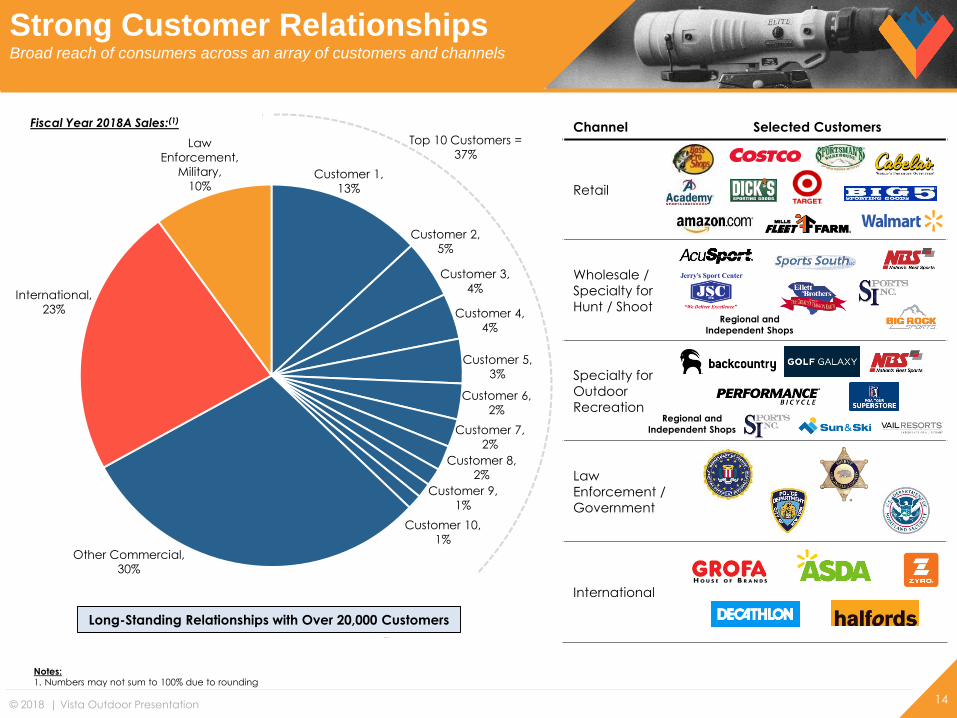
Channel Selected Customers
Retail
Wholesale /
Specialty for
Hunt / Shoot
Specialty for
Outdoor
Recreation
Law
Enforcement /
Government
International
14
Strong Customer RelationshipsBroad reach of consumers across an array of customers and channels
International,
23%
Law
Enforcement,
Military,
10%
Other Commercial,
30%
Customer 10,
1%
Customer 9,
1%
Customer 8,
2%
Customer 7,
2%
Customer 6,
2%
Customer 5,
3%
Customer 4,
4%
Customer 3,
4%
Customer 2,
5%
Customer 1,
13%
Top 10 Customers =
37%
Regional and
Independent Shops
Regional and
Independent Shops
Long-Standing Relationships with Over 20,000 Customers
Fiscal Year 2018A Sales:(1)
Notes:1. Numbers may not sum to 100% due to rounding
© 2018 | Vista Outdoor Presentation
Outdoor Products
15
© 2018 | Vista Outdoor Presentation 16
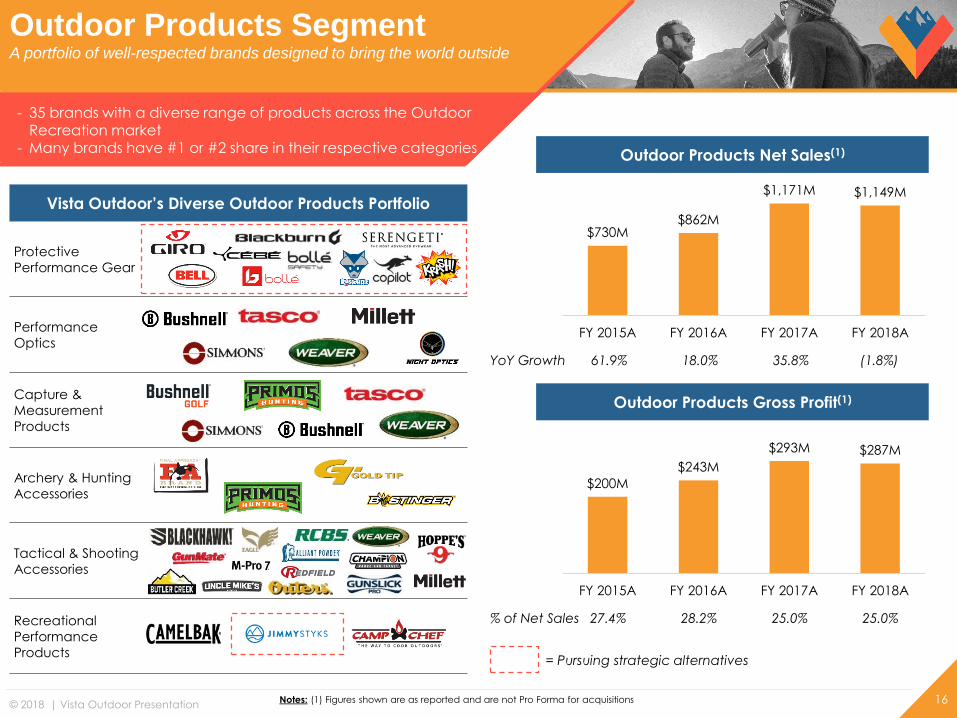
Outdoor Products SegmentA portfolio of well-respected brands designed to bring the world outside
Protective
Performance Gear
Performance
Optics
Capture &
Measurement
Products
Tactical & Shooting
Accessories
Recreational
Performance
Products
$730M$862M
$1,171M $1,149M
FY 2015A FY 2016A FY 2017A FY 2018A
$200M
$243M
$293M $287M
FY 2015A FY 2016A FY 2017A FY 2018A
Outdoor Products Net Sales(1)
Outdoor Products Gross Profit(1)
Vista Outdoor’s Diverse Outdoor Products Portfolio
YoY Growth 61.9% 18.0% 35.8% (1.8%)
% of Net Sales 27.4% 28.2% 25.0% 25.0%
Archery & Hunting
Accessories
Notes: (1) Figures shown are as reported and are not Pro Forma for acquisitions
= Pursuing strategic alternatives
- 35 brands with a diverse range of products across the Outdoor Recreation market
- Many brands have #1 or #2 share in their respective categories
© 2018 | Vista Outdoor Presentation
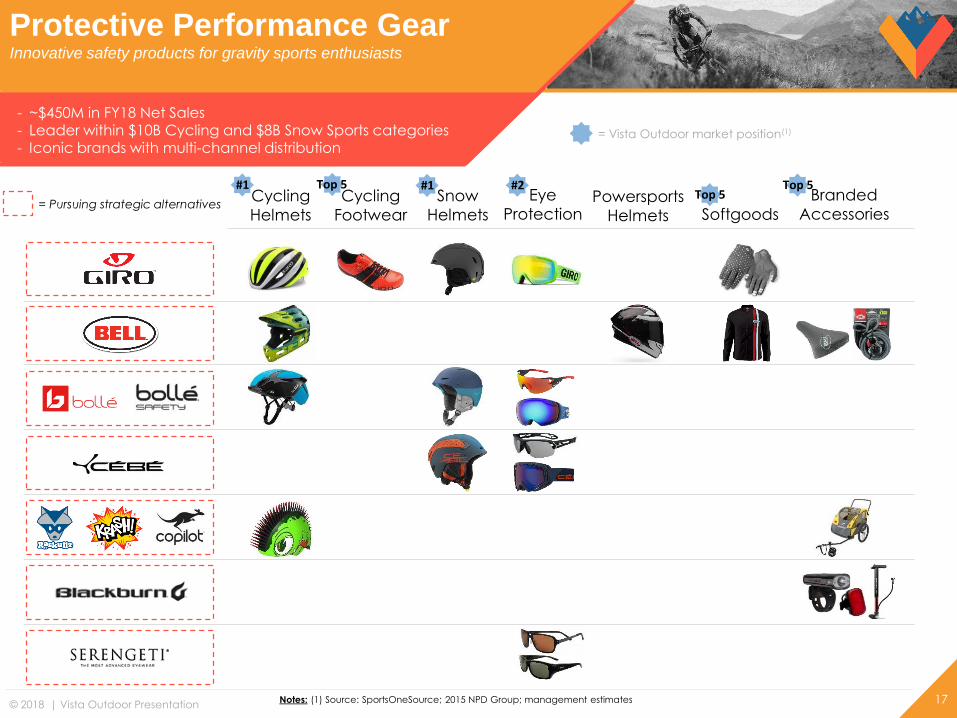
Cycling
Helmets
Cycling
Footwear
Snow
Helmets
Eye
Protection Softgoods
Branded
AccessoriesPowersports
Helmets
- ~$450M in FY18 Net Sales- Leader within $10B Cycling and $8B Snow Sports categories- Iconic brands with multi-channel distribution
#1 Top 5 #1Top 5
Top 5
Notes: (1) Source: SportsOneSource; 2015 NPD Group; management estimates 17
= Vista Outdoor market position(1)
Protective Performance GearInnovative safety products for gravity sports enthusiasts
#2
= Pursuing strategic alternatives
© 2018 | Vista Outdoor Presentation
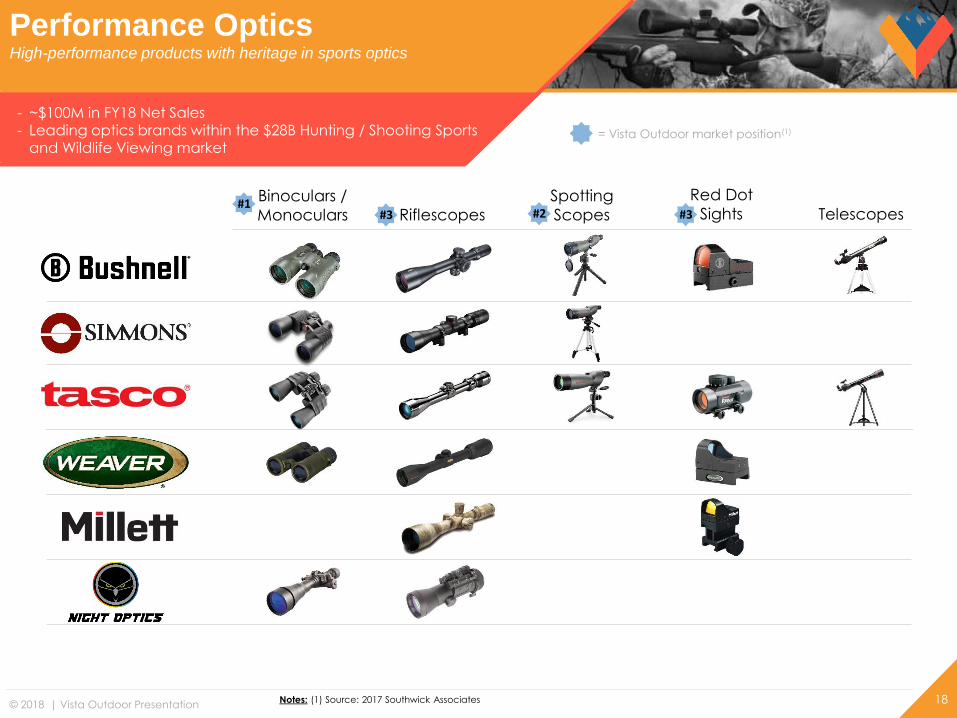
Binoculars /
Monoculars Riflescopes
Spotting
Scopes Telescopes
- ~$100M in FY18 Net Sales- Leading optics brands within the $28B Hunting / Shooting Sports
and Wildlife Viewing market
#1#3 #2
Red Dot
Sights#3
18Notes: (1) Source: 2017 Southwick Associates
= Vista Outdoor market position(1)
Performance OpticsHigh-performance products with heritage in sports optics
© 2018 | Vista Outdoor Presentation
Trail
Cameras
Laser
Rangefinders GPS
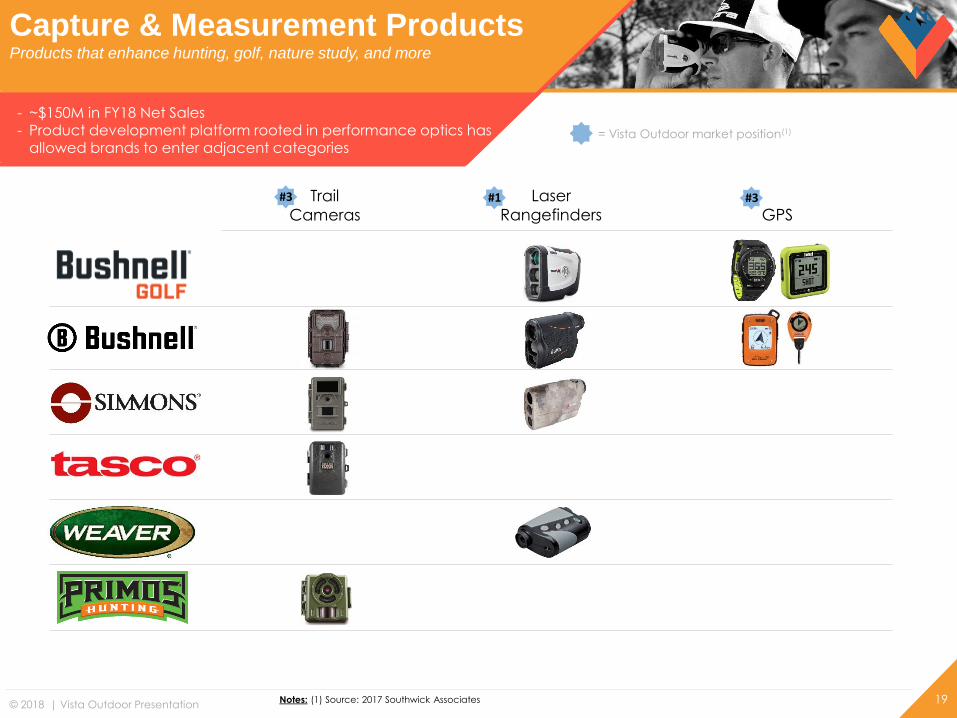
- ~$150M in FY18 Net Sales- Product development platform rooted in performance optics has
allowed brands to enter adjacent categories
#1#3
19
= Vista Outdoor market position(1)
Capture & Measurement ProductsProducts that enhance hunting, golf, nature study, and more
Notes: (1) Source: 2017 Southwick Associates
#3
© 2018 | Vista Outdoor Presentation
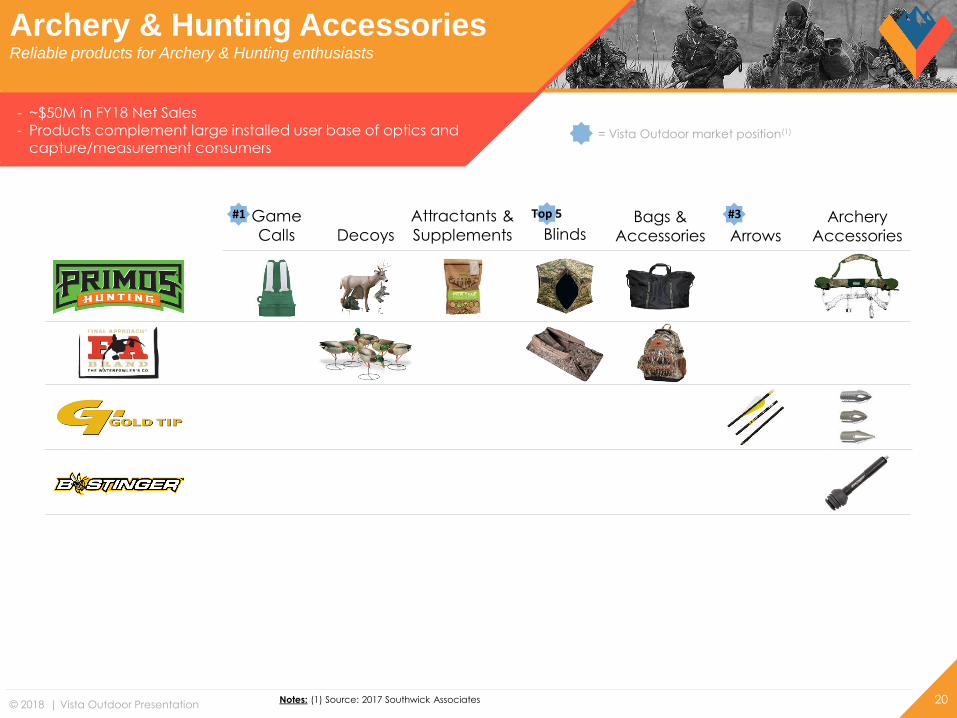
- ~$50M in FY18 Net Sales- Products complement large installed user base of optics and
capture/measurement consumers
Game
Calls Decoys
Attractants &
Supplements BlindsArchery
Accessories
Bags &
Accessories Arrows
#1 Top 5 #3
20Notes: (1) Source: 2017 Southwick Associates
= Vista Outdoor market position(1)
Archery & Hunting AccessoriesReliable products for Archery & Hunting enthusiasts
© 2018 | Vista Outdoor Presentation
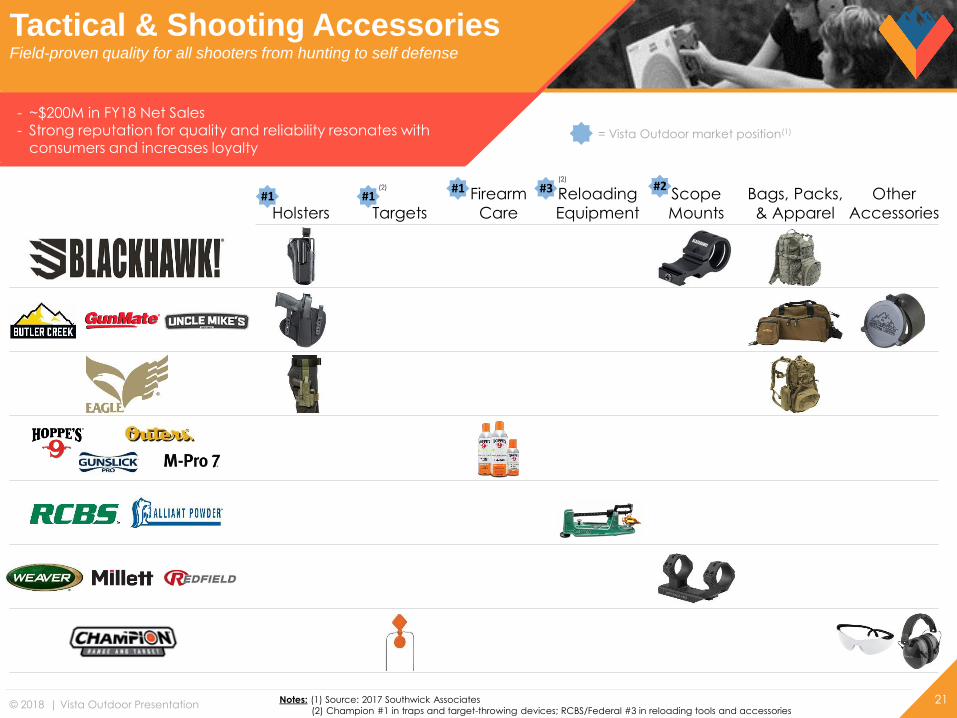
- ~$200M in FY18 Net Sales- Strong reputation for quality and reliability resonates with
consumers and increases loyalty
Holsters Targets
Firearm
Care
Reloading
Equipment
Other
Accessories
Scope
Mounts
Bags, Packs,
& Apparel
#2#1 #3#1#1
21
= Vista Outdoor market position(1)
Notes: (1) Source: 2017 Southwick Associates
(2) Champion #1 in traps and target-throwing devices; RCBS/Federal #3 in reloading tools and accessories
(2)
(2)
Tactical & Shooting AccessoriesField-proven quality for all shooters from hunting to self defense
© 2018 | Vista Outdoor Presentation
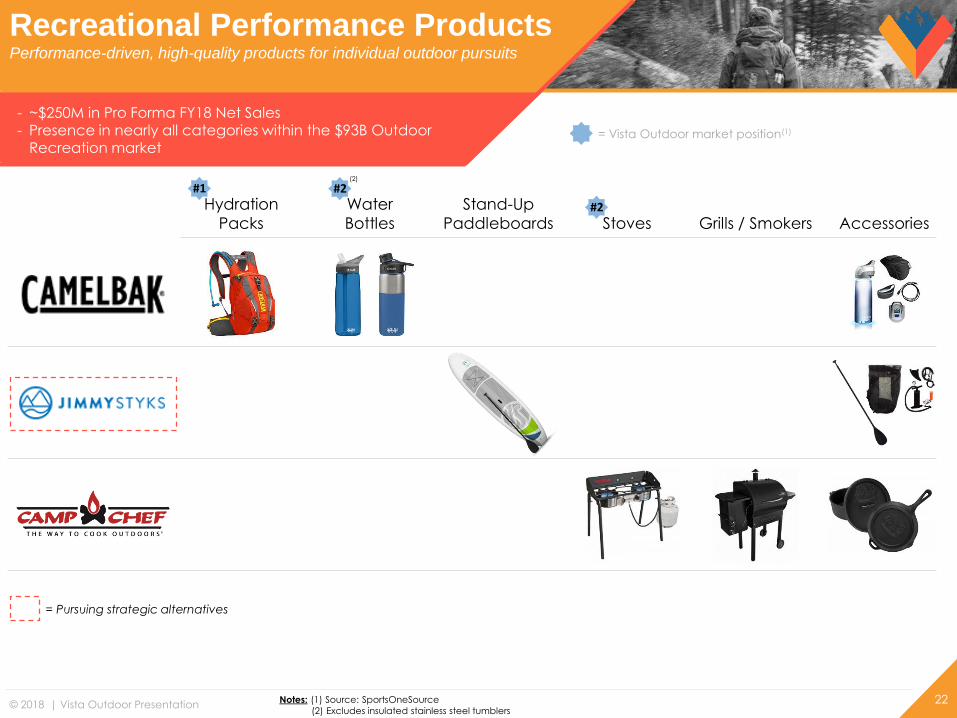
- ~$250M in Pro Forma FY18 Net Sales- Presence in nearly all categories within the $93B Outdoor
Recreation market
22
Hydration
Packs
Water
Bottles
Stand-Up
Paddleboards Stoves Grills / Smokers Accessories
#1 #2
#2
Notes: (1) Source: SportsOneSource
(2) Excludes insulated stainless steel tumblers
= Vista Outdoor market position(1)
Recreational Performance ProductsPerformance-driven, high-quality products for individual outdoor pursuits
(2)
= Pursuing strategic alternatives
© 2018 | Vista Outdoor Presentation
Shooting Sports
23
© 2018 | Vista Outdoor Presentation 24
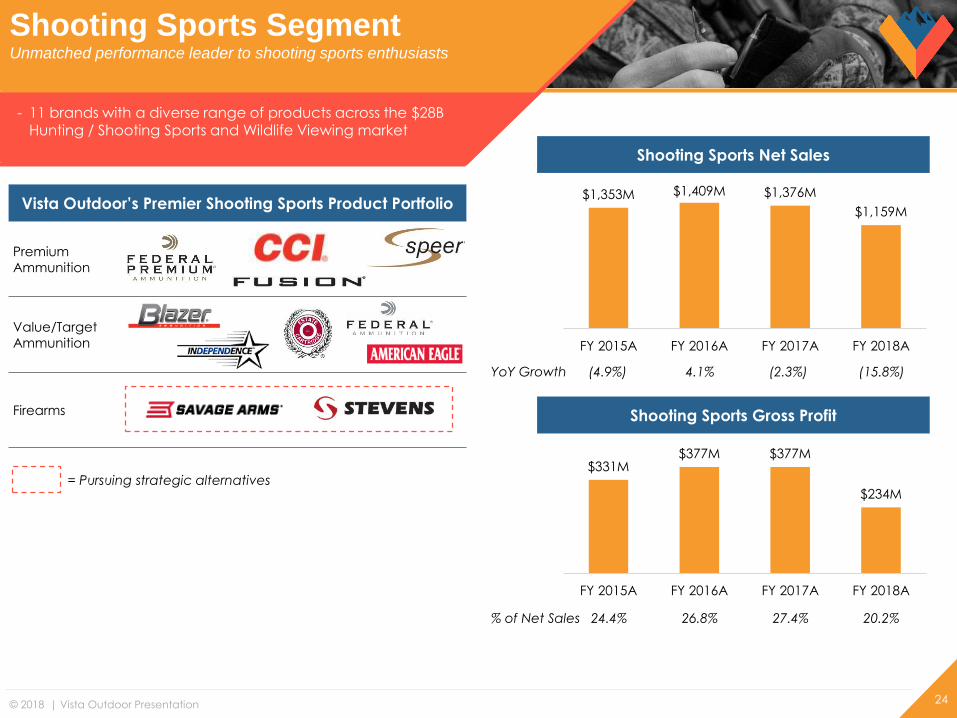
- 11 brands with a diverse range of products across the $28B Hunting / Shooting Sports and Wildlife Viewing market
$1,353M $1,409M $1,376M
$1,159M
FY 2015A FY 2016A FY 2017A FY 2018A
$331M$377M $377M
$234M
FY 2015A FY 2016A FY 2017A FY 2018A
Shooting Sports Net Sales
Shooting Sports Gross Profit
YoY Growth (4.9%) 4.1% (2.3%) (15.8%)
% of Net Sales 24.4% 26.8% 27.4% 20.2%
Premium
Ammunition
Value/Target
Ammunition
Firearms
Vista Outdoor’s Premier Shooting Sports Product Portfolio
Shooting Sports SegmentUnmatched performance leader to shooting sports enthusiasts
= Pursuing strategic alternatives
© 2018 | Vista Outdoor Presentation
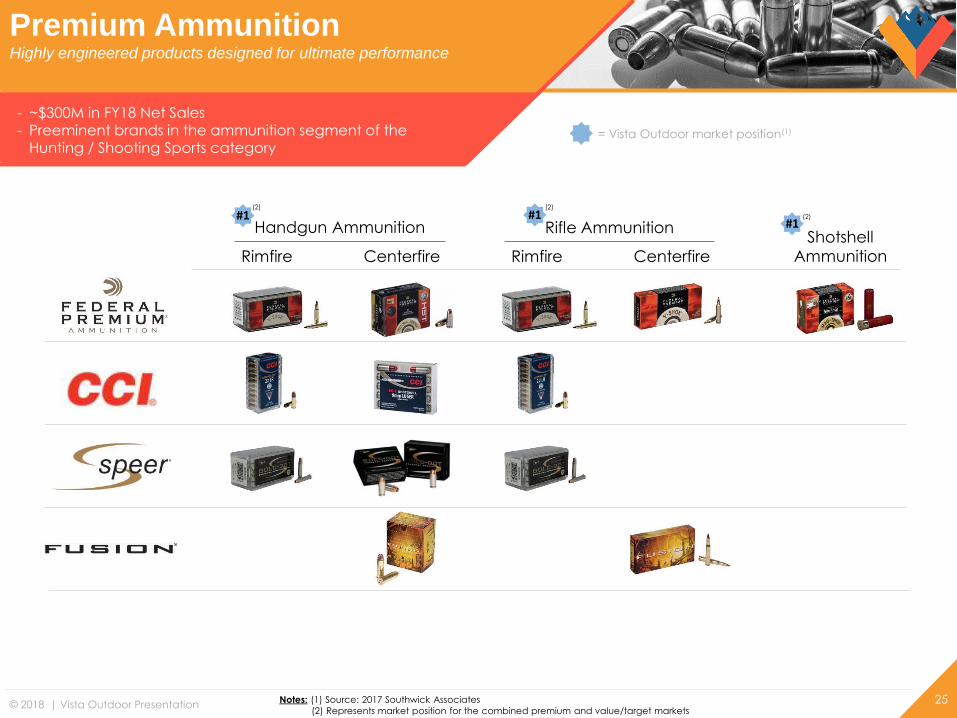
- ~$300M in FY18 Net Sales- Preeminent brands in the ammunition segment of the
Hunting / Shooting Sports category
Shotshell
Ammunition
#1Rifle Ammunition#1
Handgun Ammunition#1
Rimfire Centerfire Rimfire Centerfire
25Notes: (1) Source: 2017 Southwick Associates
(2) Represents market position for the combined premium and value/target markets
= Vista Outdoor market position(1)
(2) (2)
(2)
Premium AmmunitionHighly engineered products designed for ultimate performance
© 2018 | Vista Outdoor Presentation
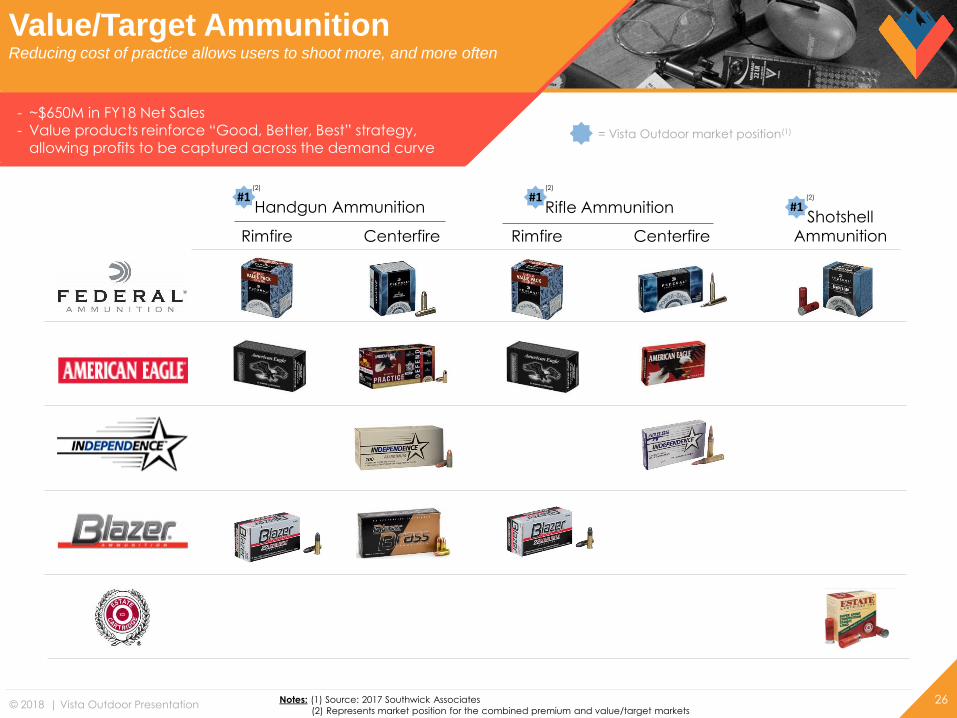
Shotshell
Ammunition
- ~$650M in FY18 Net Sales- Value products reinforce “Good, Better, Best” strategy,
allowing profits to be captured across the demand curve
26
#1#1#1
Rifle AmmunitionHandgun Ammunition
Rimfire Centerfire Rimfire Centerfire
Notes: (1) Source: 2017 Southwick Associates
(2) Represents market position for the combined premium and value/target markets
= Vista Outdoor market position(1)
(2) (2)
(2)
Value/Target AmmunitionReducing cost of practice allows users to shoot more, and more often
© 2018 | Vista Outdoor Presentation
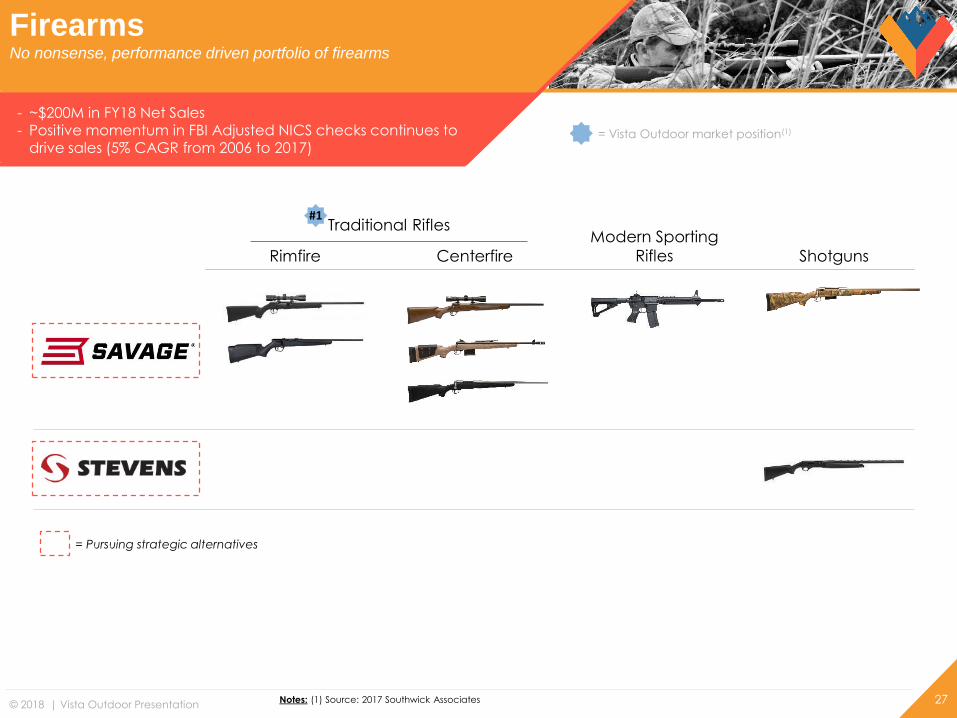
- ~$200M in FY18 Net Sales- Positive momentum in FBI Adjusted NICS checks continues to
drive sales (5% CAGR from 2006 to 2017)
27
= Vista Outdoor market position(1)
Notes: (1) Source: 2017 Southwick Associates
FirearmsNo nonsense, performance driven portfolio of firearms
Shotguns
#1
Rimfire Centerfire
Traditional RiflesModern Sporting
Rifles
= Pursuing strategic alternatives
© 2018 | Vista Outdoor Presentation
Financial Overview and
Long-term Targets
28
© 2018 | Vista Outdoor Presentation
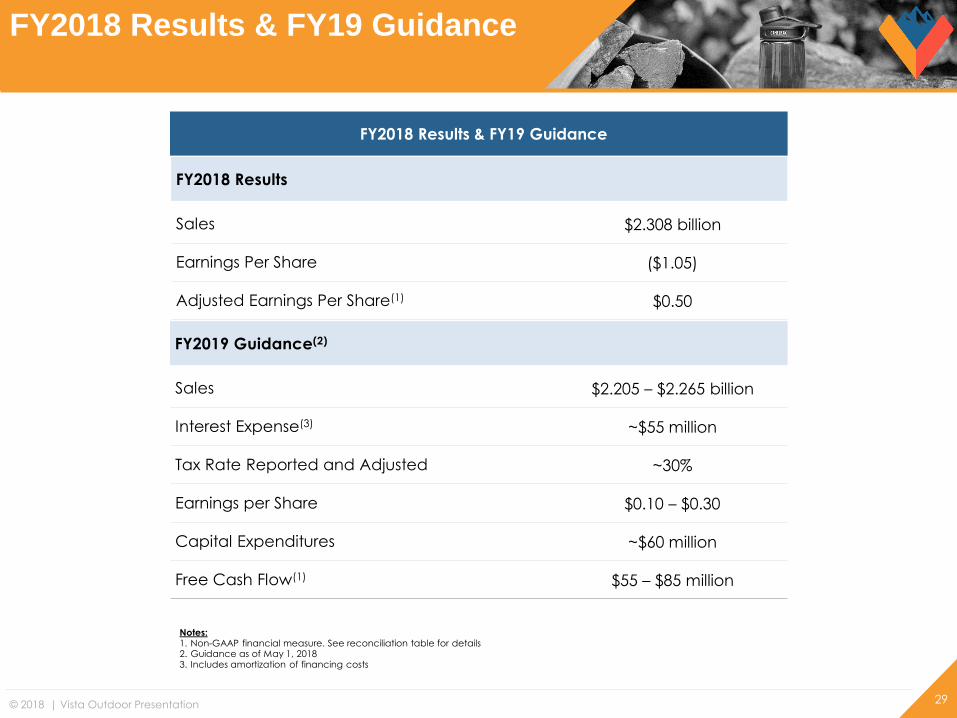
Sales $2.308 billion
Earnings Per Share ($1.05)
Adjusted Earnings Per Share(1) $0.50
29
Sales $2.205 – $2.265 billion
Interest Expense(3) ~$55 million
Tax Rate Reported and Adjusted ~30%
Earnings per Share $0.10 – $0.30
Capital Expenditures ~$60 million
Free Cash Flow(1) $55 – $85 million
FY2019 Guidance(2)
FY2018 Results & FY19 Guidance
FY2018 Results
Notes:1. Non-GAAP financial measure. See reconciliation table for details2. Guidance as of May 1, 20183. Includes amortization of financing costs
FY2018 Results & FY19 Guidance
© 2018 | Vista Outdoor Presentation 30
$M
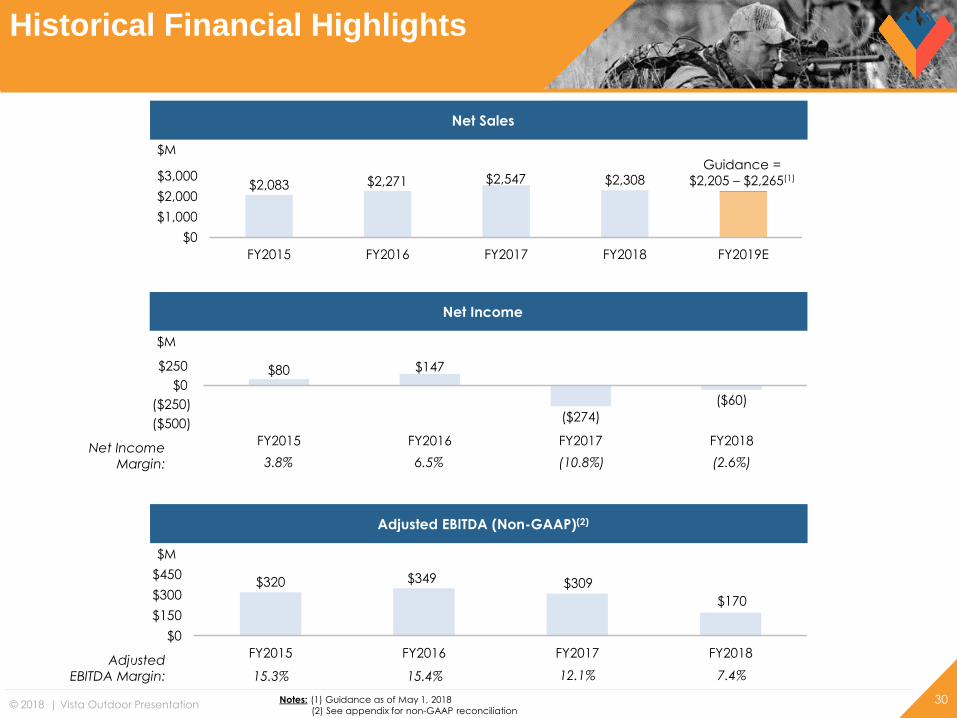
Adjusted EBITDA (Non-GAAP)(2)
Adjusted
EBITDA Margin: 15.3% 15.4% 12.1%
$320 $349 $309
$170
$0
$150
$300
$450
FY2015 FY2016 FY2017 FY2018
$M
$2,083 $2,271 $2,547 $2,308
$0
$1,000
$2,000
$3,000
FY2015 FY2016 FY2017 FY2018 FY2019E
Net Sales
Guidance =
$2,205 – $2,265(1)
Historical Financial Highlights
$M
Net Income
Net Income
Margin: 3.8% 6.5% (10.8%)
$80 $147
($274)
($60)
($500)
($250)
$0
$250
FY2015 FY2016 FY2017 FY2018
Notes: (1) Guidance as of May 1, 2018
(2) See appendix for non-GAAP reconciliation
(2.6%)
7.4%
© 2018 | Vista Outdoor Presentation
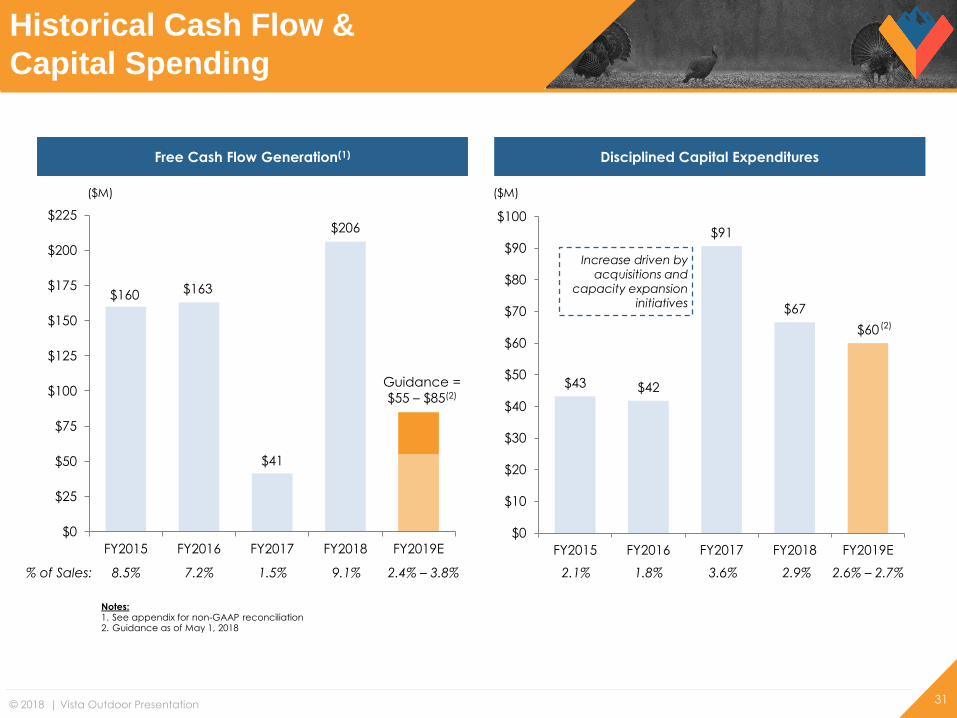
$160 $163
$41
$206
$0
$25
$50
$75
$100
$125
$150
$175
$200
$225
FY2015 FY2016 FY2017 FY2018 FY2019E
Disciplined Capital ExpendituresFree Cash Flow Generation(1)
$43 $42
$91
$67
$60
$0
$10
$20
$30
$40
$50
$60
$70
$80
$90
$100
FY2015 FY2016 FY2017 FY2018 FY2019E
($M) ($M)
2.1% 1.8% 3.6%% of Sales: 8.5% 7.2% 1.5%
31
Notes:1. See appendix for non-GAAP reconciliation2. Guidance as of May 1, 2018
Guidance =
$55 – $85(2)
2.4% – 3.8%
Increase driven by
acquisitions and
capacity expansion
initiatives
2.6% – 2.7%
(2)
Historical Cash Flow &
Capital Spending
9.1% 2.9%
© 2018 | Vista Outdoor Presentation
Appendix
32
© 2018 | Vista Outdoor Presentation
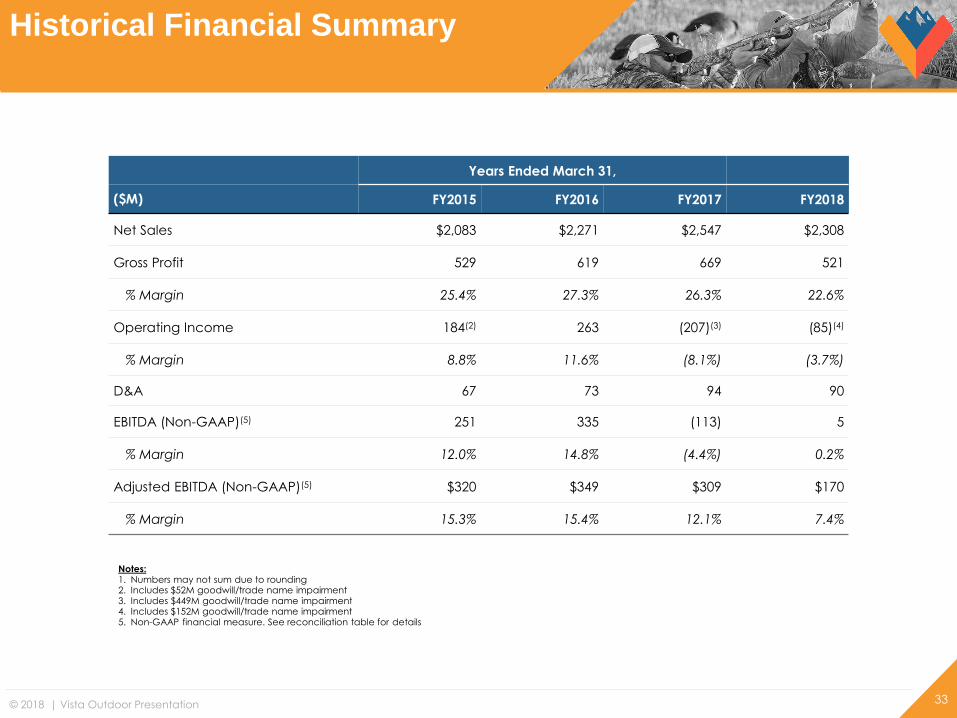
Years Ended March 31,
($M) FY2015 FY2016 FY2017 FY2018
Net Sales $2,083 $2,271 $2,547 $2,308
Gross Profit 529 619 669 521
% Margin 25.4% 27.3% 26.3% 22.6%
Operating Income 184(2) 263 (207)(3) (85)(4)
% Margin 8.8% 11.6% (8.1%) (3.7%)
D&A 67 73 94 90
EBITDA (Non-GAAP)(5) 251 335 (113) 5
% Margin 12.0% 14.8% (4.4%) 0.2%
Adjusted EBITDA (Non-GAAP)(5) $320 $349 $309 $170
% Margin 15.3% 15.4% 12.1% 7.4%
Notes:1. Numbers may not sum due to rounding2. Includes $52M goodwill/trade name impairment3. Includes $449M goodwill/trade name impairment4. Includes $152M goodwill/trade name impairment5. Non-GAAP financial measure. See reconciliation table for details
33
Historical Financial Summary
© 2018 | Vista Outdoor Presentation
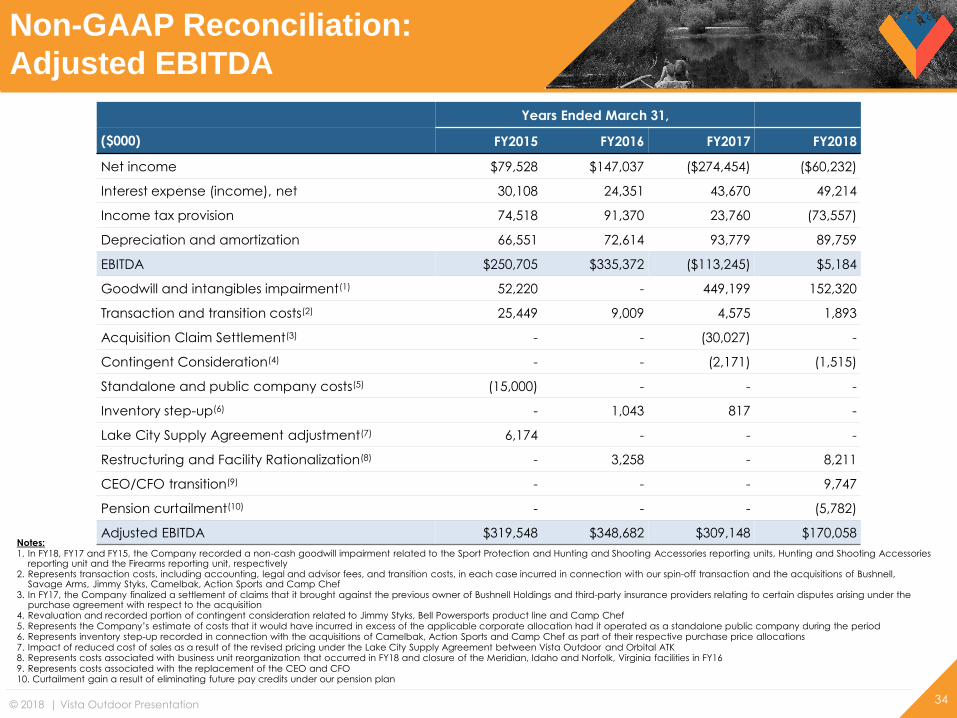
Years Ended March 31,
($000) FY2015 FY2016 FY2017 FY2018
Net income $79,528 $147,037 ($274,454) ($60,232)
Interest expense (income), net 30,108 24,351 43,670 49,214
Income tax provision 74,518 91,370 23,760 (73,557)
Depreciation and amortization 66,551 72,614 93,779 89,759
EBITDA $250,705 $335,372 ($113,245) $5,184
Goodwill and intangibles impairment(1) 52,220 - 449,199 152,320
Transaction and transition costs(2) 25,449 9,009 4,575 1,893
Acquisition Claim Settlement(3) - - (30,027) -
Contingent Consideration(4) - - (2,171) (1,515)
Standalone and public company costs(5) (15,000) - - -
Inventory step-up(6) - 1,043 817 -
Lake City Supply Agreement adjustment(7) 6,174 - - -
Restructuring and Facility Rationalization(8) - 3,258 - 8,211
CEO/CFO transition(9) - - - 9,747
Pension curtailment(10) - - - (5,782)
Adjusted EBITDA $319,548 $348,682 $309,148 $170,058Notes:1. In FY18, FY17 and FY15, the Company recorded a non-cash goodwill impairment related to the Sport Protection and Hunting and Shooting Accessories reporting units, Hunting and Shooting Accessories
reporting unit and the Firearms reporting unit, respectively2. Represents transaction costs, including accounting, legal and advisor fees, and transition costs, in each case incurred in connection with our spin-off transaction and the acquisitions of Bushnell,
Savage Arms, Jimmy Styks, Camelbak, Action Sports and Camp Chef3. In FY17, the Company finalized a settlement of claims that it brought against the previous owner of Bushnell Holdings and third-party insurance providers relating to certain disputes arising under the
purchase agreement with respect to the acquisition4. Revaluation and recorded portion of contingent consideration related to Jimmy Styks, Bell Powersports product line and Camp Chef5. Represents the Company’s estimate of costs that it would have incurred in excess of the applicable corporate allocation had it operated as a standalone public company during the period6. Represents inventory step-up recorded in connection with the acquisitions of Camelbak, Action Sports and Camp Chef as part of their respective purchase price allocations7. Impact of reduced cost of sales as a result of the revised pricing under the Lake City Supply Agreement between Vista Outdoor and Orbital ATK8. Represents costs associated with business unit reorganization that occurred in FY18 and closure of the Meridian, Idaho and Norfolk, Virginia facilities in FY169. Represents costs associated with the replacement of the CEO and CFO10. Curtailment gain a result of eliminating future pay credits under our pension plan
34
Non-GAAP Reconciliation:
Adjusted EBITDA
© 2018 | Vista Outdoor Presentation
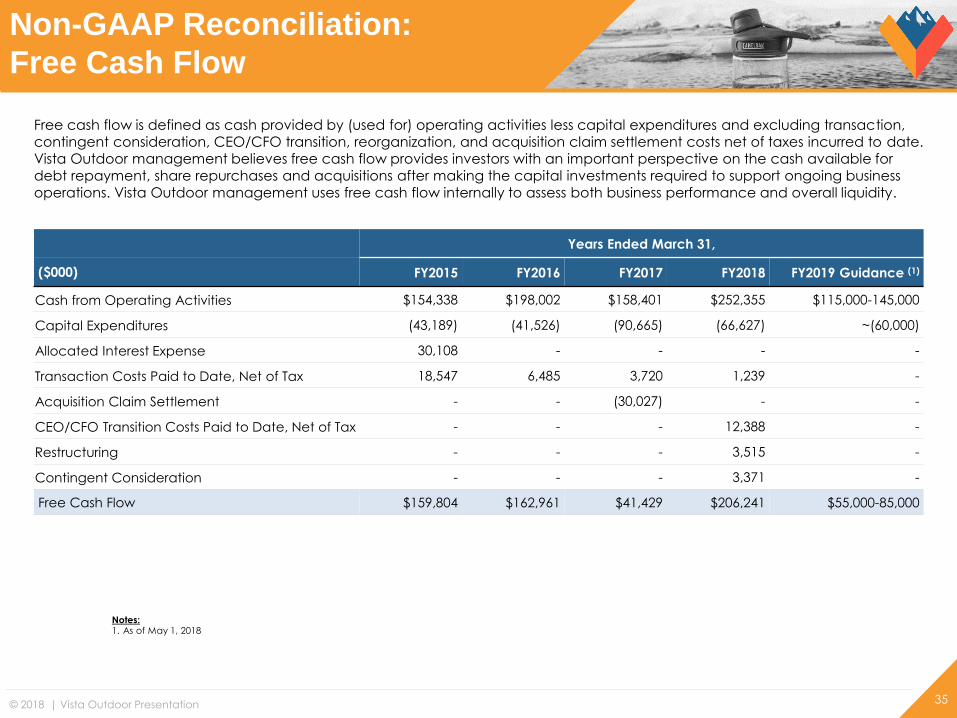
Free cash flow is defined as cash provided by (used for) operating activities less capital expenditures and excluding transaction,
contingent consideration, CEO/CFO transition, reorganization, and acquisition claim settlement costs net of taxes incurred to date.
Vista Outdoor management believes free cash flow provides investors with an important perspective on the cash available for
debt repayment, share repurchases and acquisitions after making the capital investments required to support ongoing business
operations. Vista Outdoor management uses free cash flow internally to assess both business performance and overall liquidity.
Years Ended March 31,
($000) FY2015 FY2016 FY2017 FY2018 FY2019 Guidance (1)
Cash from Operating Activities $154,338 $198,002 $158,401 $252,355 $115,000-145,000
Capital Expenditures (43,189) (41,526) (90,665) (66,627) ~(60,000)
Allocated Interest Expense 30,108 - - - -
Transaction Costs Paid to Date, Net of Tax 18,547 6,485 3,720 1,239 -
Acquisition Claim Settlement - - (30,027) - -
CEO/CFO Transition Costs Paid to Date, Net of Tax - - - 12,388 -
Restructuring - - - 3,515 -
Contingent Consideration - - - 3,371 -
Free Cash Flow $159,804 $162,961 $41,429 $206,241 $55,000-85,000
Notes:1. As of May 1, 2018
35
Non-GAAP Reconciliation:
Free Cash Flow