Embed Size (px)
Citation preview

INVESTORPRESENTATION
NYSE: CIM
4th Quarter 2017

Information is unaudited, estimated and subject to change.
DISCLAIMER This presentation includes “forward-looking statements” within the meaning of the safe harbor provisions of the UnitedStates Private Securities Litigation Reform Act of 1995. Actual results may differ from expectations, estimates andprojections and, consequently, readers should not rely on these forward-looking statements as predictions of futureevents. Words such as “goal” “expect,” “target,” “assume,” “estimate,” “project,” “budget,” “forecast,” “anticipate,” “intend,” “plan,”“may,” “will,” “could,” “should,” “believe,” “predicts,” “potential,” “continue,” and similar expressions are intended to identifysuch forward-looking statements. These forward-looking statements involve significant risks and uncertainties thatcould cause actual results to differ materially from expected results, including, among other things, those described inour most recent Annual Report on Form 10-K , and any subsequent Quarterly Reports on Form 10-Q, under the caption“Risk Factors.” Factors that could cause actual results to differ include, but are not limited to: the state of credit marketsand general economic conditions; changes in interest rates and the market value of our assets; the rates of default ordecreased recovery on the mortgages underlying our target assets; the occurrence, extent and timing of credit losseswithin our portfolio; the credit risk in our underlying assets; declines in home prices; our ability to establish, adjust andmaintain appropriate hedges for the risks in our portfolio; the availability and cost of our target assets; our ability toborrow to finance our assets and the associated costs; changes in the competitive landscape within our industry; ourability to manage various operational risks and costs associated with our business; interruptions in or impairments to ourcommunications and information technology systems; our ability to acquire residential mortgage loans and successfullysecuritize the residential mortgage loans we acquire; our ability to oversee our third party sub-servicers; the impact ofany deficiencies in the servicing or foreclosure practices of third parties and related delays in the foreclosure process; ourexposure to legal and regulatory claims; legislative and regulatory actions affecting our business; the impact of new ormodified government mortgage refinance or principal reduction programs; our ability to maintain our REIT qualification;and limitations imposed on our business due to our REIT status and our exempt status under the Investment CompanyAct of 1940.
Readers are cautioned not to place undue reliance upon any forward-looking statements, which speak only as of thedate made. Chimera does not undertake or accept any obligation to release publicly any updates or revisions to anyforward-looking statement to reflect any change in its expectations or any change in events, conditions orcircumstances on which any such statement is based. Additional information concerning these and other risk factors iscontained in Chimera’s most recent filings with the Securities and Exchange Commission (SEC). All subsequent writtenand oral forward-looking statements concerning Chimera or matters attributable to Chimera or any person acting on itsbehalf are expressly qualified in their entirety by the cautionary statements above.
This presentation may include industry and market data obtained through research, surveys, and studies conducted bythird parties and industry publications. We have not independently verified any such market and industry data fromthird-party sources. This presentation is provided for discussion purposes only and may not be relied upon as legal orinvestment advice, nor is it intended to be inclusive of all the risks and uncertainties that should be considered. Thispresentation does not constitute an offer to purchase or sell any securities, nor shall it be construed to be indicative ofthe terms of an offer that the parties or their respective affiliates would accept.
Readers are advised that the financial information in this presentation is based on company data available at the time ofthis presentation and, in certain circumstances, may not have been audited by the company’s independent auditors.

Information is unaudited, estimated and subject to change. 2
CHIMERA IS A RESIDENTIAL MORTGAGE REIT
Chimera develops and manages a portfolio of leveraged mortgage investments toproduce an attractive quarterly dividend for shareholders
▪ Established in 2007
▪ Internally managed since August 2015
▪ Total Capital $3.6 Billion
▪ Total Portfolio $20.9 Billion
▪ Common Stock Price $18.48 / Dividend Yield 10.82%
▪ 8.00% Fixed Series A Preferred Stock Price $25.82
▪ 8.00% Variable Series B Preferred Stock Price $25.80
▪ Overall leverage ratio 4.6:1 / Recourse leverage ratio 2.0:1
All data as of December 31, 2017

Information is unaudited, estimated and subject to change. 3
TOTAL RETURN
Chimera has outperformed it's peers since internalization of management in August 2015
All data as of December 31, 2017
*Assuming reinvestment of dividends
Source: Bloomberg
CIM US Equity REM US Equity SPY US Equity
Cumulative Total Return*
90%
80%
70%
60%
50%
40%
30%
20%
10%
0%
-10%
-20%
-30%
8/5/2015
9/16/2015
10/27/2015
12/8/2015
1/21/2016
3/3/2016
4/14/2016
5/25/2016
7/7/2016
8/17/2016
9/28/2016
11/8/2016
12/20/2016
2/2/2017
3/16/2017
4/27/2017
6/8/2017
7/20/2017
8/30/2017
10/11/2017
11/21/2017
81%
36%
34%
12/31/2017

Information is unaudited, estimated and subject to change. 4
HISTORICAL TOTAL RETURN
Chimera has consistently produced industry and market leading returns
All data as of December 31, 2017
*Assuming reinvestment of dividends
Source: Bloomberg
1 year 3 year 5 year
Cumulative Total Return *
200%
150%
100%
50%
0%
CIM US Equity REM US Equity SPY US Equity
20% 19% 22%
73%
31%38%
182%
49%
107%

Information is unaudited, estimated and subject to change. 5
DIVIDENDS
Chimera has paid $3.96 billion in dividends since inception
Common Dividends Preferred Dividends Special Dividends Cummulative Dividends Paid
700
600
500
400
300
200
100
0
$(M
illio
ns)
5,000
4,000
3,000
2,000
1,000
0
$(M
illio
ns)
2008 2009 2010 2011 2012 2013 2014 2015 2016 2017
Period Ending
All data as of December 31, 2017

Information is unaudited, estimated and subject to change. 6
DYNAMIC INVESTMENT STRATEGY
Chimera's focus of investment activities has been through acquiring residential mortgageloans, non-agency RMBS, agency RMBS and agency CMBS
ResidentialMortgage Loans
Chimera acquires seasoned residential mortgage loans. Chimera utilizes leverage through acombination of securitization, repo and warehouse facilities to manage risk and increase returns onthe portfolio. Chimera's loan portfolio has historically generated higher returns with less pricevolatility and interest rate risk than comparable Agency RMBS.
Non-AgencyRMBS
Chimera invests in both investment grade and non-investment grade RMBS. This portfolio provideshigh risk adjusted returns for the investment portfolio while providing increased liquidity for thecredit portfolio of mortgages. Non-Agency RMBS securities carry higher yields than Agency RMBS.
AgencyRMBS
Agency mortgage-backed securities that are backed by residential loans provide spread income for theportfolio with added benefit of liquidity. Chimera utilizes repo and various hedging techniques toincrease returns on the portfolio while managing interest rate risk. Agency securities are amongst themost liquid securities available in the fixed income market.
AgencyCMBS
Agency CMBS provides many of the same benefits as Agency RMBS while adding convexity to theportfolio. Agency CMBS typically carries prepay protection for the investor enabling more efficienthedging techniques than RMBS.
Information is unaudited, estimated and subject to change. 7
PORTFOLIO COMPOSITION
ResidentialMortgage Credit
PortfolioAgency MBS
Portfolio Total Portfolio
Gross Asset Yield: 7.2% 3.0% 6.3%
Financing Cost(2): 3.9% 2.0% 3.6%
Net InterestSpread: 3.3% 1.0% 2.7%
Net InterestMargin: 3.7% 1.4% 3.2%
Portfolio Yields and Spreads(1)
13
12
11
10
9
8
7
6
5
4
3
2
1
0
Bill
ions
$3.0
$0.7
$4.0
$3.2
$9.6
Non-Recourse(Securitization)
Recourse (Repo)
Recourse (Repo)
Equity Equity
Agency MBS PortfolioTotal Assets: 4.4 billion(1)
Residential MortgageCredit Portfolio
Total Assets: 16.5 billion(1)
82% of Chimera's equity capital is allocated to mortgage credit
All data as of December 31, 2017
(1) Reflects fourth quarter 2017 average assets, yields, and spreads
(2) Includes the interest incurred on interest rate swaps
All data as of December 31, 2017
(1) Financing excludes unsettled trades

Information is unaudited, estimated and subject to change. 8
2016-2017 ChimeraSecuritizes $13.2 BillionSeasoned Loans
• Performing loans with 10 yearsof payment history
• 14 securitizations with all seniorsecurities placed
• $ 3.1 billion bonds retained forinvestment portfolio
2014 Chimera Acquires$4.8 Billion SeasonedLoan Portfolio
• Originated by AmericanGeneral
• 7 Securitizations withembedded call options
• 7 deals called and re-securitized
2009–2011 ChimeraCreates and Retains$3.2 Billion High YieldSubordinate Bonds
• $1.7 billion current remainingface value of subordinate bonds
• Durable value over wide band ofprepayment rates
• Difficult to re-create in size andprice
UNIQUE MORTGAGE CREDIT PORTFOLIO
Key transactions distinguish Chimera from other Mortgage REITs
All data as of December 31, 2017
Re-Remic Subordinate BondPortfolio
Springleaf Seasoned LoanPortfolio
Risk Retention SeasonedLoan Portfolio
Information is unaudited, estimated and subject to change. 9
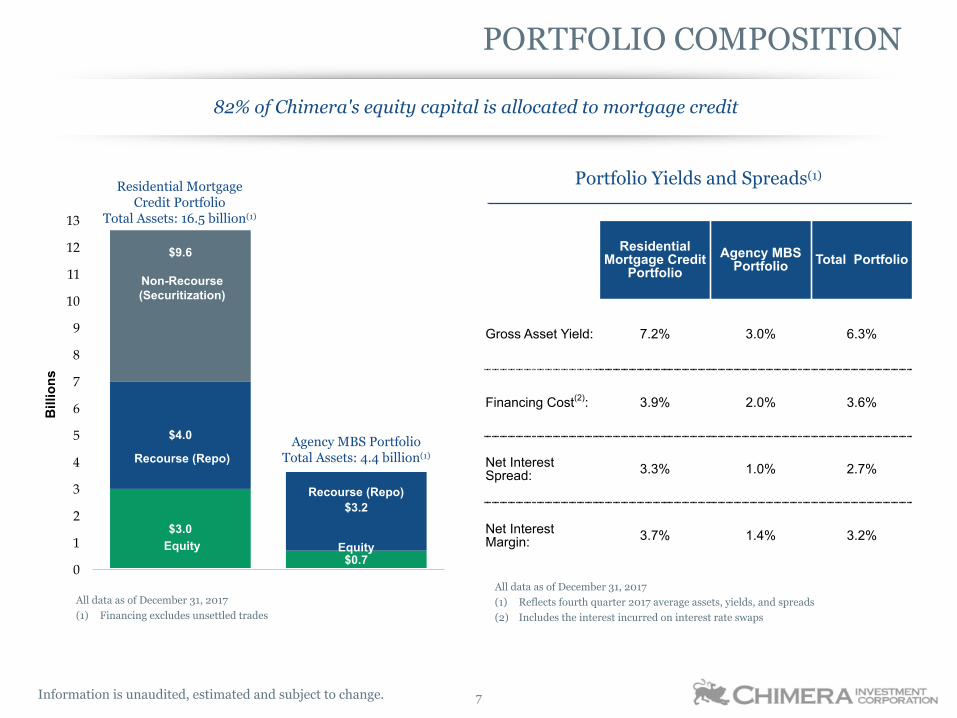
LOAN PORTFOLIO COMPOSITION
Chimera has acquired a unique portfolio of residential mortgage loans comprising 65% of the total portfolio
All data as of December 31, 2017
Seasoned Low Loan Balance Mortgage Portfolio
Total Current Unpaid Balance $13.5 Billion
Total Number of Loans 149,172
Weighted Average Loan Size $90,672
Weighted Average Coupon 6.88%
Average Loan Age 144 Months
Securitized Loan Portfolio
Non-Agency RMBS
Consolidated RMBS Securitizations
Agency CMBS
Agency Pass Through
65%6%
8%
10%
11%
Total Portfolio

Information is unaudited, estimated and subject to change. 10
THE SECURITIZATION PROCESS
Chimera created long, term-funding through securitization
Creation of senior and subordinate bonds
$100mm Non-Agency Mortgage
Bond or Loans
$100mm Trust(Non-Agency RMBS
Collateral)
Deposit
$70mm Senior A NoteSold to 3rd Party
$30mm Subordinate B Note
Retained by CIM
CIM buys $100mm Non-Agency mortgage bond orloans from dealer
CIM deposits the bond or loans into a trust
The trust issues bonds backed by the cashflow of the underlying bond
• CIM sells the Senior A note◦ The A note receives P&I from the $100mm bond
until the $70mm is paid off
• CIM retains the Subordinate B note◦ The B note receives interest, all losses from the
$100mm bond and starts to receive principal onlyafter the Senior A note is paid off in full
Principal
& Interest
Losses &Interest
1 2 3

Information is unaudited, estimated and subject to change. 11
SECURITIZATION ACTIVITY
Chimera has securitized over $23.5 billion of collateral and retained over $7 billion of bonds
($ in thousands) At Issuance
Vintage TypeTotal Original
Face
Total BondsSold
(Financing)Total Bonds
Retained2008 Loan 619,710 549,142 70,5682009 RMBS 3,535,035 1,965,001 1,570,0342010 RMBS 2,297,152 1,030,439 1,266,7132012 Loan 1,496,916 1,417,875 79,0412014 RMBS 367,271 — 367,2712015 Loan 2,048,483 1,437,918 610,5652016 Loan 5,795,146 4,846,979 948,1672017 Loan 7,364,441 5,173,847 2,190,594
Total 23,524,154 16,421,201 7,102,953% of Total 100% 70% 30%
Total Bonds Retained
Total Bonds Sold
Cumulative Total Bonds Retained
Securitization at Issuance
8,000
6,000
4,000
2,000
0$
(mill
ions
)
2008 2009 2010 2012 2014 2015 2016 2017
▪ 87% of our credit portfolio is related to loans or bondsChimera securitized
▪ 69% of our total portfolio is related to loans or bondsChimera securitized
All data as of December 31, 2017

Information is unaudited, estimated and subject to change. 12
2017 SECURITIZATION ACTIVITY
Chimera has securitized $6.9 billion in 2017 growing the investment portfolio to $20.9 billion
Loan Securitizations
CIM 2017-1$526,267,000
January 2017
CIM 2017-2$331,440,000February 2017
CIM 2017-3$2,434,640,000
March 2017
CIM 2017-4$830,510,000
March 2017
▪ Chimera closed eight securitizations in 2017 of seasoned, performing, low-loanbalance residential mortgage loans
▪ Chimera sold $5.1 billion of these securities, retaining an interest of $1.8 billion
All data as of December 31, 2017
CIM 2017-5$377,034,000
May 2017
CIM 2017-6$782,725,000
August 2017
CIM 2017-7$512,446,000
October 2017
CIM 2017-8$1,148,050,000
October 2017
CIMLTI 2017-RP2$421,329,000
2017

Information is unaudited, estimated and subject to change. 13
2016 SECURITIZATION ACTIVITY
Chimera securitized $5.8 billion in 2016 growing the investment portfolio to $16.3 billion
Loan Securitizations
CIM 2016-1$1,499,341,000
April 2016
CIM 2016-2$1,762,177,000
May 2016
CIM 2016-3$1,746,084,000
May 2016
CIM 2016-4$601,733,000
October 2016
CIM 2016-5$66,171,000October 2016
CIM 2016-FRE 1$185,881,000
October 2016
▪ Chimera has one of the largest seasoned, performing, small balance residentialloan portfolios in the Mortgage REIT Industry
▪ Chimera securitized $185 million loans with Freddie Mac in a pilot program▪ Chimera expects high single digit yields on the portfolio without leverage
All data as of December 31, 2017

Information is unaudited, estimated and subject to change. 14
($ in thousands) At Issuance / Acquisition December 31, 2017
Vintage Deal Total OriginalFace
Total ofTranches
Sold
Total ofTranchesRetained
Total RemainingFace
RemainingFace of
TranchesSold
Remaining Faceof Tranches
Retained
2014 CSMC 2014-4R(1) 367,271 — 367,271 210,789 — 210,789
2010 CSMC 2010-1R 1,730,581 691,630 1,038,951 504,330 3,669 500,661
2010 CSMC 2010-11R 566,571 338,809 227,762 207,428 — 207,428
2009 CSMC 2009-12R 1,730,698 915,566 815,132 476,131 87,478 388,653
2009 JPMRR 2009-7 1,522,474 856,935 665,539 435,208 108,077 327,131
2009 JMAC 2009-R2 281,863 192,500 89,363 75,301 19,949 55,352
TOTAL 6,199,458 2,995,440 3,204,018 1,909,187 219,173 1,690,014
% of origination remaining 31% 7% 53%
CONSOLIDATED RMBS SECURITIZATIONS
▪ Re-Remic subordinate bonds have had slow prepayments considering the low interest rate environment▪ Chimera expects the subordinate bond portfolio to have meaningful impact on earnings for the foreseeable future
All data as of December 31, 2017
(1) Contains collateral from CSMC 2010-12R Trust.
(2) Projected Balances are estimated based on future cash flows and changes in prepayment speeds
Significant outstanding balancesremain under a number ofprepayment projections
Total Remaining Face - Projected Balances (2)
Change in CPR (%) December 31,2018
December 31,2019
December 31,2020
-50% 1,694,685 1,505,348 1,339,923Unchanged 1,621,727 1,383,139 1,186,684
+50% 1,548,049 1,266,514 1,048,304
Re-Remic subordinate bonds have experienced slow prepayments since securitization
Information is unaudited, estimated and subject to change. 15
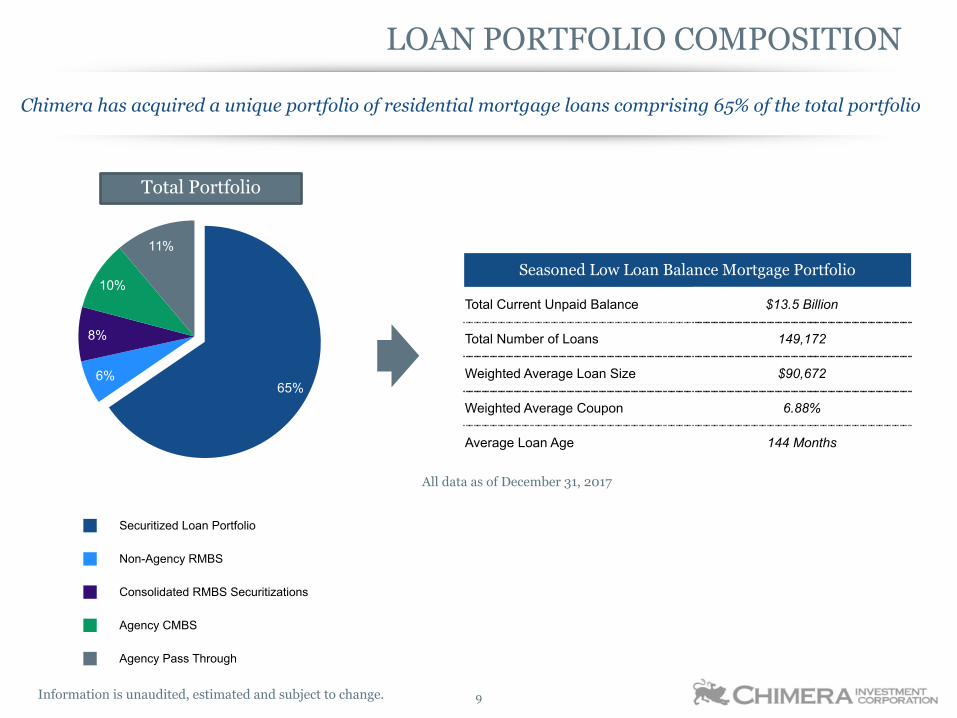
AGENCY PORTFOLIO COMPOSITION
Chimera has been increasing Agency CMBS , investing primarily in Ginnie Mae project loansAgency CMBS have less prepayment risk vs similar agency RMBS
Agency CMBS Agency CMBS as a % of total Agency
2,200
2,000
1,800
1,600
1,400
1,200
1,000
$(M
illio
ns)
50
45
40
35
30
25
20
15
%
1Q16 2Q16 3Q16 4Q16 1Q17 2Q17 3Q17 4Q17
Period Ending
All data as of December 31, 2017

Information is unaudited, estimated and subject to change. 16
CAPITAL MANAGEMENT
Chimera continues to add shareholder value while diversifying its capital structure
All data as of December 31, 2017
Preferred Stock
5,800,000 Shares8.00% Fixed Series A
Cumulative Redeemable Preferred StockOctober 2016
Liquidation Preference $25.00 Per Share
▪ Series A is a fixed coupon and is callable in 5 years on October 30, 2021▪ Series B is a fixed coupon for 7 years then floats at LIBOR plus 5.791%▪ Series B is a callable in 7 years on March 30, 2024▪ Series A and B preferred shared trade on the New York Stock Exchange under symbols
CIM PRA and CIM PRB
13,000,000 Shares8.00% Variable Series B
Cumulative Redeemable Preferred StockFebruary 2017
Liquidation Preference $25.00 Per Share
▪ Board of Directors announces intention to pay $2.00 dividends in 2018▪ Board of Directors re-authorizes $100 million common stock repurchase in February 2018▪ Chimera has raised $470 million in preferred stock, representing 13% of total capital▪ In 2015 Chimera repurchased 18 million shares of common stock for $250 million

Information is unaudited, estimated and subject to change. 17
SUMMARY
Chimera has developed a diversified portfolio of mortgage backed securities to maximizerisk adjusted returns. Consistent dividend generation has equated to industry leadingtotal rate of return for our common stock.
Chimera has created a high yield mortgage portfolio through securitization. 65 percent ofChimera’s seasoned mortgage portfolio has a weighted average coupon of 6.88% with aweighted average loan size of $90,000.
Upward trending macro-economic conditions for U.S. employment and housing arepositive for the credit of Chimera’s mortgage portfolio.
Positive Macro-EconomicEnvironment
Unique MortgagePortfolio
Dynamic InvestmentStrategy
Chimera has assembled a portfolio of unique mortgage assets with a goal to provide highand durable income to shareholders

Information is unaudited, estimated and subject to change.
Appendix

Information is unaudited, estimated and subject to change. 19
Agency Securities – As of December 31, 2017 Repo Days to Maturity – As of December 31, 2017
SecurityType Coupon(1) Current
FaceWeightedAverage
Market PriceWeighted
Average CPR
AgencyPass-through
3.50% $850,775 102.9 9.9
4.00% 1,207,687 104.9 13.4
4.50% 168,666 106.8 14.0
Commercial 3.6% 1,894,594 102.3 —
Agency IO 0.7% N/M(2) 3.5 3.1
Total $4,121,722
Maturity PrincipalBalance
Weighted Average Rate
Weighted Average Days
Within 30 days $2,124,925 1.44%
30 to 59 days 647,889.511 1.48%
60 to 89 days 429,241 1.63%
90 to 360 days — —%
Total $3,202,055.511 1.47% 28 Days
The majority of Chimera's Agency Portfolio consists of highly liquid pass-through securities
AGENCY MBS PORTFOLIO AND FUNDING
All data as of December 31, 2017
(1) Coupon is a weighted average for Commercial and Agency IO
(2) Notional Agency IO was $3.0 billion as of December 31, 2017

Information is unaudited, estimated and subject to change. 20
Description($ in thousands)
- 100 BasisPoints
- 50 BasisPoints Unchanged +50 Basis
Points+100 BasisPoints
Agency Securities
Market Value $ 4,610,532 $ 4,491,913 $ 4,364,828 $ 4,229,318 $ 4,089,486
Percentage Change 5.6 % 2.9 % - (3.1)% (6.3)%
SwapMarket Value (160,638) (77,945) - 75,607 150,428
Percentage Change (3.7)% (1.8)% - 1.7 % 3.4 %
FuturesMarket Value (34,928) (17,228) - 16,767 33,098
Percentage Change (0.8)% (0.4)% - 0.4 % 0.8 %
Net Gain/(Loss) $ 50,138 $ 31,912 - $ (43,136) $ (91,816)
Percentage Changein Portfolio Value(1) 1.1 % 0.7 % - (1.0)% (2.1)%
Near Term 0-3
Short Term 3-5
Medium Term 5-10
Long Term 10-30
Hedge Book Maturities
37%
31%
32%
1%
INTEREST RATE SENSITIVITY
Chimera continues to reduce its rate exposure by reducing its Agency portfolio and hedges
Total Notional Balance - Derivative Instruments
December 31, 2017 September 30, 2017
Interest Rate Swaps 3,816,400 3,373,400Swaptions 391,000 482,000
Futures 619,700 619,700
(1) Based on instantaneous moves in interest rates.

chimerareit.com