Embed Size (px)
Citation preview
NASDAQ: BURG 1
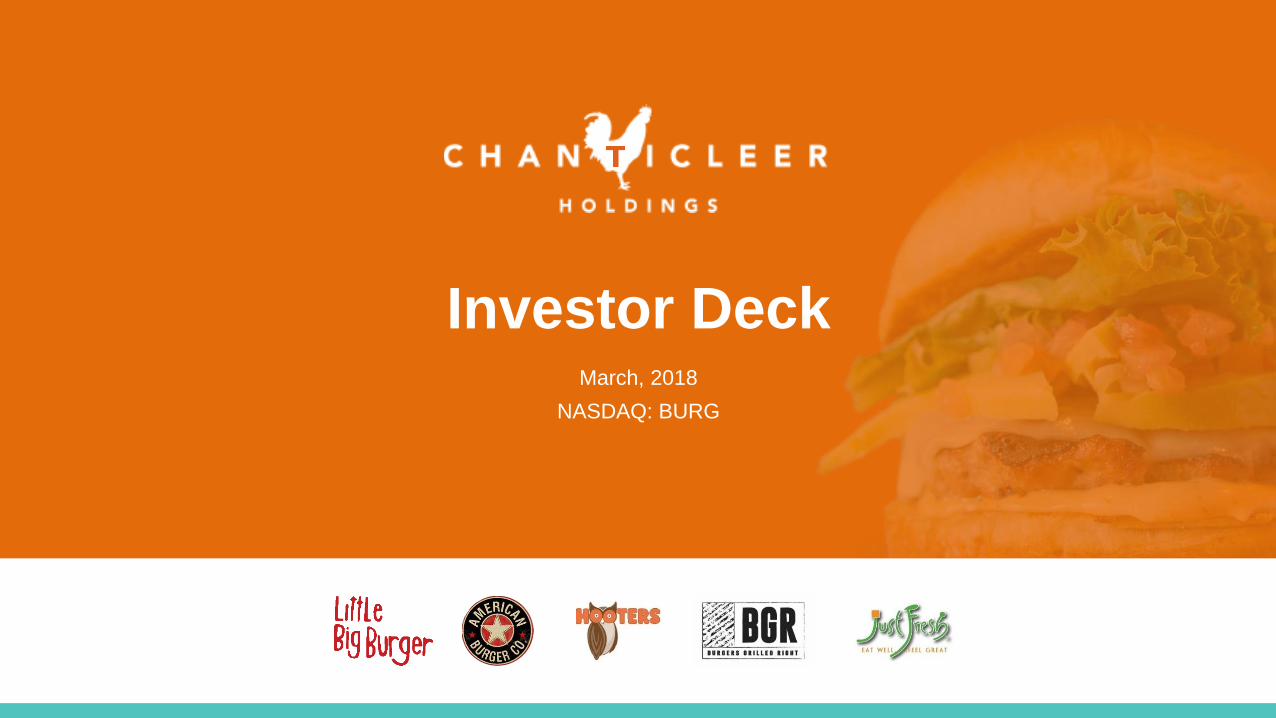
Investor DeckMarch, 2018
NASDAQ: BURG
NASDAQ: BURG 22
Chanticleer Holdings was formed and went public in June 2005 as a BDC
(investment company) led by CEO Mike Pruitt and two financial analysts, all
graduates of Coastal Carolina University. (The Chanticleers … the inspiration
behind our company name.)
In the early days as a BDC, we made an investment in the parent company of the
Hooters restaurant chain (HOA). With the subsequent death of the founder,
Chanticleer acquired the company with two private equity partners. Upon closing this
transaction, Chanticleer converted to an operating holding company focused on the
restaurant sector. In 2012, Chanticleer completed a secondary offering to begin our
expansion, initially with the Hooters brand before diversifying into the fast-casual
burger category that today is our biggest revenue and growth engine.
In 2017, we changed our Nasdaq symbol to BURG to reflect this focus.
This Is Our Story
NASDAQ: BURG 3
Forward-Looking Statements
Statements in this presentation that are not descriptions of historical facts are forward-looking statements relating to future events, and as such all forward-looking
statements are made pursuant to the Securities Litigation Reform Act of 1995. Statements may contain certain forward-looking statements pertaining to future
anticipated or projected plans, performance and developments, as well as other statements relating to future operations and results. Any statements in this
presentation that are not statements of historical fact may be considered to be forward-looking statements. Words such as "may," "will," "expect," "believe,"
"anticipate," "estimate," "intends," "goal," "objective," "seek," "attempt," or variations of these or similar words, identify forward-looking statements. These forward-
looking statements by their nature are estimates of future results only and involve substantial risks and uncertainties, including but not limited to risks associated with
the uncertainty of future financial results, additional financing requirements, development of new stores, successful completion of the Company’s proposed
acquisitions and expansion, the impact of competitive products or pricing, technological changes, the effect of economic conditions and other uncertainties detailed
from time to time in our reports filed with the Securities and Exchange Commission. There can be no assurance that our actual results will not differ materially from
expectations and other factors more fully described in our public filings with the U.S. Securities and Exchange Commission, which can be reviewed at www.sec.gov.
Non-GAAP Measures
Chanticleer Holdings, Inc. prepares its condensed consolidated financial statements in accordance with United States generally accepted accounting principles
(”GAAP”). In addition to disclosing financial results prepared in accordance with GAAP, the Company discloses information regarding Adjusted EBITDA and
Restaurant EBITDA, which differ from the term EBITDA as it is commonly used. In addition to adjusting net income (loss) from continuing operations to exclude
taxes, interest, and depreciation and amortization, Adjusted EBITDA also excludes pre-opening and closing costs for our restaurants, non-cash expenses,
transaction-related expenses, change in fair value of derivative liability and other income and expenses. In addition, Restaurant EBITDA also excludes management
fee income and general and administrative expenses. Adjusted EBITDA and restaurant EBITDA are not measures of performance defined in accordance with GAAP.
However, adjusted EBITDA and restaurant EBITDA are used internally in planning and evaluating the company's operating performance and by the Company’s
creditors. Accordingly, management believes that disclosure of these metrics offers investors, bankers and other stakeholders an additional view of the company's
operations that, when coupled with the GAAP results, provides a more complete understanding of the Company's financial results. Adjusted EBITDA and Restaurant
EBITDA should not be considered as alternatives to net loss or to net cash used in operating activities as a measure of operating results or of liquidity. It may not be
comparable to similarly titled measures used by other companies, and it excludes financial information that some may consider important in evaluating the company's
performance. A reconciliation of GAAP net income (loss) to Adjusted EBITDA and Restaurant EBITDA is included in the accompanying financial schedules. For
further information, please refer to Chanticleer’s Quarterly Report on Form 10-Q filed with the SEC on November 16, 2015, available online at www.sec.gov.
Safe Harbor Statement
NASDAQ: BURG 4
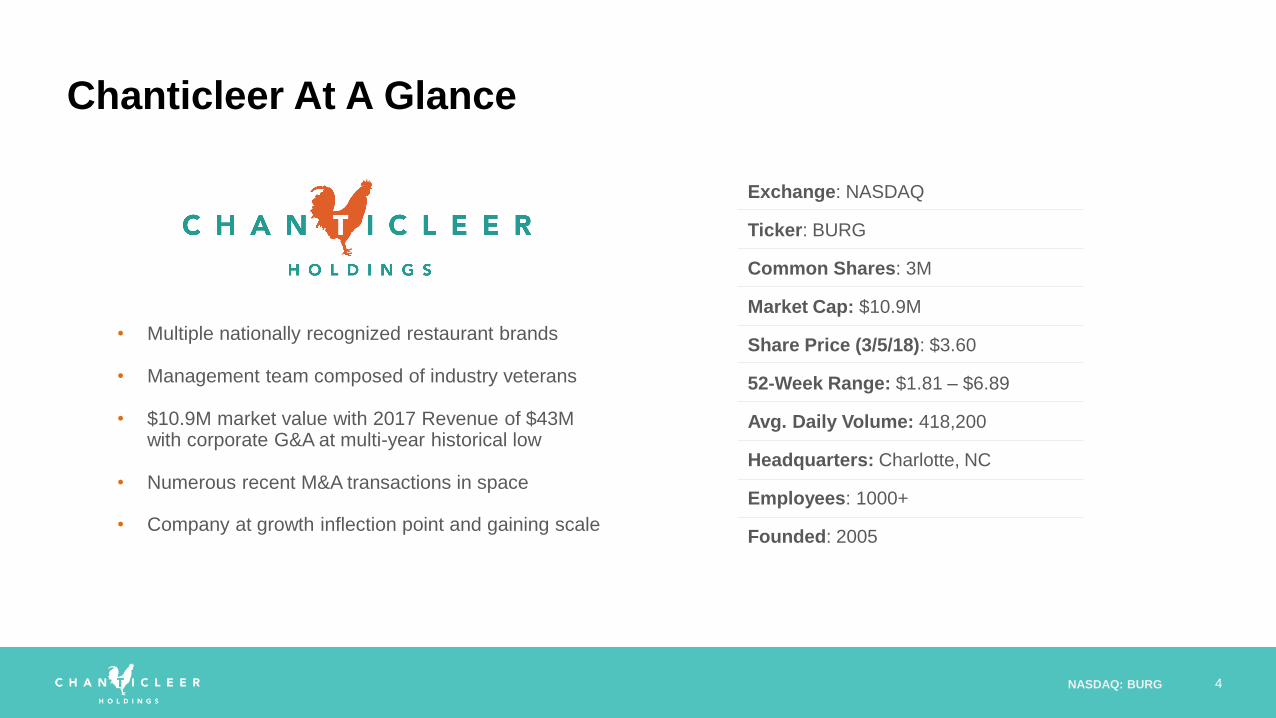
Chanticleer At A Glance
Exchange: NASDAQ
Ticker: BURG
Common Shares: 3M
Market Cap: $10.9M
Share Price (3/5/18): $3.60
52-Week Range: $1.81 – $6.89
Avg. Daily Volume: 418,200
Headquarters: Charlotte, NC
Employees: 1000+
Founded: 2005
• Multiple nationally recognized restaurant brands
• Management team composed of industry veterans
• $10.9M market value with 2017 Revenue of $43M with corporate G&A at multi-year historical low
• Numerous recent M&A transactions in space
• Company at growth inflection point and gaining scale
NASDAQ: BURG 5
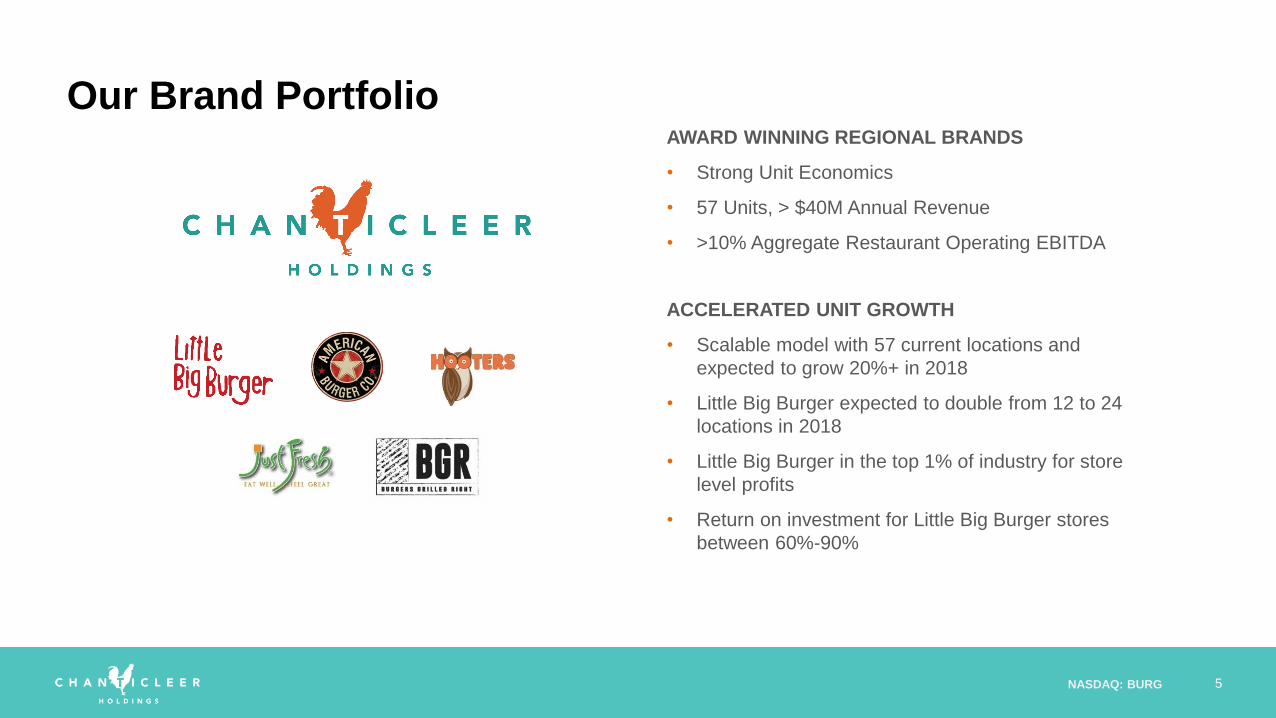
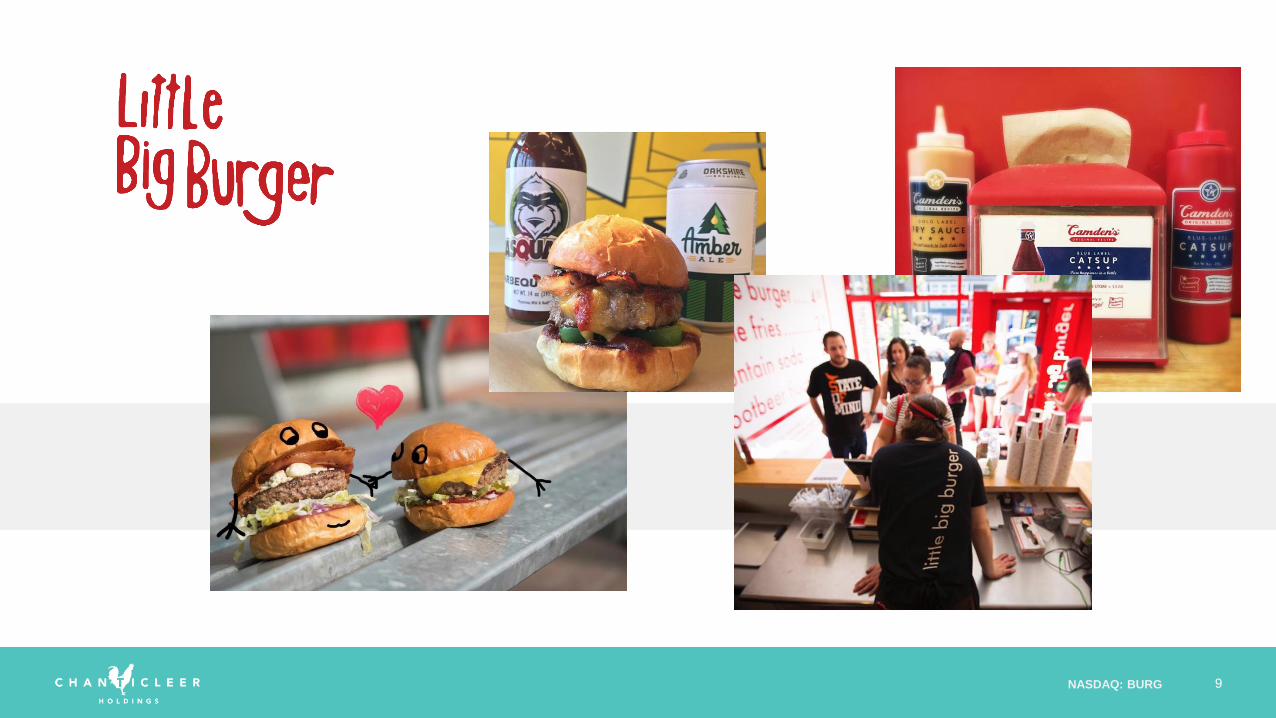
Our Brand PortfolioAWARD WINNING REGIONAL BRANDS
• Strong Unit Economics
• 57 Units, > $40M Annual Revenue
• >10% Aggregate Restaurant Operating EBITDA
ACCELERATED UNIT GROWTH
• Scalable model with 57 current locations and
expected to grow 20%+ in 2018
• Little Big Burger expected to double from 12 to 24
locations in 2018
• Little Big Burger in the top 1% of industry for store
level profits
• Return on investment for Little Big Burger stores
between 60%-90%
NASDAQ: BURG 6
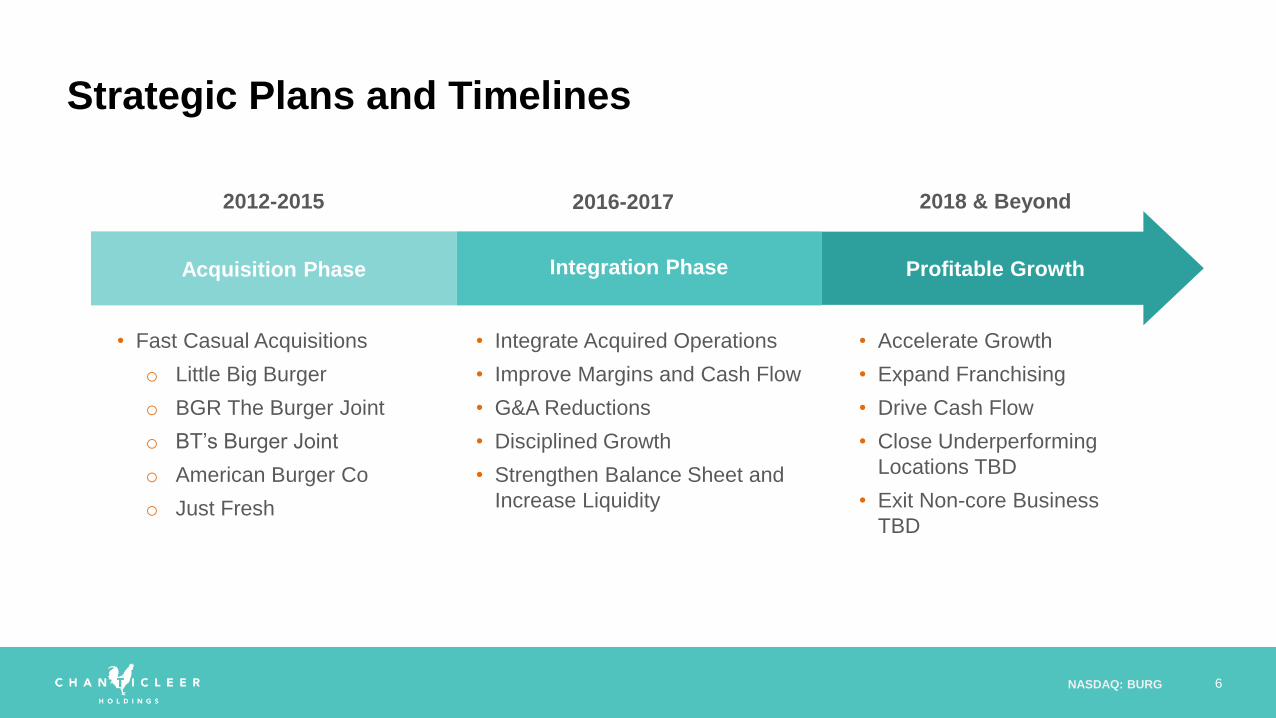
2018 & Beyond2012-2015
• Integrate Acquired Operations
• Improve Margins and Cash Flow
• G&A Reductions
• Disciplined Growth
• Strengthen Balance Sheet and
Increase Liquidity
• Fast Casual Acquisitions
o Little Big Burger
o BGR The Burger Joint
o BT’s Burger Joint
o American Burger Co
o Just Fresh
2016-2017
• Accelerate Growth
• Expand Franchising
• Drive Cash Flow
• Close Underperforming
Locations TBD
• Exit Non-core Business
TBD
Acquisition Phase Integration Phase Profitable Growth
Strategic Plans and Timelines
NASDAQ: BURG 7
Unique, Growing Brands
NASDAQ: BURG 8
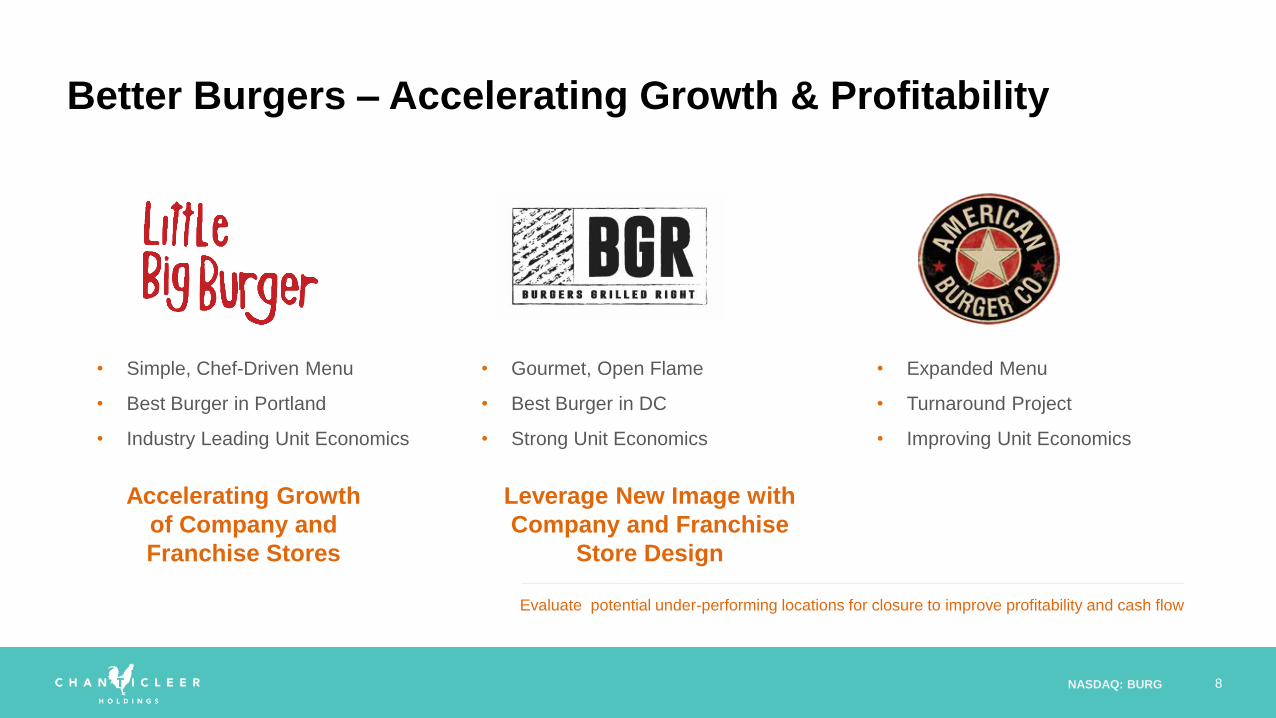
Accelerating Growth
of Company and
Franchise Stores
Leverage New Image with
Company and Franchise
Store Design
Evaluate potential under-performing locations for closure to improve profitability and cash flow
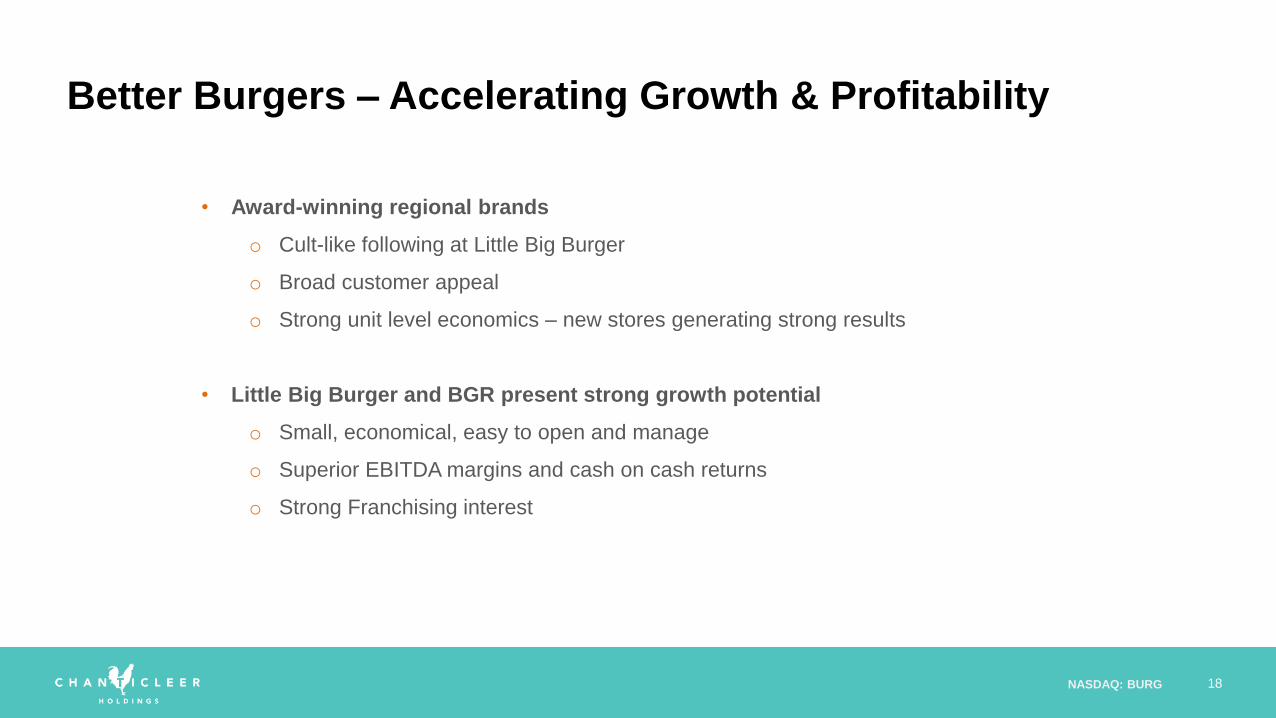
Better Burgers – Accelerating Growth & Profitability
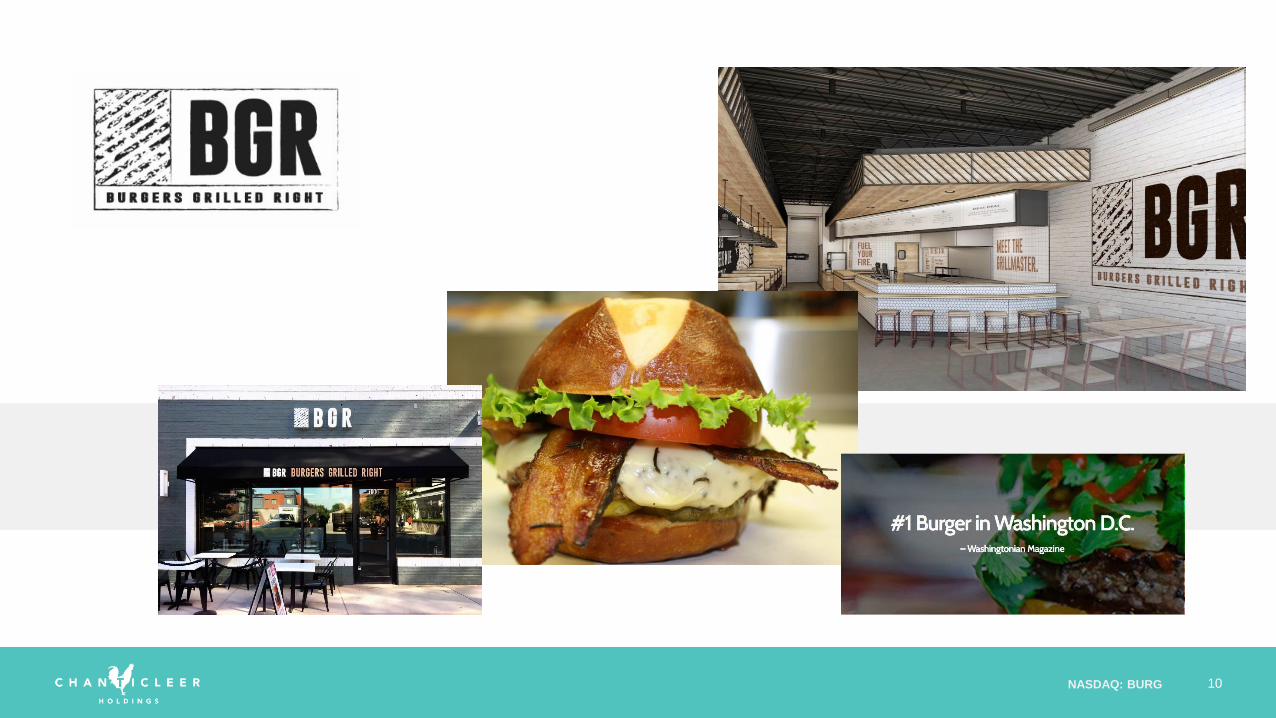
• Simple, Chef-Driven Menu
• Best Burger in Portland
• Industry Leading Unit Economics
• Gourmet, Open Flame
• Best Burger in DC
• Strong Unit Economics
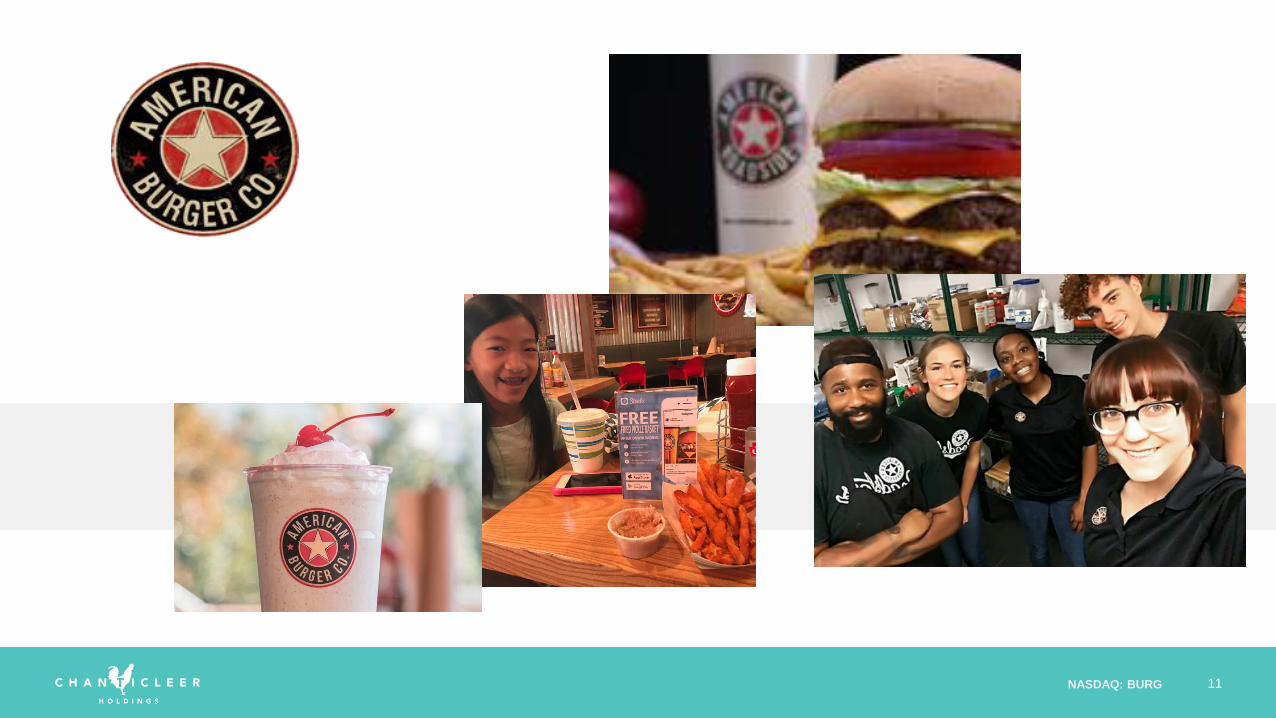
• Expanded Menu
• Turnaround Project
• Improving Unit Economics
NASDAQ: BURG 9
NASDAQ: BURG 10
NASDAQ: BURG 11
NASDAQ: BURG 12
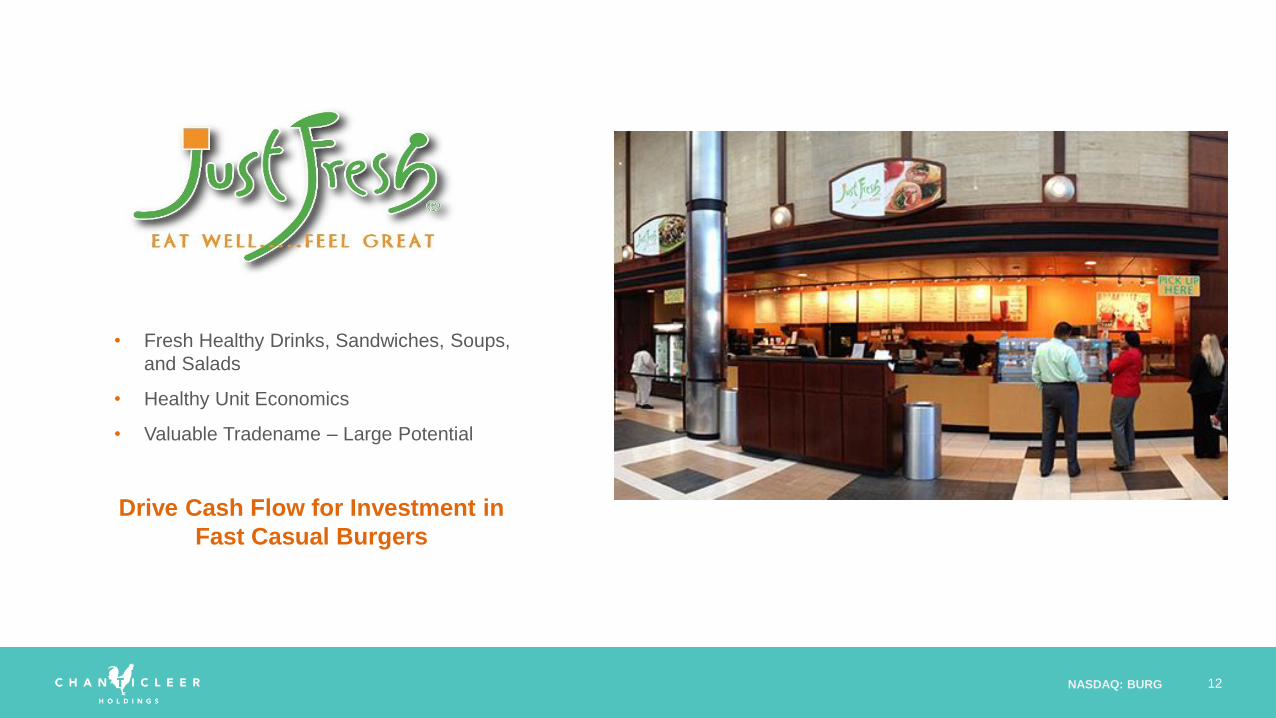
• Fresh Healthy Drinks, Sandwiches, Soups,
and Salads
• Healthy Unit Economics
• Valuable Tradename – Large Potential
Drive Cash Flow for Investment in
Fast Casual Burgers
NASDAQ: BURG 13
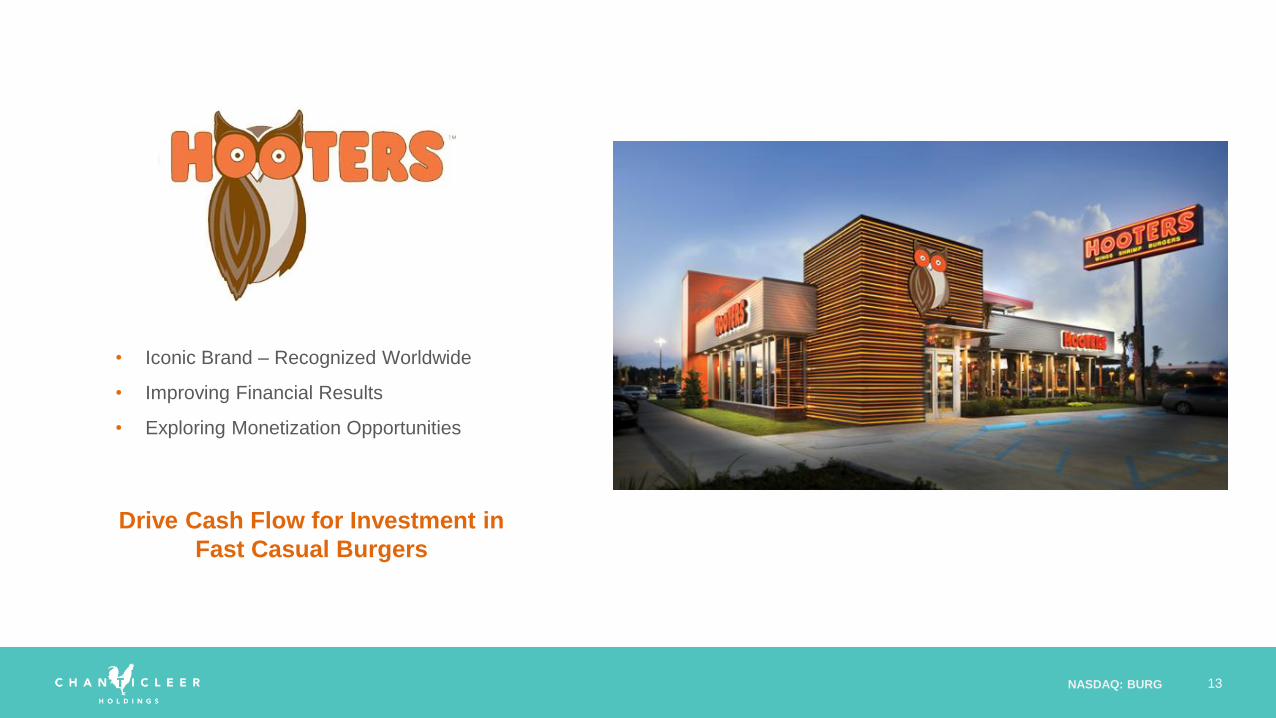
• Iconic Brand – Recognized Worldwide
• Improving Financial Results
• Exploring Monetization Opportunities
Drive Cash Flow for Investment in
Fast Casual Burgers

NASDAQ: BURG 14
Financials
NASDAQ: BURG 15
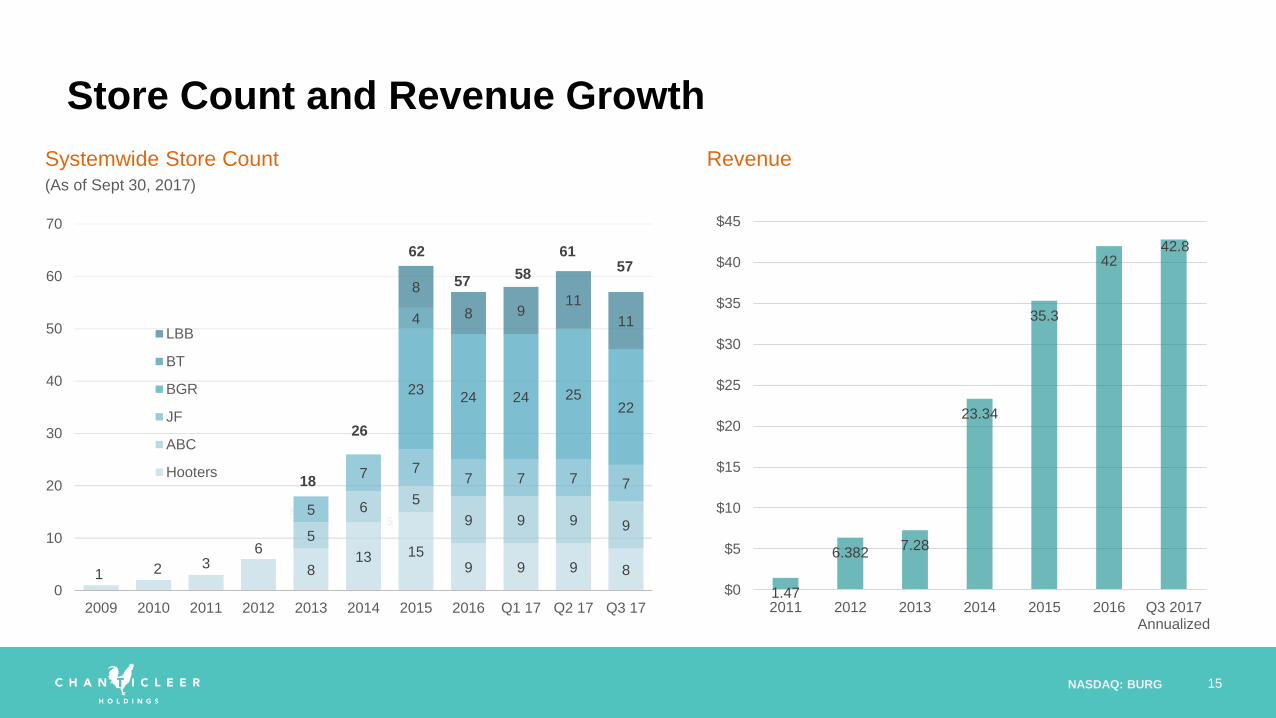
8
5
Revenue
1.47
6.3827.28
23.34
35.3
4242.8
$0
$5
$10
$15
$20
$25
$30
$35
$40
$45
2011 2012 2013 2014 2015 2016 Q3 2017Annualized
5
Systemwide Store Count
Store Count and Revenue Growth
8
(As of Sept 30, 2017)
1 2 36
813 15
9 9 9 8
5
65
9 9 9 95
7 77 7 7 7
2324 24 25
22
4
8
8 911
11
0
10
20
30
40
50
60
70
2009 2010 2011 2012 2013 2014 2015 2016 Q1 17 Q2 17 Q3 17
LBB
BT
BGR
JF
ABC
Hooters18
62
26
6157
5758
NASDAQ: BURG 16
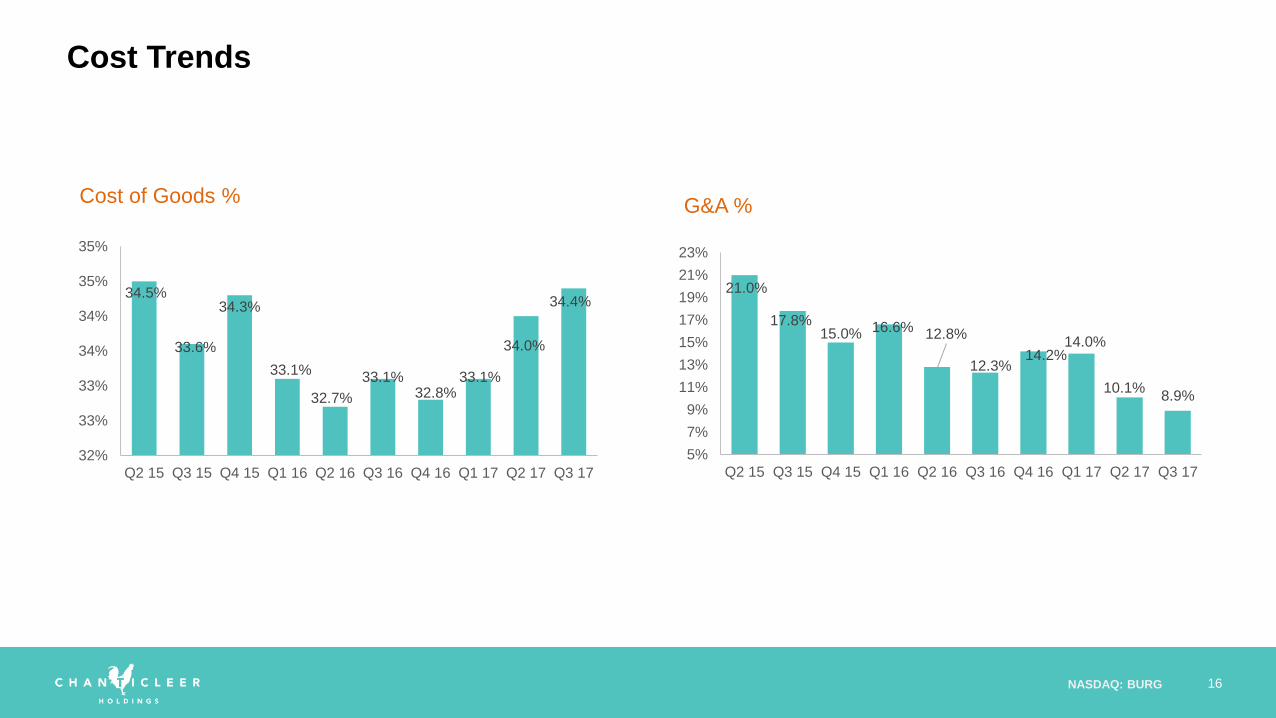
Cost of Goods % G&A %
Cost Trends
34.5%
33.6%
34.3%
33.1%
32.7%
33.1%32.8%
33.1%
34.0%
34.4%
32%
33%
33%
34%
34%
35%
35%
Q2 15 Q3 15 Q4 15 Q1 16 Q2 16 Q3 16 Q4 16 Q1 17 Q2 17 Q3 17
21.0%
17.8%15.0% 16.6% 12.8%
12.3%14.2%
14.0%
10.1%8.9%
5%
7%
9%
11%
13%
15%
17%
19%
21%
23%
Q2 15 Q3 15 Q4 15 Q1 16 Q2 16 Q3 16 Q4 16 Q1 17 Q2 17 Q3 17

NASDAQ: BURG 17
Growth Strategy
NASDAQ: BURG 18
• Award-winning regional brands
o Cult-like following at Little Big Burger
o Broad customer appeal
o Strong unit level economics – new stores generating strong results
• Little Big Burger and BGR present strong growth potential
o Small, economical, easy to open and manage
o Superior EBITDA margins and cash on cash returns
o Strong Franchising interest
Better Burgers – Accelerating Growth & Profitability
NASDAQ: BURG 19
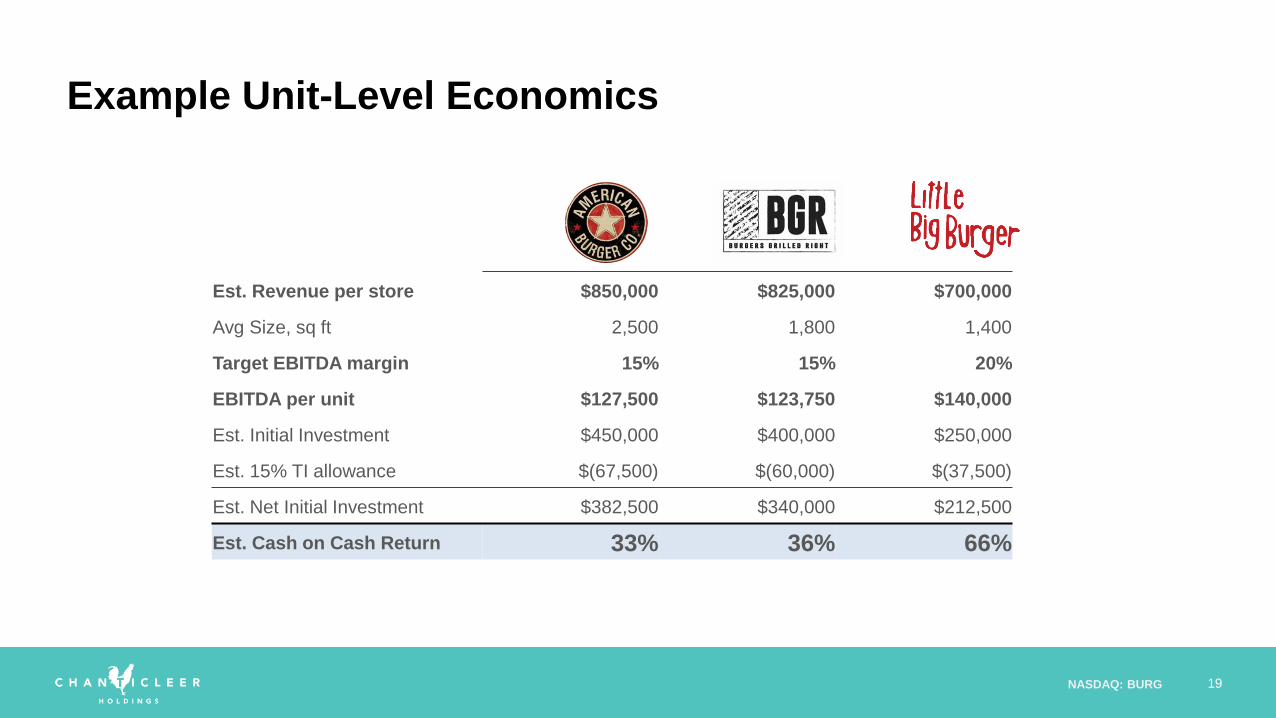
AMERICAN
BURGERBGR
LITTLE BIG
BURGER
Est. Revenue per store $850,000 $825,000 $700,000
Avg Size, sq ft 2,500 1,800 1,400
Target EBITDA margin 15% 15% 20%
EBITDA per unit $127,500 $123,750 $140,000
Est. Initial Investment $450,000 $400,000 $250,000
Est. 15% TI allowance $(67,500) $(60,000) $(37,500)
Est. Net Initial Investment $382,500 $340,000 $212,500
Est. Cash on Cash Return 33% 36% 66%
Example Unit-Level Economics
NASDAQ: BURG 20
• Awarding national franchise opportunities
o Signed multi-unit franchise deal for a minimum of 8 restaurants in Southern California
o Signed multi-unit franchise deal for a minimum of 3 restaurants in Austin, Texas
o Others in pipeline
• Continuing to open Company stores in the Pacific Northwest. First location on east coast
opened in Q3
• Uniquely simple and profitable concept - industry leading unit economics
o Smaller footprint
o Contemporary design
o 20% + EBITDA Margins
Growth Strategy
NASDAQ: BURG 21
2121
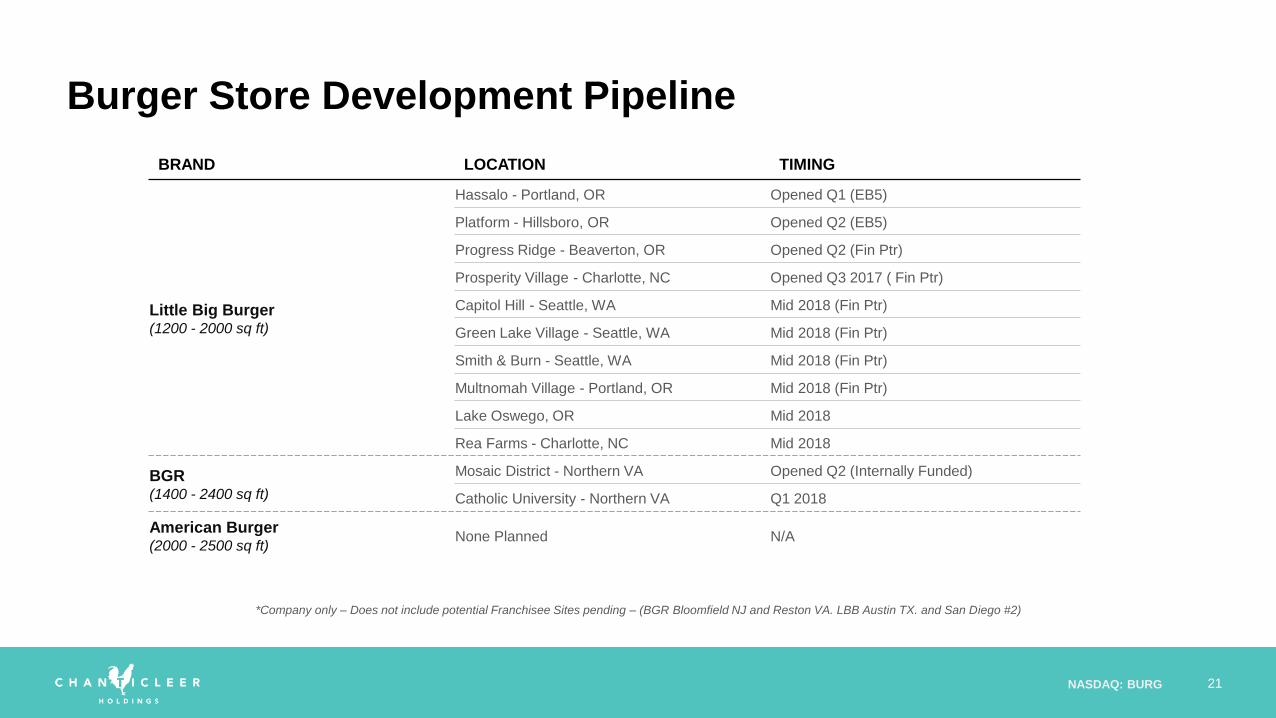
Burger Store Development Pipeline
BRAND LOCATION TIMING
Little Big Burger(1200 - 2000 sq ft)
Hassalo - Portland, OR Opened Q1 (EB5)
Platform - Hillsboro, OR Opened Q2 (EB5)
Progress Ridge - Beaverton, OR Opened Q2 (Fin Ptr)
Prosperity Village - Charlotte, NC Opened Q3 2017 ( Fin Ptr)
Capitol Hill - Seattle, WA Mid 2018 (Fin Ptr)
Green Lake Village - Seattle, WA Mid 2018 (Fin Ptr)
Smith & Burn - Seattle, WA Mid 2018 (Fin Ptr)
Multnomah Village - Portland, OR Mid 2018 (Fin Ptr)
Lake Oswego, OR Mid 2018
Rea Farms - Charlotte, NC Mid 2018
BGR(1400 - 2400 sq ft)
Mosaic District - Northern VA Opened Q2 (Internally Funded)
Catholic University - Northern VA Q1 2018
American Burger(2000 - 2500 sq ft)
None Planned N/A
*Company only – Does not include potential Franchisee Sites pending – (BGR Bloomfield NJ and Reston VA. LBB Austin TX. and San Diego #2)
NASDAQ: BURG 22
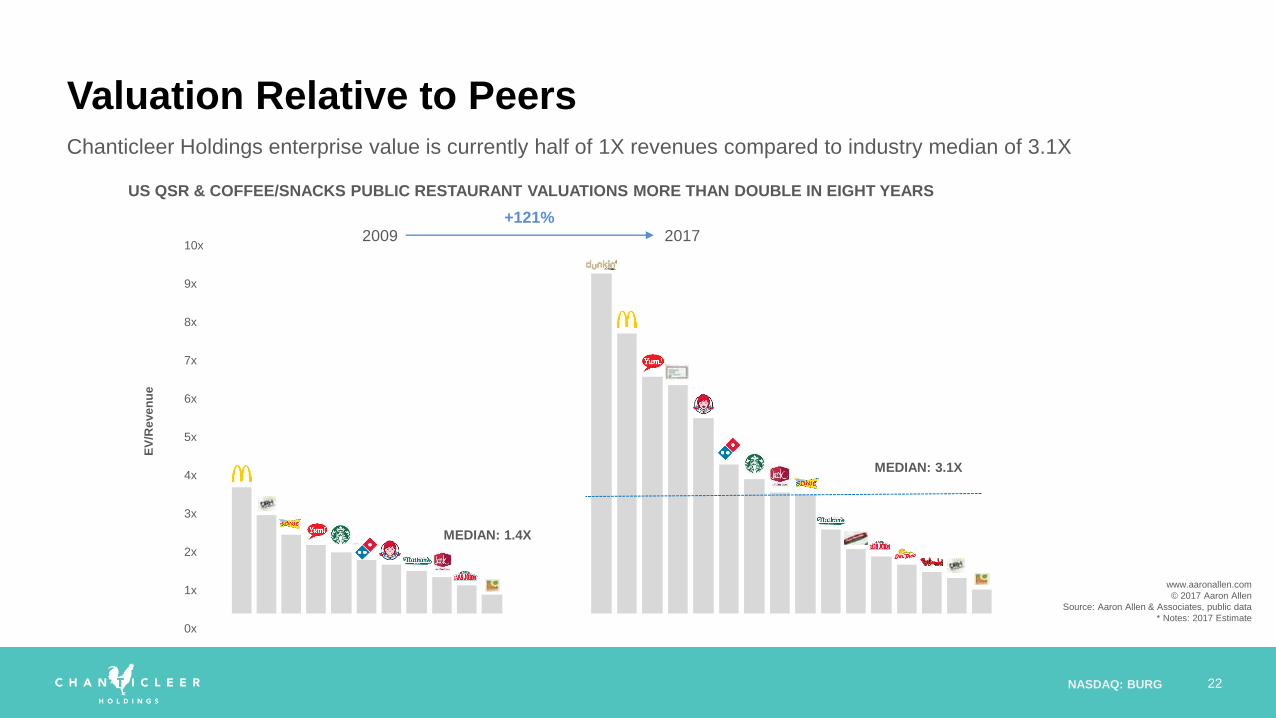
Valuation Relative to PeersChanticleer Holdings enterprise value is currently half of 1X revenues compared to industry median of 3.1X
US QSR & COFFEE/SNACKS PUBLIC RESTAURANT VALUATIONS MORE THAN DOUBLE IN EIGHT YEARS
2009 2017+121%
10x
9x
8x
7x
6x
5x
4x
3x
2x
1x
0x
EV
/Re
ve
nu
e
MEDIAN: 1.4X
MEDIAN: 3.1X
www.aaronallen.com
© 2017 Aaron Allen
Source: Aaron Allen & Associates, public data
* Notes: 2017 Estimate
NASDAQ: BURG 23
• Executing strategy to drive expansion
o 10-15 new stores in 2018
o Expanding capital-light franchising model
• Focused on attractive store economics and large growth potential
o Portfolio of valuable brands provides significant headroom for organic growth
• Strengthening balance sheet
• Evaluating Asset Sale opportunities and closing underperforming stores to improve cash
flow and operating margin
Conclusion

NASDAQ: BURG 24
Jason Assad
Investor & Media Relations
P: (678) 570-6791
NASDAQ: BURG 25
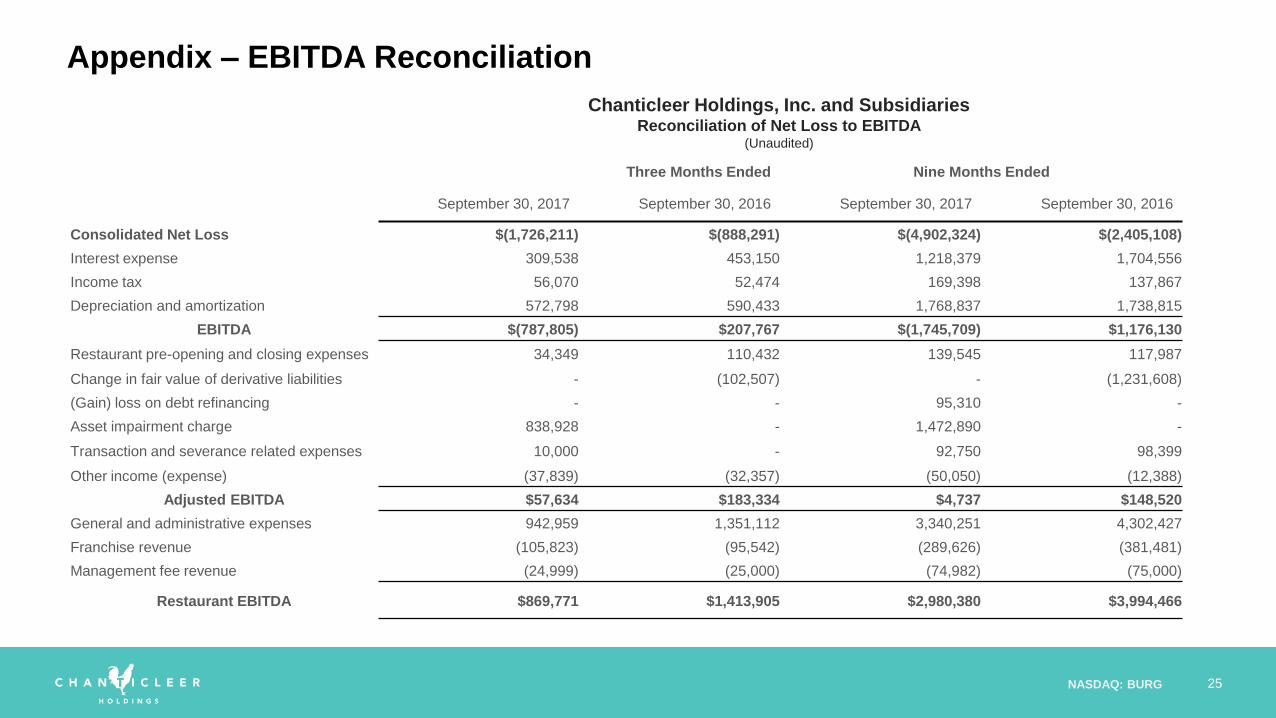
Appendix – EBITDA Reconciliation
Three Months Ended Nine Months Ended
September 30, 2017 September 30, 2016 September 30, 2017 September 30, 2016
Consolidated Net Loss $(1,726,211) $(888,291) $(4,902,324) $(2,405,108)
Interest expense 309,538 453,150 1,218,379 1,704,556
Income tax 56,070 52,474 169,398 137,867
Depreciation and amortization 572,798 590,433 1,768,837 1,738,815
EBITDA $(787,805) $207,767 $(1,745,709) $1,176,130
Restaurant pre-opening and closing expenses 34,349 110,432 139,545 117,987
Change in fair value of derivative liabilities - (102,507) - (1,231,608)
(Gain) loss on debt refinancing - - 95,310 -
Asset impairment charge 838,928 - 1,472,890 -
Transaction and severance related expenses 10,000 - 92,750 98,399
Other income (expense) (37,839) (32,357) (50,050) (12,388)
Adjusted EBITDA $57,634 $183,334 $4,737 $148,520
General and administrative expenses 942,959 1,351,112 3,340,251 4,302,427
Franchise revenue (105,823) (95,542) (289,626) (381,481)
Management fee revenue (24,999) (25,000) (74,982) (75,000)
Restaurant EBITDA $869,771 $1,413,905 $2,980,380 $3,994,466
Chanticleer Holdings, Inc. and SubsidiariesReconciliation of Net Loss to EBITDA
(Unaudited)