Embed Size (px)
Citation preview

Investor Day 2019More value, driven by insights
Scott Peters| Head of Consumer Bank

| 2
Scott PetersHead of Consumer Banking Group
Scott Peters serves as the head of Regions Consumer Banking Group, which is comprised of the Retail Bank, Mortgage, and Indirect Lending and Partnerships. These business lines include Branch Bankers and Retail Leadership; Mortgage Sales; Indirect Auto Lending; Consumer Indirect Lending Partnerships; Consumer Deposit and Loan Product Management; and Consumer Strategy. He is a member of the bank’s Executive Leadership Team.
Prior to joining Regions in 2004, Peters served as executive vice president of Fidelity Personal Investments, with segment management responsibility for 2.6 million households, $1.05 billion in revenues, and $230 billion in assets under management. He joined Fidelity in 1998 from KeyBank, where he served as director of Mass Market Retail Banking and was responsible for the bank’s 2,500 branch‐based retail sales people. He began his banking career with Citibank, where he opened and managed a de novo branch, ultimately serving as director of U.S. Core Product Marketing. In that role, he was responsible for all aspects of consumer credit and deposit product marketing and product development for Citibank’s U.S. retail bank.
Peters holds a bachelor’s of science degree in Marketing from the University of Connecticut. He currently serves on the board of the Bank Administration Institute and the Consumer Bankers Association.
INVESTOR DAY 2019 | Consumer Bank

| 3
Key takeaways
INVESTOR DAY 2019 | Consumer Bank
1 Leveraging SUPERLATIVE SERVICE QUALITY, loyalty, brand, and primacy
2 Investing in OMNI‐CHANNEL to drive customer satisfaction, efficiency, and effectiveness
3 Utilizing STRONG ANALYTICS for smart targeting, execution and resource allocation
4 Use operating advantage to GROW MORTGAGE share and relationships
Consumer Bank
| 4
Consumer 53% Corporate 40% Wealth 7%
Note: Full year 2018
Pre‐tax pre‐provision income contribution
Consumer Bank overview
INVESTOR DAY 2019 | Consumer Bank
Retail Bank
Mortgage Origination & Servicing
• 12% of Consumer pre‐tax income• Revenue $354M• Loans $14.0B• Total servicing portfolio $50B• ~675 MLOs
Indirect Lending
• 2% of Consumer pre‐tax income• Revenue $182M• Avg. loans $4.3B (excl. 3rd party auto)• Indirect auto; Third‐party lending
• 86% of Consumer pre‐tax income• Revenue $2.9B• 4.3M Retail Households• 370K Small Business Households• 1,454 Branches• ~9,600 Associates
Overview | Strengths | Growth Strategies
| 5
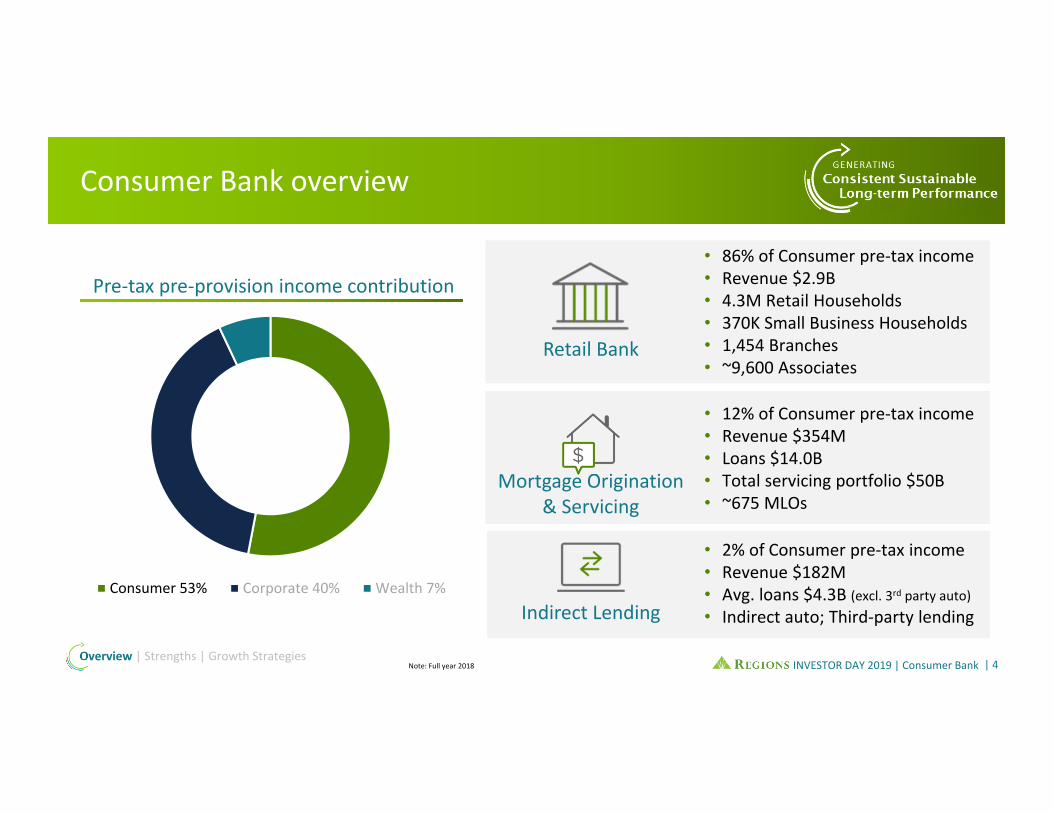
Residential 1st Mortgage 44%
Home Equity 27%
Indirect‐vehicles 10%
Indirect‐other consumer 6%
Credit Card 4%
Other Consumer 9%
Interest‐Free 33%
Interest‐bearing 15%
Savings 15%
Money Market 28%
Time 9%
Consumer 39%
Corporate 58%
Wealth 3%
Consumer 61%
Corporate 28%
Wealth 9%
Other 2%
Note: Balances full year average 2018
Total company deposit balances Total company loan balances
Consumer deposit balances by type Consumer loan balances by type
Consumer banking loans and deposits overview
INVESTOR DAY 2019 | Consumer Bank
$94B
$58B
$81B
$32B
Overview | Strengths | Growth Strategies
| 6
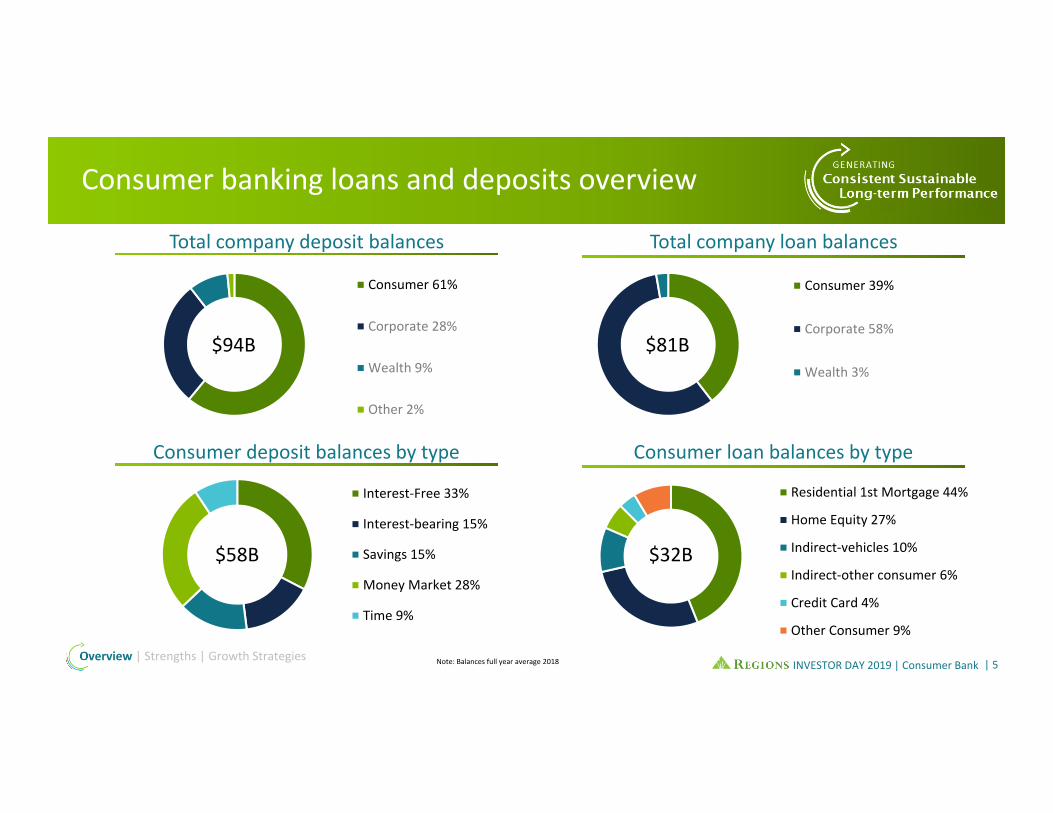
Focused on risk‐adjusted returns and concentration limitsPrudent lending based on risk and relationship profitability
Overview | Strengths | Growth StrategiesINVESTOR DAY 2019 | Consumer Bank
Indirect Lending Consumer Real Estate
Credit Card Direct Lending
• Price competitively to grow share while maintaining proper returns
• Incorporate risk criteria in MSR acquisition strategy• Relationship focused ‐ no correspondent lending, only
retail, delivers higher return
• Optimizing capital by exiting less profitable businesses
• Exited third‐party vehicle arrangement ‐ 2016• Exited dealer indirect ‐ 2019• Managing concentration limits on unsecured third‐
party loans
• Utilize dynamic pricing strategy to grow while ensuring acceptable returns
• Relationship focused as 80% of credit card customers also have deposit account
• Continue growth of spend and balances using unique propositions to deliver attractive risk‐adjusted returns
| 7
Consumer Bank Strengths
INVESTOR DAY 2019 | Consumer Bank

| 8
Unique opportunity for stability and growth
• Strong share in core, stable, midsize markets
• Population more than 130M(1)
• More than 1/3rd of U.S. • Over 50M(1) households• Strong market share:
AL, GA, MS, TN, AR, LA, & FL• Ranked 3rd or better in deposits in
13 of our Top 25 MSAs(2)
• Revenue from core market states grew 3 year CAGR of 3.5%
INVESTOR DAY 2019 | Consumer Bank(1) US Census population and Households for Regions’ 15 states (2) Source: SNL Financial
High share, core markets provide stability
Overview | Strengths | Growth Strategies

| 9(1) US Census. Regions growth 1.01%, U.S. growth .70%(2) US Census. MSAs with >500K in population and >1.02% annual population growth.
Unique opportunity for stability and growthLarge, attractive markets for growth
Market Investments
Other Growing Market Opportunities
AtlantaHoustonOrlandoTampaSt. Louis
New Orleans
DallasMiami
JacksonvilleNashvilleAustin
CharlotteRaleigh
• Growing presence in large, dense, and fast growing markets
• Population growth >40% higher than the rest of the US(1)
• Diverse industries and economic base
• Footprint includes 24 of the 50 fastest growing MSAs(2)
INVESTOR DAY 2019 | Consumer BankOverview | Strengths | Growth Strategies

| 10
‐ a unique team based approach focused on customer needs
2018 Profitability Impact• 3.5% YoY in relationships, our most
valuable customers who generate 140% more revenue
• 70% of sales are to existing customers
Referrals• Branches generated 150K referrals resulting in
$170M revenue in 2018• 30% of mortgage loans booked originate from
branch referrals• 40%+ of new mortgage customers also open a
checking account• Investment Services receives 70K referrals from
branches• 80%+ of Investment Services customers have a
consumer relationship
INVESTOR DAY 2019 | Consumer Bank
SM
Branch MortgageContact Center
Financial EducationWealth Management
SM
Corporate Bank
SM
Overview | Strengths | Growth Strategies

| 11
Strong brand favorability and loyalty
INVESTOR DAY 2019 | Consumer Bank(1) Based on Psyma research 4Q18.
• High brand favorability & top decile loyalty scores(1)
• >60% of consumer deposits are held by customers who have banked with Regions for over 10 years
• 75% of customers are likely to refer friends and family
• 6 consecutive years of strong checking growth with 9% cumulative growth
• Strong growth in younger demographics as ~50% of new checking customers are under 30 years old
Overview | Strengths | Growth Strategies

| 12
External validation confirms our approach is working
Among the top 2 Traditional Banks and Top 10% of all US
companies (+300) for Experience and Trust (2018)
#1 among all measured banks in the 2017 ACSI Retail
Banking Study
#1 among all traditional banks for customer experience & loyalty
(2018)
INVESTOR DAY 2019 | Consumer BankOverview | Strengths | Growth Strategies

| 13
Industry leading customer primacy
INVESTOR DAY 2019 | Consumer Bank
• Top ranked debit card performance(1)
• Primary relationships comprise >90% of checking accounts and half of all consumer deposits(2)
• Stable and lower cost deposits
• Retain >90% of operational accounts of rate sensitive customers
(1) Visa Power Scores (2) ) High quality and primary account estimates are based on multiple individual account behaviors and activities (e.g. balances and transaction levels).
Overview | Strengths | Growth Strategies

| 14
Solid low cost deposit basePrudently managed deposit cost
• Consumer deposits represent 61% of Regions’ total deposits
• Favorable mix of low cost deposits • 33% non‐interest bearing
• Among the lowest deposit cost vs. peers • Half of peer average
• Maintained stable and low deposit betas through the cycle
Consumer Deposit Cost
Consumer Deposits($ in billions; Avg. balances)
INVESTOR DAY 2019 | Consumer Bank
15bps13bps 14bps
16bps
2015 2016 2017 2018
$52.2 $54.6
$56.8 $57.6
2015 2016 2017 2018Overview | Strengths | Growth Strategies

| 15
• #1 debit card portfolio amongst all Visa Issuers
• Credit spend and balances growing faster than the industry over last 3 years
• Early participant in Apple®, Samsung® & Android PayTM along with Zelle® P2P payment platform
• LockIt® feature delivers industry leading digital card control capabilities
Relationship focused card & payment offerings with leading customer engagement
Credit Card Spend
2015 2018
CAGR+12%
Credit Card Balances
2015 2018
CAGR+9%
2015 2018Checkcard/ATM Credit Card
Consumer Card & ATM Fees
CAGR+5%
2015 2018
Credit Card Profitability
CAGR+14%
INVESTOR DAY 2019 | Consumer Bank
• Real time fraud alerts providing increased cardholder security
Overview | Strengths | Growth Strategies

| 16
Consumer Bank Growth Strategies
INVESTOR DAY 2019 | Consumer Bank

| 17
Leveraging data and analyticsUnderstanding our customers is core to our strategy
• Omni‐channel approach provides proactive guidance and meets customer needs while improving efficiency
• Utilize geospatial analytics to drive market strategies, De Novos, and consolidations
• Proactive guidance driven by sophisticated models with machine learning to identify, prioritize and continuously improve analytics
• Use advanced analytics to improve quality and speed of credit decisions and monitoring
INVESTOR DAY 2019 | Consumer BankOverview | Strengths | Growth Strategies

| 18
Creating a value‐added omni‐channel experienceDelivering across all channels
• 60%+ of checking customers use multiple channels
• Automated channels account for 90% of all customer interactions
• 11% YoY digital channel growth while certified bankers deliver higher value interactions
• Branches produce 80% of all sales
• Thin network strategy and a robust digital offering provides efficiencies, higher satisfaction and revenue
INVESTOR DAY 2019 | Consumer BankOverview | Strengths | Growth Strategies
| 19
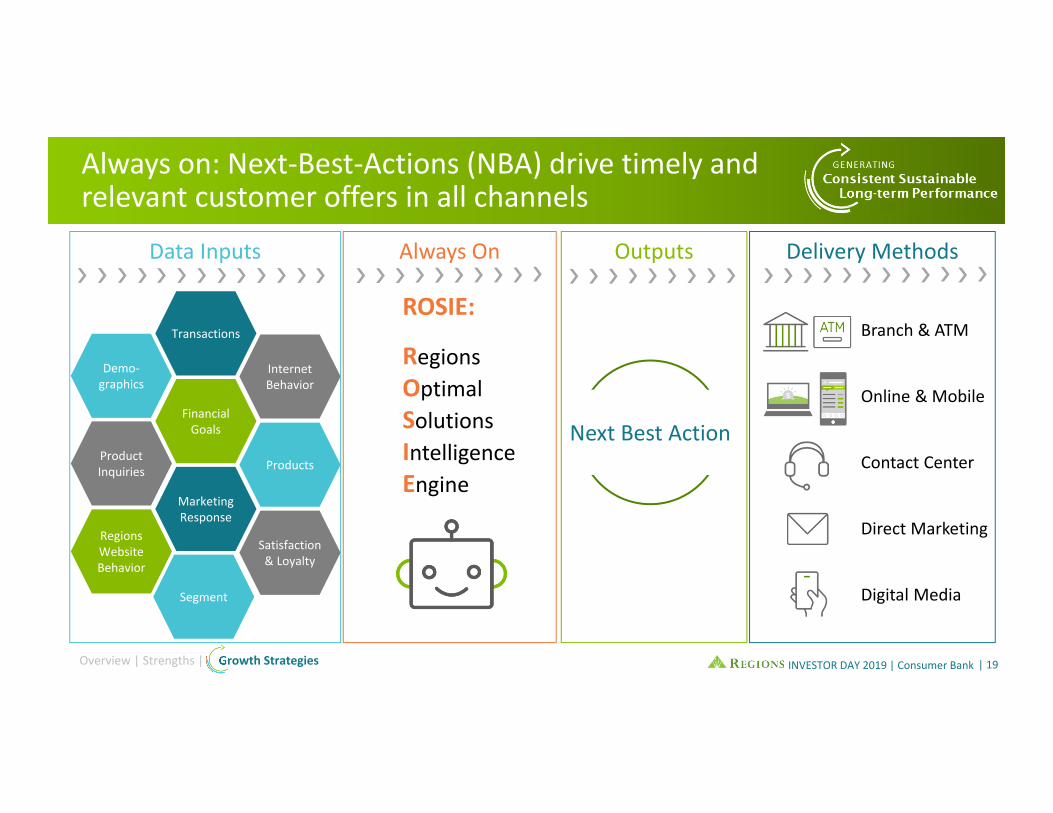
Always on: Next‐Best‐Actions (NBA) drive timely and relevant customer offers in all channels
INVESTOR DAY 2019 | Consumer Bank
Product Inquiries
Regions Website Behavior
Demo‐graphics
Marketing Response
Financial Goals
Products
Satisfaction & Loyalty
Internet Behavior
Segment
Transactions
Data Inputs
Next Best Action
Delivery MethodsOutputsAlways On
ROSIE:
Regions Optimal Solutions Intelligence Engine
Branch & ATM
Online & Mobile
Contact Center
Direct Marketing
Digital Media
Overview | Strengths | Growth Strategies

| 20
Operationalizing data & analyticsWhat does it really mean?
Better and more timely leads, offers and intercepts
Increased sales, retention and revenue
Continuous improvement
Prioritizing best opportunity for proactive resources
INVESTOR DAY 2019 | Consumer BankOverview | Strengths | Growth Strategies

| 21
Thin network strategy
• Digital behaviors and analytics allow us to be relevant with a thin network
• From beginning of 2014 to 2021, expect decreased branch count by ~16% and increased branch trade area population by >10%
• Continued consolidation of proximal and non‐strategic locations
• Increasing presence in large fast growing markets – Houston, Atlanta, Orlando, St. Louis & Tampa
Provides exposure in the right places
INVESTOR DAY 2019 | Consumer BankOverview | Strengths | Growth Strategies

| 22
Optimizing the branch network
• Consolidated 284 branches since 2014 while opening 33 branches with most being in 2018
• Further reduce branch count by ~25 by 2021 with ~100 closures(1)and ~75 De Novos(1)
• Continue to optimize core market distribution network with de novo infills and 2 for 1 consolidations
Consolidations funding growth initiatives
INVESTOR DAY 2019 | Consumer Bank
Cumulative branch consolidations and de novos
2014 2015 2016 2017 2018 2019 2020 2021
Consolidations
De Novos
Over the last five years
Forward strategies
Branch count
2013 2014 2015 2016 2017 2018 2019 2020 2021
‐16%
(1) Not all locations have been identifiedOverview | Strengths | Growth Strategies

| 23
Transforming the retail networkOpportunity for significant improvement in growth & profitability
INVESTOR DAY 2019 | Consumer Bank
• Strengthened trade areas –
growth rates, density, income,
home value, businesses
• Grew checking accounts ~1.5%
annually through transformation
(‘14‐’18)
• Delivered significant
improvement in revenue and
efficiency
Population
Strengthened trade areas an important element of success
Branch Staff
49 50
54
2014* 2018 2021
+10%11,156
9,063 8,853
2014* 2018 2021
‐21%
Making Banking Easier and Consolidations lead to reduction
Revenue Per Branch Consumer Efficiency Ratio
65%60%
56%
2014 2018 2021
500 bps 400
bps
$1.8 $2.3
$2.6
2014 2018 2021
30%13%
($ in millions)
*Beginning of year
(in millions)
Overview | Strengths | Growth Strategies

| 24Based on U.S. Census
Analytics drive customized approach in opportunity markets
INVESTOR DAY 2019 | Consumer Bank
Optimize ORLANDO & TAMPA
Reduce 30+ branches while growing population
Optimize ATLANTAWill have 900K more people in trade area
Build‐out HOUSTONWill have 2.4M more population in trade
area
Reposition ST. LOUISTrade area population growth improved 190%
Overview | Strengths | Growth Strategies

| 25
Making banking easier for customers and associatesMore value, higher satisfaction, at lower cost
INVESTOR DAY 2019 | Consumer Bank
More Value• “Build Better Bankers” initiative increases knowledge of
branch staff by improved training• Utilizing analytics to provide proactive guidance• Free up associates for high value conversations
Higher Satisfaction• Transitioned all branch staff to one banker job model that
establishes a career path• Shifted branch hours to meet customer demand without
increasing staff costs
Lower Cost• New branch design with added technology for self‐service
and easier migration to other channels• Eliminated non‐value added processes through auto
adjudication of loan applications
Operational Tasks (Hours)
‐46%
OperationalPaper Usage
‐64%
Branch transactions migrated to
alternate channels
19%
Banker Interactions
+20%
Over the last year
Over the last four years
Overview | Strengths | Growth Strategies

| 26
Continue to invest in digital
Digital Migration
Real Time Alerts
Proactive Guidance
Digital Universal Application
Digital Payments
Card Security
Real time card pre‐approval
INVESTOR DAY 2019 | Consumer Bank
Rewards multiplier
Instant issue debit &
credit cardAutomating Processes
Focus on high value
Digital credit & deposit availability
Product innovation & delivery
Protecting our customers
Agile redesign of account opening
Overview | Strengths | Growth Strategies
| 27
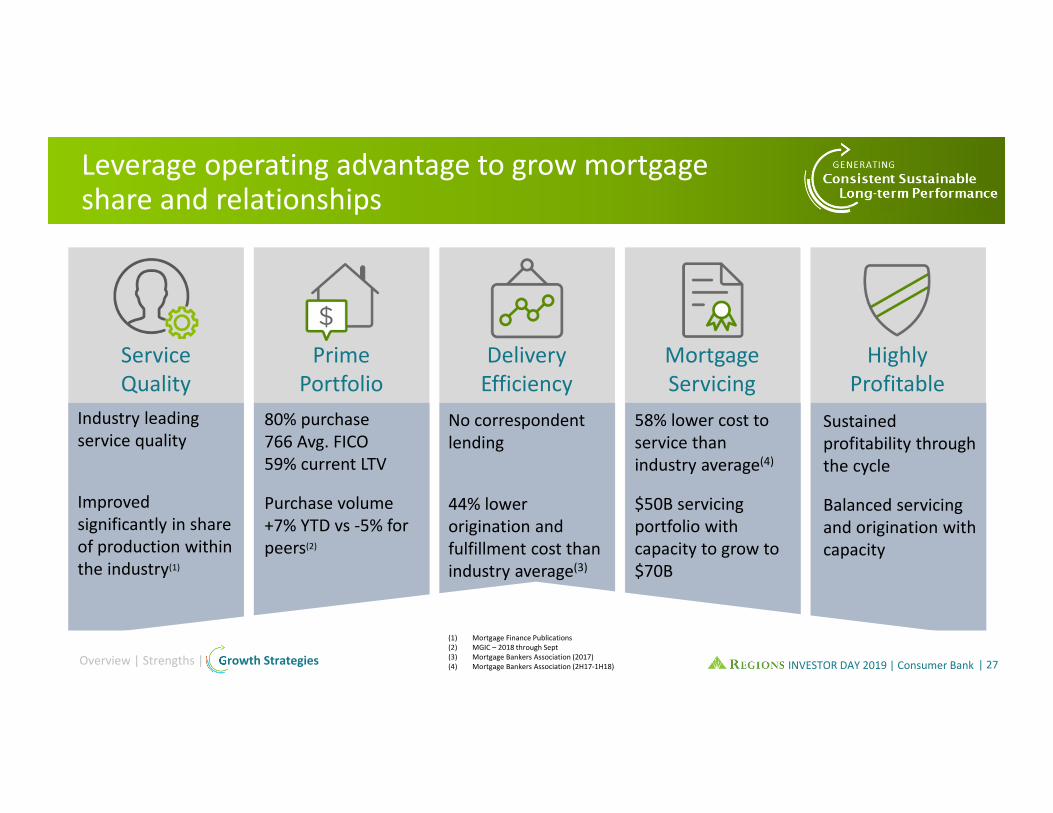
(1) Mortgage Finance Publications(2) MGIC – 2018 through Sept(3) Mortgage Bankers Association (2017)(4) Mortgage Bankers Association (2H17‐1H18) INVESTOR DAY 2019 | Consumer Bank
Leverage operating advantage to grow mortgage share and relationships
Service Quality
Prime Portfolio
Delivery Efficiency
Mortgage Servicing
Highly Profitable
Industry leading service quality
Improved significantly in share of production within the industry(1)
80% purchase766 Avg. FICO59% current LTV
Purchase volume +7% YTD vs ‐5% for peers(2)
No correspondent lending
44% lower origination and fulfillment cost than industry average(3)
58% lower cost to service than industry average(4)
$50B servicing portfolio with capacity to grow to $70B
Sustained profitability through the cycle
Balanced servicing and origination with capacity
Overview | Strengths | Growth Strategies

| 28
Leverage business advantage to grow mortgage share and relationships
• Investing in Mortgage Loan Officers and growing direct‐to‐consumer
• Leverage servicing efficiency and quality to grow mortgage servicing rights and origination / servicing contribution split
• Drive growth through sophisticated analytics that identify potential mortgage customers
• Launched universal online application that makes it easier and quicker for customers to apply
INVESTOR DAY 2019 | Consumer BankOverview | Strengths Growth Strategies

| 29
Key takeawaysConsumer Bank
INVESTOR DAY 2019 | Consumer Bank
1 Leveraging SUPERLATIVE SERVICE QUALITY, loyalty, brand, and primacy
2 Investing in OMNI‐CHANNEL to drive customer satisfaction, efficiency, and effectiveness
3 Utilizing STRONG ANALYTICS for smart targeting, execution and resource allocation
4 Use operating advantage to GROW MORTGAGE share and relationships
Efficiency Ratio
201860%
Financial Expectations
2021~400 bps
Improvement

| 30
Appendix
INVESTOR DAY 2019 | Consumer Bank

| 31Note: Full Year 2018
Total Company Revenue Total Company Non‐Interest Income
Consumer Total Revenue Consumer Non‐Interest Income
Consumer banking revenue overview
INVESTOR DAY 2019 | Consumer BankOverview | Strengths | Growth Strategies
Net Interest Income 66%
Non‐Interest Income 34%
Service Charges 49%
Mortgage 12%
Card & ATM 34%
Other 5%
Consumer 58%
Commercial 33%
Wealth 9%
Consumer 57%
Commercial 27%
Wealth 16%
$1.1B
$5.8B
$3.4B
$2.0B

| 32
Forward looking statements disclosure
This presentation may include forward‐looking statements as defined in the Private Securities Litigation Reform Act of 1995, which reflect Regions’ current views with respect to future events and financial performance. Forward‐looking statements are not based on historical information, but rather are related to future operations, strategies, financial results or other developments. Forward‐looking statements are based on management’s current expectations as well as certain assumptions and estimates made by, and information available to, management at the time the statements are made. Those statements are based on general assumptions and are subject to various risks, and because they also relate to the future they are likewise subject to inherent uncertainties and other factors that may cause actual results to differ materially from the views, beliefs and projections expressed in such statements. Therefore, we caution you against relying on any of these forward‐looking statements. These risks, uncertainties and other factors include, but are not limited to, those described below:
• Current and future economic and market conditions in the United States generally or in the communities we serve, including the effects of possible declines in property values, increases in unemployment rates and potential reductions of economic growth, which may adversely affect our lending and other businesses and our financial results and conditions.
• Possible changes in trade, monetary and fiscal policies of, and other activities undertaken by, governments, agencies, central banks and similar organizations, which could have a material adverse effect on our earnings.• Possible changes in market interest rates or capital markets could adversely affect our revenue and expense, the value of assets and obligations, and the availability and cost of capital and liquidity.• Any impairment of our goodwill or other intangibles, any repricing of assets, or any adjustment of valuation allowances on our deferred tax assets due to changes in law, adverse changes in the economic environment, declining operations of the reporting unit or other factors.• The effect of changes in tax laws, including the effect of Tax Reform and any future interpretations of or amendments to Tax Reform, which may impact our earnings, capital ratios and our ability to return capital to stockholders.• Possible changes in the creditworthiness of customers and the possible impairment of the collectability of loans and leases, including operating leases.• Changes in the speed of loan prepayments, loan origination and sale volumes, charge‐offs, loan loss provisions or actual loan losses where our allowance for loan losses may not be adequate to cover our eventual losses.• Possible acceleration of prepayments on mortgage‐backed securities due to low interest rates, and the related acceleration of premium amortization on those securities.• Loss of customer checking and savings account deposits as customers pursue other, higher‐yield investments, which could increase our funding costs.• Possible changes in consumer and business spending and saving habits and the related effect on our ability to increase assets and to attract deposits, which could adversely affect our net income.• Our ability to effectively compete with other traditional and non‐traditional financial services companies, some of whom possess greater financial resources than we do or are subject to different regulatory standards than we are.• Our inability to develop and gain acceptance from current and prospective customers for new products and services and the enhancement of existing products and services to meet customers’ needs and respond to emerging technological trends in a timely manner could have a negative
impact on our revenue.• Our inability to keep pace with technological changes could result in losing business to competitors.• Changes in laws and regulations affecting our businesses, including legislation and regulations relating to bank products and services, as well as changes in the enforcement and interpretation of such laws and regulations by applicable governmental and self‐regulatory agencies, which could
require us to change certain business practices, increase compliance risk, reduce our revenue, impose additional costs on us, or otherwise negatively affect our businesses.• Our ability to obtain a regulatory non‐objection (as part of the CCAR process or otherwise) to take certain capital actions, including paying dividends and any plans to increase common stock dividends, repurchase common stock under current or future programs, or redeem preferred stock or
other regulatory capital instruments, may impact our ability to return capital to stockholders and market perceptions of us. • Our ability to comply with stress testing and capital planning requirements (as part of the CCAR process or otherwise) may continue to require a significant investment of our managerial resources due to the importance and intensity of such tests and requirements.• Our ability to comply with applicable capital and liquidity requirements (including, among other things, the Basel III capital standards and the LCR rule), including our ability to generate capital internally or raise capital on favorable terms, and if we fail to meet requirements, our financial
condition could be negatively impacted.• The effects of any developments, changes or actions relating to any litigation or regulatory proceedings brought against us or any of our subsidiaries.• The costs, including possibly incurring fines, penalties, or other negative effects (including reputational harm) of any adverse judicial, administrative, or arbitral rulings or proceedings, regulatory enforcement actions, or other legal actions to which we or any of our subsidiaries are a party, and
which may adversely affect our results. • Our ability to manage fluctuations in the value of assets and liabilities and off‐balance sheet exposure so as to maintain sufficient capital and liquidity to support our business.• Our ability to execute on our strategic and operational plans, including our ability to fully realize the financial and non‐financial benefits relating to our strategic initiatives.• The risks and uncertainties related to our acquisition or divestiture of businesses.• The success of our marketing efforts in attracting and retaining customers.• Our ability to recruit and retain talented and experienced personnel to assist in the development, management and operation of our products and services may be affected by changes in laws and regulations in effect from time to time.• Fraud or misconduct by our customers, employees or business partners.• Any inaccurate or incomplete information provided to us by our customers or counterparties.• Inability of our framework to manage risks associated with our business such as credit risk and operational risk, including third‐party vendors and other service providers, which could, among other things, result in a breach of operating or security systems as a result of a cyber attack or similar
act or failure to deliver our services effectively. • Dependence on key suppliers or vendors to obtain equipment and other supplies for our business on acceptable terms.• The inability of our internal controls and procedures to prevent, detect or mitigate any material errors or fraudulent acts.• The effects of geopolitical instability, including wars, conflicts and terrorist attacks and the potential impact, directly or indirectly, on our businesses.• The effects of man‐made and natural disasters, including fires, floods, droughts, tornadoes, hurricanes, and environmental damage, which may negatively affect our operations and/or our loan portfolios and increase our cost of conducting business. The severity and impact of future
earthquakes, fires, hurricanes, tornadoes, droughts, floods and other weather‐related events are difficult to predict and may be exacerbated by global climate change.• Changes in commodity market prices and conditions could adversely affect the cash flows of our borrowers operating in industries that are impacted by changes in commodity prices (including businesses indirectly impacted by commodities prices such as businesses that transport
commodities or manufacture equipment used in the production of commodities), which could impair their ability to service any loans outstanding to them and/or reduce demand for loans in those industries.
INVESTOR DAY 2019 | Consumer Bank
| 33
Forward looking statements disclosure (continued)
• Our ability to identify and address cyber‐security risks such as data security breaches, malware, “denial of service” attacks, “hacking” and identity theft, a failure of which could disrupt our business and result in the disclosure of and/or misuse or misappropriation of confidential or proprietary information, disruption or damage to our systems, increased costs, losses, or adverse effects to our reputation.
• Our ability to realize our adjusted efficiency ratio target as part of our expense management initiatives.• Possible cessation or market replacement of LIBOR and the related effect on our LIBOR‐based financial products and contracts, including, but not limited to, hedging products, debt obligations, investments, and loans.• Possible downgrades in our credit ratings or outlook could increase the costs of funding from capital markets. • The effects of a possible downgrade in the U.S. government’s sovereign credit rating or outlook, which could result in risks to us and general economic conditions that we are not able to predict.• The effects of problems encountered by other financial institutions that adversely affect us or the banking industry generally could require us to change certain business practices, reduce our revenue, impose additional costs on us, or otherwise negatively affect our businesses.• The effects of the failure of any component of our business infrastructure provided by a third party could disrupt our businesses, result in the disclosure of and/or misuse of confidential information or proprietary information, increase our costs, negatively affect our reputation, and cause
losses. • Our ability to receive dividends from our subsidiaries could affect our liquidity and ability to pay dividends to stockholders.• Changes in accounting policies or procedures as may be required by the FASB or other regulatory agencies could materially affect our financial statements and how we report those results, and expectations and preliminary analyses relating to how such changes will affect our financial results
could prove incorrect.• Other risks identified from time to time in reports that we file with the SEC.• Fluctuations in the price of our common stock and inability to complete stock repurchases in the time frame and/or on the terms anticipated.• The effects of any damage to our reputation resulting from developments related to any of the items identified above.
The foregoing list of factors is not exhaustive. For discussion of these and other factors that may cause actual results to differ from expectations, look under the captions “Forward‐Looking Statements” and “Risk Factors” of Regions’ Annual Report on Form 10‐K for the year ended December 31, 2018 as filed with the SEC. The words "future," “anticipates,” "assumes," “intends,” “plans,” “seeks,” “believes,” "predicts," "potential," "objectives," “estimates,” “expects,” “targets,” “projects,” “outlook,” “forecast,” "would," “will,” “may,” “might,” “could,” “should,” “can,” and similar terms and expressions often signify forward‐looking statements. You should not place undue reliance on any forward‐looking statements, which speak only as of the date made. Factors or events that could cause our actual results to differ may emerge from time to time, and it is not possible to predict all of them. We assume no obligation and do not intend to update or revise any forward‐looking statements that are made from time to time, either as a result of future developments, new information or otherwise, except as may be required by law. Regions’ Investor Relations contact is Dana Nolan at (205) 264‐7040; Regions’ Media contact is Evelyn Mitchell at (205) 264‐4551.
INVESTOR DAY 2019 | Consumer Bank