Embed Size (px)
Citation preview
Investor Day 201830 April 2018
INVESTOR DAY 2018
This publication is prepared by the Transurban Group, comprising Transurban Holdings Limited (ACN 098 143 429), Transurban Holding Trust (ARSN 098 807 419) and Transurban International Limited (ACN 121 746 825). The responsible entity of Transurban Holding Trust is Transurban Infrastructure Management Limited (ACN 098 147 678) (AFSL 246 585). No representation or warranty is made as to the accuracy, completeness or correctness of the information contained in this publication. To the maximum extent permitted by law, none of the Transurban Group, its Directors, employees or agents or any other person, accept any liability for any loss arising from or in connection with this publication including, without limitation, any liability arising from fault or negligence, or make any representations or warranties regarding, and take no responsibility for, any part of this publication and make no representation or warranty, express or implied, as to the currency, accuracy, reliability, or completeness of information in this publication. The information in this publication does not take into account individual investment and financial circumstances and is not intended in any way to influence a person dealing with a financial product, nor provide financial advice. It does not constitute an offer to subscribe for securities in the Transurban Group. Any person intending to deal in Transurban Group securities is recommended to obtain professional advice.
UNITED STATES OF AMERICAThese materials do not constitute an offer of securities for sale in the United States of America, and the securities referred to in these materials have not been and will not be registered under the United States Securities Act of 1933, as amended, and may not be offered or sold in the United States absent registration or an exemption from registration.
© Copyright Transurban Limited ABN 96 098 143 410. All rights reserved. No part of this publication may be reproduced, stored in a retrieval system, or transmitted in any form or by any means, electronic, mechanical, photocopying, recording or otherwise, without the written permission of the Transurban Group.
A25 BASIS OF PREPARATIONFinancial information including pro forma financial information has been prepared using A25 financial information as extracted from audited financial statements of Concession A-25, Limited Partnership for the financial years ended 31 December 2015, 2016 and 2017. All financial information has been presented in Canadian dollars (CAD). The exchange rate to AUD at 22 March 2018 was 1.00.
2
INVESTOR DAY 2018
TransurbanScott Charlton
INVESTOR DAY 2018 4
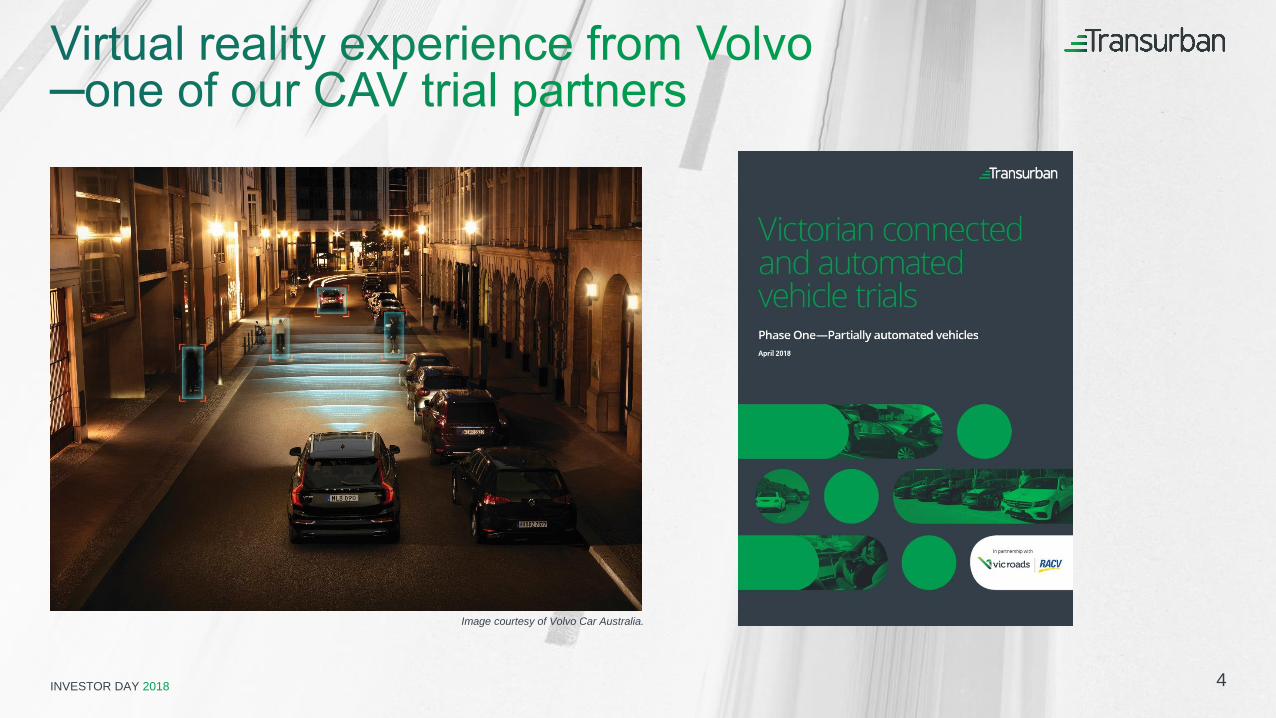
Image courtesy of Volvo Car Australia.
INVESTOR DAY 2018 5
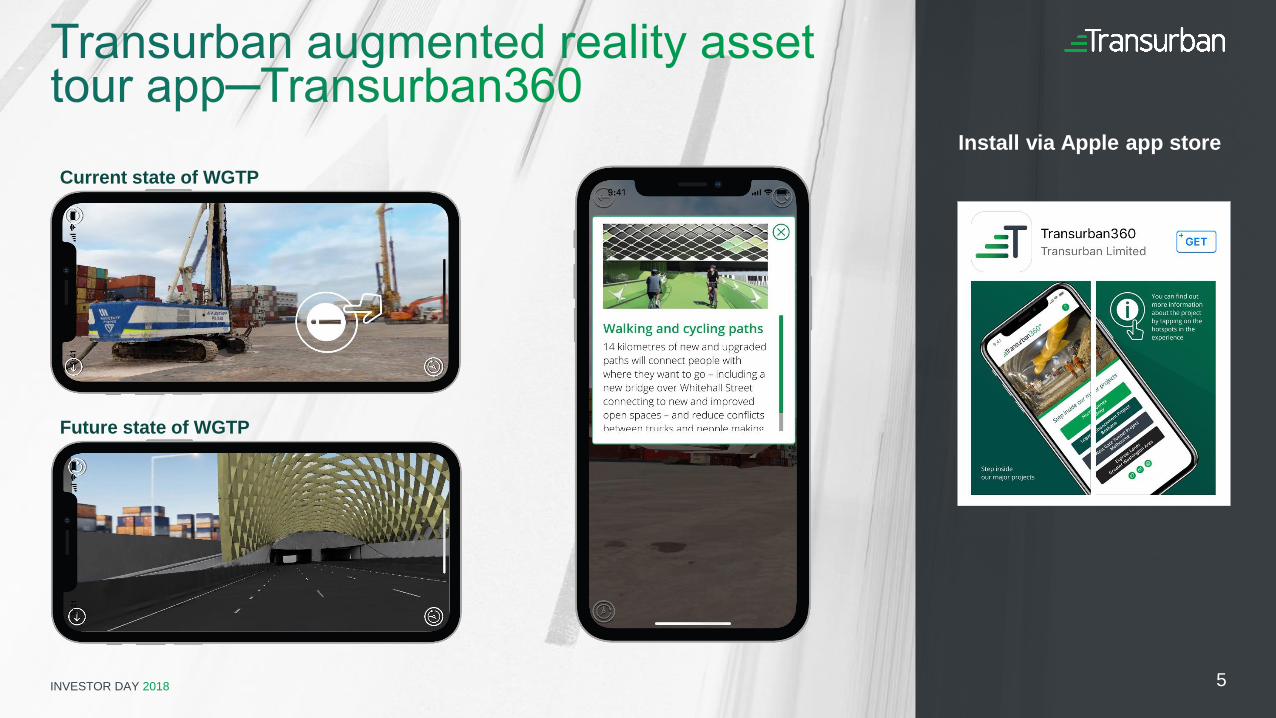
Install via Apple app storeCurrent state of WGTP
Future state of WGTP
INVESTOR DAY 2018
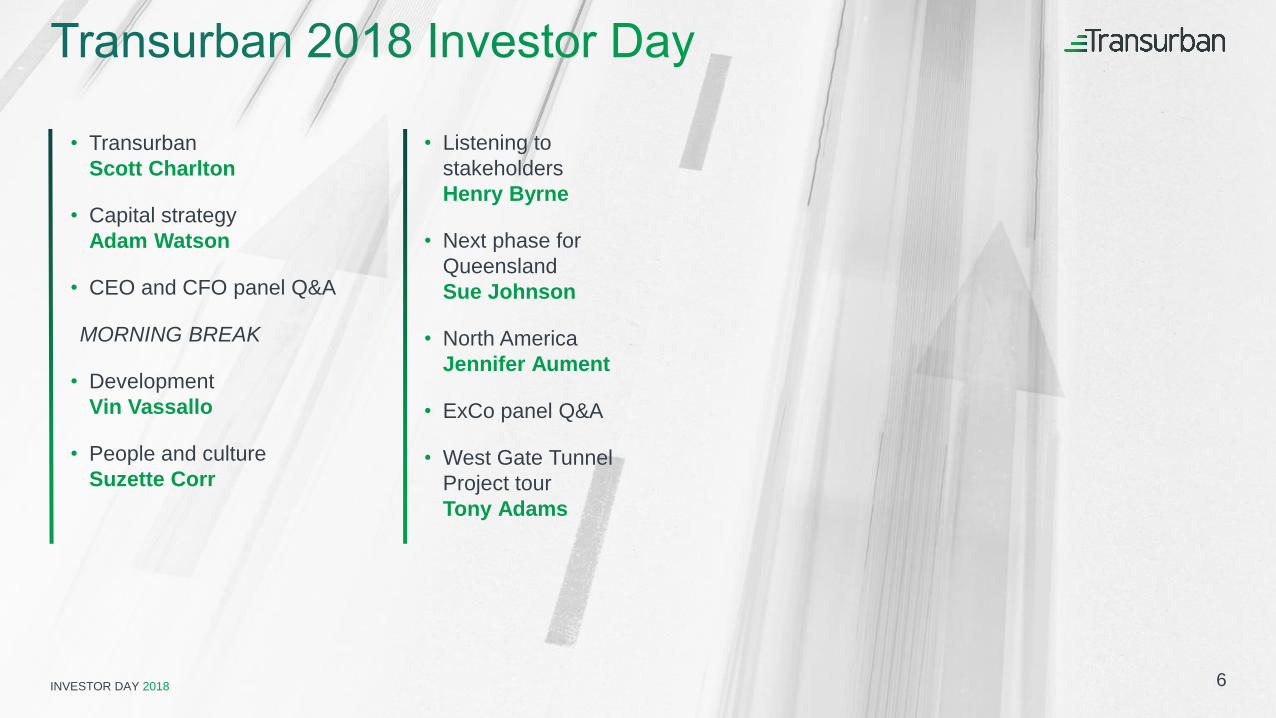
• TransurbanScott Charlton
• Capital strategyAdam Watson
• CEO and CFO panel Q&A
MORNING BREAK
• Development Vin Vassallo
• People and cultureSuzette Corr
• Listening to stakeholdersHenry Byrne
• Next phase forQueenslandSue Johnson
• North America Jennifer Aument
• ExCo panel Q&A
• West Gate Tunnel Project tourTony Adams
6
INVESTOR DAY 2018
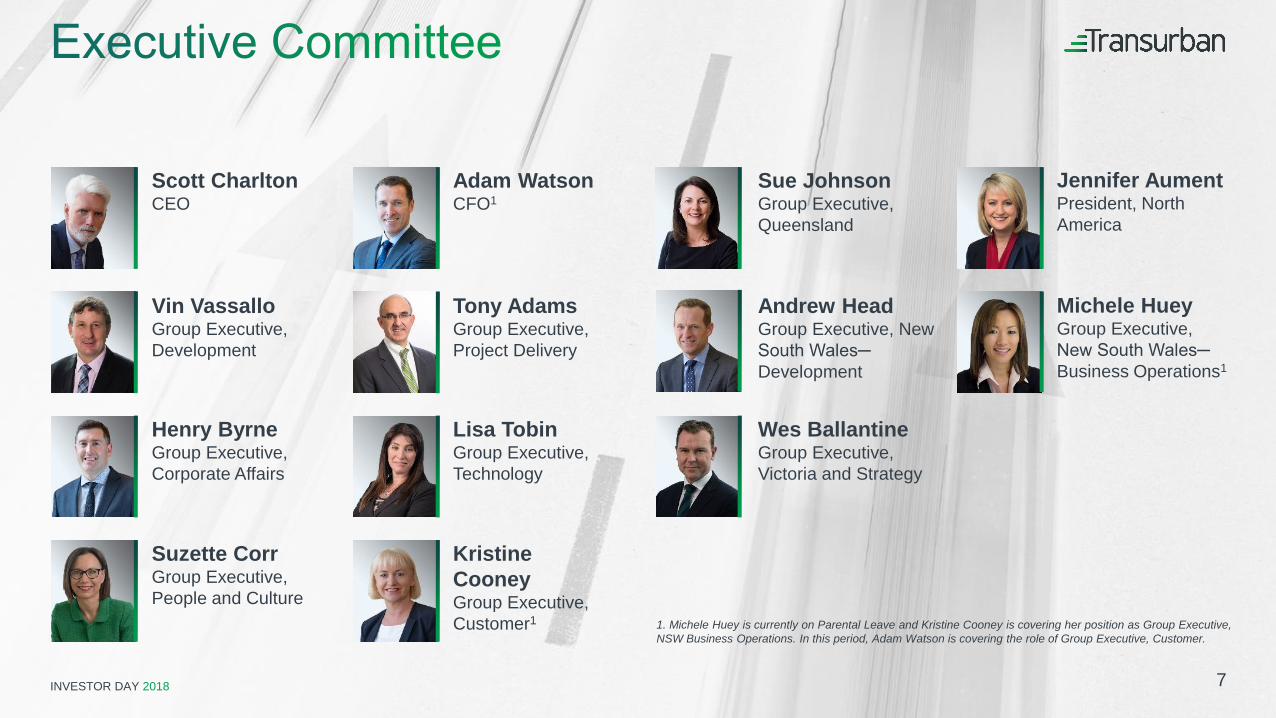
Scott CharltonCEO
Adam WatsonCFO1
Jennifer AumentPresident, North America
Michele HueyGroup Executive, New South Wales─
Business Operations1
Andrew HeadGroup Executive, New South Wales─
Development
Sue JohnsonGroup Executive, Queensland
Wes BallantineGroup Executive, Victoria and Strategy
Tony AdamsGroup Executive, Project Delivery
Vin VassalloGroup Executive, Development
Lisa TobinGroup Executive, Technology
Kristine CooneyGroup Executive, Customer1
Henry ByrneGroup Executive, Corporate Affairs
Suzette CorrGroup Executive, People and Culture
1. Michele Huey is currently on Parental Leave and Kristine Cooney is covering her position as Group Executive,
NSW Business Operations. In this period, Adam Watson is covering the role of Group Executive, Customer.
7
INVESTOR DAY 2018
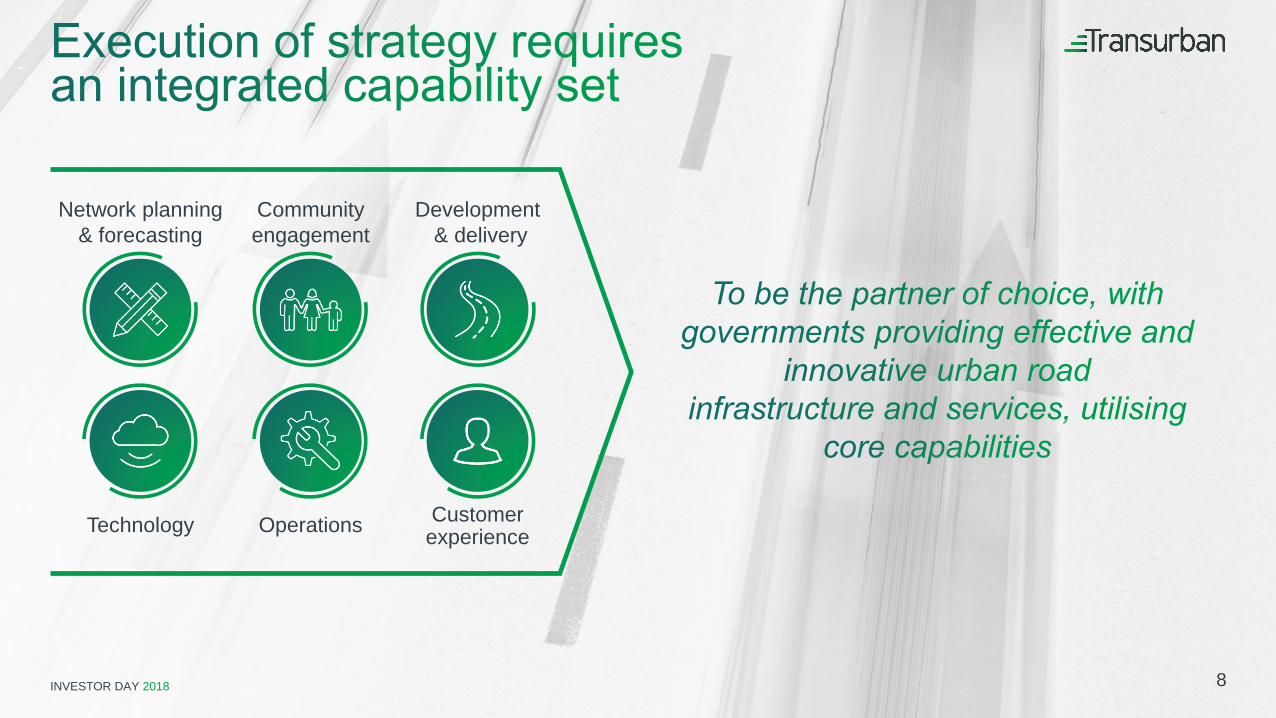
Network planning& forecasting
Development& delivery
Communityengagement
Technology Operations Customerexperience
8
INVESTOR DAY 2018
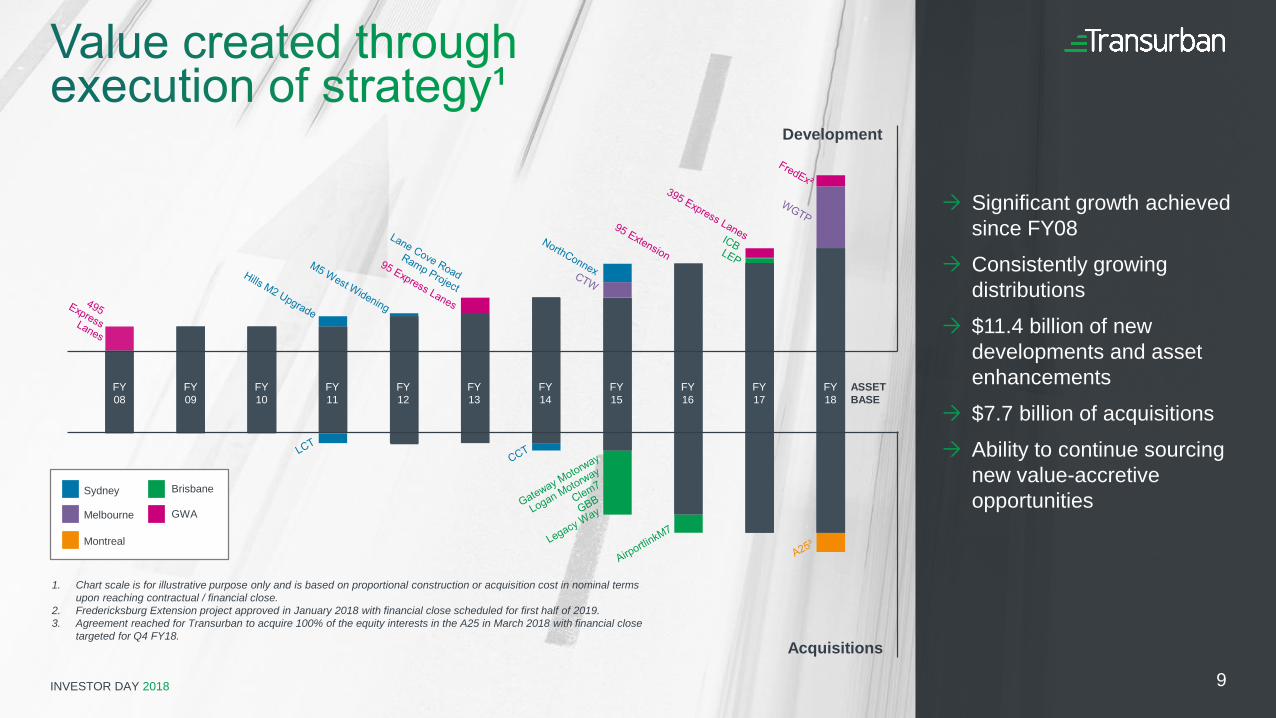
Significant growth achieved since FY08
Consistently growing distributions
$11.4 billion of new developments and asset enhancements
$7.7 billion of acquisitions Ability to continue sourcing
new value-accretive opportunities
Acquisitions
Sydney
Melbourne
Brisbane
GWA
Montreal
ASSETBASE
Development
1. Chart scale is for illustrative purpose only and is based on proportional construction or acquisition cost in nominal terms
upon reaching contractual / financial close.
2. Fredericksburg Extension project approved in January 2018 with financial close scheduled for first half of 2019.
3. Agreement reached for Transurban to acquire 100% of the equity interests in the A25 in March 2018 with financial close
targeted for Q4 FY18.
9
FY08
FY09
FY10
FY11
FY12
FY13
FY15
FY16
FY17
FY14
FY18
INVESTOR DAY 2018INVESTOR DAY 2018
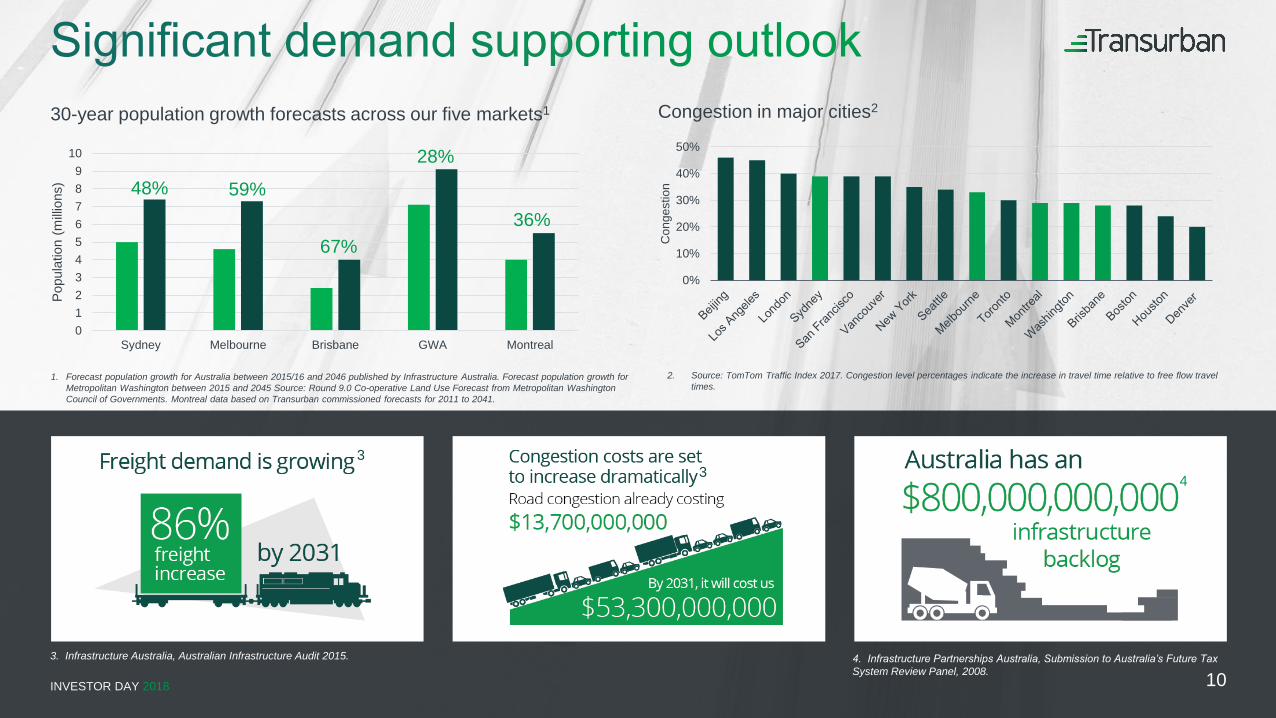
2. Source: TomTom Traffic Index 2017. Congestion level percentages indicate the increase in travel time relative to free flow travel
times.
30-year population growth forecasts across our five markets1 Congestion in major cities2
1. Forecast population growth for Australia between 2015/16 and 2046 published by Infrastructure Australia. Forecast population growth for
Metropolitan Washington between 2015 and 2045 Source: Round 9.0 Co-operative Land Use Forecast from Metropolitan Washington
Council of Governments. Montreal data based on Transurban commissioned forecasts for 2011 to 2041.
0123456789
10
Sydney Melbourne Brisbane GWA Montreal
Popu
latio
n (m
illion
s) 48% 59%
67%
28%
36%
0%
10%
20%
30%
40%
50%
Con
gest
ion
103. Infrastructure Australia, Australian Infrastructure Audit 2015. 4. Infrastructure Partnerships Australia, Submission to Australia’s Future Tax
System Review Panel, 2008.
33 4
INVESTOR DAY 2018
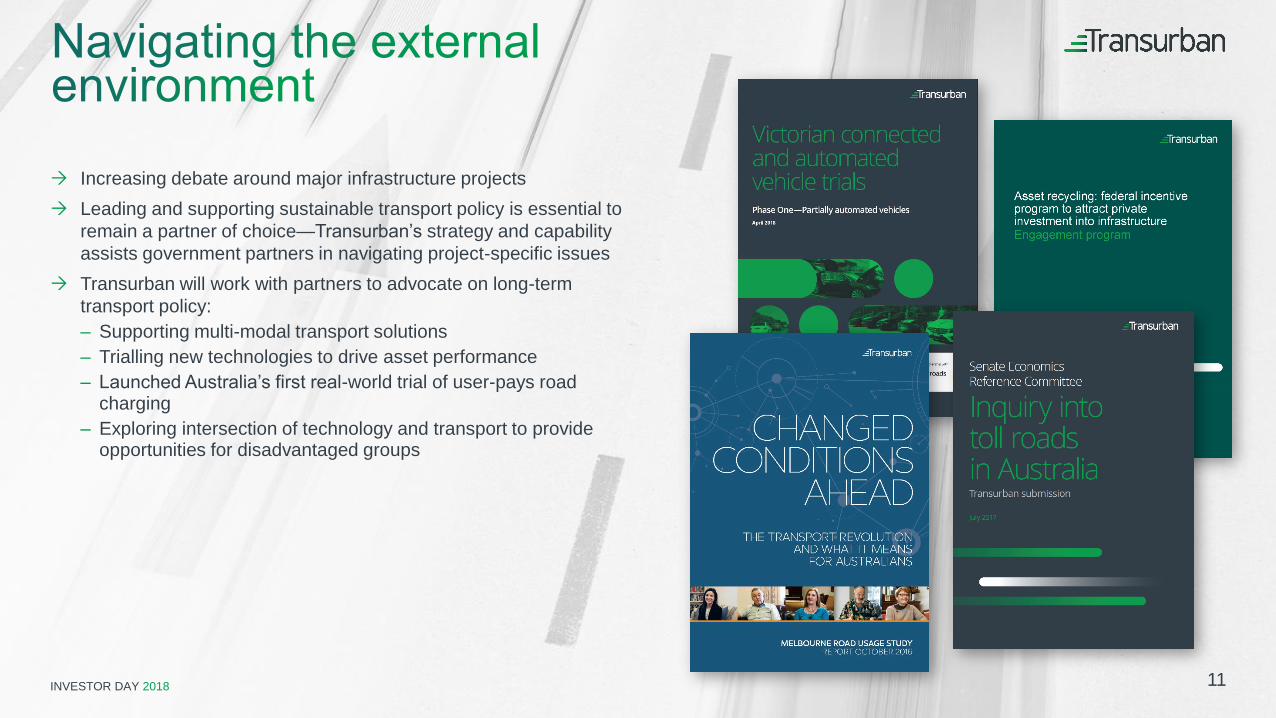
Increasing debate around major infrastructure projects Leading and supporting sustainable transport policy is essential to
remain a partner of choice—Transurban’s strategy and capability assists government partners in navigating project-specific issues
Transurban will work with partners to advocate on long-term transport policy:– Supporting multi-modal transport solutions– Trialling new technologies to drive asset performance – Launched Australia’s first real-world trial of user-pays road
charging– Exploring intersection of technology and transport to provide
opportunities for disadvantaged groups
11
INVESTOR DAY 2018INVESTOR DAY 2018
Melbourne
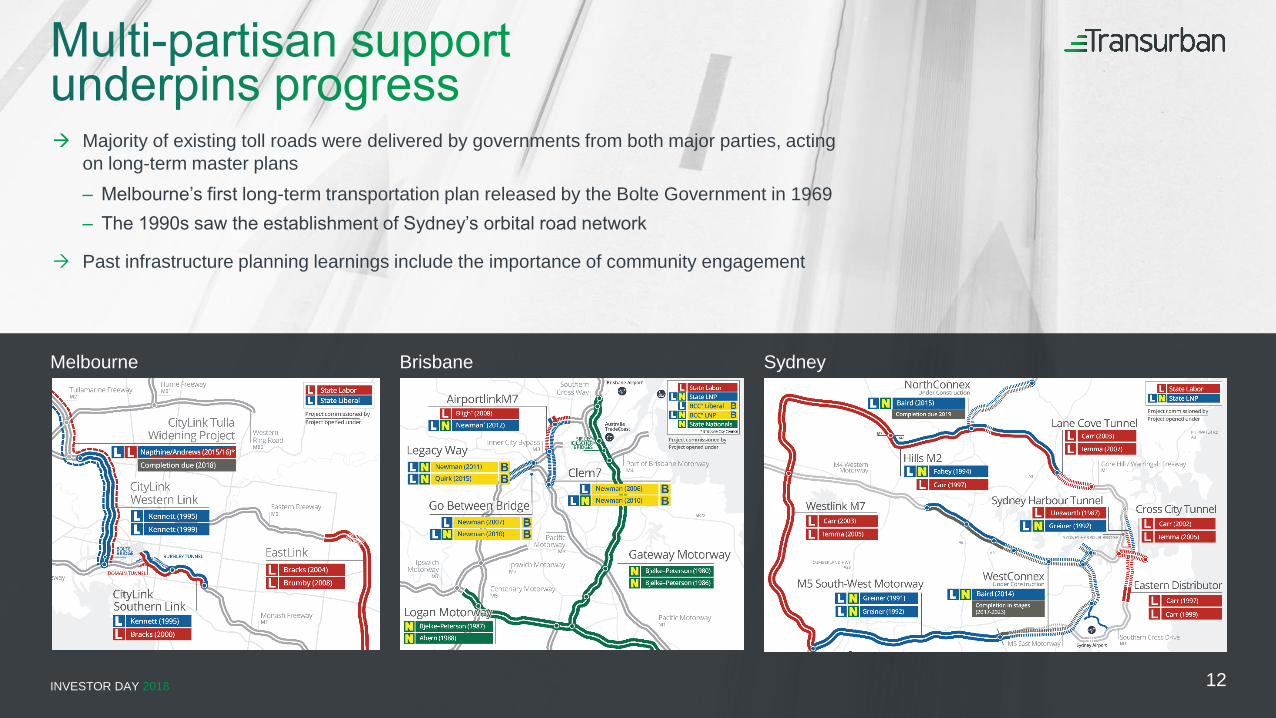
Majority of existing toll roads were delivered by governments from both major parties, acting on long-term master plans– Melbourne’s first long-term transportation plan released by the Bolte Government in 1969– The 1990s saw the establishment of Sydney’s orbital road network
Past infrastructure planning learnings include the importance of community engagement
Brisbane Sydney
12
INVESTOR DAY 2018
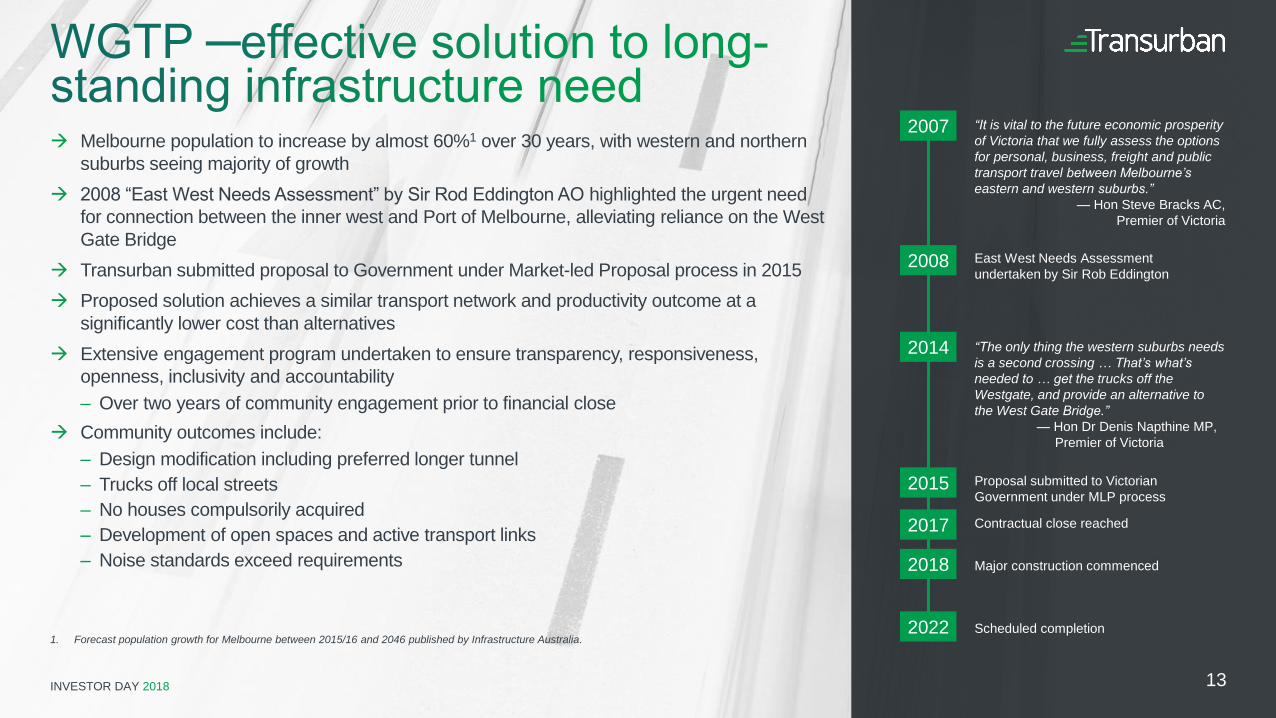
Melbourne population to increase by almost 60%1 over 30 years, with western and northern suburbs seeing majority of growth
2008 “East West Needs Assessment” by Sir Rod Eddington AO highlighted the urgent need for connection between the inner west and Port of Melbourne, alleviating reliance on the West Gate Bridge
Transurban submitted proposal to Government under Market-led Proposal process in 2015 Proposed solution achieves a similar transport network and productivity outcome at a
significantly lower cost than alternatives Extensive engagement program undertaken to ensure transparency, responsiveness,
openness, inclusivity and accountability– Over two years of community engagement prior to financial close
Community outcomes include:– Design modification including preferred longer tunnel– Trucks off local streets – No houses compulsorily acquired– Development of open spaces and active transport links– Noise standards exceed requirements
1. Forecast population growth for Melbourne between 2015/16 and 2046 published by Infrastructure Australia.
2008
2015
2017
“It is vital to the future economic prosperity
of Victoria that we fully assess the options
for personal, business, freight and public
transport travel between Melbourne’s
eastern and western suburbs.”
— Hon Steve Bracks AC,Premier of Victoria
East West Needs Assessment undertaken by Sir Rob Eddington
Proposal submitted to Victorian Government under MLP process
Contractual close reached
2007
2014 “The only thing the western suburbs needs
is a second crossing … That’s what’s
needed to … get the trucks off the
Westgate, and provide an alternative to
the West Gate Bridge.”
— Hon Dr Denis Napthine MP,Premier of Victoria
2018
2022
Major construction commenced
Scheduled completion
13
INVESTOR DAY 2018 14
INVESTOR DAY 2018
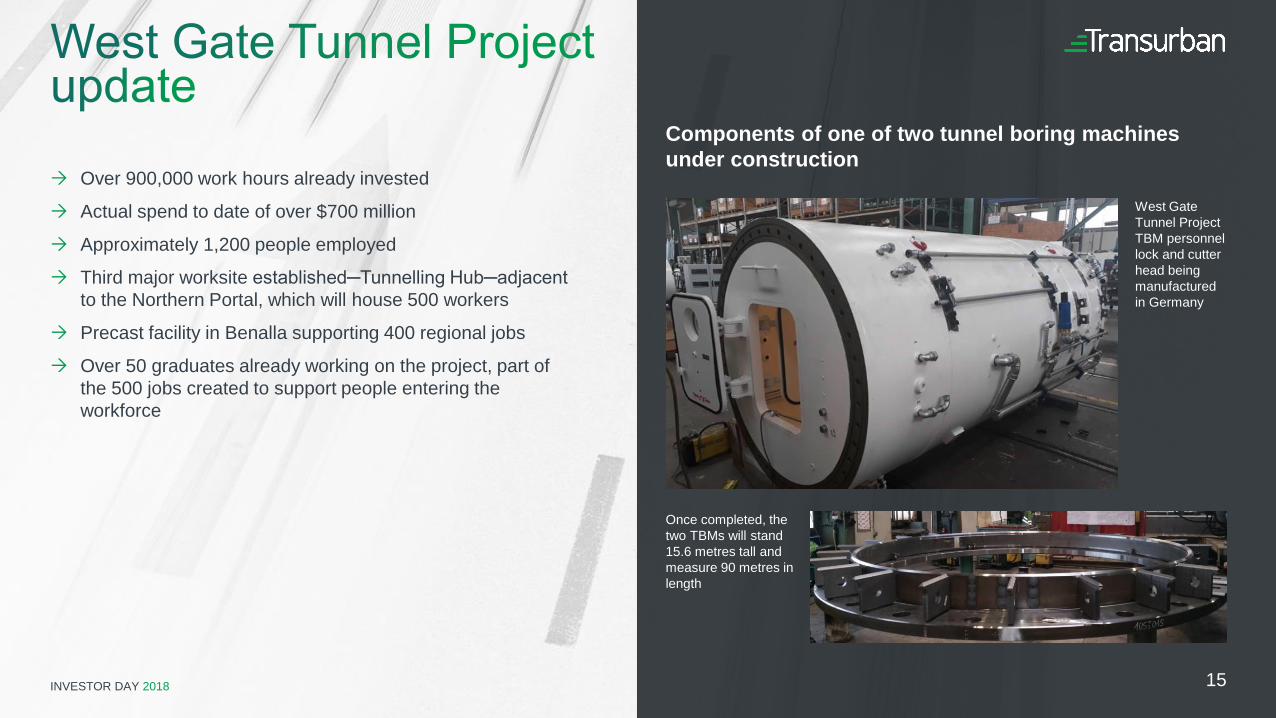
Components of one of two tunnel boring machines under construction
West Gate Tunnel Project TBM personnel lock and cutter head being manufactured in Germany
Over 900,000 work hours already invested
Actual spend to date of over $700 million
Approximately 1,200 people employed
Third major worksite established─Tunnelling Hub─adjacent
to the Northern Portal, which will house 500 workers
Precast facility in Benalla supporting 400 regional jobs
Over 50 graduates already working on the project, part of the 500 jobs created to support people entering the workforce
Once completed, the two TBMs will stand 15.6 metres tall and measure 90 metres in length
15
INVESTOR DAY 2018
Adam Watson
Capital strategy
INVESTOR DAY 2018
OperationsCommunityengagement
Development& delivery
TechnologyNetwork planning& forecasting
Customerexperience
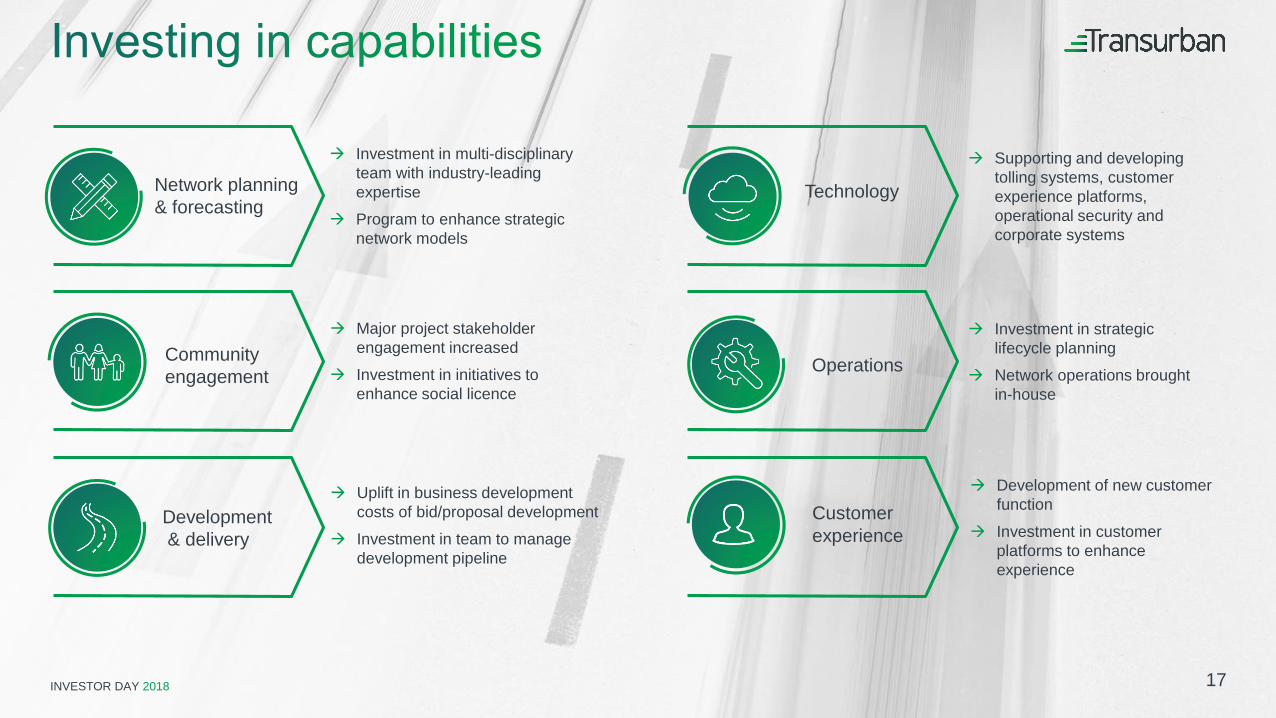
Supporting and developing tolling systems, customer experience platforms, operational security and corporate systems
Investment in strategic lifecycle planning
Network operations brought in-house
Development of new customer function
Investment in customer platforms to enhance experience
Investment in multi-disciplinary team with industry-leadingexpertise
Program to enhance strategic network models
Major project stakeholder engagement increased
Investment in initiatives to enhance social licence
Uplift in business development costs of bid/proposal development
Investment in team to manage development pipeline
17
INVESTOR DAY 2018
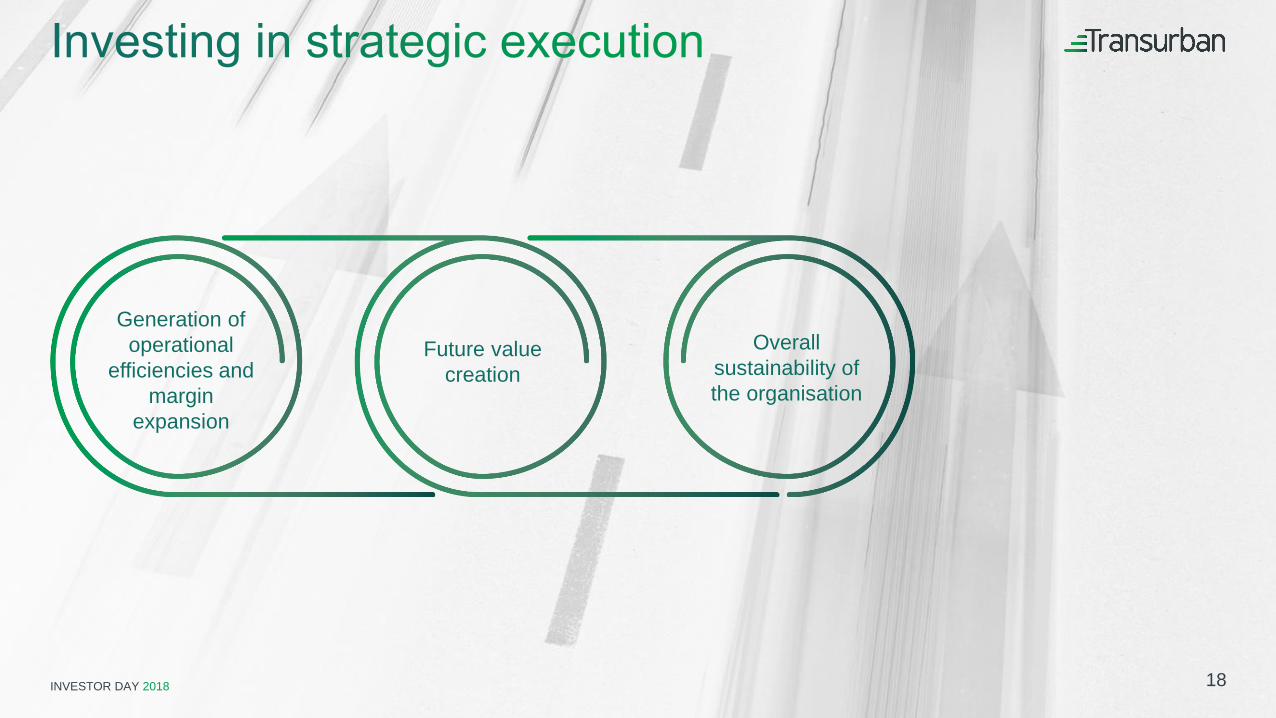
Overall sustainability of the organisation
Generation of operational
efficiencies and margin
expansion
Future value creation
18
INVESTOR DAY 2018 19
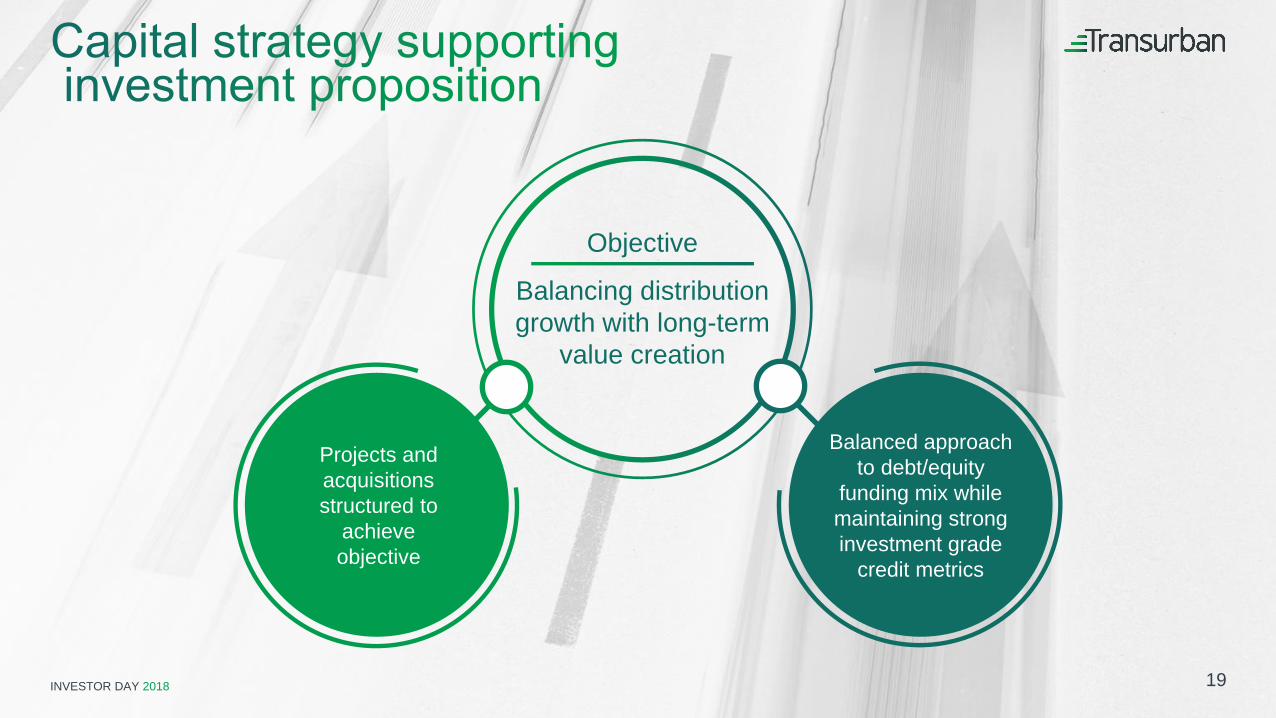
Objective
Balancing distributiongrowth with long-term
value creation
Balanced approach to debt/equity
funding mix while maintaining strong investment grade
credit metrics
Projects and acquisitions structured to
achieve objective
INVESTOR DAY 2018
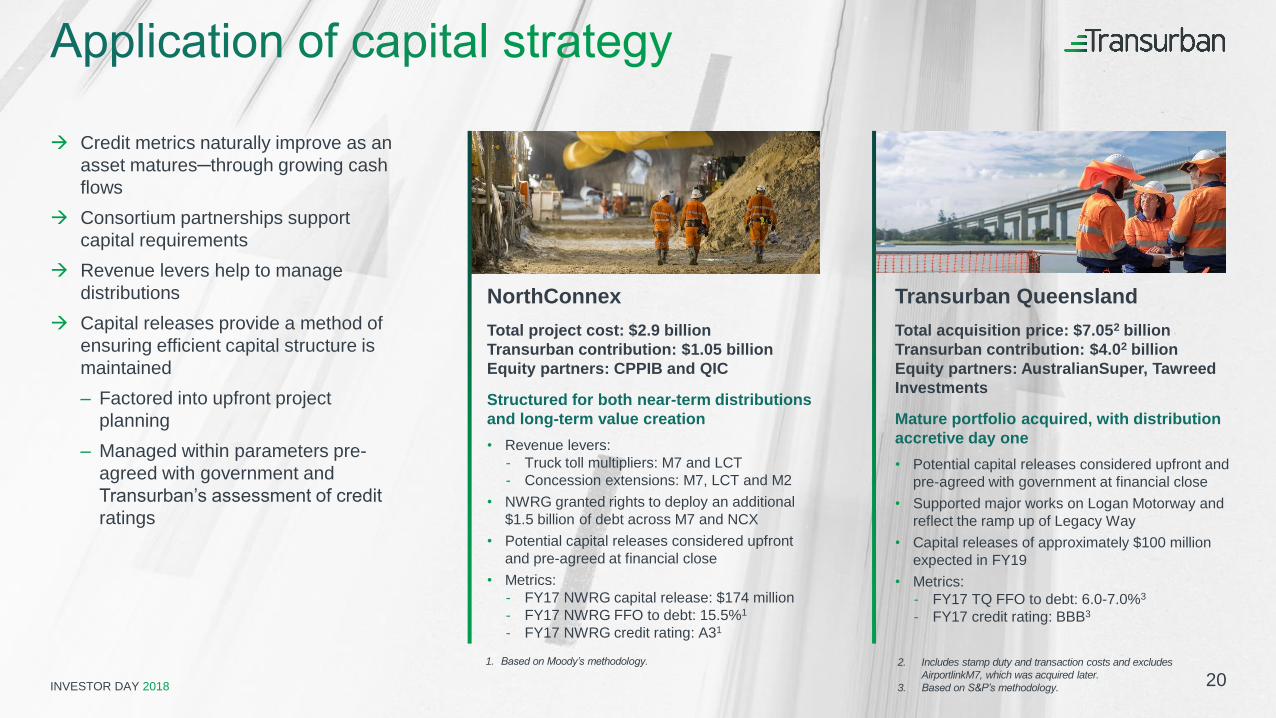
NorthConnexTotal project cost: $2.9 billionTransurban contribution: $1.05 billionEquity partners: CPPIB and QIC
Structured for both near-term distributions and long-term value creation• Revenue levers:
- Truck toll multipliers: M7 and LCT- Concession extensions: M7, LCT and M2
• NWRG granted rights to deploy an additional $1.5 billion of debt across M7 and NCX
• Potential capital releases considered upfront and pre-agreed at financial close
• Metrics:- FY17 NWRG capital release: $174 million- FY17 NWRG FFO to debt: 15.5%1
- FY17 NWRG credit rating: A31
Transurban QueenslandTotal acquisition price: $7.052 billionTransurban contribution: $4.02 billionEquity partners: AustralianSuper, Tawreed Investments
Mature portfolio acquired, with distribution accretive day one• Potential capital releases considered upfront and
pre-agreed with government at financial close• Supported major works on Logan Motorway and
reflect the ramp up of Legacy Way• Capital releases of approximately $100 million
expected in FY19• Metrics:
- FY17 TQ FFO to debt: 6.0-7.0%3
- FY17 credit rating: BBB3
1. Based on Moody’s methodology.
202. Includes stamp duty and transaction costs and excludes
AirportlinkM7, which was acquired later.
3. Based on S&P’s methodology.
Credit metrics naturally improve as an asset matures─through growing cash flows
Consortium partnerships support capital requirements
Revenue levers help to manage distributions
Capital releases provide a method of ensuring efficient capital structure is maintained– Factored into upfront project
planning– Managed within parameters pre-
agreed with government and Transurban’s assessment of credit
ratings
INVESTOR DAY 2018
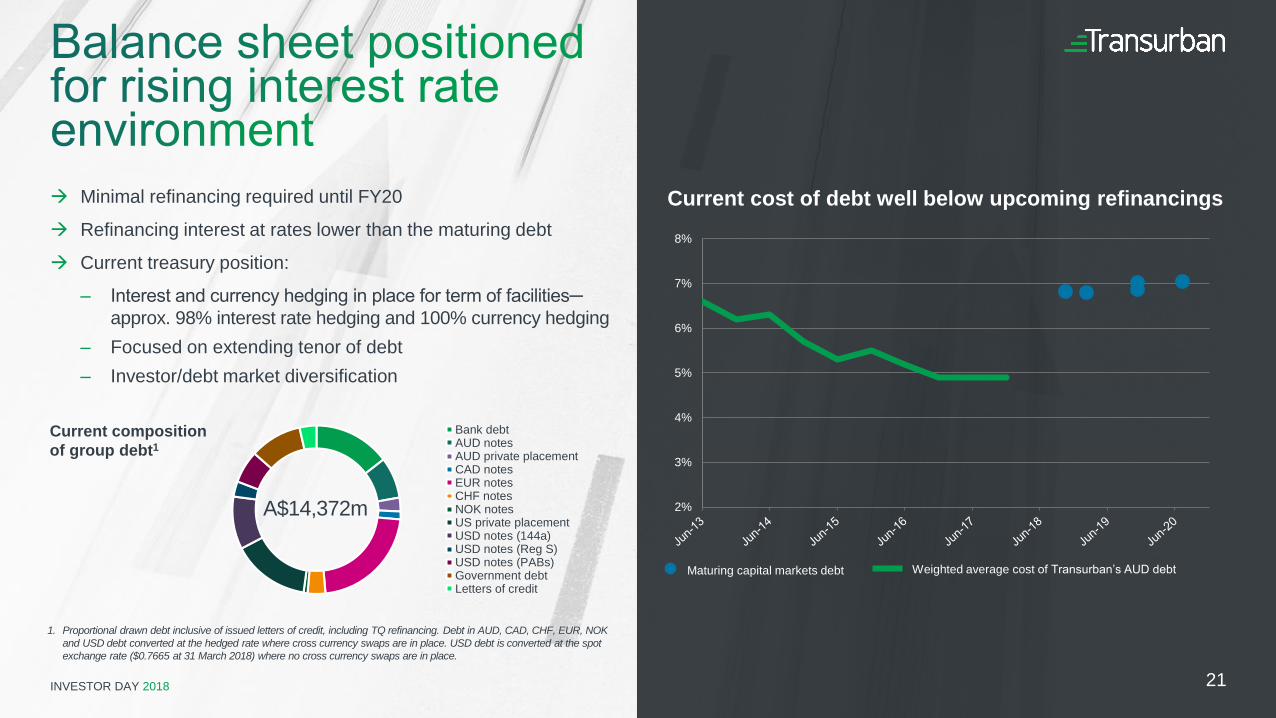
Minimal refinancing required until FY20
Refinancing interest at rates lower than the maturing debt
Current treasury position:
– Interest and currency hedging in place for term of facilities─
approx. 98% interest rate hedging and 100% currency hedging – Focused on extending tenor of debt– Investor/debt market diversification
2%
3%
4%
5%
6%
7%
8%
Current cost of debt well below upcoming refinancings
Maturing capital markets debt Weighted average cost of Transurban’s AUD debt
Bank debtAUD notesAUD private placementCAD notesEUR notesCHF notesNOK notesUS private placementUSD notes (144a)USD notes (Reg S)USD notes (PABs)Government debtLetters of credit
A$14,372m
1. Proportional drawn debt inclusive of issued letters of credit, including TQ refinancing. Debt in AUD, CAD, CHF, EUR, NOK
and USD debt converted at the hedged rate where cross currency swaps are in place. USD debt is converted at the spot
exchange rate ($0.7665 at 31 March 2018) where no cross currency swaps are in place.
21
Current composition of group debt1
INVESTOR DAY 2018
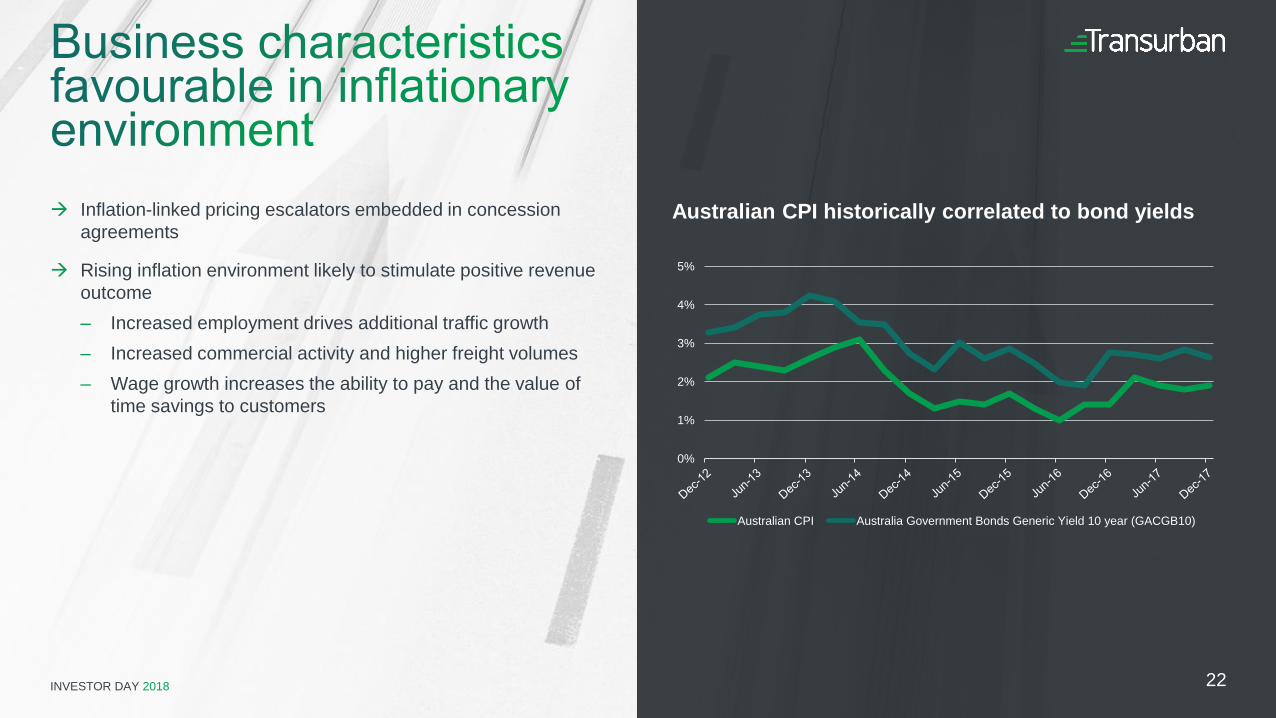
Inflation-linked pricing escalators embedded in concession agreements
Rising inflation environment likely to stimulate positive revenue outcome– Increased employment drives additional traffic growth– Increased commercial activity and higher freight volumes– Wage growth increases the ability to pay and the value of
time savings to customers
Australian CPI historically correlated to bond yields
22
0%
1%
2%
3%
4%
5%
Australian CPI Australia Government Bonds Generic Yield 10 year (GACGB10)
INVESTOR DAY 2018
Vin Vassallo
Development
INVESTOR DAY 2018
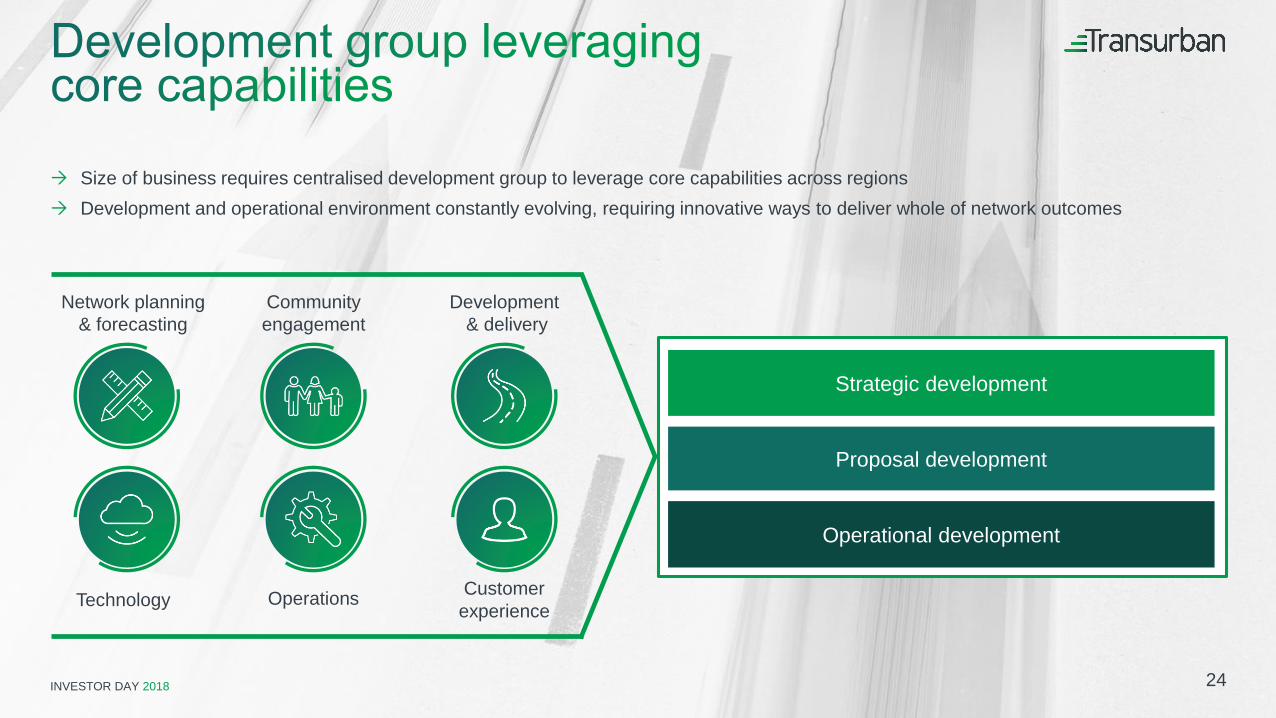
Strategic development
Proposal development
Operational development
Size of business requires centralised development group to leverage core capabilities across regions Development and operational environment constantly evolving, requiring innovative ways to deliver whole of network outcomes
Network planning& forecasting
Development& delivery
Communityengagement
Technology Operations Customerexperience
24
INVESTOR DAY 2018
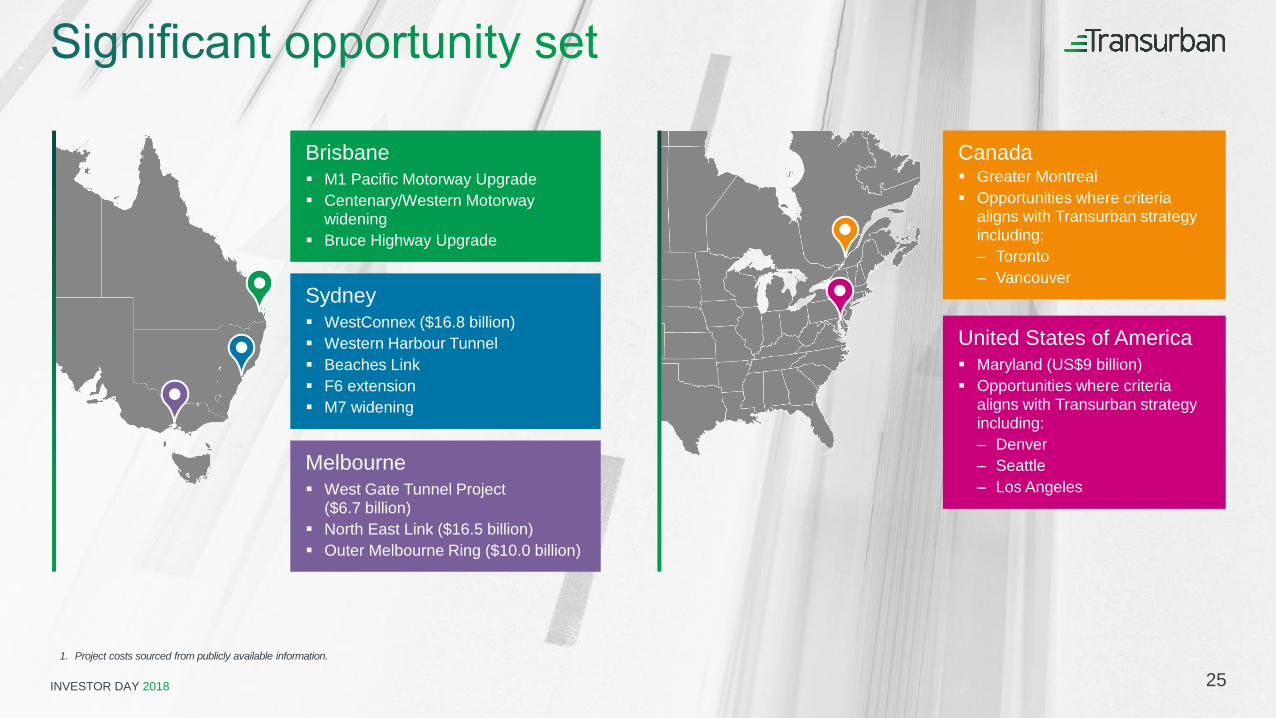
Melbourne West Gate Tunnel Project
($6.7 billion) North East Link ($16.5 billion) Outer Melbourne Ring ($10.0 billion)
Sydney WestConnex ($16.8 billion) Western Harbour Tunnel Beaches Link F6 extension M7 widening
United States of America Maryland (US$9 billion) Opportunities where criteria
aligns with Transurban strategy including: – Denver– Seattle– Los Angeles
Brisbane M1 Pacific Motorway Upgrade Centenary/Western Motorway
widening Bruce Highway Upgrade
1. Project costs sourced from publicly available information.
25
Canada Greater Montreal Opportunities where criteria
aligns with Transurban strategy including:– Toronto– Vancouver
INVESTOR DAY 2018 26
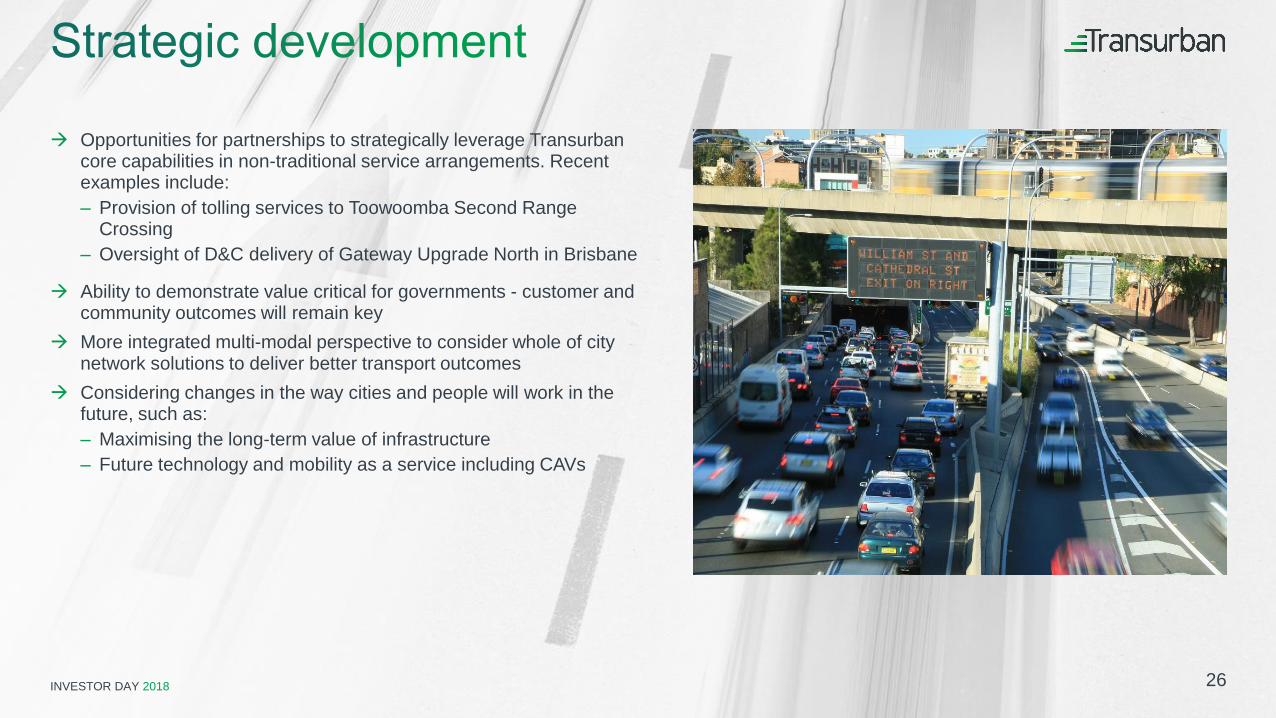
Opportunities for partnerships to strategically leverage Transurban core capabilities in non-traditional service arrangements. Recent examples include:– Provision of tolling services to Toowoomba Second Range
Crossing– Oversight of D&C delivery of Gateway Upgrade North in Brisbane
Ability to demonstrate value critical for governments - customer and community outcomes will remain key
More integrated multi-modal perspective to consider whole of city network solutions to deliver better transport outcomes
Considering changes in the way cities and people will work in the future, such as:– Maximising the long-term value of infrastructure– Future technology and mobility as a service including CAVs
INVESTOR DAY 2018
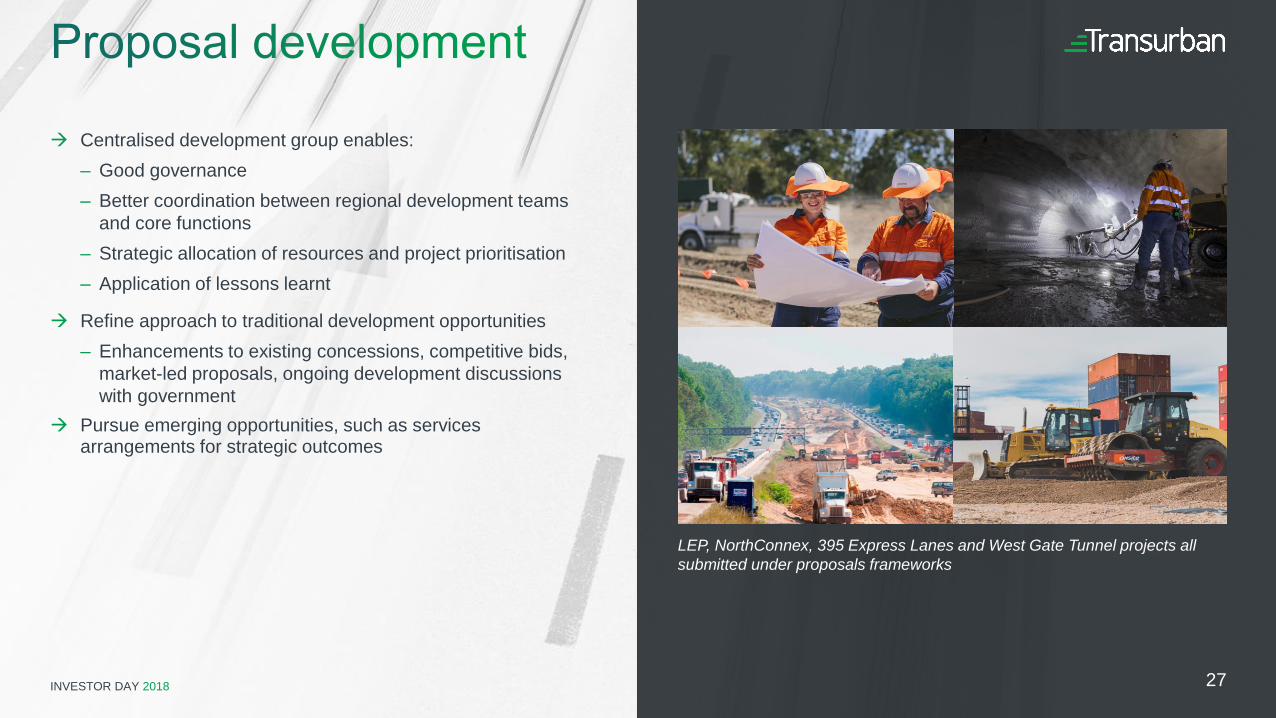
Centralised development group enables: – Good governance– Better coordination between regional development teams
and core functions – Strategic allocation of resources and project prioritisation– Application of lessons learnt
Refine approach to traditional development opportunities– Enhancements to existing concessions, competitive bids,
market-led proposals, ongoing development discussions with government
Pursue emerging opportunities, such as services arrangements for strategic outcomes
LEP, NorthConnex, 395 Express Lanes and West Gate Tunnel projects all
submitted under proposals frameworks
27
INVESTOR DAY 2018
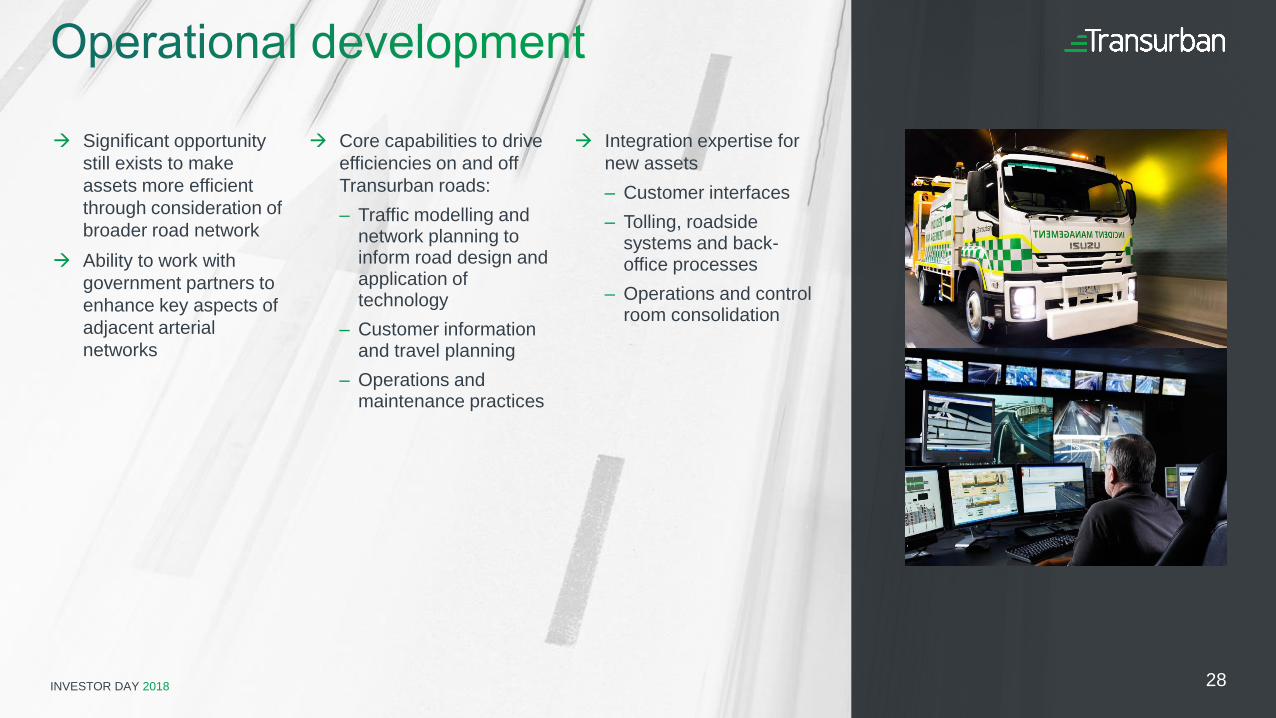
Integration expertise for new assets– Customer interfaces– Tolling, roadside
systems and back-office processes
– Operations and control room consolidation
Significant opportunity still exists to make assets more efficient through consideration of broader road network
Ability to work with government partners to enhance key aspects of adjacent arterial networks
Core capabilities to drive efficiencies on and off Transurban roads:– Traffic modelling and
network planning to inform road design and application of technology
– Customer information and travel planning
– Operations and maintenance practices
28
INVESTOR DAY 2018
Suzette Corr
People and culture
INVESTOR DAY 2018
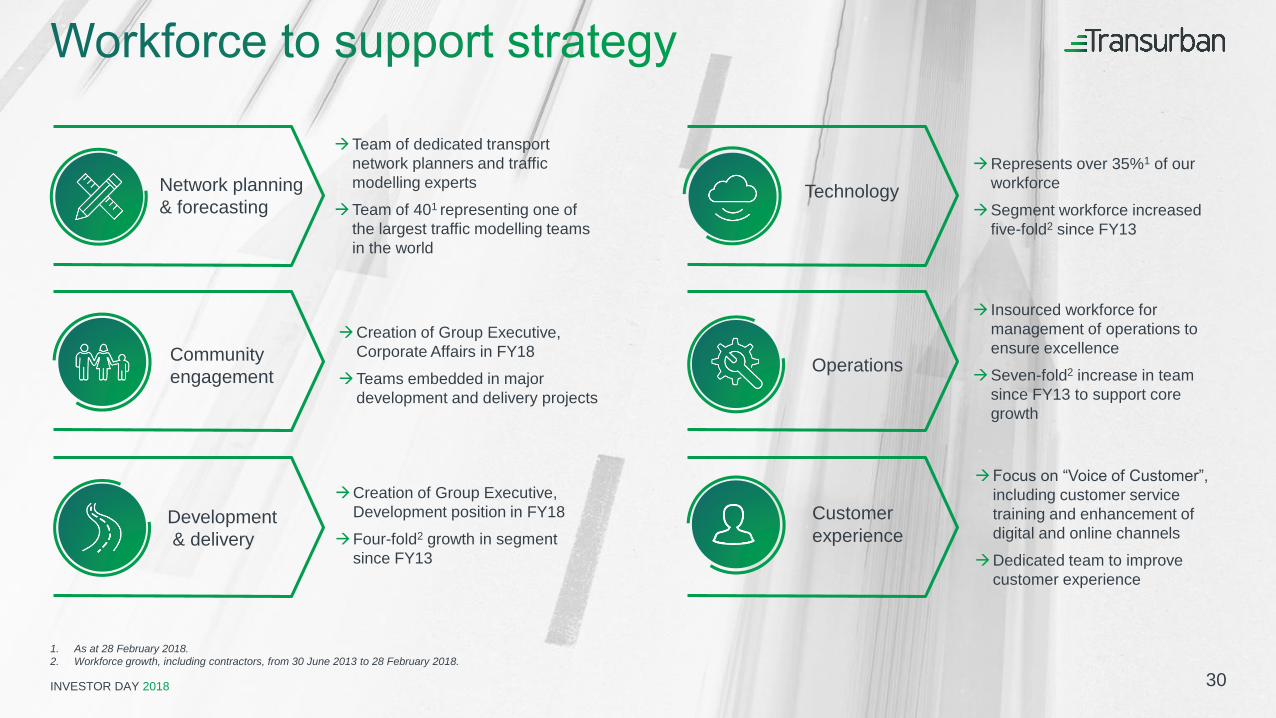
1. As at 28 February 2018.
2. Workforce growth, including contractors, from 30 June 2013 to 28 February 2018.
OperationsCommunityengagement
Development& delivery
TechnologyNetwork planning& forecasting
Customerexperience
Represents over 35%1 of our workforce
Segment workforce increased five-fold2 since FY13
Insourced workforce for management of operations to ensure excellence
Seven-fold2 increase in team since FY13 to support core growth
Focus on “Voice of Customer”,
including customer service training and enhancement of digital and online channels
Dedicated team to improve customer experience
Team of dedicated transport network planners and traffic modelling experts
Team of 401 representing one of the largest traffic modelling teams in the world
Creation of Group Executive, Corporate Affairs in FY18
Teams embedded in major development and delivery projects
Creation of Group Executive, Development position in FY18
Four-fold2 growth in segment since FY13
30
INVESTOR DAY 2018
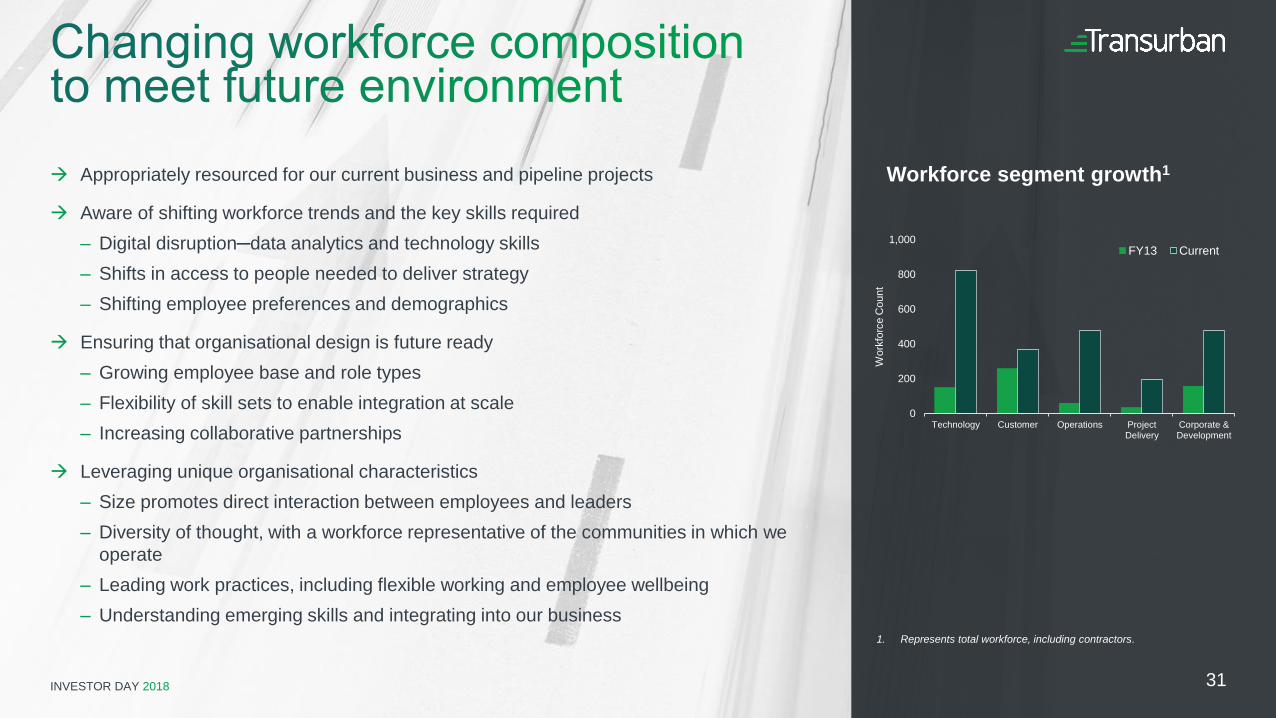
Appropriately resourced for our current business and pipeline projects
Aware of shifting workforce trends and the key skills required– Digital disruption─data analytics and technology skills– Shifts in access to people needed to deliver strategy– Shifting employee preferences and demographics
Ensuring that organisational design is future ready– Growing employee base and role types– Flexibility of skill sets to enable integration at scale – Increasing collaborative partnerships
Leveraging unique organisational characteristics– Size promotes direct interaction between employees and leaders– Diversity of thought, with a workforce representative of the communities in which we
operate– Leading work practices, including flexible working and employee wellbeing– Understanding emerging skills and integrating into our business
1. Represents total workforce, including contractors.
31
0
200
400
600
800
1,000
Technology Customer Operations ProjectDelivery
Corporate &Development
Wor
kfor
ce C
ount
FY13 Current
Workforce segment growth1
INVESTOR DAY 2018
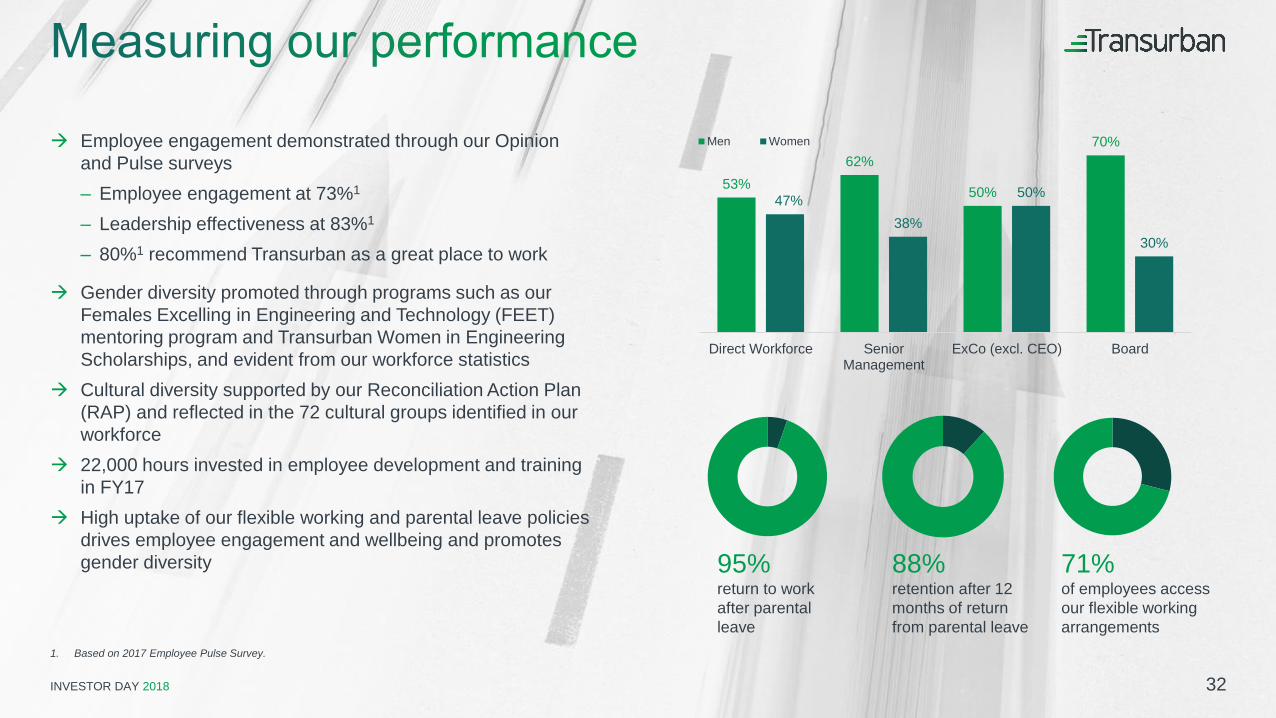
Employee engagement demonstrated through our Opinion and Pulse surveys– Employee engagement at 73%1
– Leadership effectiveness at 83%1
– 80%1 recommend Transurban as a great place to work
Gender diversity promoted through programs such as our Females Excelling in Engineering and Technology (FEET) mentoring program and Transurban Women in Engineering Scholarships, and evident from our workforce statistics
Cultural diversity supported by our Reconciliation Action Plan (RAP) and reflected in the 72 cultural groups identified in our workforce
22,000 hours invested in employee development and trainingin FY17
High uptake of our flexible working and parental leave policies drives employee engagement and wellbeing and promotes gender diversity
1. Based on 2017 Employee Pulse Survey.
53%62%
50%
70%
47%38%
50%
30%
Direct Workforce SeniorManagement
ExCo (excl. CEO) Board
Men Women
88%retention after 12 months of return from parental leave
95%return to work after parental leave
71%of employees access our flexible working arrangements
32
INVESTOR DAY 2018
Our people practices are in place to deliver on our strategy and we continue to receive external recognition
Workplace Gender Equality Agency (WGEA) “Employer of Choice
for Gender Equality” citation for four years in a row
Equileap listed top 20 global company for gender equality
ITS World Congress Award for Best Action for supporting Diversity in the ITS Workforce
Engineers Australia’s award for Most Ambitious Company in Gender
Diversity
33

INVESTOR DAY 2018
Henry Byrne
Trust and reputation
INVESTOR DAY 2018 35
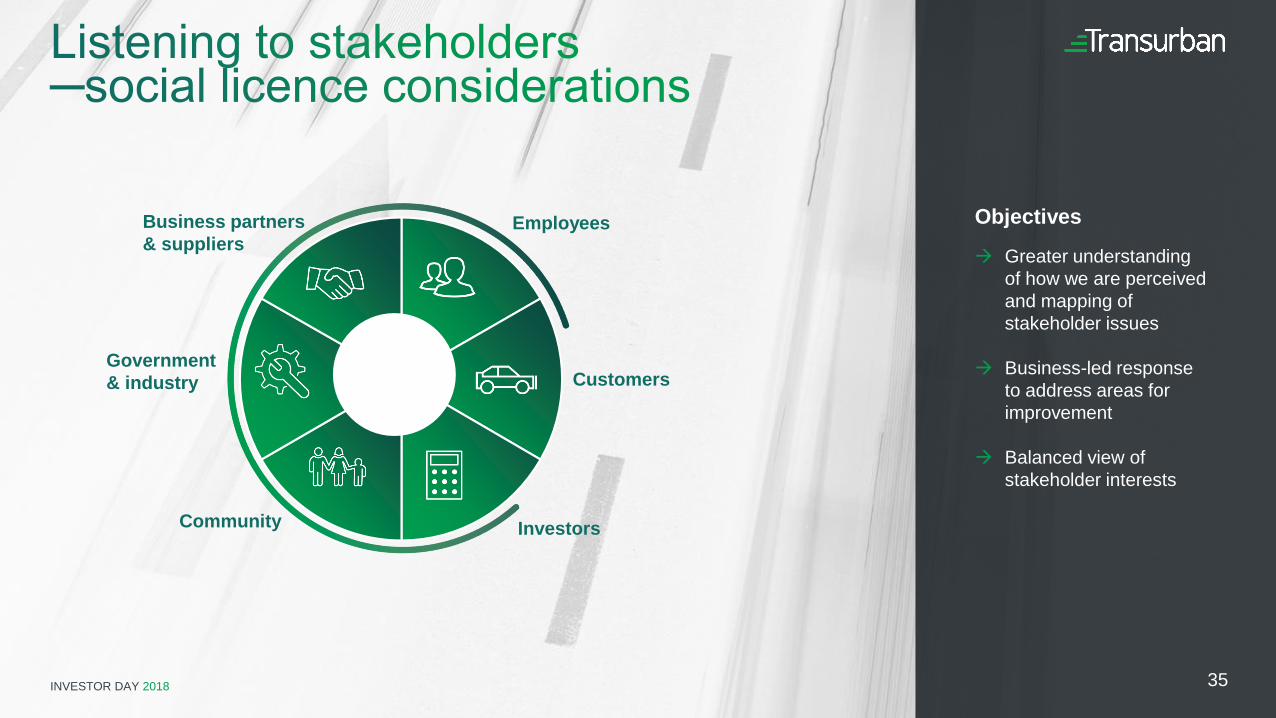
Objectives
Greater understanding of how we are perceived and mapping of stakeholder issues
Business-led response to address areas for improvement
Balanced view of stakeholder interests
Business partners& suppliers
Government & industry
Community Investors
Customers
Employees
INVESTOR DAY 2018
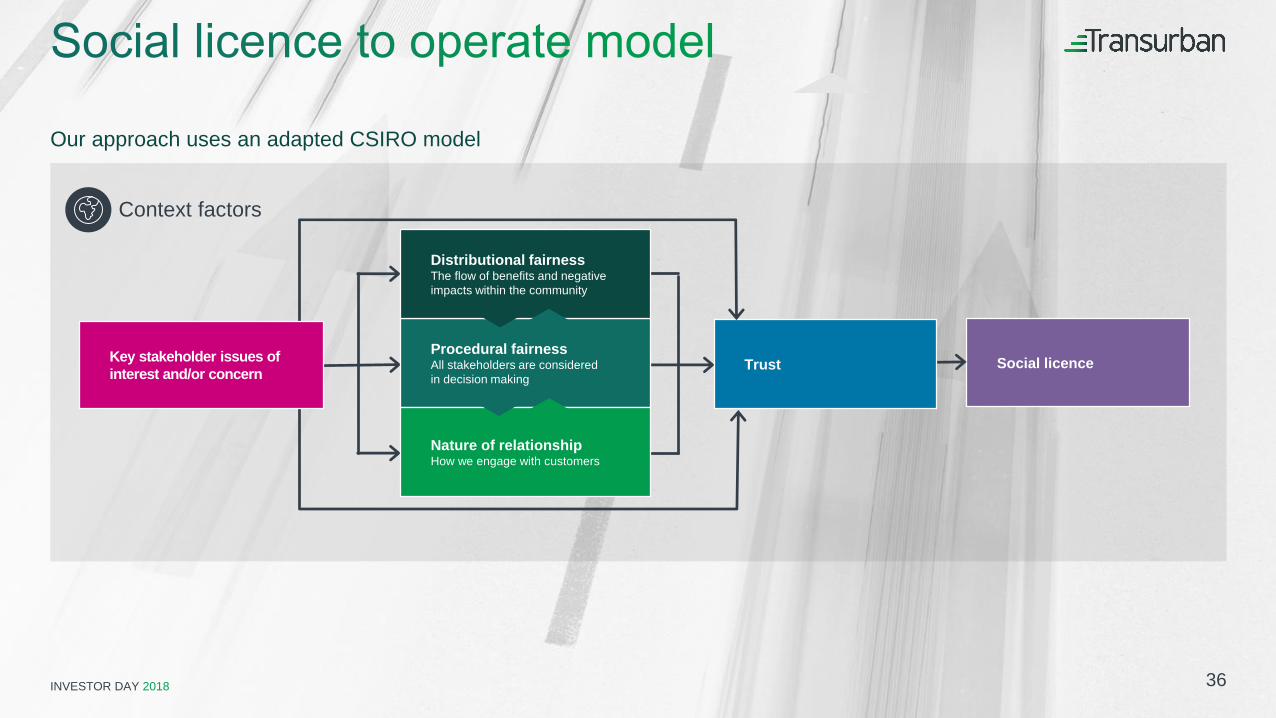
Context factors
Social licence
Our approach uses an adapted CSIRO model
Procedural fairnessAll stakeholders are considered in decision making
Nature of relationshipHow we engage with customers
Distributional fairnessThe flow of benefits and negative impacts within the community
TrustKey stakeholder issues of interest and/or concern
36
INVESTOR DAY 2018INVESTOR DAY 2018 37
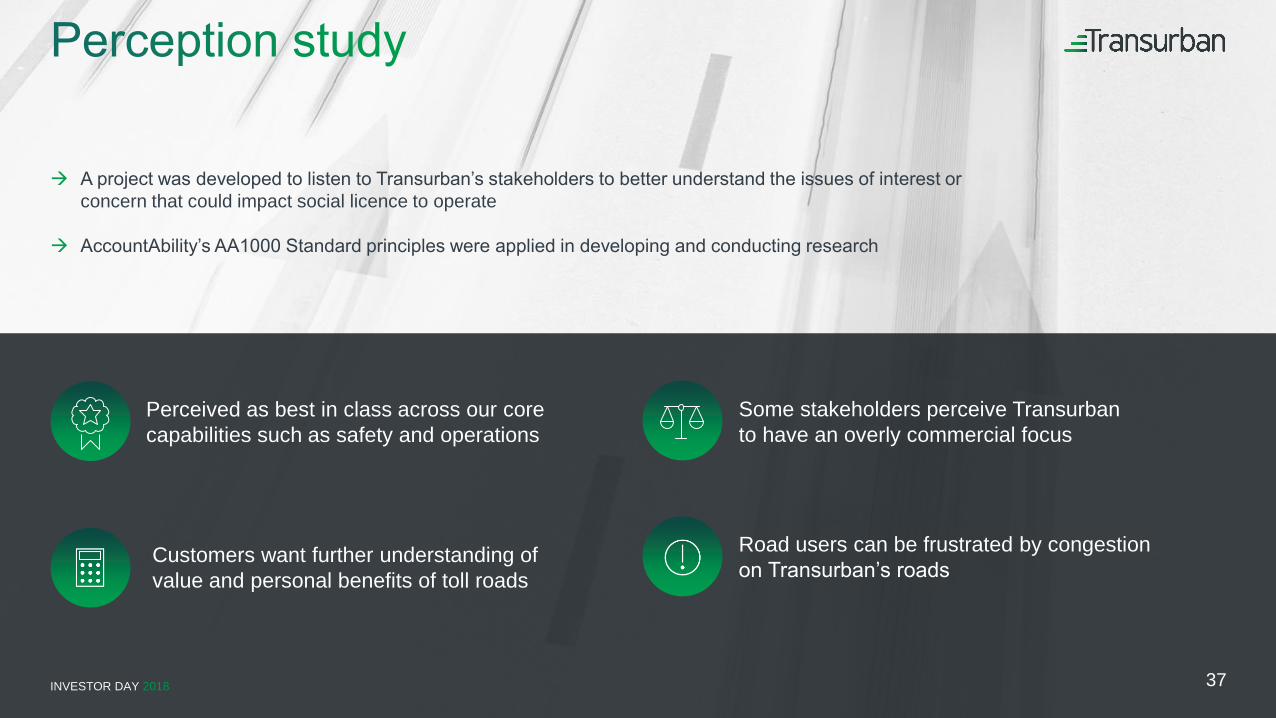
Customers want further understanding of value and personal benefits of toll roads
Perceived as best in class across our core capabilities such as safety and operations
A project was developed to listen to Transurban’s stakeholders to better understand the issues of interest or
concern that could impact social licence to operate
AccountAbility’s AA1000 Standard principles were applied in developing and conducting research
Some stakeholders perceive Transurban to have an overly commercial focus
Road users can be frustrated by congestion on Transurban’s roads
INVESTOR DAY 2018INVESTOR DAY 2018 38
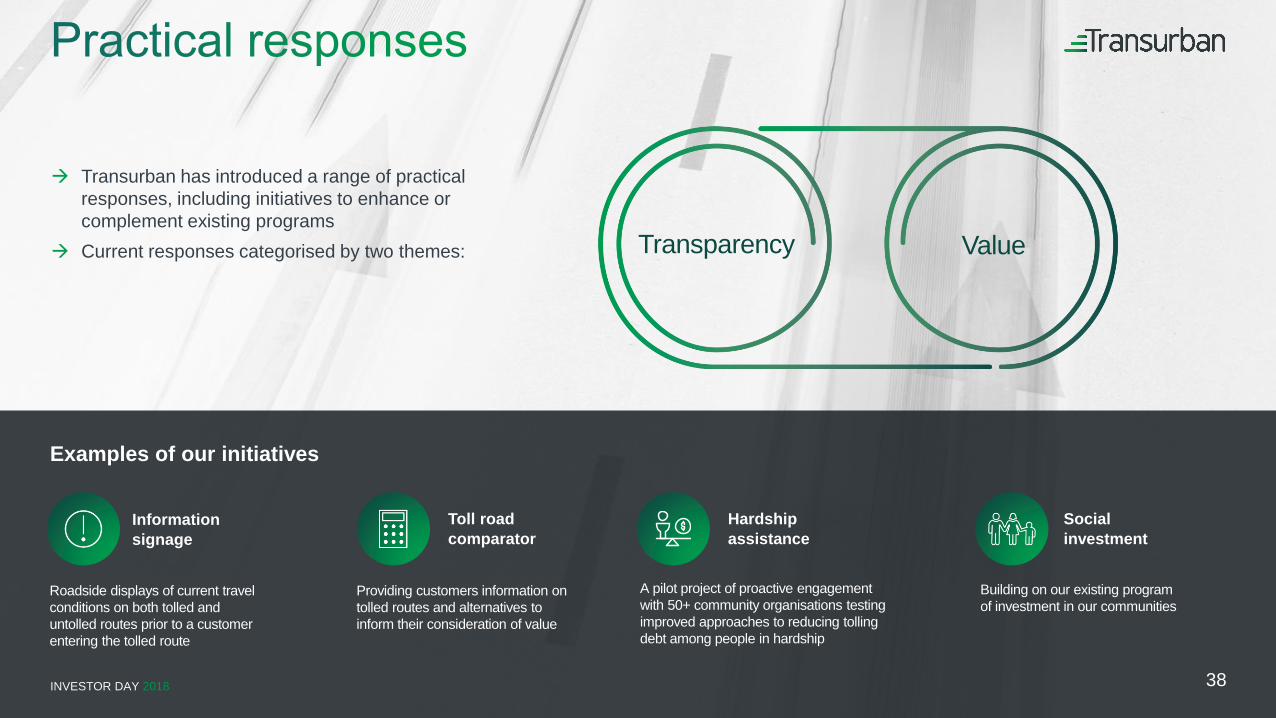
Roadside displays of current travel conditions on both tolled and untolled routes prior to a customer entering the tolled route
Toll road comparator
Providing customers information on tolled routes and alternatives to inform their consideration of value
Information signage
Transurban has introduced a range of practical responses, including initiatives to enhance or complement existing programs
Current responses categorised by two themes:
Social investment
Building on our existing program of investment in our communities
A pilot project of proactive engagement with 50+ community organisations testing improved approaches to reducing tolling debt among people in hardship
Hardship assistance
Examples of our initiatives
Transparency Value
INVESTOR DAY 2018
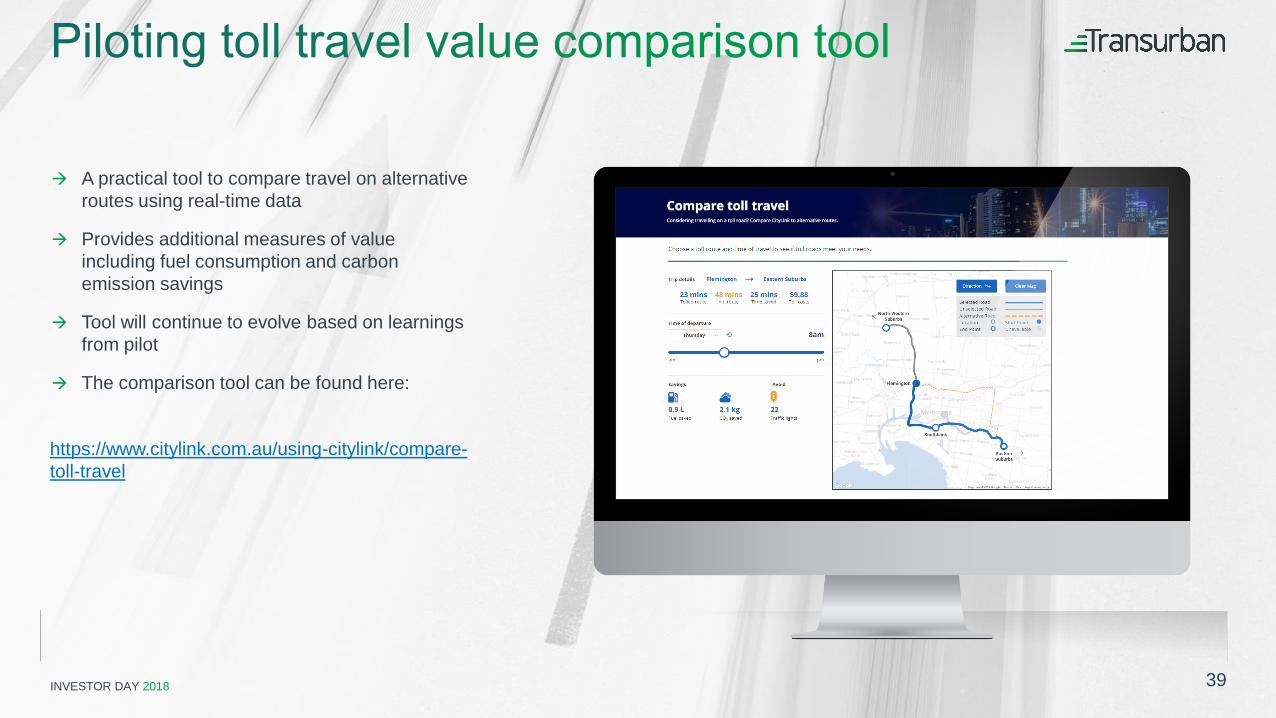
A practical tool to compare travel on alternative routes using real-time data
Provides additional measures of value including fuel consumption and carbon emission savings
Tool will continue to evolve based on learnings from pilot
The comparison tool can be found here:
39
https://www.citylink.com.au/using-citylink/compare-toll-travel
INVESTOR DAY 2018
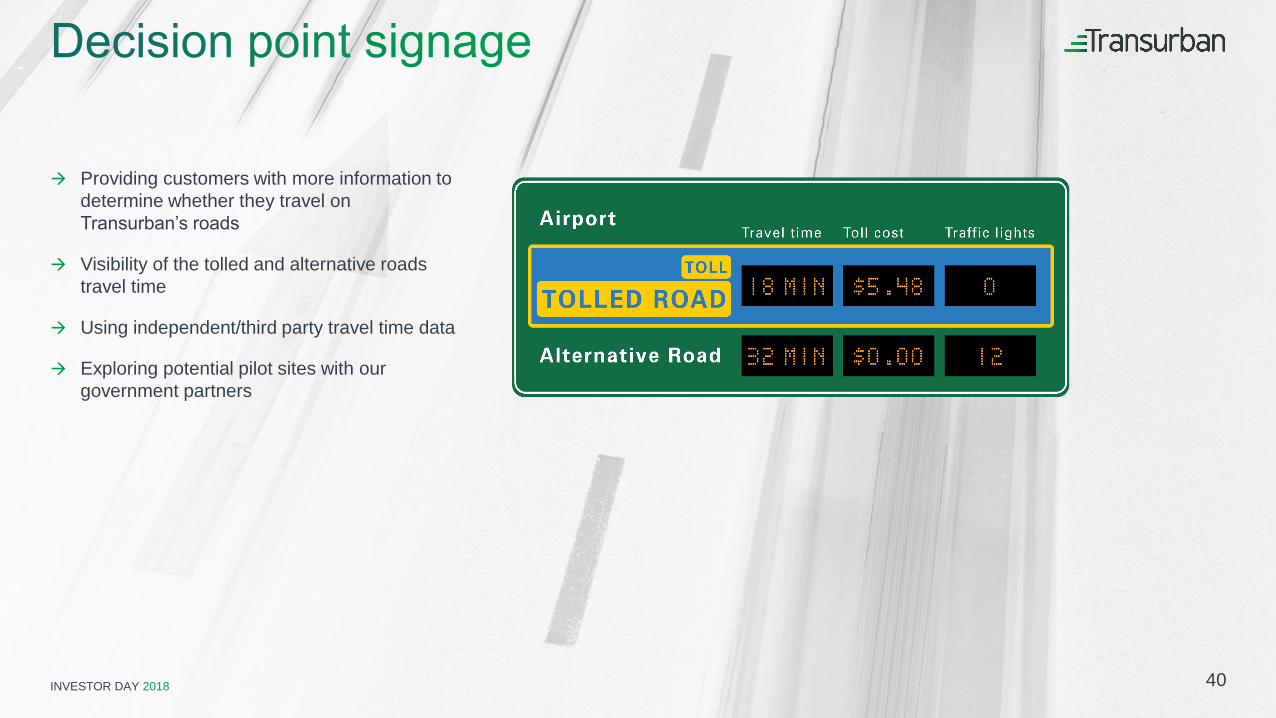
Providing customers with more information to determine whether they travel on Transurban’s roads
Visibility of the tolled and alternative roads travel time
Using independent/third party travel time data
Exploring potential pilot sites with our government partners
40
INVESTOR DAY 2018
Sue Johnson
Queensland
INVESTOR DAY 2018
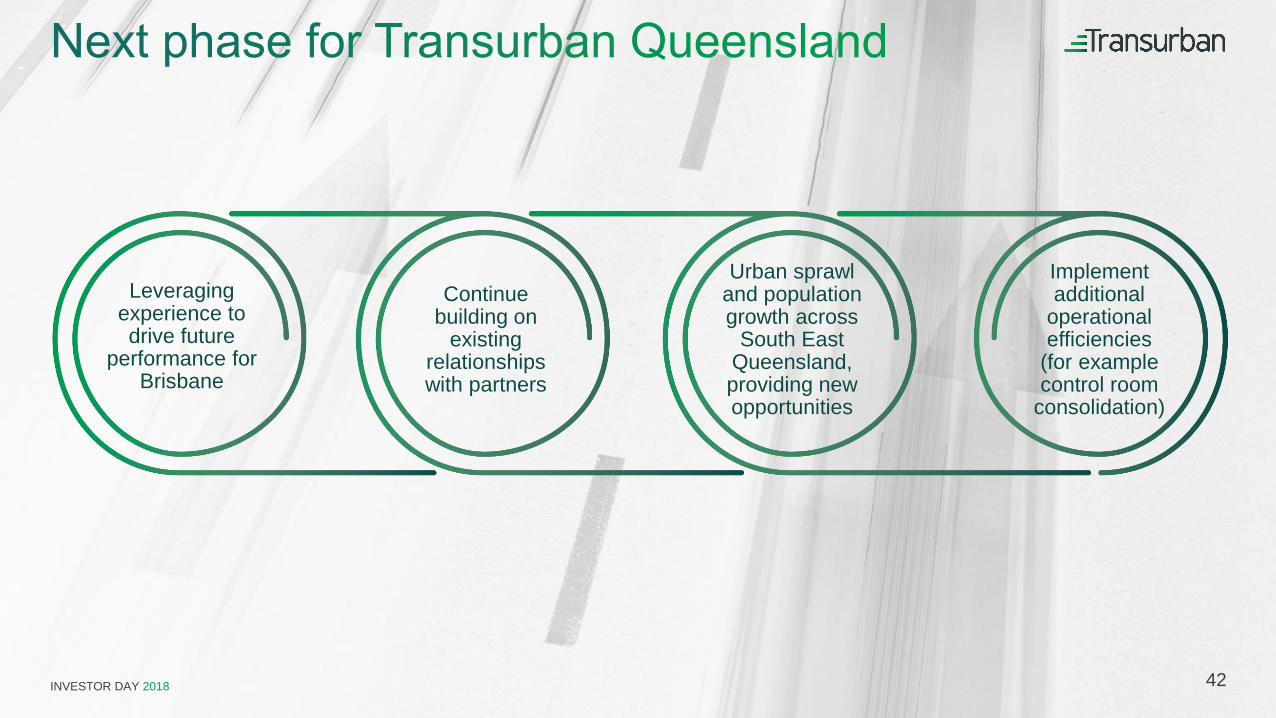
Leveraging experience to drive future
performance for Brisbane
Urban sprawl and population growth across
South East Queensland, providing new opportunities
Continue building on
existing relationships with partners
Implement additional
operational efficiencies
(for example control room
consolidation)
42
INVESTOR DAY 2018
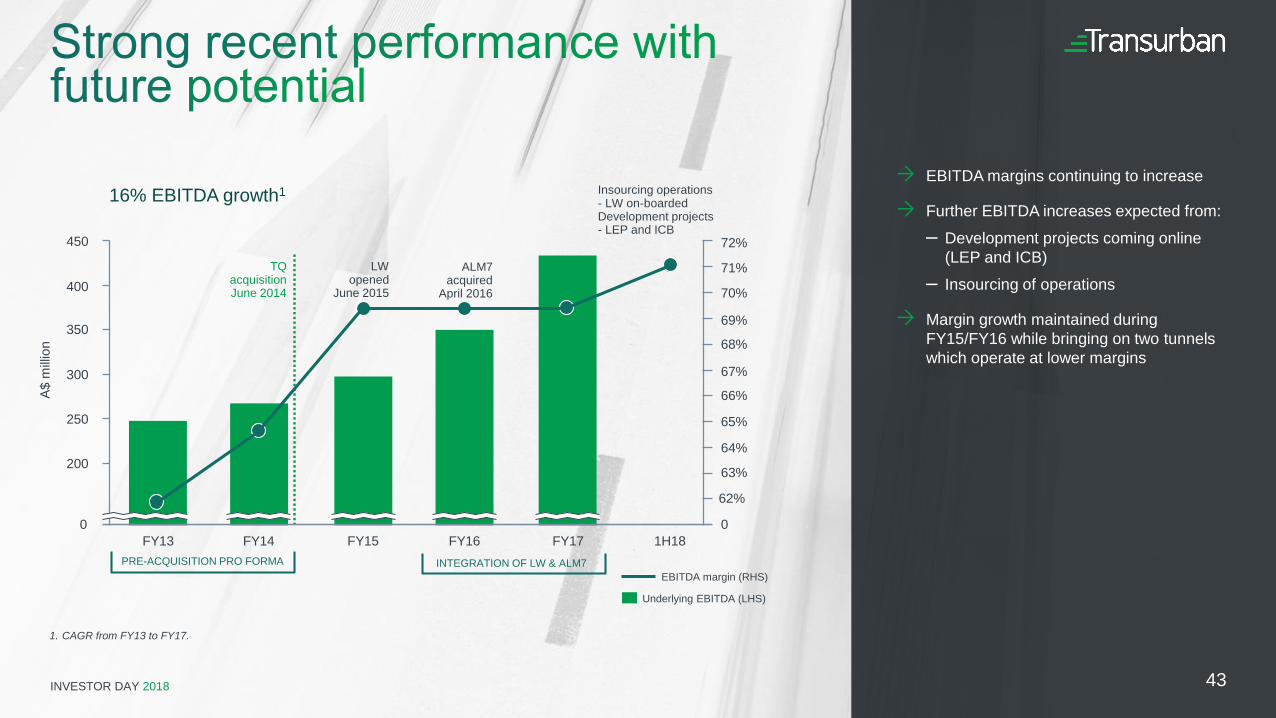
EBITDA margins continuing to increase
Further EBITDA increases expected from:– Development projects coming online
(LEP and ICB)– Insourcing of operations
Margin growth maintained during FY15/FY16 while bringing on two tunnels which operate at lower margins
16% EBITDA growth1
1. CAGR from FY13 to FY17.
LW opened
June 2015
ALM7 acquired
April 2016
TQ acquisitionJune 2014
Insourcing operations- LW on-boardedDevelopment projects- LEP and ICB
200
450
400
350
300
250
1H18FY16FY15FY13 FY17FY14
65%
66%
72%
71%
70%
68%
67%
63%
0
69%
64%
0
Underlying EBITDA (LHS)
EBITDA margin (RHS)PRE-ACQUISITION PRO FORMA INTEGRATION OF LW & ALM7
43
A$ m
illion
62%
INVESTOR DAY 2018
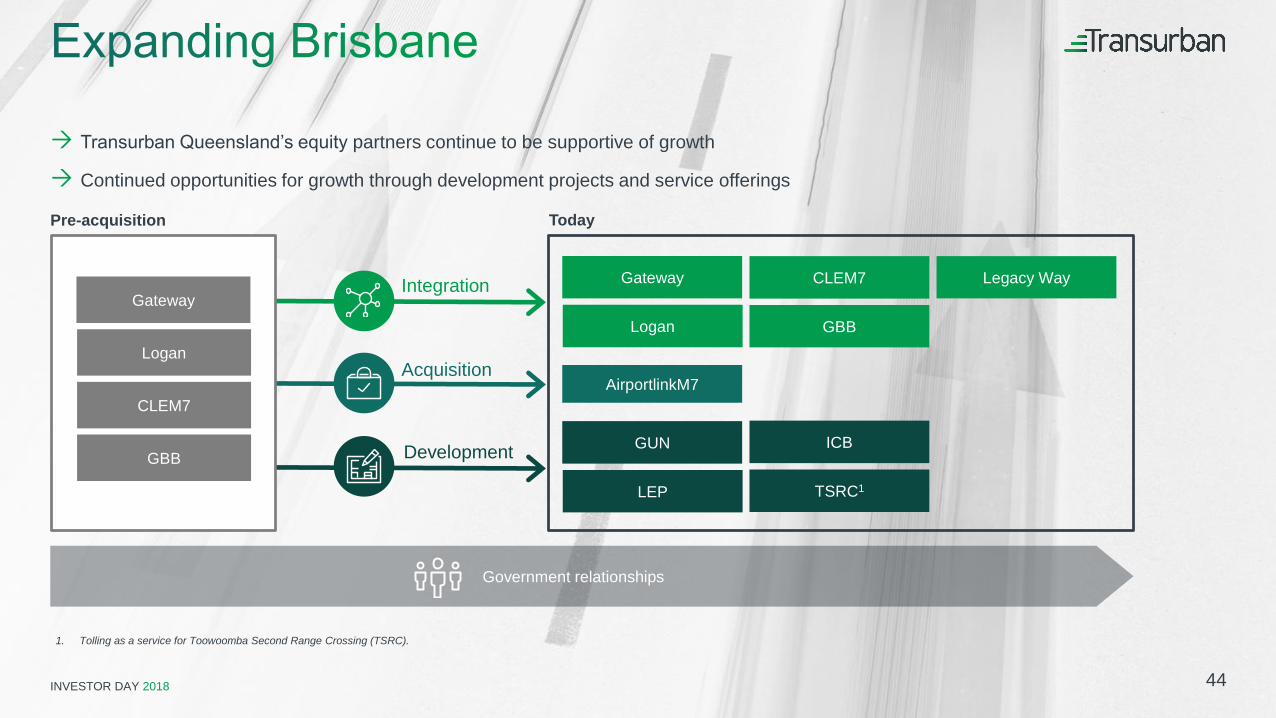
Transurban Queensland’s equity partners continue to be supportive of growth
Continued opportunities for growth through development projects and service offerings
Pre-acquisition Today
Integration
Acquisition
Development
Government relationships
1. Tolling as a service for Toowoomba Second Range Crossing (TSRC).
Gateway
Logan GBB
CLEM7
AirportlinkM7
LEP TSRC1
ICBGUN
44
Gateway
Logan
GBB
CLEM7
Legacy Way
INVESTOR DAY 2018
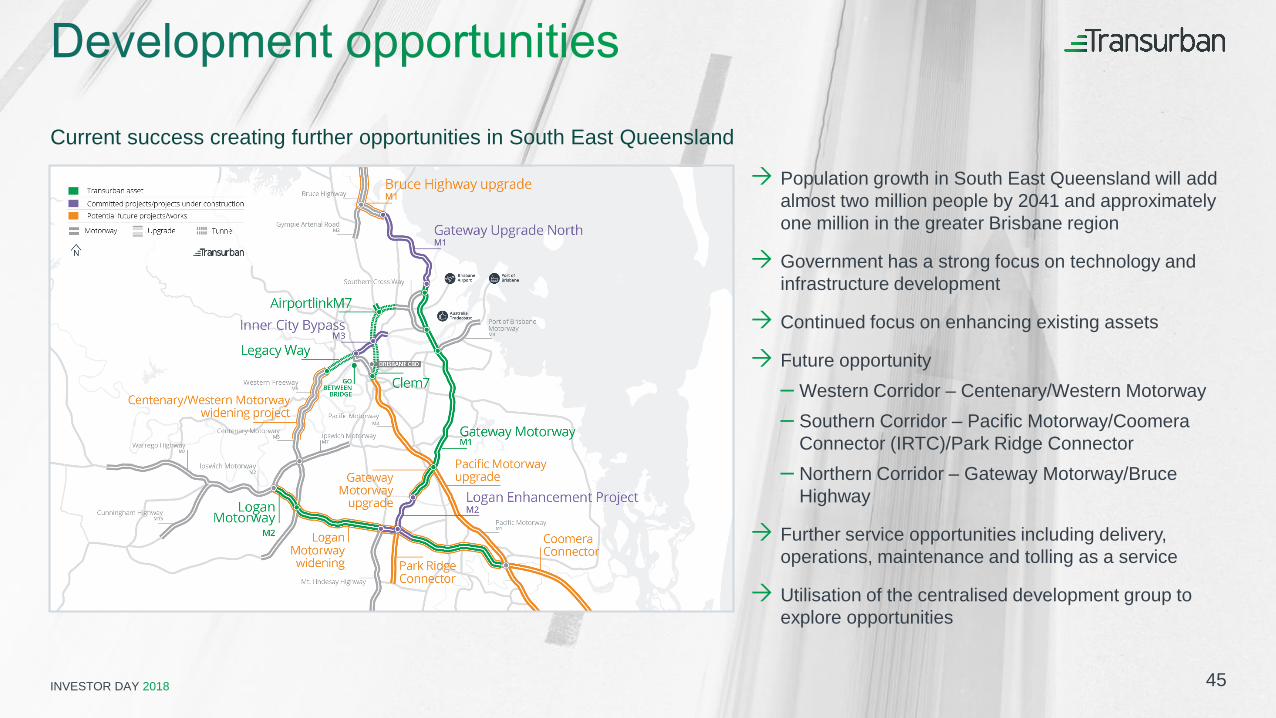
Current success creating further opportunities in South East Queensland
Population growth in South East Queensland will add almost two million people by 2041 and approximately one million in the greater Brisbane region
Government has a strong focus on technology and infrastructure development
Continued focus on enhancing existing assets
Future opportunity– Western Corridor – Centenary/Western Motorway– Southern Corridor – Pacific Motorway/Coomera
Connector (IRTC)/Park Ridge Connector– Northern Corridor – Gateway Motorway/Bruce
Highway
Further service opportunities including delivery, operations, maintenance and tolling as a service
Utilisation of the centralised development group to explore opportunities
45
INVESTOR DAY 2018
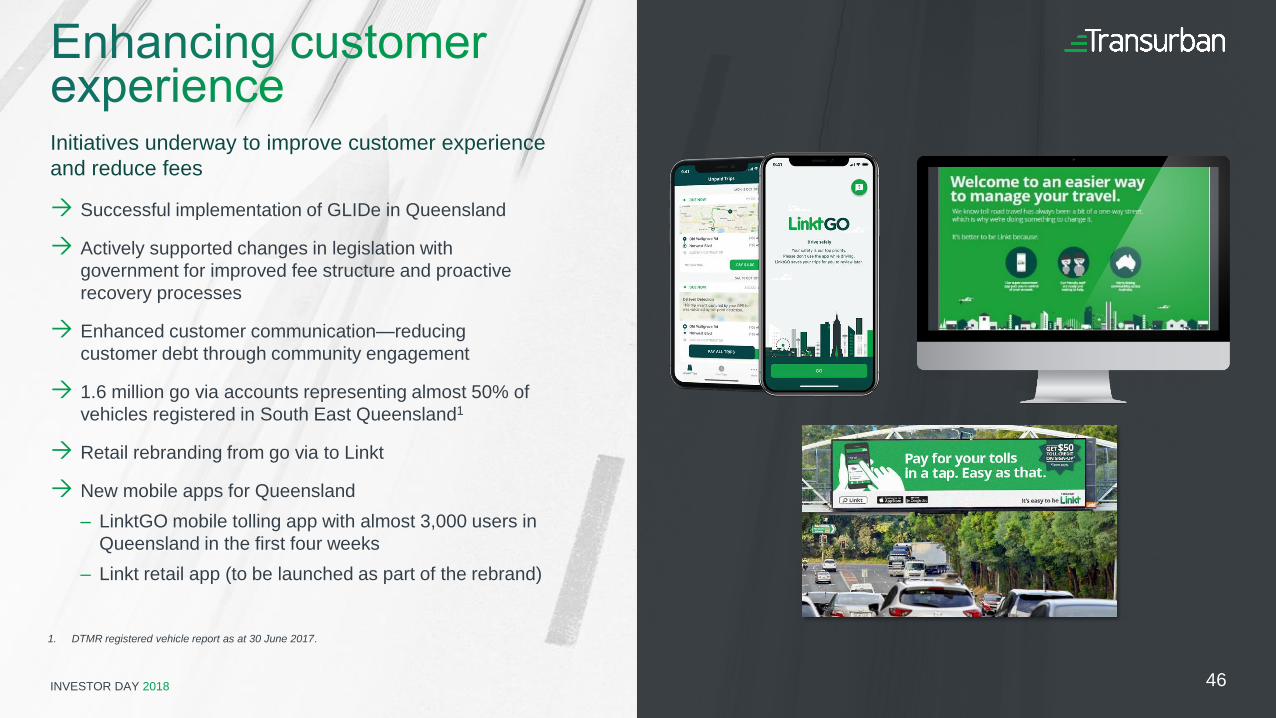
Initiatives underway to improve customer experience and reduce fees
Successful implementation of GLIDe in Queensland
Actively supported changes in legislation with government for improved fee structure and proactive recovery processes
Enhanced customer communication—reducing customer debt through community engagement
1.6 million go via accounts representing almost 50% of vehicles registered in South East Queensland1
Retail rebranding from go via to Linkt
New mobile apps for Queensland– LinktGO mobile tolling app with almost 3,000 users in
Queensland in the first four weeks– Linkt retail app (to be launched as part of the rebrand)
1. DTMR registered vehicle report as at 30 June 2017.
46
INVESTOR DAY 2018
Jennifer Aument
North America
INVESTOR DAY 2018
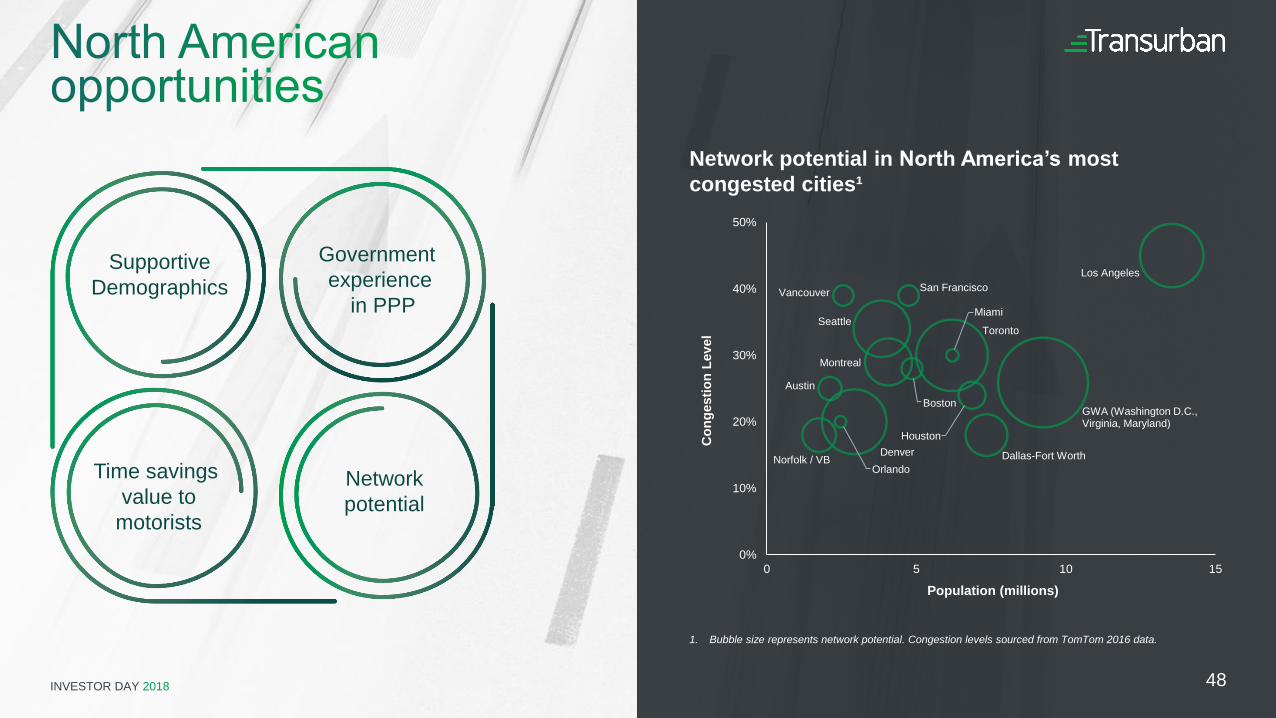
Network potential in North America’s most congested cities¹
1. Bubble size represents network potential. Congestion levels sourced from TomTom 2016 data.
SupportiveDemographics
Government experience
in PPP
Time savings value to
motorists
Networkpotential
Toronto
Denver
Los Angeles
Seattle
Montreal
Dallas-Fort WorthNorfolk / VB
Houston
AustinBoston
Vancouver San Francisco
Miami
Orlando
GWA (Washington D.C.,Virginia, Maryland)
0%
10%
20%
30%
40%
50%
0 5 10 15
Con
gest
ion
Leve
l
Population (millions)
48
INVESTOR DAY 2018 49

INVESTOR DAY 2018
MontrealIsland
LavalIsland
SouthShore
West
Northern Arc
A25 Concession
Average annual daily traffic on main roads in the metropolitan area
A25 catchment area has above average population and employment growth
<5,000
>5,000
>10,000
>50,000
>100,000
AADT
>25,000
50
A25 Concession
MontrealIsland
LavalIsland
SouthShore
Northern Arc
INVESTOR DAY 2018
4
5
6
7
8
9
10
Mon
treal
, une
mpl
oym
ent r
ate
(per
cent
)
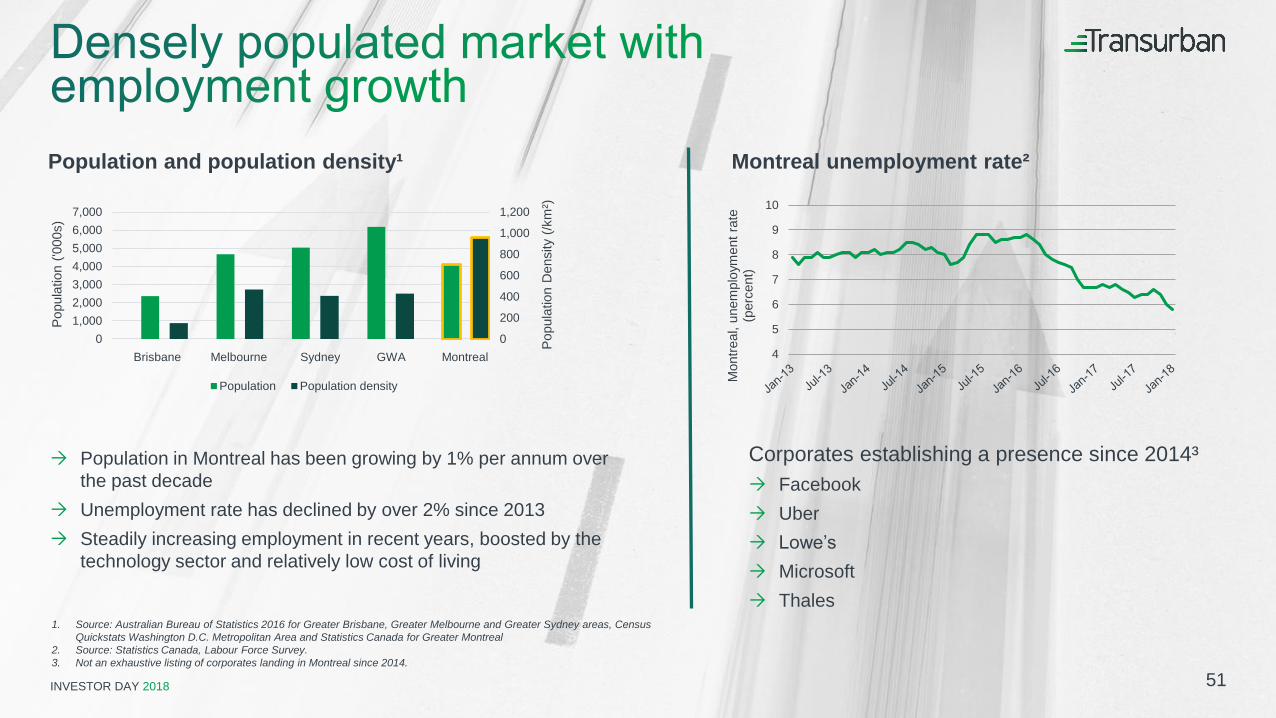
Corporates establishing a presence since 2014³ Facebook Uber Lowe’s
Microsoft Thales
1. Source: Australian Bureau of Statistics 2016 for Greater Brisbane, Greater Melbourne and Greater Sydney areas, Census
Quickstats Washington D.C. Metropolitan Area and Statistics Canada for Greater Montreal
2. Source: Statistics Canada, Labour Force Survey.
3. Not an exhaustive listing of corporates landing in Montreal since 2014.
Population in Montreal has been growing by 1% per annum overthe past decade
Unemployment rate has declined by over 2% since 2013 Steadily increasing employment in recent years, boosted by the
technology sector and relatively low cost of living
0
200
400
600
800
1,000
1,200
01,0002,0003,0004,0005,0006,0007,000
Popu
latio
n D
ensi
ty (/
km²)
Popu
latio
n ('0
00s)
Population Population density
51
Population and population density¹ Montreal unemployment rate²
Brisbane Melbourne Sydney GWA Montreal
INVESTOR DAY 2018
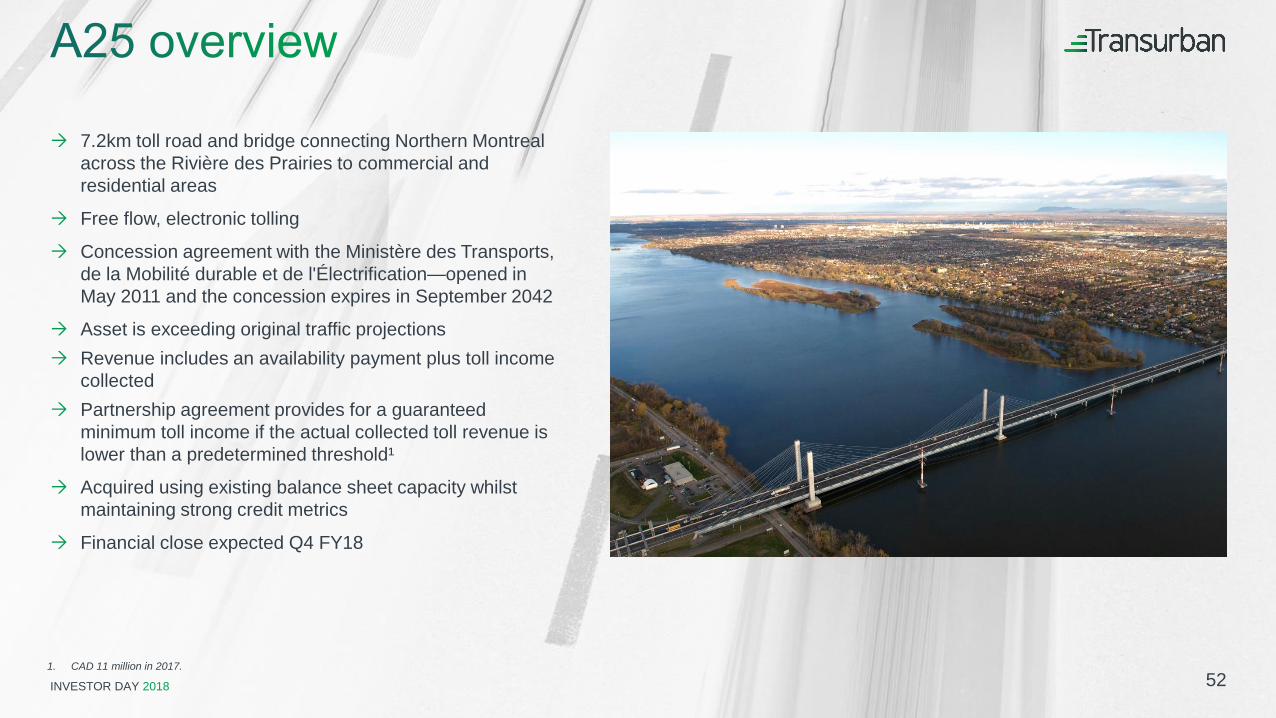
7.2km toll road and bridge connecting Northern Montreal across the Rivière des Prairies to commercial and residential areas
Free flow, electronic tolling
Concession agreement with the Ministère des Transports, de la Mobilité durable et de l'Électrification—opened in May 2011 and the concession expires in September 2042
Asset is exceeding original traffic projections Revenue includes an availability payment plus toll income
collected Partnership agreement provides for a guaranteed
minimum toll income if the actual collected toll revenue is lower than a predetermined threshold¹
Acquired using existing balance sheet capacity whilst maintaining strong credit metrics
Financial close expected Q4 FY18
521. CAD 11 million in 2017.
INVESTOR DAY 2018
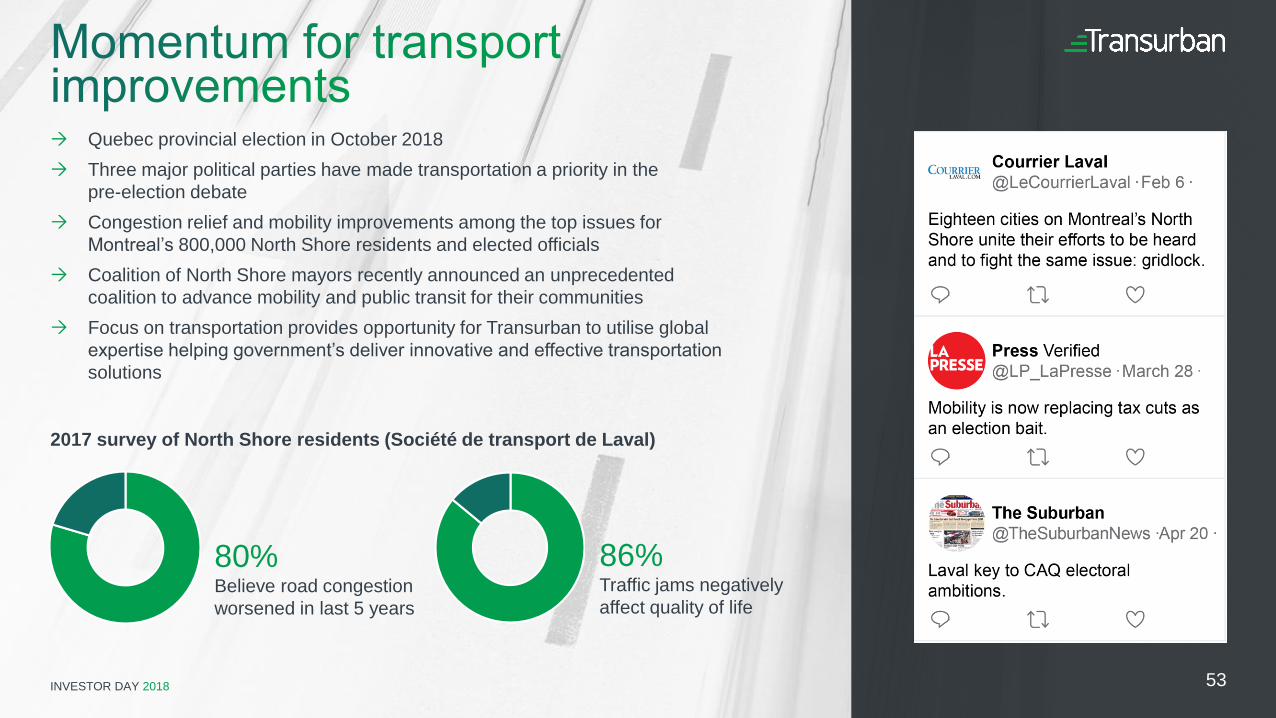
Quebec provincial election in October 2018 Three major political parties have made transportation a priority in the
pre-election debate Congestion relief and mobility improvements among the top issues for
Montreal’s 800,000 North Shore residents and elected officials Coalition of North Shore mayors recently announced an unprecedented
coalition to advance mobility and public transit for their communities Focus on transportation provides opportunity for Transurban to utilise global
expertise helping government’s deliver innovative and effective transportation
solutions
2017 survey of North Shore residents (Société de transport de Laval)
80%Believe road congestion worsened in last 5 years
86%Traffic jams negatively affect quality of life
53
INVESTOR DAY 2018
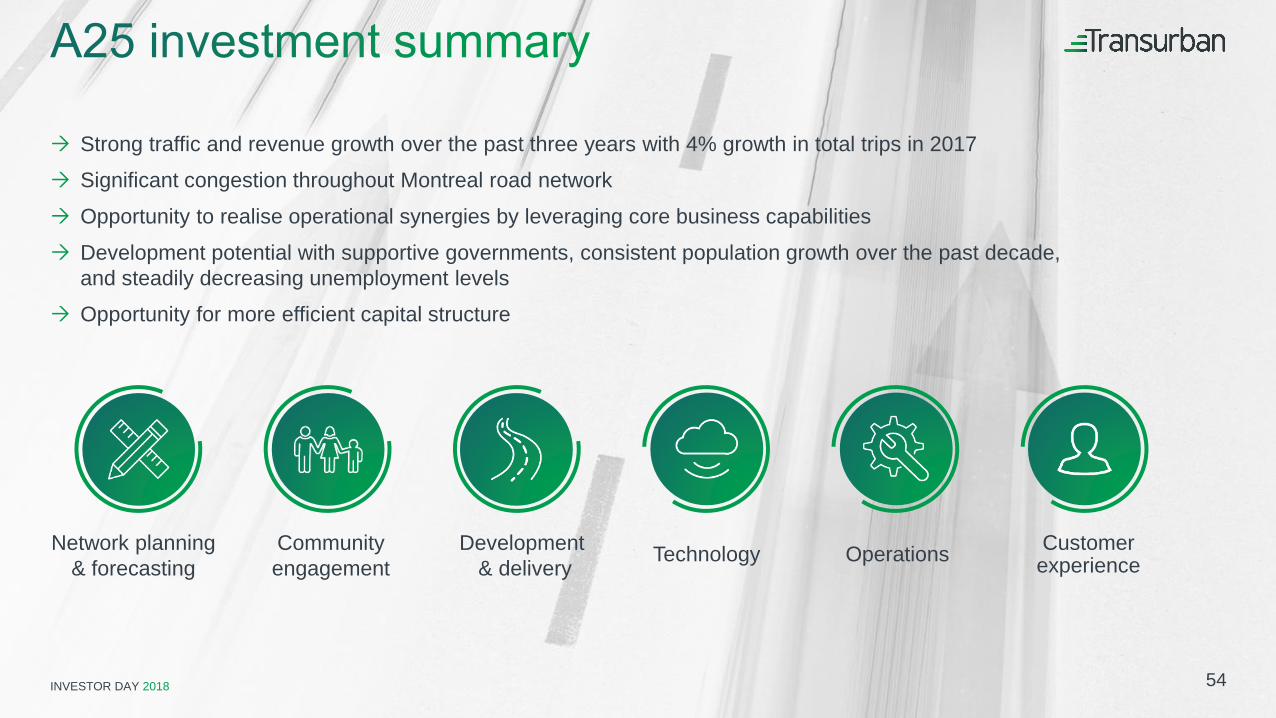
Strong traffic and revenue growth over the past three years with 4% growth in total trips in 2017 Significant congestion throughout Montreal road network Opportunity to realise operational synergies by leveraging core business capabilities
Development potential with supportive governments, consistent population growth over the past decade,and steadily decreasing unemployment levels
Opportunity for more efficient capital structure
54
Network planning& forecasting
Development& delivery
Communityengagement Technology Operations Customer
experience

INVESTOR DAY 2018
Wrap-up
INVESTOR DAY 2018
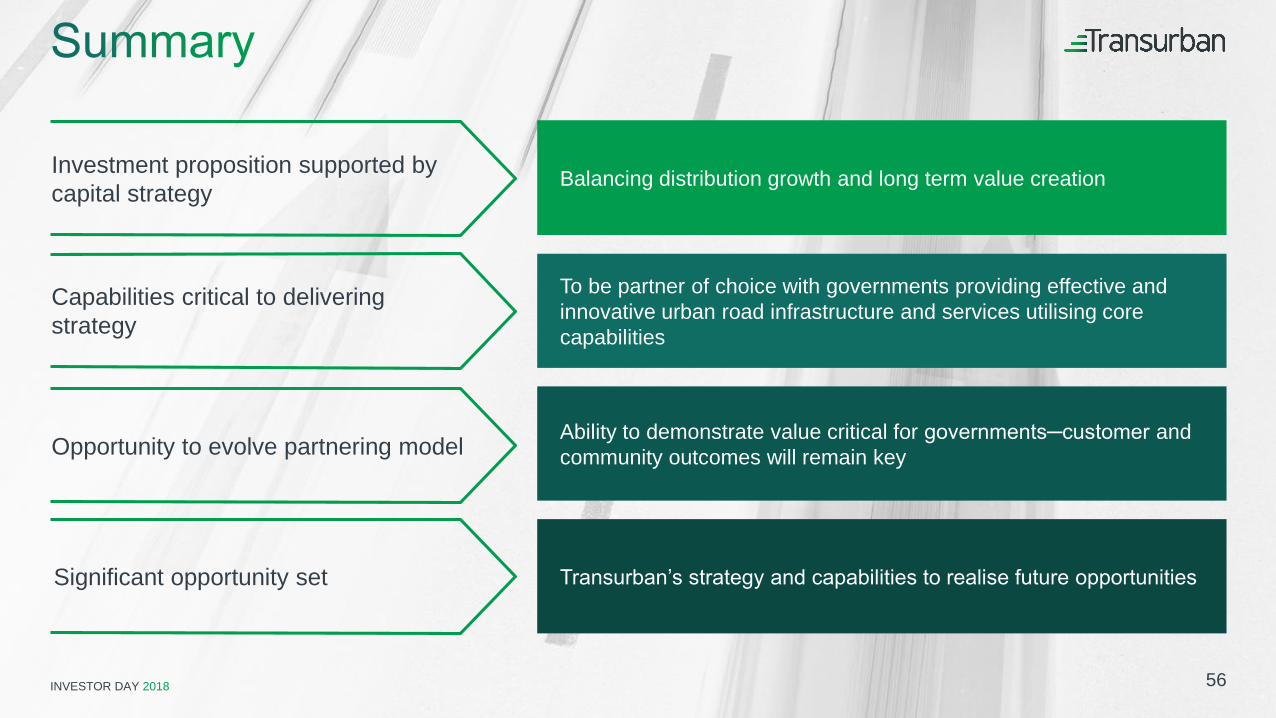
Investment proposition supported by capital strategy
Capabilities critical to delivering strategy
Opportunity to evolve partnering model
Balancing distribution growth and long term value creation
To be partner of choice with governments providing effective and innovative urban road infrastructure and services utilising core capabilities
Ability to demonstrate value critical for governments─customer and community outcomes will remain key
Significant opportunity set Transurban’s strategy and capabilities to realise future opportunities
56
INVESTOR DAY 2018
Analyst data pack
INVESTOR DAY 2018
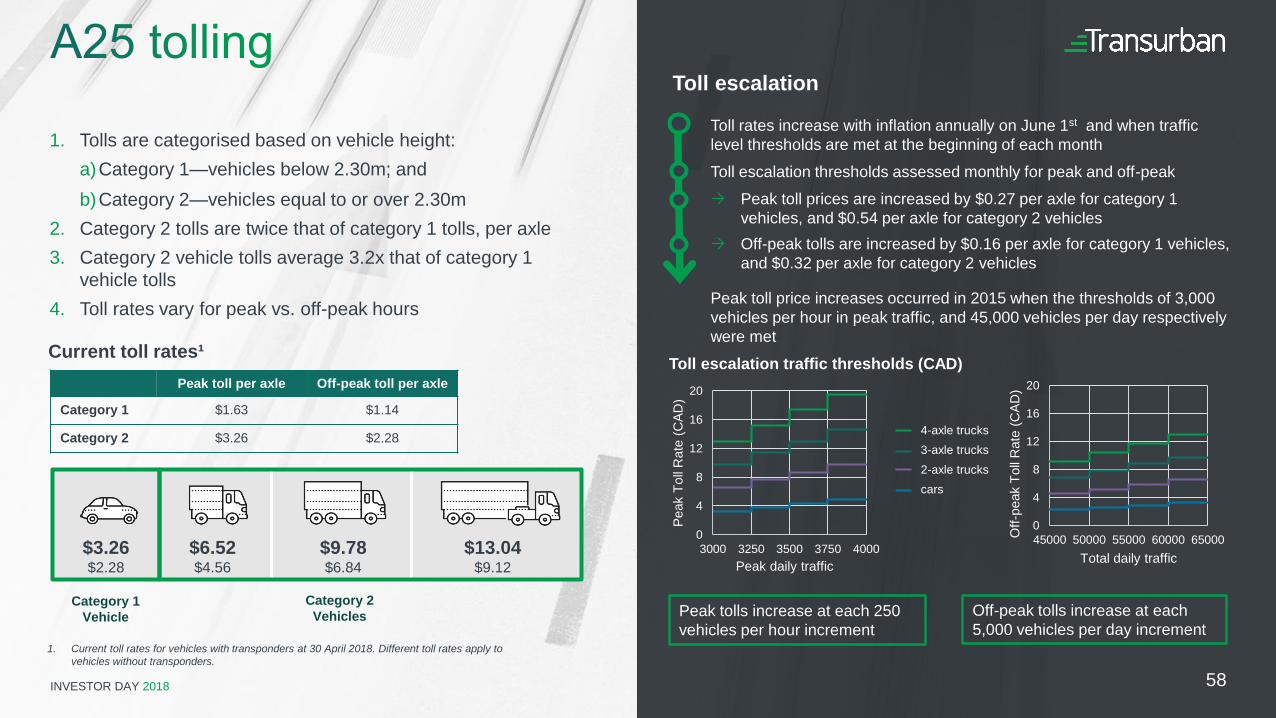
1. Tolls are categorised based on vehicle height:a)Category 1—vehicles below 2.30m; andb)Category 2—vehicles equal to or over 2.30m
2. Category 2 tolls are twice that of category 1 tolls, per axle3. Category 2 vehicle tolls average 3.2x that of category 1
vehicle tolls4. Toll rates vary for peak vs. off-peak hours
0
4
8
12
16
20
45000 50000 55000 60000 65000Off-
peak
Tol
l Rat
e (C
AD)
Total daily traffic
0
4
8
12
16
20
3000 3250 3500 3750 4000
Peak
Tol
l Rat
e (C
AD)
Peak daily traffic
Toll escalation traffic thresholds (CAD)
Toll rates increase with inflation annually on June 1st and when traffic level thresholds are met at the beginning of each monthToll escalation thresholds assessed monthly for peak and off-peak Peak toll prices are increased by $0.27 per axle for category 1
vehicles, and $0.54 per axle for category 2 vehicles Off-peak tolls are increased by $0.16 per axle for category 1 vehicles,
and $0.32 per axle for category 2 vehicles
Peak toll price increases occurred in 2015 when the thresholds of 3,000 vehicles per hour in peak traffic, and 45,000 vehicles per day respectively were met
Current toll rates¹
$3.26$2.28
$6.52$4.56
$9.78$6.84
$13.04$9.12
Category 1Vehicle
Category 2Vehicles Peak tolls increase at each 250
vehicles per hour increment Off-peak tolls increase at each 5,000 vehicles per day increment
Peak toll per axle Off-peak toll per axle
Category 1 $1.63 $1.14
Category 2 $3.26 $2.28
Toll escalation
1. Current toll rates for vehicles with transponders at 30 April 2018. Different toll rates apply to
vehicles without transponders.
4-axle trucks3-axle trucks2-axle truckscars
58
INVESTOR DAY 2018 59
42
43
44
45
46
47
FY15 FY16 FY17
60%
62%
64%
66%
68%
70%
FY15 FY16 FY17
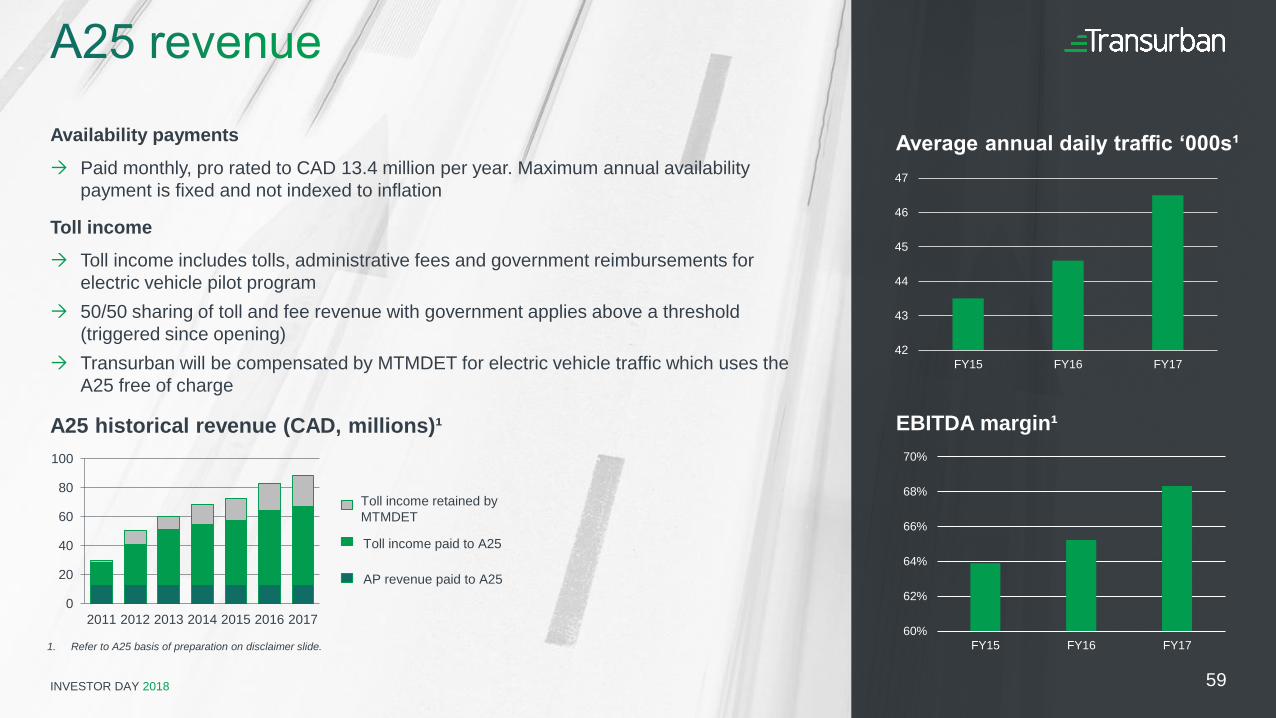
Average annual daily traffic ‘000s¹
EBITDA margin¹A25 historical revenue (CAD, millions)¹
Availability payments Paid monthly, pro rated to CAD 13.4 million per year. Maximum annual availability
payment is fixed and not indexed to inflation
Toll income Toll income includes tolls, administrative fees and government reimbursements for
electric vehicle pilot program 50/50 sharing of toll and fee revenue with government applies above a threshold
(triggered since opening) Transurban will be compensated by MTMDET for electric vehicle traffic which uses the
A25 free of charge
0
20
40
60
80
100
2011 2012 2013 2014 2015 2016 2017
Toll income retained by MTMDET
Toll income paid to A25
AP revenue paid to A25
1. Refer to A25 basis of preparation on disclaimer slide.
INVESTOR DAY 2018
Glossary
INVESTOR DAY 2018
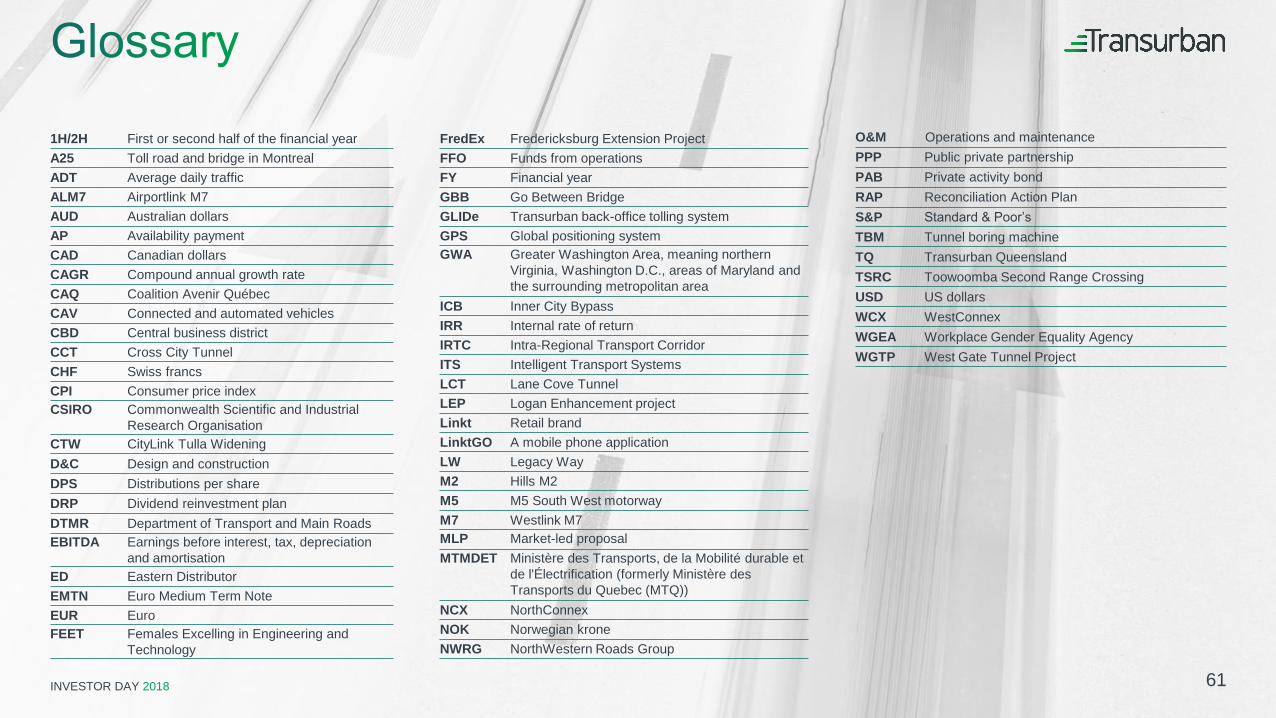
1H/2H First or second half of the financial yearA25 Toll road and bridge in MontrealADT Average daily trafficALM7 Airportlink M7AUD Australian dollarsAP Availability paymentCAD Canadian dollarsCAGR Compound annual growth rateCAQ Coalition Avenir QuébecCAV Connected and automated vehiclesCBD Central business districtCCT Cross City TunnelCHF Swiss francsCPI Consumer price indexCSIRO Commonwealth Scientific and Industrial
Research OrganisationCTW CityLink Tulla WideningD&C Design and constructionDPS Distributions per shareDRP Dividend reinvestment planDTMR Department of Transport and Main RoadsEBITDA Earnings before interest, tax, depreciation
and amortisationED Eastern DistributorEMTN Euro Medium Term NoteEUR EuroFEET Females Excelling in Engineering and
Technology
FredEx Fredericksburg Extension ProjectFFO Funds from operationsFY Financial yearGBB Go Between BridgeGLIDe Transurban back-office tolling systemGPS Global positioning systemGWA Greater Washington Area, meaning northern
Virginia, Washington D.C., areas of Maryland and the surrounding metropolitan area
ICB Inner City BypassIRR Internal rate of returnIRTC Intra-Regional Transport CorridorITS Intelligent Transport SystemsLCT Lane Cove TunnelLEP Logan Enhancement projectLinkt Retail brandLinktGO A mobile phone applicationLW Legacy WayM2 Hills M2M5 M5 South West motorwayM7 Westlink M7MLP Market-led proposalMTMDET Ministère des Transports, de la Mobilité durable et
de l'Électrification (formerly Ministère des Transports du Quebec (MTQ))
NCX NorthConnexNOK Norwegian kroneNWRG NorthWestern Roads Group
O&M Operations and maintenancePPP Public private partnershipPAB Private activity bondRAP Reconciliation Action PlanS&P Standard & Poor’s
TBM Tunnel boring machineTQ Transurban QueenslandTSRC Toowoomba Second Range CrossingUSD US dollarsWCX WestConnexWGEA Workplace Gender Equality AgencyWGTP West Gate Tunnel Project
61