Embed Size (px)
Citation preview

INVESTOR DAY 2017
December 6th 2017
TSE: WJA

2 TSE: WJA
Agenda

3 TSE: WJA
Caution regarding forward-looking information This presentation contains forward-looking information, as defined under applicable securities legislation, including without limitation, relating to the following: our expectations regarding the timing and impact of introducing new, and building upon existing, aircraft, destinations, technologies and initiatives; our expectations regarding expansion into new markets and our ability to create demand in those markets; our expectations regarding the success of our competitive strategy; our expectations regarding the launch and impact of our ultra-low-cost carrier; our expectations regarding the operation and impact of our capacity purchase agreement; our expectations regarding the consummation and impact of the joint venture; our expectations regarding our airline and strategic partnerships; our expectations regarding our fleet and ownership mix; our expectations regarding aircraft deliveries; our expectations regarding our ability to address the needs of employees; our expectations regarding future acquisitions, dispositions and option exercises; our expectations regarding the future need for and opening of new facilities and infrastructure; our expectations regarding long term financial and performance targets; our dividend policies; our ability to repurchase outstanding shares; or ability to continue to our expectations regarding our internal control over financial reporting and ability to maintain compliance with accounting standards, and the adoption of new accounting standards; our expectations regarding financial and operating performance; our expectations regarding our credit ratings and our ability to access financing; our expectations regarding fuel prices and our hedging strategy; our expectations regarding the strengthening economy in Alberta and the value of the Canadian dollar; our expectations regarding the receipt of governmental certifications and the absence of material adverse regulatory changes; and our expectations regarding the outcome and impact of ongoing legal proceedings. You are cautioned that our expectations, estimates, projections and assumptions used in the preparation of such information, although considered reasonable at the time of preparation, may prove to be imprecise and, as such, undue reliance should not be placed on forward-looking information. With respect to forward-looking information contained in this presentation, we have made certain key assumptions based on: the terms of agreements we have entered into including agreements with respect to future aircraft acquisitions and dispositions, leasing and with our airline and strategic partners; our ability to execute on our strategic plans and initiatives; existing delivery, maintenance and configuration plans and schedules; our assessment of labour and infrastructure requirements; our forecasts and budgets concerning financial performance and capital expenditures; our assessment of the markets in which we operate or plan to operate; our expectation that we will maintain investment grade corporate debt credit ratings; our ability to repay existing debt as scheduled; our assessment of the economic environment in Canada, foreign exchange rates and fuel prices; our discussions with governmental agencies and contractual counterparties; current legislation and expectations regarding legislative changes; and our assessment of legal proceedings. Any forward-looking information included in this presentation is subject to and should be read in conjunction with the cautionary statements in our Annual Information Form dated March 15, 2017, and filed on SEDAR on March 22, 2017, Management Information Circular dated March 20, 2017 in connection with the annual meeting of shareholders held on May 2, 2017, and filed on SEDAR on March 31, 2017, Management’s Discussion and Analysis of Financial Condition and Operating Results for the years ended December 31, 2016 and 2015, and filed on SEDAR on February 7, 2017 (“Annual MD&A”) and Management’s Discussion and Analysis of Financial Condition and Operating Results for the three and nine months ended September 30, 2017 and 2016, and filed on SEDAR on October 31, 2017 (“Interim MD&A”), as applicable. Our actual results, performance or achievements could differ materially from those expressed in, or implied by, this forward-looking information. We can give no assurance that any of the events anticipated will transpire or occur, or if any of them do, what benefits or costs we will derive from them. By its nature, forward-looking information is subject to numerous risks and uncertainties, including, but not limited to, the impact of general economic conditions, changing domestic and international industry conditions, volatility of fuel prices, maintenance and operating costs, dependence on key markets, airports, partnerships and suppliers, loss of contracts or adverse changes to existing agreements, failure of critical systems, privacy and security of guest information, terrorism, safety incidents, currency fluctuations, interest rates, competition from other industry participants (including new entrants and more generally in regards to capacity fluctuations and the pricing environment), adverse changes to our corporate culture, internal and third-party labor matters, government regulation, stock-market volatility, weather conditions, pandemics, political or economic instability in emerging international markets, the ability to access sufficient capital from internal and external sources, the ability to service financial obligations, the risks set out under the heading “Risks and Uncertainties” in our Annual MD&A and other documents we file from time to time with securities regulatory authorities, which are available on SEDAR or, upon request, without charge from us. The forward-looking information contained in this presentation is expressly qualified by this cautionary statement. Our assumptions relating to the forward-looking information referred to above are updated annually and, except as required by law, we do not undertake to update any other forward-looking information. Note: All references to dollars contained in the presentation refer to Canadian Dollars (CAD), unless otherwise noted
4 TSE: WJA
Non-GAAP and additional GAAP measures
This presentation contains disclosure respecting non-GAAP financial measures including, without limitation, return on invested capital (ROIC); cash to twelve month revenue; and adjusted net debt to earnings before interest, taxes, depreciation, aircraft rent and other items (EBITDAR). These measures are included to enhance the overall understanding of WestJet’s financial performance and to provide an alternative method for assessing WestJet’s operating results in a manner that is focused on the performance of WestJet’s ongoing operations, and to provide a more consistent basis for comparison between reporting periods. These measures are not calculated in accordance with, or an alternative to, GAAP and do not have standardized meanings. Therefore, they may not be comparable to similar measures provided by other entities. Readers are urged to review the section entitled “Reconciliation of non-GAAP and additional GAAP measures” in WestJet’s management’s discussion and analysis of financial results for the three and nine months ended September 30, 2017, which is available under WestJet’s profile at www.sedar.com, for a further discussion of such non-GAAP measures.
KEY OPERATING INDICATORS
Key operating indicators used herein have the meanings ascribed thereto in WestJet’s management’s discussion and analysis of financial results for the three and nine months ended September 30, 2017 under the heading “Definition of key operating indicators”.
PRESENTATION OF FINANCIAL INFORMATION
All financial data contained in this presentation in respect of WestJet for periods subsequent to December 31, 2009 has been prepared in accordance with International Financial Reporting Standards ("IFRS"). For periods prior to January 1, 2010, WestJet prepared its financial statements in accordance with Canadian generally accepted accounting principles as defined in Part V of the Canadian Institute of Chartered Accountant's Handbook ("Previous GAAP"). For additional information concerning the impact upon WestJet's financial statements for periods prior to January 1, 2011 of significant differences between IFRS as utilized in preparing its financial statements and Previous GAAP, please see note 22 to WestJet's financial statements for the years ended December 31, 2011 and 2010. Financial information with respect to WestJet's competitors included in this presentation has been derived from the financial information made publicly available by those companies, which, in most cases, was prepared using financial reporting standards different from those used by WestJet, which may not be comparable to those used by WestJet. Note: All references to dollars contained in the presentation refer to Canadian Dollars (CAD), unless otherwise noted

TSE: WJA 5
VIDEO

• Click to edit Master text styles - Second level
• Third level ≫ Fourth level
Click to edit Master title style
6 TSE: WJA
Evolving our airline into a global player
Gregg Saretsky President & CEO

TSE: WJA 7
Our mission
To enrich the lives of everyone in WestJet’s world.

• Click to edit Master text styles - Second level
• Third level ≫ Fourth level
Click to edit Master title style
8 TSE: WJA 8 TSE: WJA
Four key pillars for achieving our vision
Financial strength
People & culture
Diversified, sustainable
revenue growth
Operational excellence
1 2 3 4
9 TSE: WJA
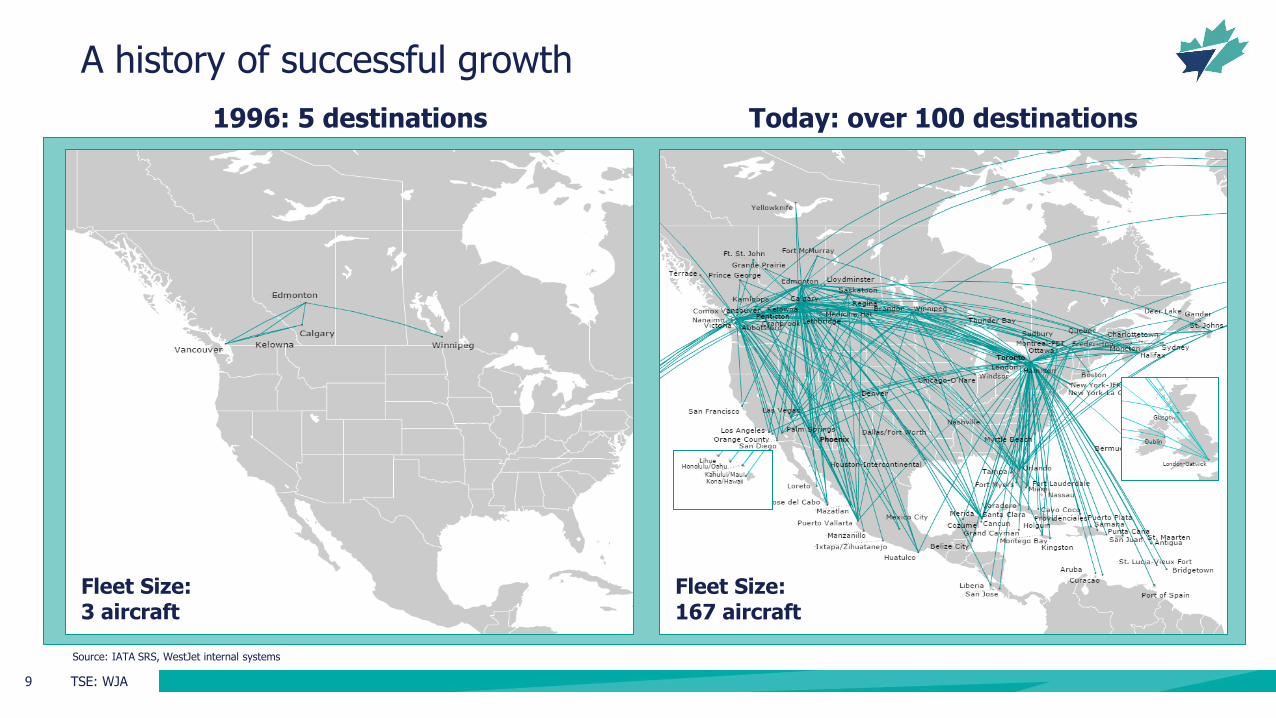
A history of successful growth
Source: IATA SRS, WestJet internal systems
Fleet Size: 3 aircraft
Fleet Size: 167 aircraft
1996: 5 destinations Today: over 100 destinations

• Click to edit Master text styles - Second level
• Third level ≫ Fourth level
Click to edit Master title style
10 TSE: WJA 10 TSE: WJA
Profitability and value creation are hallmarks of our story
($50)
$0
$50
$100
$150
$200
$250
$300
$350
$400
1996
1997
1998
1999
2000
2001
2002
2003
2004
2005
2006
2007
2008
2009
2010
2011
2012
2013
2014
2015
2016
2017YTD
Ne
t in
co
me
1 (
$ m
illi
on
s)
consecutive quarters of profit Over $1 billion returned to shareholders since 2010
1 Current as of the nine months ended September 30th 2017 as presented in WestJet’s external financial statements

11 TSE: WJA
Current positioning: competing at both ends of the spectrum
Value Premium/Luxury Thrift
Network / Schedule / Product High Low
New Entrants

12 TSE: WJA
Future positioning: a focused approach to market segmentation
Strategy: WestJet will evolve from a low-cost, point-to-point airline into a high-value, global network carrier; Swoop will win in the price-sensitive segment
ULCC1 High-Value, Global Network Carrier
+ 767 / 787 737NG/MAX Q400 737
Value Premium/Luxury Thrift
Network / Schedule / Product High Low
1 “ULCC” refers to ultra low-cost carrier
13 TSE: WJA
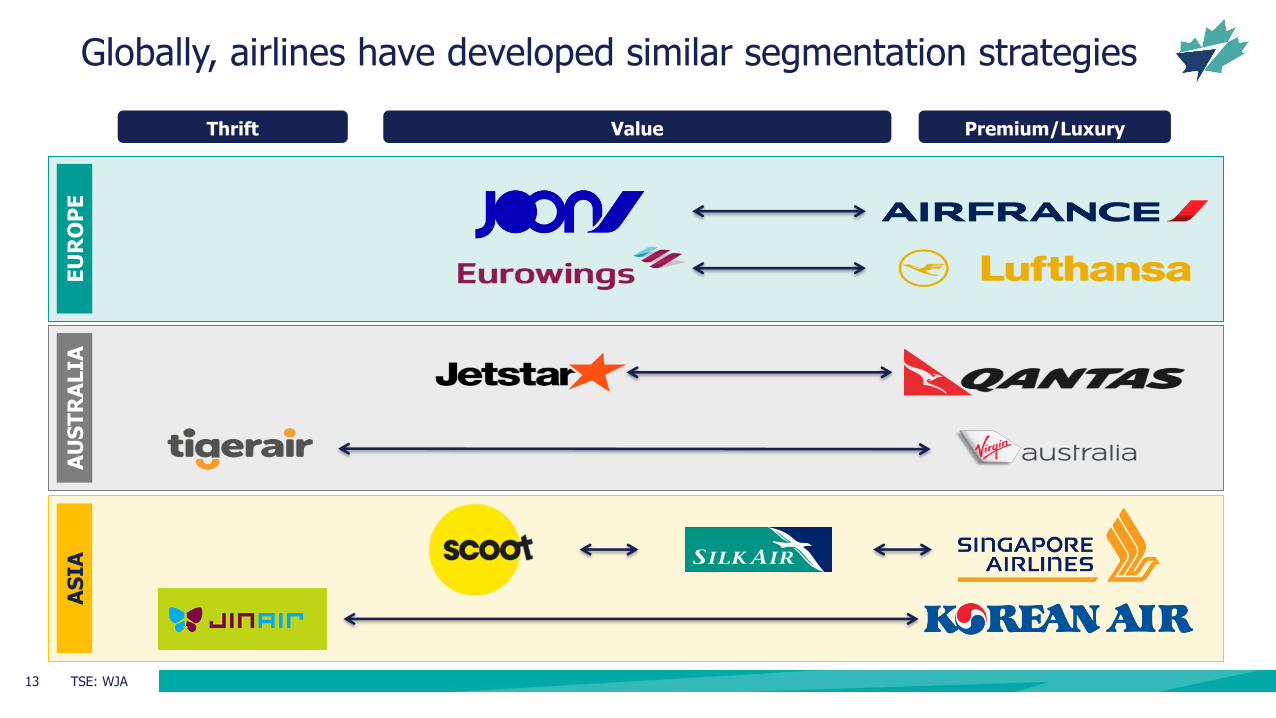
Globally, airlines have developed similar segmentation strategies
Premium/Luxury Thrift Value
AS
IA
EU
RO
PE
A
US
TR
ALIA

• Click to edit Master text styles - Second level
• Third level ≫ Fourth level
Click to edit Master title style
14 TSE: WJA 14 TSE: WJA
Sources of competitive advantage
Competitive Cost Structure
People & Culture
Network
Segmented Brand Strategy
Guest Experience
Rewards

15 TSE: WJA
Our executive team: committed to enhancing shareholder value
Gregg Saretsky President & CEO
Mark Porter EVP, People & Culture
Bob Cummings EVP, Strategy
Craig Maccubbin EVP, CIO
Charles Duncan EVP, President- WestJet Encore
Ed Sims EVP, Commercial
Barb Munroe EVP, Corporate Services & General Counsel
Harry Taylor EVP, Finance & CFO
Cam Kenyon EVP, Operations
Rossen Dimitrov Chief Guest Experience Officer

16 TSE: WJA
Proven track record of successful execution
20
10
20
13
20
14
20
16
20
17
WestJet Rewards & co-brand
WestJet Encore
First transatlantic 737 flights
Wide-body service to
Europe
First 737 MAX operator in
Canada
Source: WestJet internal systems
20
11
First codeshare
20
12
Fare bundles
20
15
WestJet Connect

• Click to edit Master text styles - Second level
• Third level ≫ Fourth level
Click to edit Master title style
17 TSE: WJA 17 TSE: WJA
The next chapter of our partnership journey
Note: Joint venture is subject to regulatory approval

18 TSE: WJA
The next phase of growth
Joint venture
Rewards growth
787 Dreamliner
Capacity Purchase Agreement
Ground & inflight product
Swoop

19 TSE: WJA
Five things to take away from today
Outlook is strong
People, culture, and guests remain
at our core
Competitive cost structure
Segmented brand strategy
Premium segment growth

• Click to edit Master text styles - Second level
• Third level ≫ Fourth level
Click to edit Master title style
20 TSE: WJA
Ed Sims Executive Vice President, Commercial
Diversified, Sustainable Revenue Growth

21 TSE: WJA
Aligning our products & services with what guests value most

22 TSE: WJA
Multiple levels of insight generate a deep understanding of our guests
Segmentation
Voice of
the Guest
Data Analytics
Proactively
anticipating
guest needs
&
influencing
behaviour

TSE: WJA 23
Network & Schedule: Building Network Depth & Schedule Utility

24 TSE: WJA
Network strategy based on four core tenets
Improve schedule utility
(e.g. reliable hourly schedules in key markets)
Build our hubs
(e.g. coverage & frequency)
Enhance connectivity & feed
Partnerships
25 TSE: WJA
0
10
20
30
40
2012 2013 2014 2015 2016 2017
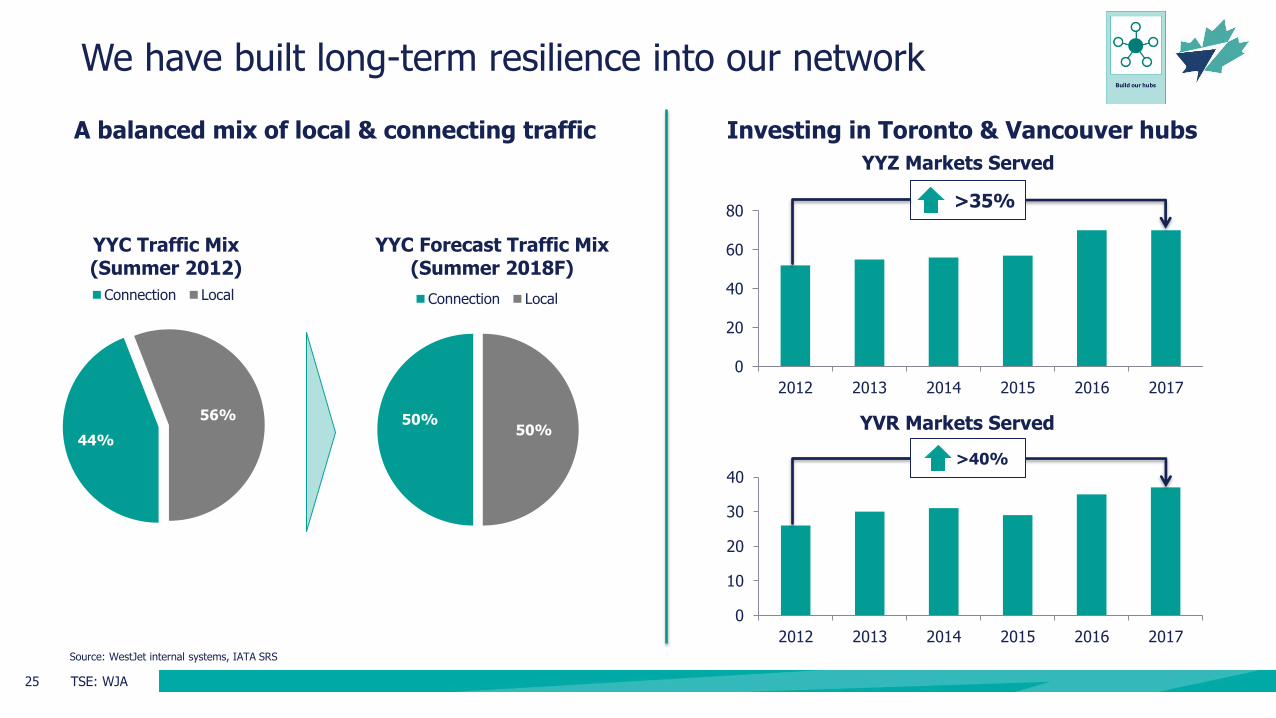
YVR Markets Served
0
20
40
60
80
2012 2013 2014 2015 2016 2017
YYZ Markets Served
We have built long-term resilience into our network
A balanced mix of local & connecting traffic Investing in Toronto & Vancouver hubs
>40% 44%
56%
YYC Traffic Mix (Summer 2012)
Connection Local
50% 50%
YYC Forecast Traffic Mix (Summer 2018F)
Connection Local
Source: WestJet internal systems, IATA SRS
>35%

26 TSE: WJA
1,760
1,780
1,800
1,820
1,840
1,860
1,880
1,900
1,920
1,940
Thousa
nds
Alberta Full Time Employment
Alberta headwinds are dissipating
Source: BMO Provincial Economic Outlook (November 2017)
Full-time employment
trending upwards
1.5
3.5
(3.7
)
2.6
3.1
3.8
4.1
3.0
2.2
2.5
2.3
2.3
1.8
2.2
2.4
2.0
(5.0)
(4.0)
(3.0)
(2.0)
(1.0)
0.0
1.0
2.0
3.0
4.0
5.0
Canada B.C. Alberta Ontario
Real G
DP (
YoY %
)
GDP Growth Forecast 2016 2017F 2018F 2019F
Alberta growth set to outpace
national average
Source: Statistics Canada

27 TSE: WJA
WestJet Encore supports our network strategy
Source: IATA SRS; WestJet internal systems
8
15
24
34
43 45
0
10
20
30
40
50
2013 2014 2015 2016 2017 2018F
WestJet Encore Fleet
WestJet Encore was successfully launched in 2013

28 TSE: WJA
WestJet Encore is accretive
Service to new destinations
Network feed
Increased 737 availability
Efficient & cost-effective
Adds schedule depth
Source: WestJet internal systems

29 TSE: WJA
CPA increases network feed
CPA Benefits:
Expand network reach
Strengthen Calgary (YYC) hub
Network flow & connections
Service and operations consistent with WestJet
Opportunity to expand & replicate CPA model across Canada
Note: “CPA” refers to Capacity Purchase Agreement
Initial Network
Prince George
Lloydminster
Cranbrook Medicine Hat
Calgary
Lethbridge

30 TSE: WJA
Winter 2017: our network strategy in action
1 Advertisement mock-up refers to WestJet Winter 2017 schedule (Vancouver (YVR) to Calgary (YYC)) 09:00 through 20:00 timeframe Source: IATA SRS, WestJet internal systems
Winter 2016(Nov-Apr)
Winter 2017(Nov-Apr)
Number of Connecting Markets
>3x more connections
Existing connecting markets (W16)
New connecting markets (W17)
Enhanced connectivity
e.g. Phoenix-Calgary
Improved schedule utility1

31 TSE: WJA
Codeshare Partners:
Airline partnerships already contribute over $250M in annual revenue
Note: Figures represent partnerships’ total revenue receivable percentage growth over past 5 years Source: WestJet internal systems
+245% Americas +334% EMEA +324% Asia & Australia

32 TSE: WJA
The next chapter of our partnership journey
1 Planned application to regulatory authority Note: Joint venture is subject to regulatory approval
Agreement:
Memorandum of Understanding
Timing1:
2018
Scope:
Transborder Joint Venture
+
TSE: WJA 33
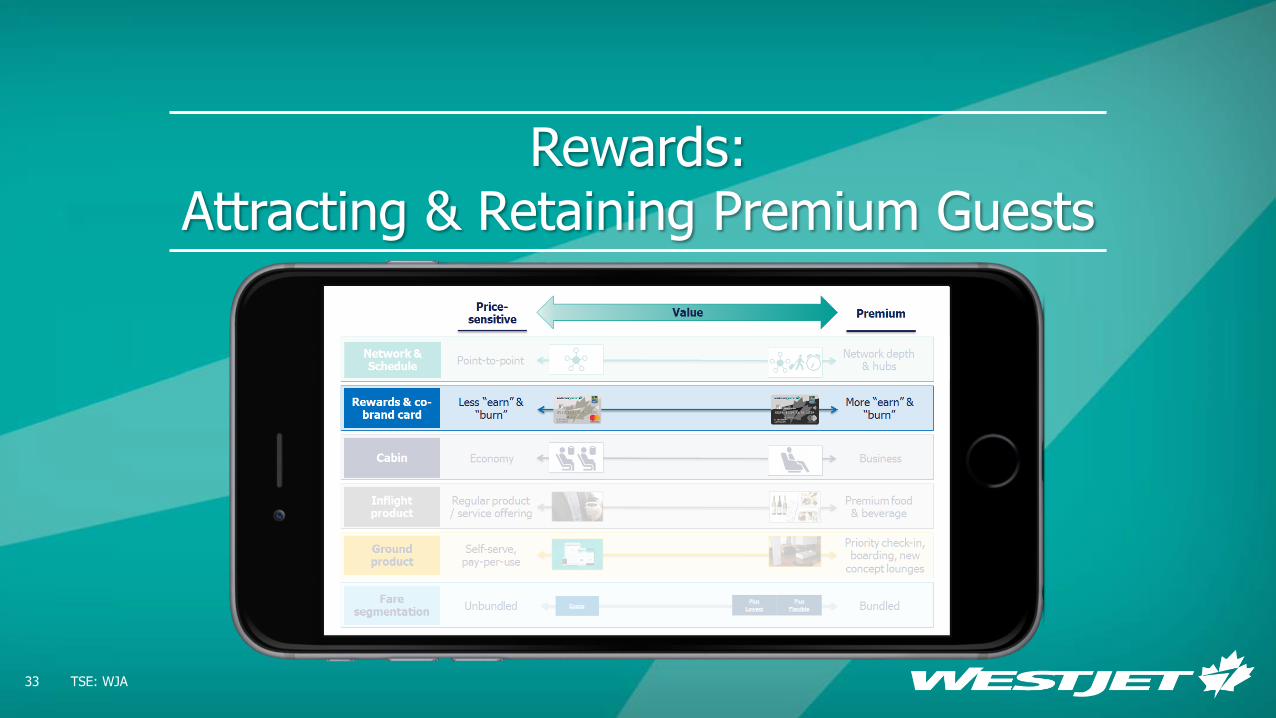
Rewards: Attracting & Retaining Premium Guests

34 TSE: WJA
2010 2011 2012 2013 2014 2015 2016 2017F
WestJet Rewards: simple and transparent
WestJet Rewards:
• Program exceeds 4M members
• Largest growth coming from top-tier segment
Dollar-based program
Transparent No black-outs or seat restrictions
Partial redemption
Rewards tiers introduced
Source: WestJet internal systems
Once in a lifetime opportunity to catalyze Rewards program growth

35 TSE: WJA
WestJet RBC® Mastercard‡: #1 travel rewards card in Canada four years in a row1
2010 2011 2012 2013 2014 2015 2016 2017F
Up to 2% earn
Annual companion pass
Free 1st checked bag
Welcome bonus
WestJet RBC® Mastercard‡
• Partnered with Canada’s largest bank
• New product features & card art launched in November
‡ Registered trademark of Mastercard International Incorporated. Used under license. 1 Moneysense 2013-2016
Co-brand card growing at >40% CAGR since 2010

36 TSE: WJA
Deepening our loyalty partnership
+
• Deepening our reach amongst high value customers & premium travellers through our strategic partnership
• Building out a series of guest-related enhancements starting in 2018

TSE: WJA 37
Product & Digital: Investing for the Future

38 TSE: WJA
Inflight product will enhance premium traveller appeal
Building on Plus momentum
New premium food & beverage offering
New WestJet 737 MAX interior
Dynamic LED lighting
Increased headroom
Slimline seats
Larger, guest friendly bins

39 TSE: WJA
Nine new lounges create a high-tech, low-touch environment

• Click to edit Master text styles - Second level
• Third level ≫ Fourth level
Click to edit Master title style
40 TSE: WJA 40 TSE: WJA
Enhancing the digital experience throughout the guest journey
3rd Party Integration
Reaccommodation & Personalization
Baggage Tracking
Flight Status/ Change
Airport Mapping, Lounge Access, Rewards
Smart Messaging & Upsell

41 TSE: WJA
Building brand strength and product awareness in key markets
WestJet Plus: stretch your legs without stretching your budget
Save money on travel with the WestJet RBC® World Elite Mastercard‡
‡ Registered trademark of Mastercard International Incorporated. Used under license.

TSE: WJA 42
Fare Bundles: Enhancing Guest Choice & Value

43 TSE: WJA
Fare bundles support our segmentation strategy
Current Fare Bundles
1st checked bag
2nd checked bag
Most flexible
Advance seat selection
Plus product
Advance boarding
Priority screening
1st checked bag
2nd checked bag
Less flexible
Advance seat selection
Plus product
Advance boarding
Priority screening
1st checked bag
More flexible
Enhanced ability to address different segments; priced according to what guests value most
Baggage
Change/cancel flexibility
Guest experience
Econo Flex Plus
Lowest
Plus Flexible
Source: WestJet internal systems

44 TSE: WJA
New initiatives will grow ancillary revenue
Opportunities for ancillary growth:
• Dynamic ancillary pricing
(e.g. pre-reserved seating)
• Enhanced buy-on-board product
• Swoop
2014 2015 2016 2017F
More leg room
Enhanced inflight product
Advance boarding
Priority screening
WestJet Plus Revenue
Source: WestJet internal systems
Plus revenue has grown at >25% CAGR since 2014

TSE: WJA 45
787 Dreamliner: The Next Chapter of Growth

• Click to edit Master text styles - Second level
• Third level ≫ Fourth level
Click to edit Master title style
46 TSE: WJA 46 TSE: WJA
Successfully competed in a mature, highly saturated market
Point of Sale Summer 2017
1 Actual utilization; excludes operational spare Note: “London” refers to London-Heathrow and London-Gatwick Source: WestJet internal systems
Other
58%
32%
5%
5%
93%
Oct. 2017Trailing Twelve Months
Load Factor 767 London Gatwick
42% foreign point of sale
~16
Summer 2017(May-Oct)
Utilization 767 London Gatwick
hours1

47 TSE: WJA
787 Dreamliner opens up a world of possibilities
Illustrative Network

48 TSE: WJA
787 Dreamliner product offering
Business class product offering
Premium economy product offering
Flat-bed, direct-aisle access seat
IFEC with large monitor
In-seat power
Dedicated flight attendant
Hot meals
Lounge access
Dedicated lavatory & closets
Wider seat with more leg room
IFEC with seatback monitor
In-seat power
Dedicated flight attendant
Hot meals
Dedicated lavatory

TSE: WJA 49
VIDEO

• Click to edit Master text styles - Second level
• Third level ≫ Fourth level
Click to edit Master title style
50 TSE: WJA 50 TSE: WJA
Summary: significant opportunity for top-line growth
Enhanced RM1/Network
tools
Fare products &
ancillary
Transborder joint venture
Going global Domestic premium
traveller share
Total
$300 – 500M
Annual revenue opportunity
through 2022
1 “RM” refers to Revenue Management Note: Based on internal estimates
Attracting & retaining premium travellers

51 TSE: WJA
Win in the price-sensitive segment
Why we will win: key elements of WestJet’s commercial strategy
Rewards & co-brand growth
Digital / self-serve
Deeper strategic
partnerships
Building network depth
Ground & inflight product enhancements
High-value, global network carrier
+

• Click to edit Master text styles - Second level
• Third level ≫ Fourth level
Click to edit Master title style
52 TSE: WJA
Swoop Business Strategy
Bob Cummings EVP, Strategy

53 TSE: WJA
Swoop leadership team
Karen Kersch Senior Leader, Maintenance
Stephen Platt Senior Leader, Airports, Contact Centre & Central Support
Karen Romanchuk Senior Leader, Digital & Marketing
Todd Andaya Senior Leader, IT
David Moore Senior Leader, Flight Operations
Kellie Farrer Leader, Inflight
Jennifer Bue Senior Leader, Finance
Jamie MacDonald Senior Leader, People
Bob Cummings EVP, Strategy

54 TSE: WJA
WestJet’s parallel brand strategy
Description Stand-alone; ultra-low cost High-value, global network carrier
Guest Focus Price-sensitive guests Core leisure & premium guests
Network Stand-alone; point-to-point
(no connections onto WestJet) Connected global network
Branding Stand-alone; separate from WestJet WestJet; WestJet Encore; WestJet Link
Fares Fully unbundled,
focus on ancillary revenue Bundled, price according to what guests value most
Cost Structure 30-40% lower than mainline Focus on cost competitiveness while investing in
network, product, service

55 TSE: WJA
Swoop will be targeting millennials, young families and cost-conscious flyers
50% 25% 25%
MARKET STIMULATION
BORDER LEAKAGE
EXISTING PRICE
SENSITIVE
MARKET SIZE1 TARGET DEMOGRAPHICS
Millennials
40%
Young families
20%
Value boomers
40%
TRAVEL PURPOSE
Visiting friends & relatives (VFR)
30%
Leisure 60%
1 WestJet internal estimates
Business / Groups 10%

56 TSE: WJA
$74 $96 $85 $78
-
20
40
60
80
100
120
140
160
180
ULCCs around the world are focused on low fares with high ancillary fees
Average ancillary
Average ULCC fare
ULCC Average Fare and Ancillary Per Passenger1
1 All revenue figures are from FY 2016 publically disclosed financial information, converted to CAD$

57 TSE: WJA
39% 53%
38% 51%
26% 39%
57%
Global ULCC’s have set a ~40% benchmark of cost advantage vs. LCCs in their operating region
ULCC Relative Cost Advantage vs. LCC Stage length adjusted CASM ex-fuel 1, 2
1 All CASM excluding fuel figures are LTM September 2017 from publicly disclosed (as of November 15, 2017) financial information except Frontier which is full year 2016 2 All CASM excluding fuel figures have been stage length adjusted based on (carrier stage length / 1,250)^0.5

58 TSE: WJA
0¢
2¢
4¢
6¢
8¢
10¢
+0.4¢ Canada
premium
+ 0.4¢ FX on 25% of non-fuel costs
Stage Length Adjusted CASM, CASM ex-fuel 1, 2, 3
Swoop will have industry leading CASM
1 All CASM figures are LTM ended September 2017 except Frontier as FY 2016 and include adjustments as noted by each carrier. 2 All CASM figures been normalized to fuel @ CAD$0.67 and 1,250 stage length based on standard adjustment of (carrier stage length / 1,250)^0.5 3 Swoop forecasted CASM represents a cost structure when operational with a fleet of 10
5.0¢ USD
7.1¢ USD
5.0¢ USD
7.1¢ USD
7.8¢ USD
5.5¢ USD
5.1¢ USD
7.3¢ USD
U.S. Peer Avg. ($USD)
U.S. Peer Avg. ($CAD)
6.0¢ CAD
5.9¢ CAD
8.7¢ CAD
8.7¢ CAD
+0.8¢

59 TSE: WJA
Swoop success factors
All decisions must pass cost benefit
analysis
Avoid replicating WestJet model
Cost
Outsource where it makes sense
Highly productive employees
Sales commissions for inflight purchases
Labour efficiency
Unapologetic unbundling
High ancillary revenue
Complexity adds cost
Forego some revenue
opportunities to minimize complexity
Simplicity

60 TSE: WJA
Swoop business
model
Single Fleet Type Young 737-800 aircraft with 189 seats, high utilization
Labour Efficiency High productivity, efficient work rules
High Ancillary Fully unbundled model
Direct-Only Distribution No GDS, flyswoop.com direct web sales
Business model for our separate ULCC airline
Separate from WestJet AOC, Brand, Employees, HQ, Airport Operations, Website
Swoop business
model
$

61 TSE: WJA
Swoop will be a fully unbundled model generating ULCC benchmarked ancillary fees
BOOKING INFLIGHT OTHER Carry-on & checked bags
Priority boarding Seats
All food and beverage Movies & TV
Internet
Cancellations Call Centre

62 TSE: WJA
Swoop is WestJet’s parallel brand: intentionally separate with distinct personality
Separate from WestJet
Brand Personality Digital Focus
Spend the savings on yourself
Enabling Experiences

63 TSE: WJA
Eliminating the need to cross the border to access cheap fares
$155 (Low)
Roundtrip All-in Price for 1 traveller + 1 Checked Bag ($CAD)
Bellingham/Abbotsford - Las Vegas Buffalo/Hamilton - Ft Lauderdale
Drive & wait time 3 hours 20 mins 1 hour 40 mins 4 hours 10 mins 1 hour 50 mins
$330 $320 $280 $330
Note: All in fares including checked bag fees are based on carriers average fares stage length adjusted to route mileage plus actual checked bag fee by route converted to CAD$. Drive & wait times from Vancouver & Toronto, respectively

• Click to edit Master text styles - Second level
• Third level ≫ Fourth level
Click to edit Master title style
64 TSE: WJA 64 TSE: WJA
Swoop implementation timelines
Sep 2017 2018
First Flight
Jun
1st Sale
Feb
Brand Announcement
May
1st Aircraft Configuration
Oct
Signed Navitaire
Jan Apr
Obtain CTA License
HQ Obtain
AOC
Apr
Announcement of ULCC
Note: Subject to regulatory approval

65 TSE: WJA
Committed to doing it right Key resources have direct ULCC competencies and experience
High ancillary model Fit for purpose reservation system
Canadian market is ready for Swoop Model fully-developed and tested in other countries
Low cost is key Targeting 6.0¢ CASM ex-fuel (CAD)
Swoop: Canada’s first and strongest ULCC

TSE: WJA 66
BREAK

TSE: WJA 67
VIDEO

• Click to edit Master text styles - Second level
• Third level ≫ Fourth level
Click to edit Master title style
68 TSE: WJA
Creating shareholder value
Harry Taylor EVP, Finance & CFO
69 TSE: WJA
($50)
$0
$50
$100
$150
$200
$250
$300
$350
$400
1996
1997
1998
1999
2000
2001
2002
2003
2004
2005
2006
2007
2008
2009
2010
2011
2012
2013
2014
2015
2016
2017YTD
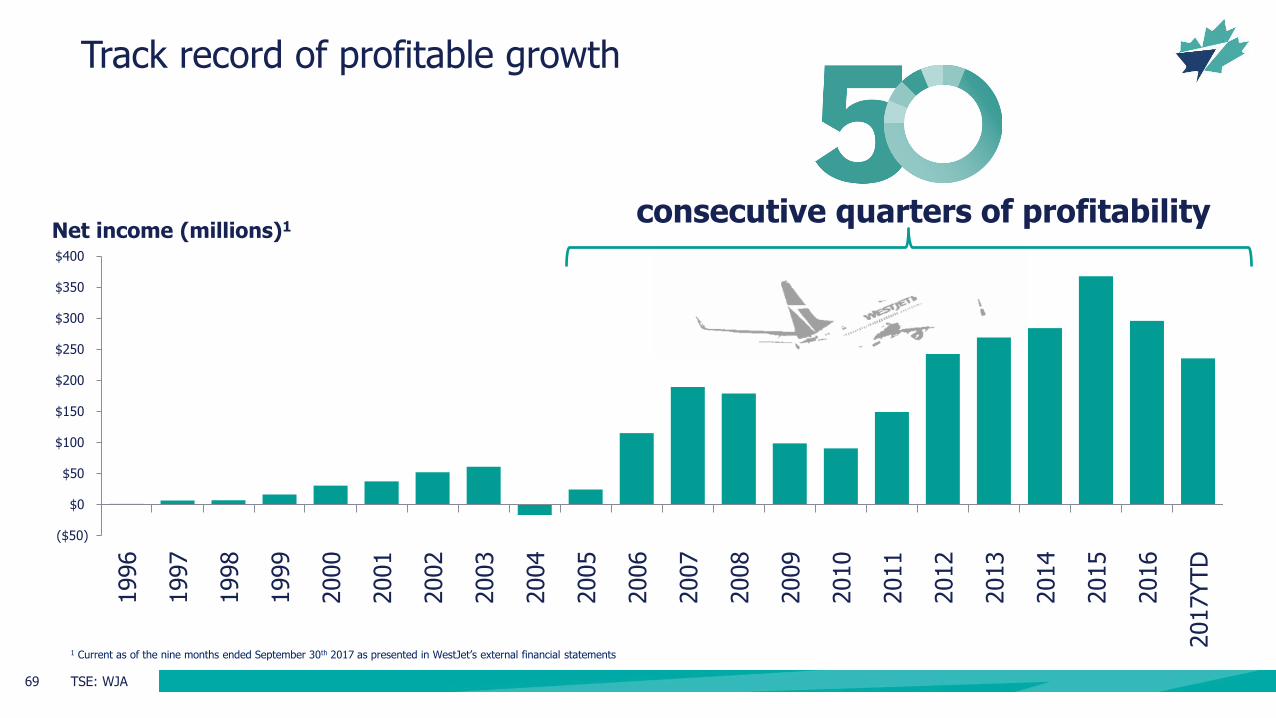
consecutive quarters of profitability
Track record of profitable growth
Net income (millions)1
1 Current as of the nine months ended September 30th 2017 as presented in WestJet’s external financial statements

70 TSE: WJA
0
0.02
0.04
0.06
0.08
0.1
0.12
0.14
0.16
0
20
40
60
80
100
120
140
160
2010 2011 2012 2013 2014 2015 2016 2017YTD
Qu
art
erl
y D
ivid
en
d p
er
sh
are
Sh
are
s o
uts
tan
din
g (
mil
lio
ns)
# Shares outstanding Quarterly Dividend per share
$1 billion returned to shareholders
Returned to shareholders since November 2010
Dividend $371 million
Normal course issuer bids (NCIB)
$678 million
Total >$1 billion1
1 Current as of the nine months ended September 30th 2017

71 TSE: WJA
Strong balance sheet
1.22 1.36 1.29
1.93 1.84
2013 2014 2015 2016 2017 YTD
1 Non-GAAP measure 2 Trailing 12 months earnings before interest, taxes, depreciation, and aircraft rent and other items (EBITDAR)
Adjusted Net Debt/EBITDAR1,2

72 TSE: WJA
Significant liquidity
34% 34%
29%
37%
33%
2013 2014 2015 2016 2017 YTD
1 Non-GAAP measure 2 Trailing 12 months revenue
Cash to TTM Revenue1,2
Cash, cash equivalents and marketable securities balance at Sept 2017 $1.5 billion
Undrawn revolving credit facility of $300 million

73 TSE: WJA
Growing unencumbered aircraft1
2 9
28
46 51
58
77
92 96
2013 2014 2015 2016 2017YTD
2017F 2018F 2019F 2020F
1 The number of growing unencumbered aircraft assumes (i) WestJet’s existing fleet, (ii) the terms of agreements WestJet has entered into with respect to future confirmed aircraft acquisitions as at the date of this presentation, (iii) repayment of existing secured long-term debt facilities as scheduled, and (iv) WestJet’s continued ability to access unsecured financing alternatives

74 TSE: WJA
The only Canadian airline with investment grade credit ratings
BBB+
BBB- BBB-
BB+
BB- BB- BB- BB- BB- BB- BB-
SOUTHWEST AIRLINESCO
WESTJET AIRLINES LTD DELTA AIR LINES INC ALASKA AIR GROUP INC UNITED CONTINENTALHOLDINGS
JETBLUE AIRWAYS CORP SPIRIT AIRLINES INC ALLEGIANT TRAVEL CO AMERICAN AIRLINESGROUP INC
AIR CANADA HAWAIIAN HOLDINGSINC
A3
Baa2
Baa3
Ba1
Ba2
Ba3 Ba3 Ba3
B1
SOUTHWESTAIRLINES CO
WESTJETAIRLINES LTD
DELTA AIRLINES INC
JETBLUEAIRWAYS CORP
UNITEDCONTINENTAL
HOLDINGS
ALLEGIANTTRAVEL CO
AMERICANAIRLINES
GROUP INC
AIR CANADA HAWAIIANHOLDINGS INC
Investment Grade Investment Grade
Source: Bloomberg, as of October 30, 2017

75 TSE: WJA
153 167
265
2016 2017F 2018F 2019F 2020F 2021-22F 2023-27F
Committed fleet Cumulative lease extensions and purchase options
Flexible fleet plan1
737 MAX
787
767
1 The flexible fleet plan as at the date of this presentation is based on (i) WestJet’s existing fleet, (ii) the terms of agreements WestJet has entered into with respect to future confirmed aircraft acquisitions and purchase options, (iii) the terms of agreements WestJet has entered into with lessors with respect to leased aircraft, and (iv) WestJet’s future decisions with respect to the renewal of leases and the exercise of purchase options and its ability to do so.
737

76 TSE: WJA
9.3%
6.8%
Significant cost and EBT Margin advantage
1 Non-GAAP Measure 2 As reported in Q4 2016 and YTD Q3 2017 external financial statements, unadjusted 3 TTM = Trailing 12 months
TTM CASM (ex-fuel, PS)1,2,3 TTM EBT Margin2,3
~11.3 cents
~9.8 cents

77 TSE: WJA
Key cost reduction initiatives
$140 – $200M Annual cost savings opportunity through 2022
Sales & distribution
Digital & self-serve
737 MAX
Fleet reconfiguration
Optimized maintenance plan
Airport operations
Continuous improvement
(LEAN) 737 MAX
Note: Based on internal estimates

78 TSE: WJA
~11.3 cents
~9.8 cents
6.0 cents4
Air Canada WestJet Swoop
TTM CASM (ex-fuel, PS)1,2,3
Swoop creates a new cost frontier
>30%
1 Non-GAAP Measure 2 As reported in Q4 2016 and YTD Q3 2017 external financial statements, unadjusted 3 TTM = Trailing 12 months 4 CASM (ex-fuel, PS) at full fleet of 10 aircraft and adjusted to stage length of 1,250 miles
Swoop CASM will be >30% below our already low CASM (ex-fuel, PS)

79 TSE: WJA
Capital Expenditures peak in 20191,2
1 2018: FX 1.29, 2019: FX 1.30, 2020: FX 1.32 2 Forward-looking information is based on current forecast and strategy and assumptions related to demand, fuel price, foreign exchange, maintenance, agreements, aircraft commitments and bookings
~$815M
~$515M
~$820M
~$655M
~$ 1 billion
~$780 million
~$1 billion
~$870 million
2017F 2018F 2019F 2020F
Aircraft & Aircraft related Maintenance Other
~$230M
~$160M
~$125M
~$90M
~$65M
~$35M
~$40M
~$135M

80 TSE: WJA
Strong Operating Margin and significant Free Cash Flow
1 Assumes moderate annual 2% GDP growth, 2018: FX 1.29, CPL 0.67, 2019: FX 1.30, CPL 0.68 cents, 2020: FX 1.32, CPL 0.68 cents 2 Forward-looking information is based on current forecast and strategy and assumptions related to demand, fuel price, foreign exchange, maintenance, agreements, aircraft commitments and bookings 3 Free cash flow calculated as operating cash flow less capital expenditures
2015-2017 YTD 2018 - 2020
Cumulative Free Cash Flow1,2,3
2018 - 2020
2013-2017 YTD
Operating Margin1,2
$775-$875 million
10% - 14%
10% - 14% ($104 million)
2018-2020F
2018-2022F

81 TSE: WJA
2013 2014 2015 2016 2017 YTD 2018F 2019F 2020F
ROIC returns to target range
ROIC target range 13%-16%1,2
1 Non-GAAP Measure 2 Forward-looking information is based on current forecast and strategy and assumptions related to demand, fuel price, foreign exchange, maintenance, agreements, aircraft commitments and bookings

82 TSE: WJA
2013 2014 2015 2016 2017 YTD 2018F 2019F 2020F
Key credit metric declines to 1.2 in 2020
1.2
1 Trailing 12 months earnings before interest, taxes, depreciation, and aircraft rent and other items (EBITDAR) 2 Forward-looking information is based on current forecast and strategy and assumptions related to demand, fuel price, foreign exchange, maintenance, agreements, aircraft commitments and bookings
Adjusted Net Debt/EBITDAR1,2

• Click to edit Master text styles - Second level
• Third level ≫ Fourth level
Click to edit Master title style
83 TSE: WJA 83 TSE: WJA
Committed to enhancing shareholder value

Closing Remarks
Gregg Saretsky President & CEO

• Click to edit Master text styles - Second level
• Third level ≫ Fourth level
Click to edit Master title style
85 TSE: WJA 85 TSE: WJA
Focused on sustainable, profitable growth
Competitive cost structure
ROIC growth; sustainable capex
787 preparation Swoop success Premium segment growth
Successful execution

TSE: WJA 86
Q&A

TSE: WJA 87
Appendix

88 TSE: WJA
Accounting standards change
IFRS 15 – Revenue from Contracts with Customers
• The revised IFRS standard will replace existing revenue recognition guidance and is effective January 1, 2018 for annual and interim reporting periods. We will adopt this standard using the full retrospective approach on the required effective date.
• We anticipate a change in the timing of the recognition of breakage on certain ticket sales which we believe will shorten our period of revenue deferral.
• We anticipate that the majority of our ancillary services will no longer be considered distinct from our guest’s associated flight, and therefore, will be presented within Guest revenue whereas today it is presented within Other revenue. Additionally, the timing of recognition of certain ancillary fees will be deferred until the flight occurs. We anticipate this will predominantly impact change and cancel fees which are currently recognized at the date of the ticket change.
• We will continue to defer the revenue related to WestJet rewards issued to guests. The allocation methodology of how we apportion the airfare between the flight segments and WestJet rewards will change. Upon implementation, we anticipate that tier status will be considered a marketing expense therefore no revenue will be deferred related to the guest benefits associated with tier status.
• We are finalizing our work on the impact on our co-brand credit card program, the quantitative impact of all the anticipated changes and drafting illustrative disclosures to our quarterly and annual 2018 financial statements.
The impact of this change is not incorporated into WestJet’s 2017 Investor Day projections

89 TSE: WJA
Accounting standards change
IFRS 16 - Leases
• The revised IFRS standard will replace the existing lease standard and is effective for annual and interim reporting periods beginning on or after January 1, 2019. We will adopt this standard on the effective date.
• This standard eliminates the classification of leases as either operating leases or finance leases for a lessee, and instead, all leases are capitalized by recognizing the present value of lease payments and presenting them as either lease assets or together with property and equipment.
• It also allows for the service component of a lease agreement to be separated from the value of the asset and thus not reported on the statement of financial position.
• We have initiated a scoping exercise to identify the potential number and types of contracts that may contain leases.
The impact of this change is not incorporated into WestJet’s 2017 Investor Day projections

• Click to edit Master text styles - Second level
• Third level ≫ Fourth level
Click to edit Master title style
90 TSE: WJA 90 TSE: WJA
Annual assumptions
2018 2019 2020
GDP Canada Approximately 2%
Foreign exchange ($CAD/$USD)
1.29 1.30 1.32
Average jet fuel price ($CAD cents per litre)
67 68 68

91 TSE: WJA
Financial information
Financial information contained in this section of the presentation has been derived from the historical consolidated financial statements of WestJet for the applicable period’s noted WestJet’s consolidated financial statements are prepared in accordance with generally accepted accounting principles in Canada (“GAAP”) as set out in the CPA Canada Handbook – Accounting (“CPA Handbook”), which incorporates Financial Reporting Standards (“IFRS”) as issued by the International Accounting Standards Board (“IASB”). The forward looking financial information in this presentation is based upon the accounting policies and assumptions in effect as of September 30th 2017 and does not reflect the impact of any accounting standards changes that may be applicable to WestJet’s financial statements in the future
Note: All references to dollars contained in the presentation refer to Canadian Dollars (CAD), unless otherwise noted

92 TSE: WJA
Non-GAAP Financial Measures
Adjusted debt: The sum of long-term debt and off-balance-sheet aircraft operating leases. Our practice, consistent with common airline industry practice, is to multiply the trailing 12 months of aircraft leasing expense by 7.5 to derive a present value debt equivalent. This measure is used in the calculation of adjusted debt-to-equity and adjusted net debt to EBITDAR, as defined below. Adjusted net debt: Adjusted debt less cash and cash equivalents. This measure is used in the calculation of adjusted net debt to EBITDAR, as defined below. EBITDAR: Earnings before net finance costs, taxes, depreciation, amortization, aircraft rent and other items, such as asset impairments, gains and losses on derivatives, and foreign exchange gains or losses. Trailing 12 months EBITDAR is a measure commonly used in the airline industry to evaluate results by excluding differences in the method by which an airline finances its aircraft. Cash to trailing 12 months revenue: Cash as a percentage of the trailing twelve months’ revenue is a measure commonly used in the airline industry to compare liquidity positions, adjusting for seasonality that may occur within a financial year.
The following non-GAAP and additional GAAP measures are used to monitor our financial performance:

93 TSE: WJA
Non-GAAP Financial Measures (continued)
Return on invested capital: ROIC is a measure commonly used in the airline industry to assess the efficiency with which a company allocates its capital to generate returns. Return is calculated based on our earnings before tax, excluding special items, finance costs and implied interest on our off-balance-sheet aircraft leases. Invested capital includes average long-term debt, average finance lease obligations, average shareholders’ equity and off-balance-sheet aircraft operating leases. Free cash flow: Operating cash flow less capital expenditures. This measure is used to calculate the amount of cash available that can be used to pursue other opportunities after maintaining and expanding the asset base Cash to trailing 12 months revenue: Cash as a percentage of the trailing twelve months’ revenue is a measure commonly used in the airline industry to compare liquidity positions, adjusting for seasonality that may occur within a financial year. CASM, excluding fuel and employee profit share: CASM is a common measure used in the airline industry to measure an airline’s cost structure and efficiency. We exclude the effects of aircraft fuel expense and employee profit share expense to assess the operating performance of our business. Fuel expense is excluded from our operating results because fuel prices are affected by a host of factors outside our control. Additionally, employee profit share expense is excluded as it varies based on the outcome of our net earnings. Excluding these expenses allows us to analyze our operating results to those of other airlines.