Embed Size (px)
Citation preview

Investor PresentationFebruary 2011
1
Cloud Peak Energy Inc. Financial Data
Cloud Peak Energy Inc. is the sole owner of Cloud Peak Energy Resources LLC. Unless expressly stated otherwise in this presentation, all financial data included herein is consolidated financial data of Cloud Peak Energy Inc.
Cautionary Note Regarding Forward-Looking Statements
This presentation contains “forward-looking statements” within the meaning of the safe harbor provisions of Section 27A of the Securities Act of 1933 and Section 21E of the Securities Exchange Act of 1934. Forward-looking statements are not statements of historical facts, and often contain words such as “may,” “will,” “expect,” “believe,” “anticipate,” “plan,” “estimate,” “seek,” “could,” “should,” “intend,” “potential,” or words of similar meaning. Forward-looking statements are based on management’s current expectations or beliefs, as well as assumptions and estimates regarding our company, industry, economic conditions, government regulations and other factors. These statements are subject to significant risks, uncertainties and assumptions that are difficult to predict and could cause actual results to differ materially from those expressed or implied in the forward-looking statements. For a description of some of the risks and uncertainties that may adversely affect our future results, refer to the risk factors described from time to time in the reports and registration statements we file with the Securities and Exchange Commission, including those in Item 1A "Risk Factors" of our most recent Form 10-K and any updates thereto in our Forms 10-Q and current reports on Forms 8-K. There may be other risks and uncertainties that are not currently known to us or that we currently believe are not material. We make forward-looking statements based on currently available information, and we assume no obligation to, and expressly disclaim any obligation to, update or revise publicly any forward-looking statements made in our presentation, whether as a result of new information, future events or otherwise, except as required by law.
Non-GAAP Financial Measures
This presentation includes the non-GAAP financial measures of (1) Adjusted EBITDA and (2) Adjusted Earnings Per Share (“Adjusted EPS”). Adjusted EBITDA and Adjusted EPS are intended to provide additional information only and do not have any standard meaning prescribed by generally accepted accounting principles in the U.S., or GAAP. A quantitative reconciliation of Adjusted EBITDA to income from continuing operations and Adjusted EPS to EPS (as defined below) is found in the tables accompanying this presentation. EBITDA represents income from continuing operations before (1) interest income (expense) net, (2) income tax provision, (3) depreciation and depletion, (4) amortization, and (5) accretion. Adjusted EBITDA represents EBITDA as further adjusted to exclude specifically identified items that management believes do not directly reflect our core operations. For the periods presented in this presentation, the specifically identified items are the income statement impacts of: (1) the tax agreement and (2) our significant broker contract that expired in the first quarter of 2010. Adjusted EPS represents diluted earnings (loss) per share from continuing operations attributable to controlling interest (“EPS”), adjusted to exclude the estimated per share impact of the same specifically identified items used to calculate Adjusted EBITDA and described above.
Adjusted EBITDA is an additional tool intended to assist our management in comparing our performance on a consistent basis for purposes of business decision-making by removing the impact of certain items that management believes do not directly reflect our core operations. Adjusted EBITDA is a metric intended to assist management in evaluating operating performance, comparing performance across periods, planning and forecasting future business operations and helping determine levels of operating and capital investments. Period-to- period comparisons of Adjusted EBITDA are intended to help our management identify and assess additional trends potentially impacting our company that may not be shown solely by period-to-period comparisons of income from continuing operations. Adjusted EBITDA may also be used as part of our incentive compensation program for our executive officers and others.
We believe Adjusted EBITDA and Adjusted EPS are also useful to investors, analysts and other external users of our consolidated financial statements in evaluating our operating performance from period to period and comparing our performance to similar operating results of other relevant companies. Adjusted EBITDA allows investors to measure a company's operating performance without regard to items such as interest expense, taxes, depreciation and depletion, amortization and accretion and other specifically identified items that are not considered to directly reflect our core operations. Similarly, we believe Adjusted EPS provides an appropriate measure to use in assessing our performance across periods given that this measure provides an adjustment for certain specifically identified significant items that are not considered to directly reflect our core operations, the magnitude of which may vary drastically from period to period and, thereby, have a disproportionate effect on the earnings per share reported for a given period.
Our management recognizes that using Adjusted EBITDA and Adjusted EPS as performance measures has inherent limitations as compared to income from continuing operations, EPS or other GAAP financial measures, as these non-GAAP measures exclude certain items, including items that are recurring in nature, which may be meaningful to investors. Adjusted EBITDA and Adjusted EPS should not be considered in isolation and do not purport to be alternatives to income from continuing operations, EPS or other GAAP financial measures as a measure of our operating performance. Because not all companies use identical calculations, our presentations of Adjusted EBITDA and Adjusted EPS may not be comparable to other similarly titled measures of other companies. Moreover, our presentation of Adjusted EBITDA is different than EBITDA as defined in our debt financing agreements.

222
Cloud Peak Energy Profile
NYSE: CLD (2/18/11) $22.02
Market Capitalization (2/18/11) ~$1.3 billion
Total Available Liquidity (12/31/10) ~$730 million
2010 Revenue ~$1.4 billion
Senior Debt (B1/BB-) $600 million
Market and Financial Overview
Company OverviewThird largest U.S. coal producer
2010 coal production of 93.8 million tons
2010 proven & probable reserves of 970 million tons
Only pure-play PRB coal company
Headquartered in Gillette, WY
Employs approximately 1,500 people
$119$160
$207
$321 $323
0
50100
150
200
250300
350
2006 2007 2008 2009 2010
(in m
illio
ns)
Adjusted EBITDA1
1 Reconciliation tables for adjusted EBITDA are included in the Appendix

33
Low-Risk Surface Operations
3
Highly productive, non-unionized workforce at all company-operated mines
Proportionately low, long-term operational liabilities
Surface mining reduces liabilities and allows for high-quality reclamation
No Surface Mining Control & Reclamation Act environmental violations since October 2002

4
0.210.50 0.58
0.931.21 1.34
1.682.07 2.18
2.46
3.35 3.37 3.43 3.56 3.623.86 3.99 4.04 4.12
4.95
5.595.86
6.15
6.57
7.90
Peter K
iewit S
ons
NACCO Indu
stries
Cloud Pea
k Ene
rgy
Energy
Future
Holding
s
Arch C
oal In
c
Westmore
land C
oal
BHP Billiton
Peabo
dy E
nergy
Charle
s C U
ngure
an
Conso
l Ene
rgy
Pacific
Mine
rals
Chevro
n
James
O Bunn
James
Rive
r Coa
l
Alpha N
atural
J Cliff
ord Fo
rrest
IIIPatr
iot C
oal
Intern
ation
al Coa
l
Kenne
th W W
oodri
ng
Walter E
nergy
Coalfie
ld Tran
sport
Masse
y Ene
rgy
Allianc
e Res
ource
s
Robert
E Murr
ay
Black H
ills C
orp
444
Top 25 Coal Producing Companies - 2010 Preliminary Incident Rates (MSHA)
Source: MSHA.Note: Total Incident Rate = (total number of employee incidents x 200,000) / total man-hours.(1) Cloud Peak Energy has combined Kiewit and Level III Communications data as reported by MSHA.
Good Safety Record Indicates Well Run Operations
A portion of all employees’ bonuses are tied to safety
5
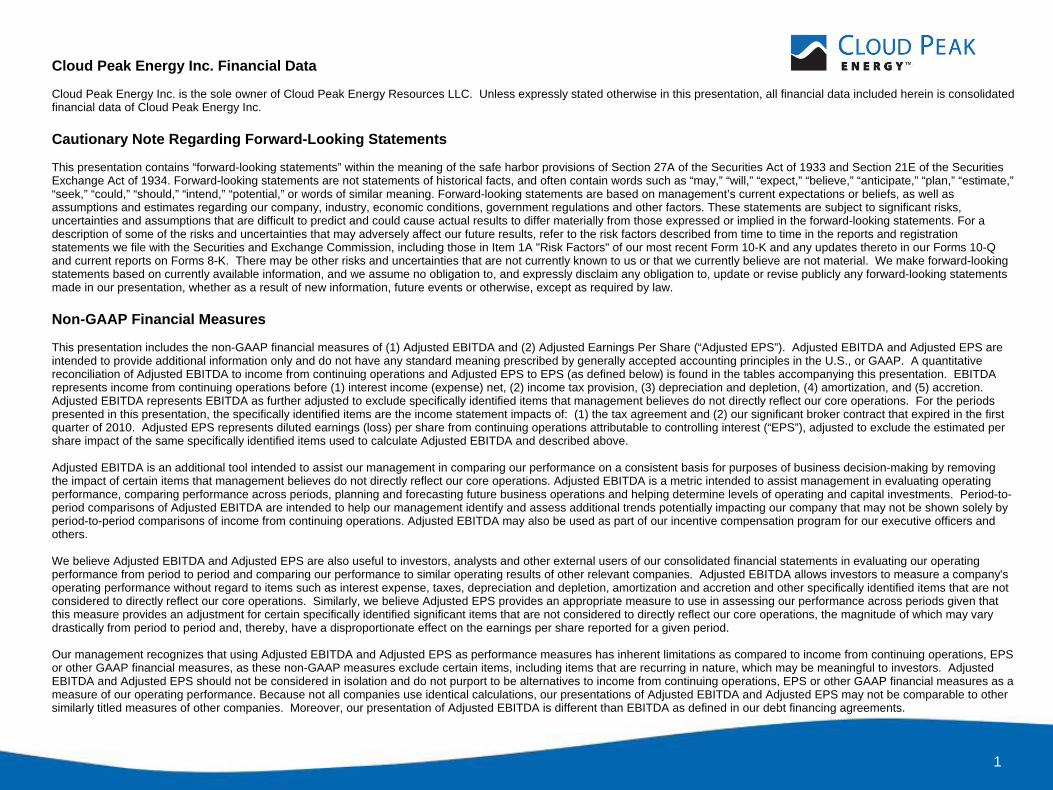
PRB Has Extensive Coal ReservesSpring Creek Mine
2010 Tons Sold 19.3M tons2010 Proven & Probable Reserves 329M tonsReserve Coal Quality 9,350 Btu/lb
Antelope Mine2010 Tons Sold 35.9M tons2010 Proven & Probable Reserves 252M tonsReserve Coal Quality 8,850 Btu/lb
Cordero Rojo Mine2010 Tons Sold 38.6M tons2010 Proven & Probable Reserves 385M tonsReserve Coal Quality 8,425Btu/lb
5
0 100 mi
Legend

6
Historic U.S. Coal Supply by Region
Nuclear 20%
Coal 45%
Natural Gas 24%
Hydro‐electric
Conventional 6%
Other Energy Sources4%
Petroleum 1%
(million tons)
Other basins – down 14%
CAPP – down 39%
NAPP – down 21%
IB – down 24%
PRB - up 137%
6
U.S. Power Generation by Fuel Source (LTM)
Source: EIA Electric Power Monthly (November 2010).
Total U.S. Coal Supply up 6% since 1990
1990 1995 2000 2005 2010 est
PRB CAPP NAPP ILL B Other
Other basins – down 14%
CAPP – down 39%
NAPP – down 21%
Illinois Basin – down 24%
PRB - up 137%
Source: MSHA/PIRA

777
Reach of PRB Coal is Growing
7
Large reserve base
Low-cost coal supply
Surface mining
More supportive local environment for coal mining
Low sulfur content
Ample rail capacity
Source: SNL

8
0
100
200
300
400
500
600
700
2000
2002
2004
2006
2008
2010
2012
2014
2016
2018
2020
2022
2024
Tons
MM
mt
Japan S.Korea Taiwan ChinaHong Kong India Malaysia Other Asia
Pacific Rim Thermal Coal Import Demand
Source: PIRA
Pacific Rim thermal import demand has experienced strong growth and it is forecasted to continue
Over the last 10 years, China went from net exporter to net importer
India imports increased by 80 million mt over last 10 years
Pacific Rim thermal demand is forecasted to grow by one billion mt over next 10 years and imports are forecasted to supply 100 million mt of this growth

999
Increasing International Demand Supports Powder River Basin Pricing
2010 U.S. exports up 36% (60M tons 2009 to 81M tons 2010)
2011 exports approximate 80M –85M tons
Sources: PIRA –
PIRA
Energy Group
DTC – Doyle Trading Consultants

10
Spring Creek – Export Quality Advantage
Spring Creek Mine - Montana
Coal quality - 9,350 Btu
Converts to 4,850 Kcal/kg NAR
Is a premium sub-bituminous coal in the international market.
10
Desired Calorific Values (CV) by South Korean Utilities Between 3700 - 5000 Kcal/kg NAR
3700 3900 4100 4300 4500 4700 4900
Indonesian Coal
Typical PRB 8800 BtuCoal
Spring Creek Mine 9350Btu Coal
Kcal/kg NAR
4850
4544
Average
Source: Company estimates

11
Spring Creek - Geographic Advantage Spring Creek Mine to Westshore ~1,600 miles, approx 200 miles closer than SPRB

121212
Export Driven Production Growth
Manage production to meet demand
Exports to Asia growing as a percent of total production
Production at Company Operated Mines (in million tons)
90.792.8
89.3 90.5 ~ 90.5
~ 4.0 0.9 3.3
1.6
2007 2008 2009 2010 2011E
93.7
90.7
93.8
90.9
~ 94.5
Asian ExportsDomestic Delivery

1313
$12.00
$13.00
$14.00
$15.00
$16.00
$17.00
2011 2012 2013 2014
Q4-09 Q1-10 Q2-10 Q3-10 Q4-10 2/18/2011
Powder River Basin Forward Coal Prices U.S. PRB 8800 Coal Price (per ton)
Source: ICAP plc
13

14
Strong Contracted Position with Upside Potential
(Tons in millions)
(1) Includes production from company operated mines.
2011 estimated average realized price per ton: $13.05(assuming $14.40/ton for 8800 Btu and $12.20/ton for 8400 Btu for indexed sales)
2012 has 56 million tons committed @ $13.08
Contracted Coal - Total Committed Tons (as of 2/18/11)(1)
8756
~14
~7.5 ~70
~94.5
2011E 2012E
Committed tonswith variable pricingCommitted tonswith fixed pricing

15
Strategy for Growth Demonstrated outstanding operating metrics
Tightly managed cost structure
Optimize investments in capital expenditures
Generating liquidity for growth opportunities
Build from Existing Foundation
Optimize Organic Growth
Seize Opportunities to Expand
Acquire additional reserves for future production
Customer demand drives production growth
Leverage Spring Creek’s advantageous export position
Target acquisition opportunities building on core strengths
Develop opportunities to increase high-margin exports to Asia

1616
Cloud Peak Energy Lease Acquisition Strategy
Antelope Mine Cordero Rojo Mine
Mine Pending LBA Expected Bid DateProjected Tonnage Applied For
Antelope West Antelope II(1) 2011 380M(2)
Cordero Rojo Maysdorf II 2011 – 2013 434M(3)
Source: Cloud Peak Energy management.Note: Acquired tonnage is not classified as reserve until verified with sufficient technical and economic analysis. Maps not to scale.1 Subject to pending legal challenges filed in 2010 against the BLM and the Secretary of the Interior by certain environmental groups.2 Based on BLM Record of Decision. BLM estimate adjusted for mining recovery. Allows access to additional 80 million tons of non-reserve coal deposits controlled by Antelope.3 Estimated tonnage for Maysdorf II as applied for. Final tract delineation and tonnage subject to possible significant reduction pending BLM review and determination of surface owner status.
1717
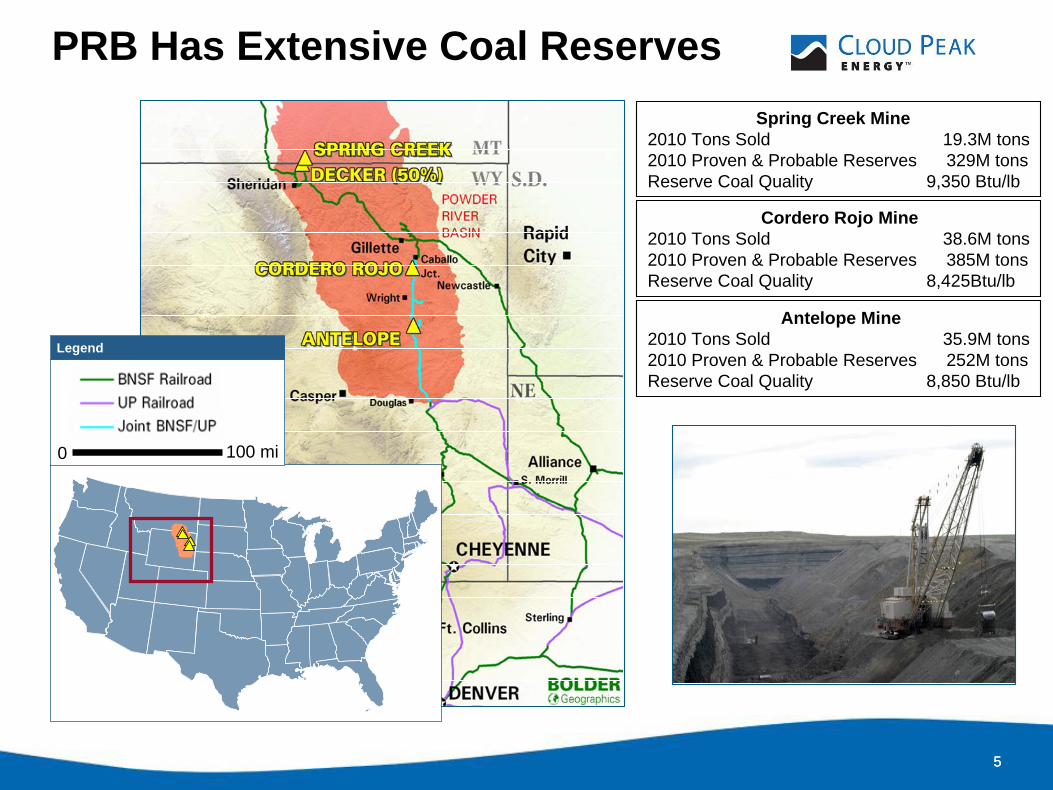
Liquidity for Growth
Unrestricted Cash $ 340
Revolver, net of Letters of Credit $ 390
Total Available Liquidity $ 730
Restricted Cash $ 182
$400M Revolver (Baa3- Rating) $ 0
8¼% Senior Notes due 2017 $ 300(B1 / BB- rating)
8½% Senior Notes due 2019 $ 300(B1 / BB- rating)
Total Senior Debt $ 600
Total Borrowed Debt / Adjusted EBITDA1 1.9x
Liquidity and Obligations(as of December 31, 2010)
17
($ in millions)
Positive Cash GenerationCash, Cash Equivalents and Restricted Cash
Unrestricted cash Restricted cash
($ in millions)
177218 218
182
268
255250
288 340
80
$506$468
$432
$348
$522
Q4‐2009 Q1‐2010 Q2‐2010 Q3‐2010 Q4‐2010
1 Reconciliation tables for adjusted EBITDA are included in the Appendix

181818
Looking Forward
(1)
Effectively sold for 2011 production at favorable prices
Indexed/unpriced sales provide opportunity for future pricing upside
Continued strong contribution from export sales
Strong balance sheet provides financial flexibility
Significant cash generation
Disciplined capital deployment
Proportionally low, long-term operational liabilities

1919
Appendices(Cloud Peak Energy Inc.)
19

202020
Updated Guidance – 2011 Estimates and 2010 Actuals
2011(estimated)
2010(actual)
1 Assumes prices of $14.40 per ton for 8800 Btu coal and $12.20 per ton for 8400 Btu coal applied to indexed tons2 Represents average Cost of Product Sold for produced coal for our three operated mines. 3 Includes capitalized interest.
Coal production for our three operated mines 93 – 96 million tons 93.8 million tons
Committed sales with fixed prices 87 million tons n/a
Anticipated realized price of produced coal1 Approximately $13.05 per ton $12.32 per ton
Average cost of produced coal 2 $8.80 - $9.40 per ton $8.57 per ton
Additional operating income $20 - $35 million n/a
Selling, general and administrative expenses $55 - $65 million $63.6 million
Interest expense $55 - $65 million $46.9 million
Depreciation, depletion, amortization and accretion $115 - $125 million $115.7 million
Effective income tax rate Approximately 35% 21.9%
Capital expenditures (excludes federal coal leases) 3 $100 - $140 million $91.6 million
Committed federal coal lease payments $63.8 million $63.8 million

2121
2010 Average Cost of Produced Coal1
1 Represents average Cost of Product Sold for produced coal for our three company-operated mines.
$8.57/ton for company-operated mines
44%
19%
14%
9%
6%4% 4%
Royalties and taxesLaborRepairs and maintenanceFuel and lubricantsExplosivesOutside servicesOther mining costs

222222
Statement of Operations Data (in millions, except per share amounts)
Revenues $ 1,370.8 $1,398.2 $1,239.7 $1,053.2 $ 942.8
Operating income 211.9 255.0 124.9 102.7 88.9
Income from continuing operations 117.2 182.5 88.3 53.8 40.5
Income (loss) from discontinued operations — 211.1 (25.2) (21.5) (2.6)
Net income 117.2 393.6 63.1 32.3 37.9
Amounts attributable to controlling interest:
Income from continuing operations 33.7 170.6 88.3 53.8 40.5
Income (loss) from discontinued operations — 211.1 (25.2) (21.5) (2.6)
Net income 33.7 381.7 63.1 32.3 37.9
Earnings per share – basic
Income from continuing operations $ 0.98 $ 3.01 $ 1.47 $ 0.90 $ 0.68
Income (loss) from discontinued operations $ — $ 3.73 $ (0.42) $ (0.36) $ (0.05)
Net income $ 0.98 $ 6.74 $ 1.05 $ 0.54 $ 0.63
Earnings per share attributed to controlling interest – diluted
Income from continuing operations $ 0.98 $ 2.97 $ 1.47 $ 0.90 $ 0.68
Income (loss) from discontinued operations $ — $ 3.52 $ (0.42) $ (0.36) $ (0.05)
Net income $ 0.98 $ 6.49 $ 1.05 $ 0.54 $ 0.63
Year Ended December 31,
2010 2009 2008 2007 2006
232323
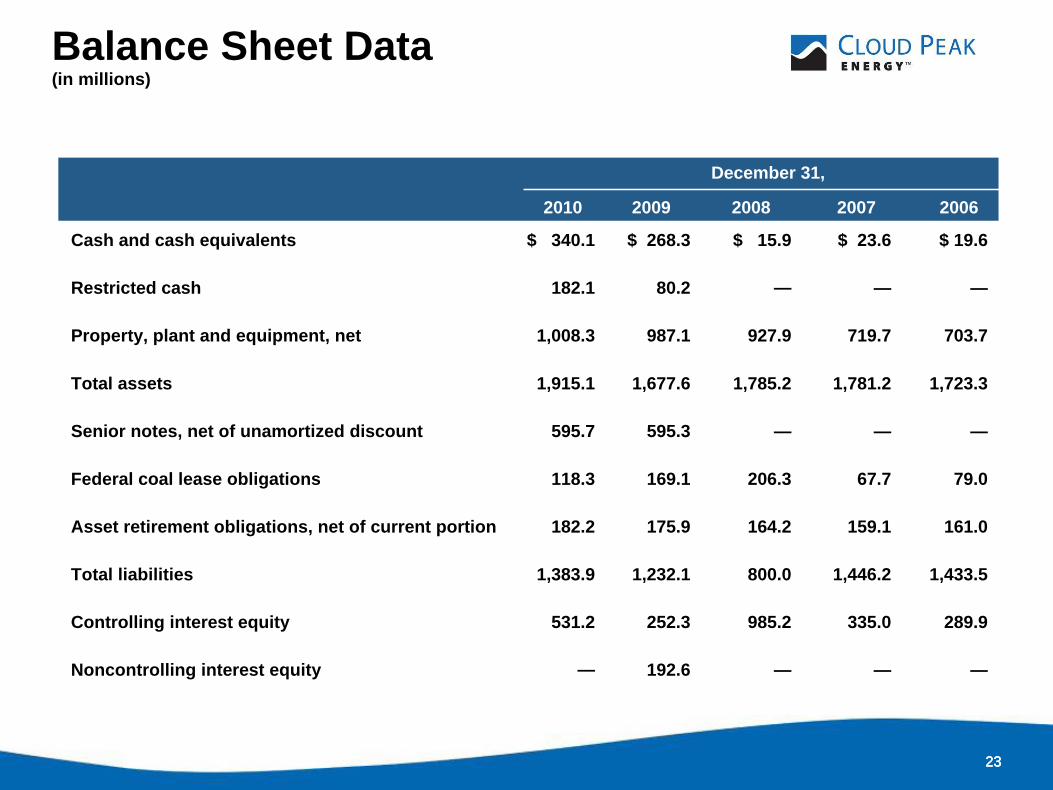
Balance Sheet Data (in millions)
Cash and cash equivalents $ 340.1 $ 268.3 $ 15.9 $ 23.6 $ 19.6
Restricted cash 182.1 80.2 — — —
Property, plant and equipment, net 1,008.3 987.1 927.9 719.7 703.7
Total assets 1,915.1 1,677.6 1,785.2 1,781.2 1,723.3
Senior notes, net of unamortized discount 595.7 595.3 — — —
Federal coal lease obligations 118.3 169.1 206.3 67.7 79.0
Asset retirement obligations, net of current portion 182.2 175.9 164.2 159.1 161.0
Total liabilities 1,383.9 1,232.1 800.0 1,446.2 1,433.5
Controlling interest equity 531.2 252.3 985.2 335.0 289.9
Noncontrolling interest equity — 192.6 — — —
December 31,
2010 2009 2008 2007 2006
242424
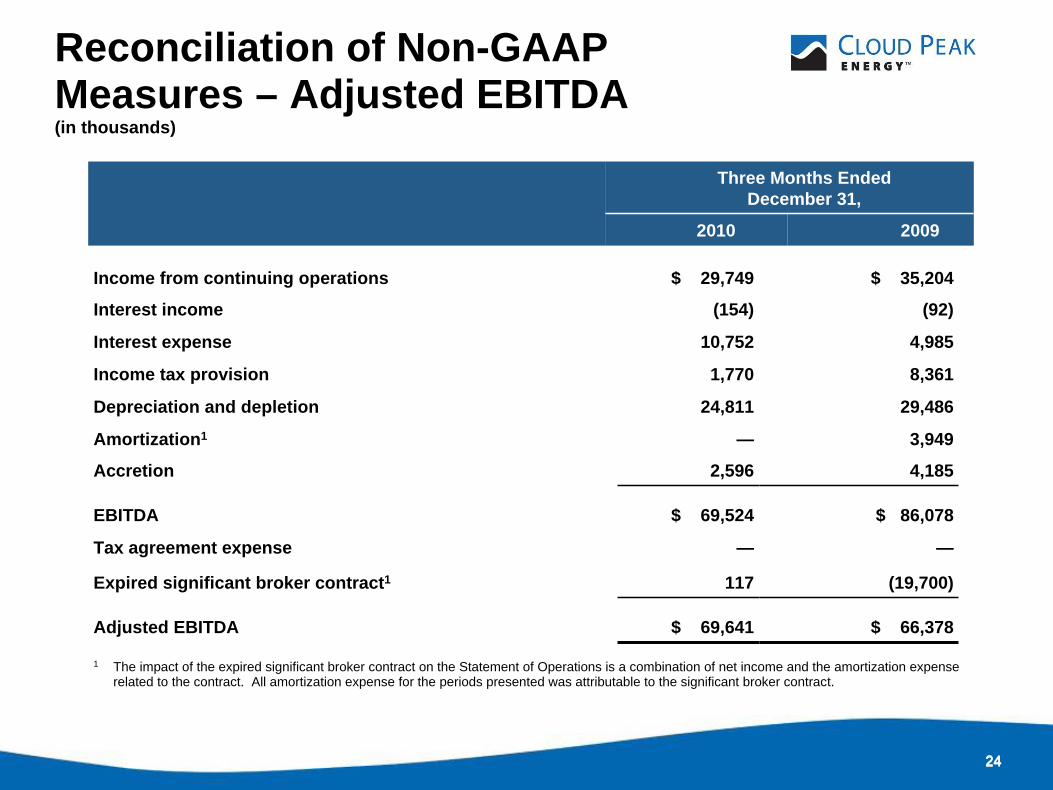
Reconciliation of Non-GAAP Measures – Adjusted EBITDA (in thousands)
Nine Months Ended September 30,
2010 2009
Income from continuing operations $ 29,749 $ 35,204
Interest income (154) (92)
Interest expense 10,752 4,985
Income tax provision 1,770 8,361
Depreciation and depletion 24,811 29,486
Amortization1 — 3,949
Accretion 2,596 4,185
EBITDA $ 69,524 $ 86,078
Tax agreement expense — —
Expired significant broker contract1 117 (19,700)
Adjusted EBITDA $ 69,641 $ 66,378
Three Months EndedDecember 31,
2010 2009
1 The impact of the expired significant broker contract on the Statement of Operations is a combination of net income and the amortization expense related to the contract. All amortization expense for the periods presented was attributable to the significant broker contract.
252525
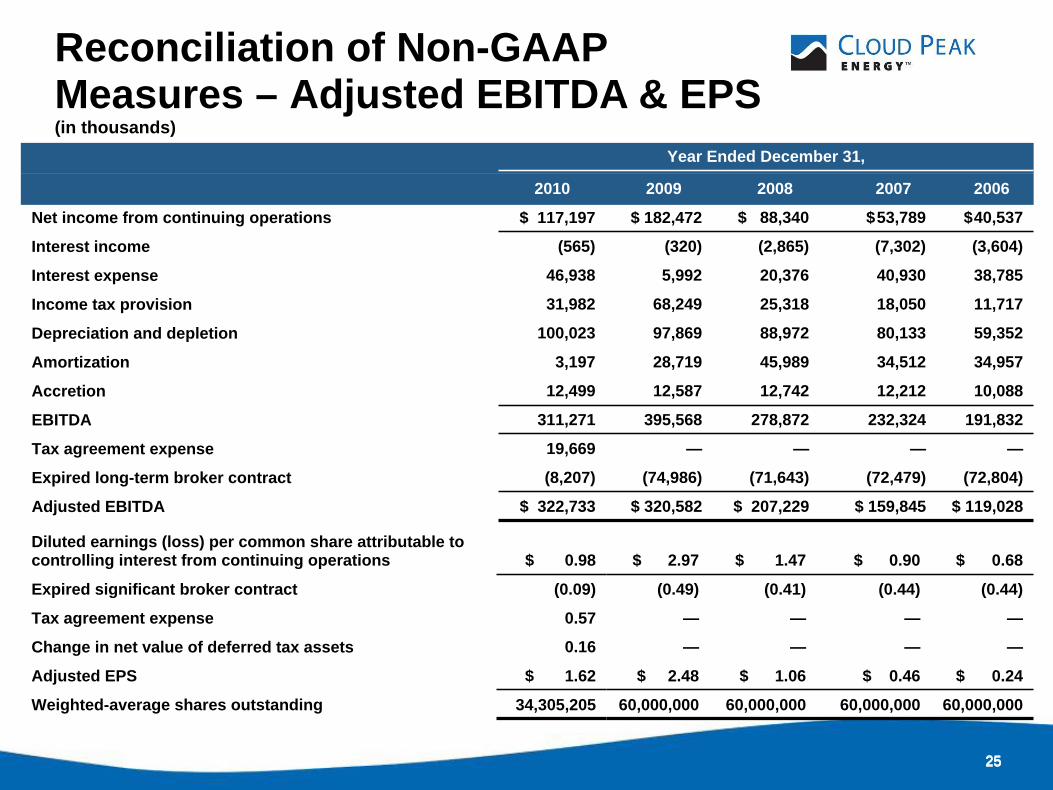
Reconciliation of Non-GAAP Measures – Adjusted EBITDA & EPS (in thousands)
Nine Months Ended September 30,
2010 2009
Year Ended December 31,
2010 2009 2008 2007 2006
Net income from continuing operations $ 117,197 $ 182,472 $ 88,340 $53,789 $40,537
Interest income (565) (320) (2,865) (7,302) (3,604)
Interest expense 46,938 5,992 20,376 40,930 38,785
Income tax provision 31,982 68,249 25,318 18,050 11,717
Depreciation and depletion 100,023 97,869 88,972 80,133 59,352
Amortization 3,197 28,719 45,989 34,512 34,957
Accretion 12,499 12,587 12,742 12,212 10,088
EBITDA 311,271 395,568 278,872 232,324 191,832
Tax agreement expense 19,669 — — — —
Expired long-term broker contract (8,207) (74,986) (71,643) (72,479) (72,804)
Adjusted EBITDA $ 322,733 $ 320,582 $ 207,229 $ 159,845 $ 119,028
Diluted earnings (loss) per common share attributable to controlling interest from continuing operations $ 0.98 $ 2.97 $ 1.47 $ 0.90 $ 0.68
Expired significant broker contract (0.09) (0.49) (0.41) (0.44) (0.44)
Tax agreement expense 0.57 — — — —
Change in net value of deferred tax assets 0.16 — — — —
Adjusted EPS $ 1.62 $ 2.48 $ 1.06 $ 0.46 $ 0.24
Weighted-average shares outstanding 34,305,205 60,000,000 60,000,000 60,000,000 60,000,000

262626
Reconciliation of Non-GAAP Measures – Adjusted EPS
Nine Months Ended September 30,
2010 2009
Diluted earnings (loss) per common share attributable to controlling interest from continuing operations $ 0.28 $ 0.50
Expired significant broker contract 0.01 (0.22)
Tax agreement expense ——
Change in net value of deferred tax assets1 — —
Adjusted EPS $ 0.29 $ 0.29
Diluted weighted-average shares outstanding 45,300,000 46,578,000
Three Months EndedDecember 31,
2010 2009
1 Related adjustments to our deferred tax assets, net of valuation allowance, as a result of the increase in tax agreement liability are recorded through income tax expense.

272727
Other Data
Tons produced1 (in millions) 23.4 23.0 93.8 91.0
Total tons sold (in millions) 24.1 25.6 96.9 103.3
Average revenue per ton1 $12.35 $11.30 $12.32 $11.79
Average cost of product sold per ton1 $9.05 $7. 95 $8.57 $7.94
1 Represents only the three company-operated mines
Three Months EndedDecember 31,
Year EndedDecember 31,
2010 2009 2010 2009

282828
Other Data (in millions)
Tons sold – company owned and operated mines 93.7 90.9 93.7 90.7 88.2
Total tons sold – Decker mine (50% share) 1.5 2.3 3.3 3.5 3.6
Tons sold from production 95.2 93.2 97.0 94.2 91.8
Tons purchased and resold 1.7 10.1 8.1 8.1 8.1
Total tons sold 96.9 103.3 105.1 102.3 99.9
Year Ended December 31,
2010 2009 2008 2007 2006