Embed Size (px)
Citation preview

Southwest Airlines Co.Investor Booklet – February 2020
Cautionary Statement Regarding Forward-Looking StatementsThis booklet contains forward-looking statements within the meaning of Section 27A of the Securities Act of 1933, as amended, and Section 21E of the Securities Exchange Act of 1934, as amended. Specific forward-looking statements include, without limitation, statements related to (i) the Company’s plans and expectations with respect to MAX-related flight schedule adjustments; (ii) the Company's financial outlook, goals, strategies, expectations, and projected results of operations; (iii) the expected amount and timing of the Company’s a ircraft deliveries, including the factors and assumptions underlying the Company’s plans and expectations, in particular assumptions regarding th e 737 MAX return to service; (iv) the Company’s fleet plans and expectations, including factors underlying the Company’s expectations; (v) the Company’s plans, opportunities, and expectations with respect to its reservation system; and (vi) the Company’s Vision. These forward-looking statements are based on the Company's current intent, expectations, and projections and are not guarantees of future performance. These statements involve risks, uncertainties, assumptions, and other factors that are difficult to predict and that could cause actual results to vary materially from those expressed in or indicated by them. Factors include, among others, ( i) the Company’s dependence on Boeing and the FAA with respect to the timing of the return of the 737 MAX to service and any related changes to the Company’s opera tional and financial assumptions and decisions; (ii) impact of governmental regulations and other actions, as well as consumer perceptio n, on consumer behavior; (iii) the Company's dependence on other third parties, in particular with respect to its technology plans and initiatives, and the impact on the Company’s operations of any third party delays or non -performance; (iv) the impact of economic conditions, fuel prices, actions of competitors (including without limitation pricing, scheduling, capacity, and network decisions, and consol idation and alliance activities), extreme or severe weather and natural disasters, fears of terrorism or war, and other factors beyond th e Company's control, on consumer behavior and the Company's business decisions, plans, strategies, and results; (v) the Company's ability to timely and effectively implement, transition, and maintain the necessary information technology systems and infrastructure to support it s operations and initiatives; and (vi) other factors, as described in the Company's filings with the Securities and Exchange Commission, including the detailed factors discussed under the heading "Risk Factors" in the Company's Annual Report on Form 10-K for the fiscal year ended December 31, 2019.
Notice Regarding Third Party ContentThis presentation may contain information obtained from third parties, including ratings from credit ratings agencies such as S&P Global Ratings. Reproduction and distribution of third party content in any form is prohibited except with the prior written permission of the related third party. Third party content providers do not guarantee the accuracy, completeness, timeliness or availability of any information, including ratings, and are not responsible for any errors or omissions (negligent or otherwise), regardless of the cause, or for the results obtained from the use of such content. THIRD PARTY CONTENT PROVIDERS GIVE NO EXPRESS OR IMPLIED WARRANTIES, INCLUDING, BUT NOT LIMITED TO, ANY WARRANTIES OF MERCHANTABILITY OR FITNESS FOR A PARTICULAR PURPOSE OR USE. THIRD PARTY CONTENT PROVIDERS SHALL NOT BE LIABLE FOR ANY DIRECT, INDIRECT, INCIDENTAL, EXEMPLARY, COMPENSATORY, PUNITIVE, SPECIAL OR CONSEQUENTIAL DAMAGES, COSTS, EXPENSES, LEGAL FEES, OR LOSSES (INCLUDING LOST INCOME OR PROFITS AND OPPORTUNITY COSTS OR LOSSES CAUSED BY NEGLIGENCE) IN CONNECTION WITH ANY USE OF THEIR CONTENT, INCLUDING RATINGS. Credit ratings are statements of opinions and are not statements of fact or recommendations to purchase, hold or sell securities. They do not address the suitability of securities or the suitability of securities for investment purposes, and should not be relied on as investment advice.
2
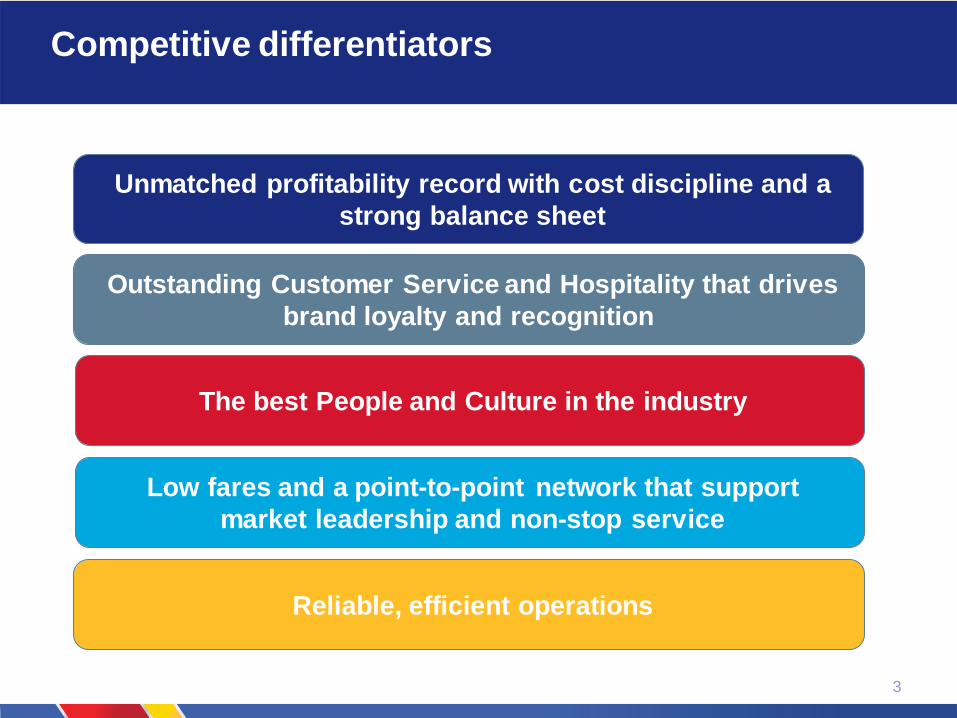
Competitive differentiators
3
Unmatched profitability record with cost discipline and a
strong balance sheet
Outstanding Customer Service and Hospitality that drives
brand loyalty and recognition
Low fares and a point-to-point network that support
market leadership and non-stop service
The best People and Culture in the industry
Reliable, efficient operations
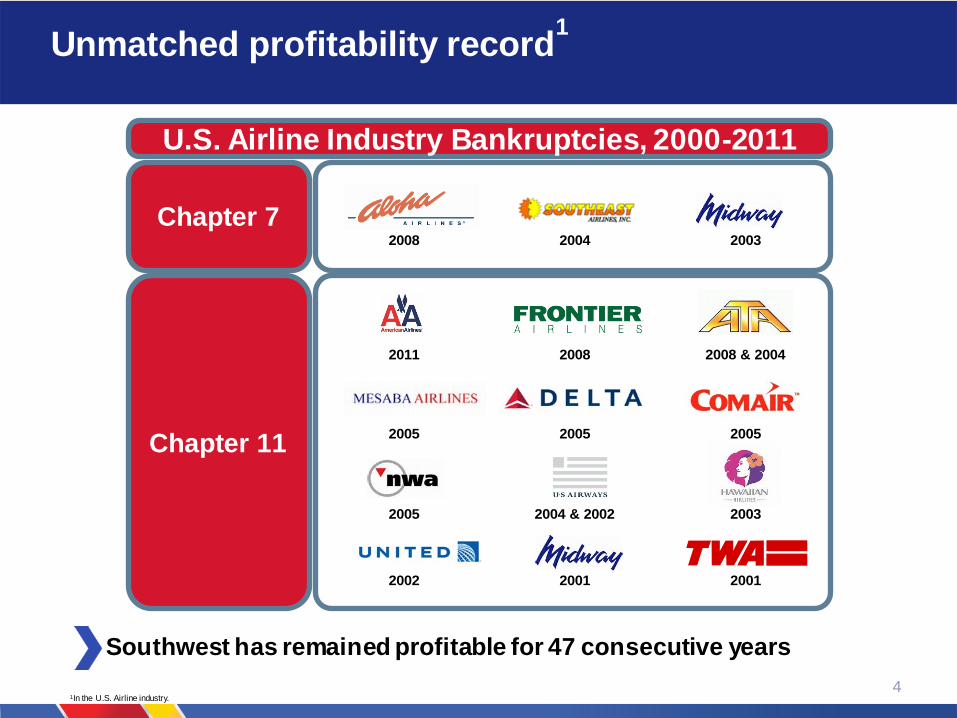
Unmatched profitability record1
4
Chapter 7
Chapter 11
U.S. Airline Industry Bankruptcies, 2000-2011
2005 2004 & 2002 2003
2002 2001 2001
2008 2004 2003
2011 2008 2008 & 2004
2005 2005 2005
1In the U.S. Airline industry.
Southwest has remained profitable for 47 consecutive years
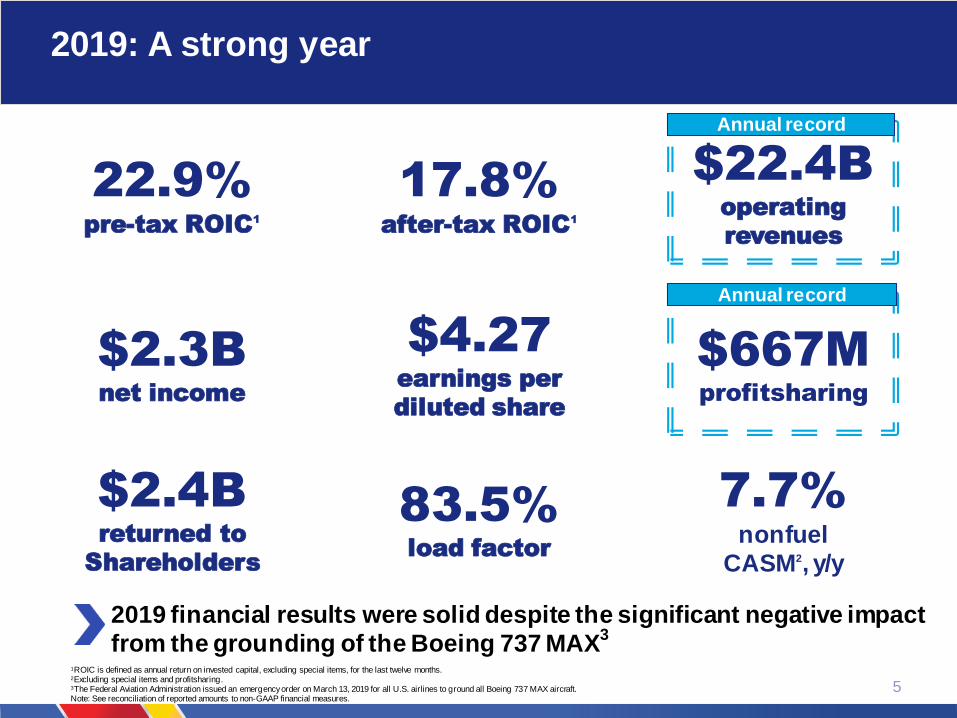
2019: A strong year
5
1ROIC is defined as annual return on invested capital, excluding special items, for the last twelve months.2Excluding special items and profitsharing. 3The Federal Aviation Administration issued an emergency order on March 13, 2019 for all U.S. airlines to ground all Boeing 737 MAX aircraft.Note: See reconciliation of reported amounts to non-GAAP financial measures.
2019 financial results were solid despite the significant negative impact
from the grounding of the Boeing 737 MAX3
22.9%pre-tax ROIC1
83.5% load factor
$2.3Bnet income
$2.4Breturned to
Shareholders
$667Mprofitsharing
7.7%nonfuel
CASM2, y/y
$4.27earnings per
diluted share
$22.4Boperating
revenues
17.8%after-tax ROIC1
Annual record
Annual record

737 MAX impact
6
The MAX grounding reduced operating income an estimated $828
million in 2019.
On February 13, 2020, based on continued uncertainty around the timing
of the MAX return to service, we proactively removed the MAX from our
flight schedule through August 10, 2020.
In fourth quarter 2019, we reached an agreement with Boeing on
compensation for 2019 damages. Discussions regarding damages past
2019 are ongoing.
The fourth quarter 2019 profitsharing accrual included a discretionary,
incremental $124 million contribution related to the Boeing agreement
for the 2019 MAX groundings.
Note: The Federal Aviation Administration issued an emergency order on March 13, 2019 for all U.S. airlines to ground all Boeing 737 MAX aircraft.
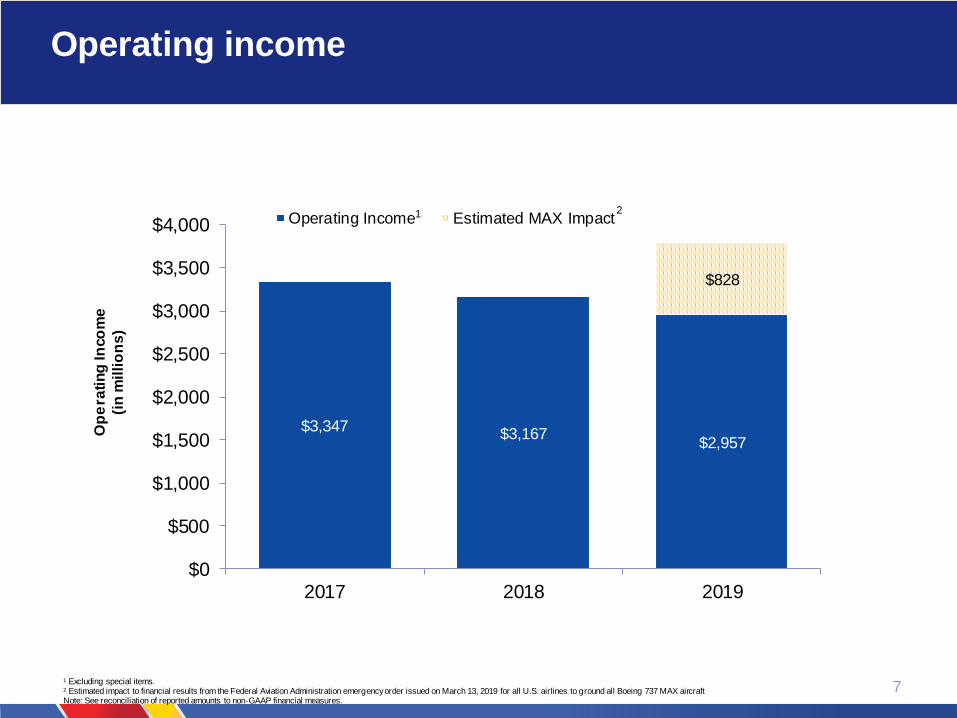
Operating income
7
Op
era
tin
g In
co
me
(in
mil
lio
ns
)
1 Excluding special items.2 Estimated impact to financial results from the Federal Aviation Administration emergency order issued on March 13, 2019 for all U.S. airlines to ground all Boeing 737 MAX aircraftNote: See reconciliation of reported amounts to non-GAAP financial measures.
$3,347$3,167
$2,957
$828
$0
$500
$1,000
$1,500
$2,000
$2,500
$3,000
$3,500
$4,000
2017 2018 2019
Operating Income Estimated MAX Impact21
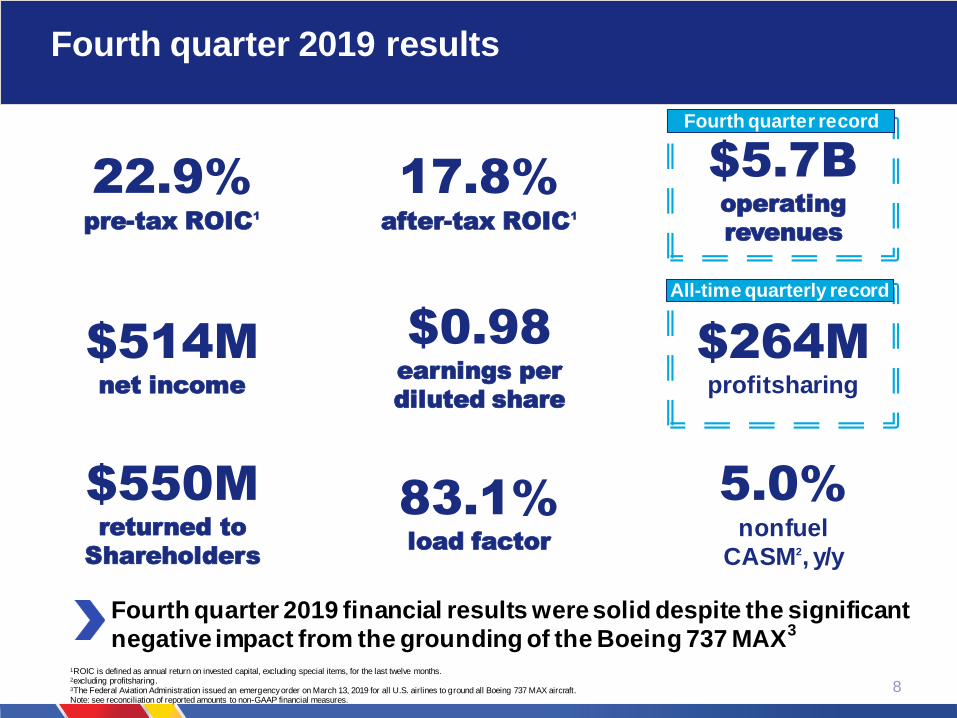
Fourth quarter 2019 results
8
1ROIC is defined as annual return on invested capital, excluding special items, for the last twelve months.2excluding profitsharing.3The Federal Aviation Administration issued an emergency order on March 13, 2019 for all U.S. airlines to ground all Boeing 737 MAX aircraft.Note: see reconciliation of reported amounts to non-GAAP financial measures.
Fourth quarter 2019 financial results were solid despite the significant
negative impact from the grounding of the Boeing 737 MAX3
22.9%pre-tax ROIC1
83.1% load factor
$514Mnet income
$550Mreturned to
Shareholders
$264Mprofitsharing
5.0%nonfuel
CASM2, y/y
$0.98earnings per
diluted share
$5.7Boperating
revenues
17.8%after-tax ROIC1
Fourth quarter record
All-time quarterly record
9
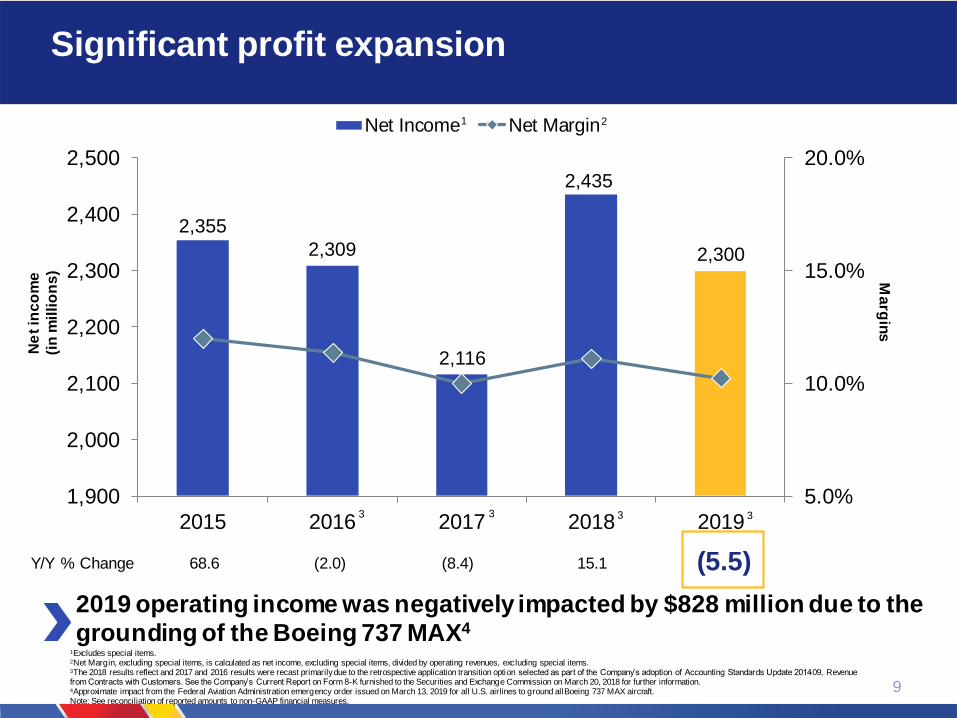
1Excludes special items.2Net Margin, excluding special items, is calculated as net income, excluding special items, divided by operating revenues, excluding special items.3The 2018 results reflect and 2017 and 2016 results were recast primarily due to the retrospective application transition option selected as part of the Company’s adoption of Accounting Standards Update 2014-09, Revenue from Contracts with Customers. See the Company’s Current Report on Form 8-K furnished to the Securities and Exchange Commission on March 20, 2018 for further information.4Approximate impact from the Federal Aviation Administration emergency order issued on March 13, 2019 for all U.S. airlines to ground all Boeing 737 MAX aircraft.Note: See reconciliation of reported amounts to non-GAAP financial measures.
2019 operating income was negatively impacted by $828 million due to the
grounding of the Boeing 737 MAX4
Significant profit expansion
2,355
2,309
2,116
2,435
2,300
5.0%
10.0%
15.0%
20.0%
1,900
2,000
2,100
2,200
2,300
2,400
2,500
2015 2016 2017 2018 2019
Net Income Net Margin
Y/Y % Change 68.6 (2.0) (8.4) 15.1
3 3 3
Ne
t in
co
me
(in
mil
lio
ns
)
Ma
rgin
s
3
(5.5)
1 2
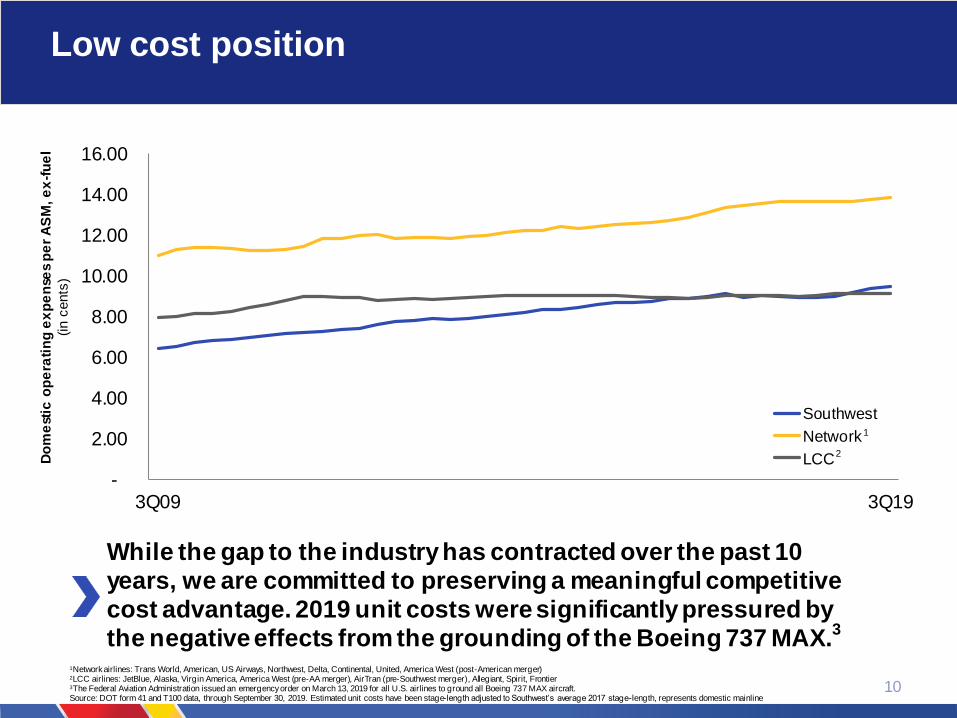
Low cost position
While the gap to the industry has contracted over the past 10
years, we are committed to preserving a meaningful competitive
cost advantage. 2019 unit costs were significantly pressured by
the negative effects from the grounding of the Boeing 737 MAX.3
1Network airlines: Trans World, American, US Airways, Northwest, Delta, Continental, United, America West (post-American merger)2LCC airlines: JetBlue, Alaska, Virgin America, America West (pre-AA merger), AirTran (pre-Southwest merger), Allegiant, Spirit, Frontier3The Federal Aviation Administration issued an emergency order on March 13, 2019 for all U.S. airlines to ground all Boeing 737 MAX aircraft.Source: DOT form 41 and T100 data, through September 30, 2019. Estimated unit costs have been stage-length adjusted to Southwest’s average 2017 stage-length, represents domestic mainline
1
2
Do
me
stic
op
era
tin
g e
xp
en
ses
pe
r A
SM
, e
x-f
ue
l
(in c
ents
)
10
-
2.00
4.00
6.00
8.00
10.00
12.00
14.00
16.00
3Q09 3Q19
Southwest
Network
LCC

Fleet modernization has been a significant
contributor to our cost control efforts
11
Aircraft by fleet typeYear end aircraft on property
Average seats per aircraft Year end average
The increase in the gauge of our aircraft drives down unit costs
and allows for efficient growth opportunities
665
704 723
706
750 747
2014 2015 2016 2017 2018 2019
717s Classics 700s 800s MAX 8
141
145 146
149
152 153 153
2013 2014 2015 2016 2017 2018 2019
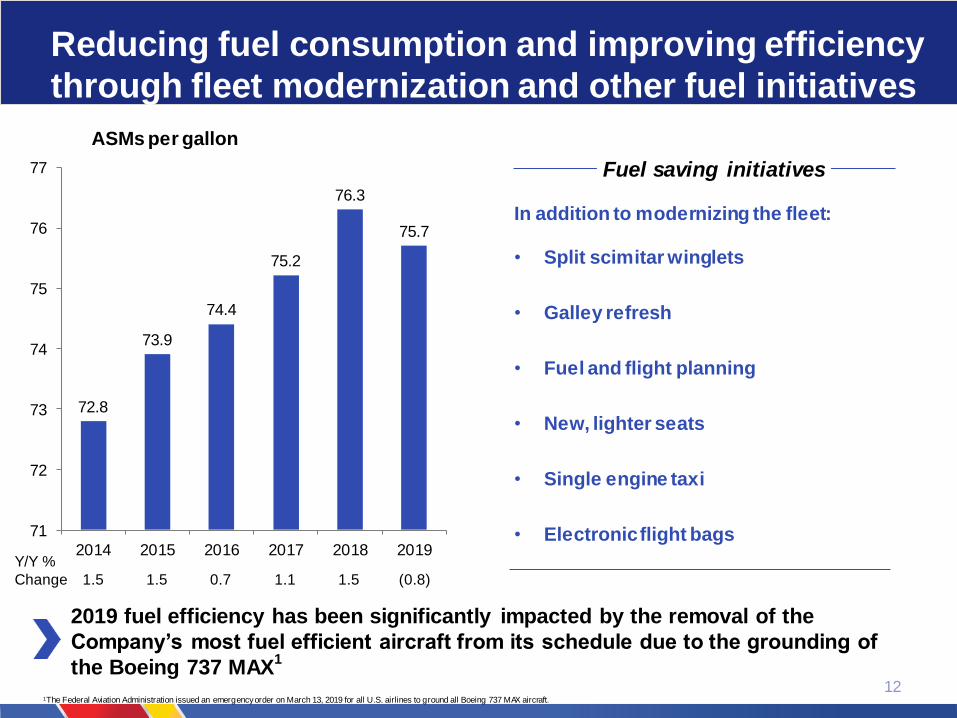
Reducing fuel consumption and improving efficiency
through fleet modernization and other fuel initiatives
12
72.8
73.9
74.4
75.2
76.3
75.7
71
72
73
74
75
76
77
2014 2015 2016 2017 2018 2019
In addition to modernizing the fleet:
• Split scimitar winglets
• Galley refresh
• Fuel and flight planning
• New, lighter seats
• Single engine taxi
• Electronic flight bags
Fuel saving initiatives
ASMs per gallon
Y/Y %
Change 1.5 1.5 0.7 1.1 1.5 (0.8)
2019 fuel efficiency has been significantly impacted by the removal of the
Company’s most fuel efficient aircraft from its schedule due to the grounding of
the Boeing 737 MAX1
1The Federal Aviation Administration issued an emergency order on March 13, 2019 for all U.S. airlines to ground all Boeing 737 MAX aircraft.
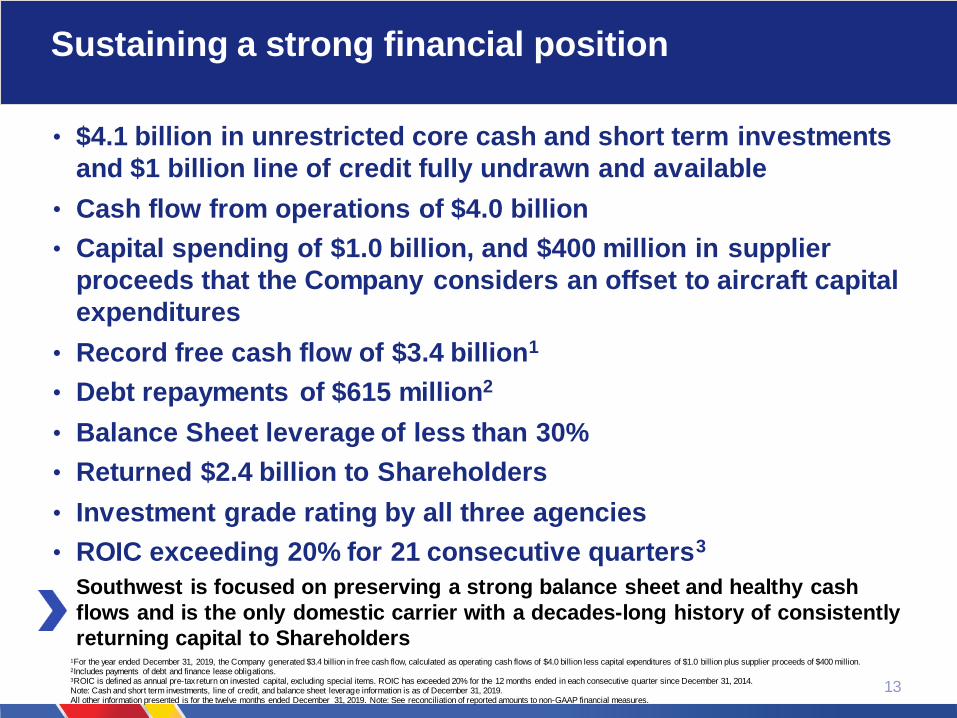
Southwest is focused on preserving a strong balance sheet and healthy cash
flows and is the only domestic carrier with a decades-long history of consistently
returning capital to Shareholders
Sustaining a strong financial position
13
1For the year ended December 31, 2019, the Company generated $3.4 billion in free cash flow, calculated as operating cash flows of $4.0 billion less capital expenditures of $1.0 billion plus supplier proceeds of $400 million.2Includes payments of debt and finance lease obligations.3ROIC is defined as annual pre-tax return on invested capital, excluding special items. ROIC has exceeded 20% for the 12 months ended in each consecutive quarter since December 31, 2014.Note: Cash and short term investments, line of credit, and balance sheet leverage information is as of December 31, 2019. All other information presented is for the twelve months ended December 31, 2019. Note: See reconciliation of reported amounts to non-GAAP financial measures.
• $4.1 billion in unrestricted core cash and short term investments
and $1 billion line of credit fully undrawn and available
• Cash flow from operations of $4.0 billion
• Capital spending of $1.0 billion, and $400 million in supplier
proceeds that the Company considers an offset to aircraft capital
expenditures
• Record free cash flow of $3.4 billion1
• Debt repayments of $615 million2
• Balance Sheet leverage of less than 30%
• Returned $2.4 billion to Shareholders
• Investment grade rating by all three agencies
• ROIC exceeding 20% for 21 consecutive quarters3
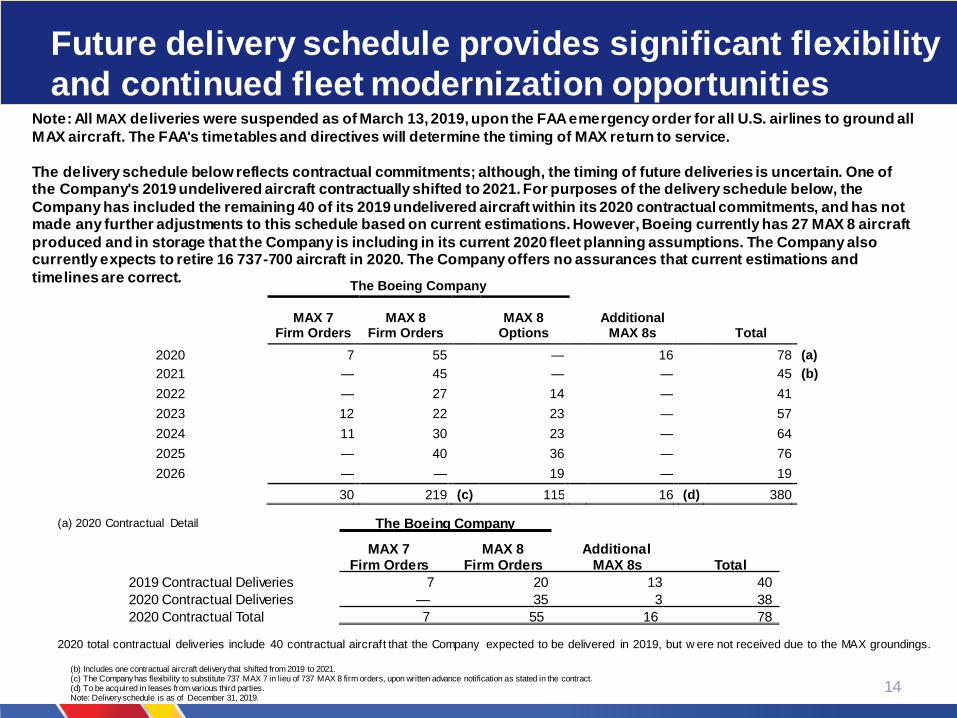
Future delivery schedule provides significant flexibility
and continued fleet modernization opportunities
14
(b) Includes one contractual aircraft delivery that shifted from 2019 to 2021.(c) The Company has flexibility to substitute 737 MAX 7 in lieu of 737 MAX 8 firm orders, upon written advance notification as stated in the contract.(d) To be acquired in leases from various third parties.Note: Delivery schedule is as of December 31, 2019.
Note: All MAX deliveries were suspended as of March 13, 2019, upon the FAA emergency order for all U.S. airlines to ground all
MAX aircraft. The FAA's timetables and directives will determine the timing of MAX return to service.
The delivery schedule below reflects contractual commitments; although, the timing of future deliveries is uncertain. One of the Company's 2019 undelivered aircraft contractually shifted to 2021. For purposes of the delivery schedule below, the
Company has included the remaining 40 of its 2019 undelivered aircraft within its 2020 contractual commitments, and has not made any further adjustments to this schedule based on current estimations. However, Boeing currently has 27 MAX 8 aircraft
produced and in storage that the Company is including in its current 2020 fleet planning assumptions. The Company also currently expects to retire 16 737-700 aircraft in 2020. The Company offers no assurances that current estimations and
timelines are correct. The Boeing Company
MAX 7
Firm Orders MAX 8
Firm Orders MAX 8
Options Additional
MAX 8s Total
2020 7 55 — 16 78 (a)
2021 — 45 — — 45 (b)
2022 — 27 14 — 41
2023 12 22 23 — 57
2024 11 30 23 — 64
2025 — 40 36 — 76
2026 — — 19 — 19
30 219 (c) 115 16 (d) 380
The Boeing Company
MAX 7Firm Orders
MAX 8Firm Orders
Additional MAX 8s Total
2019 Contractual Deliveries 7 20 13 40
2020 Contractual Deliveries — 35 3 38
2020 Contractual Total 7 55 16 78
(a) 2020 Contractual Detail
2020 total contractual deliveries include 40 contractual aircraft that the Company expected to be delivered in 2019, but w ere not received due to the MAX groundings.
$0.0
$0.5
$1.0
$1.5
$2.0
$2.5
$3.0
$3.5
$4.0Free cash flow
Share repurchases
Dividends
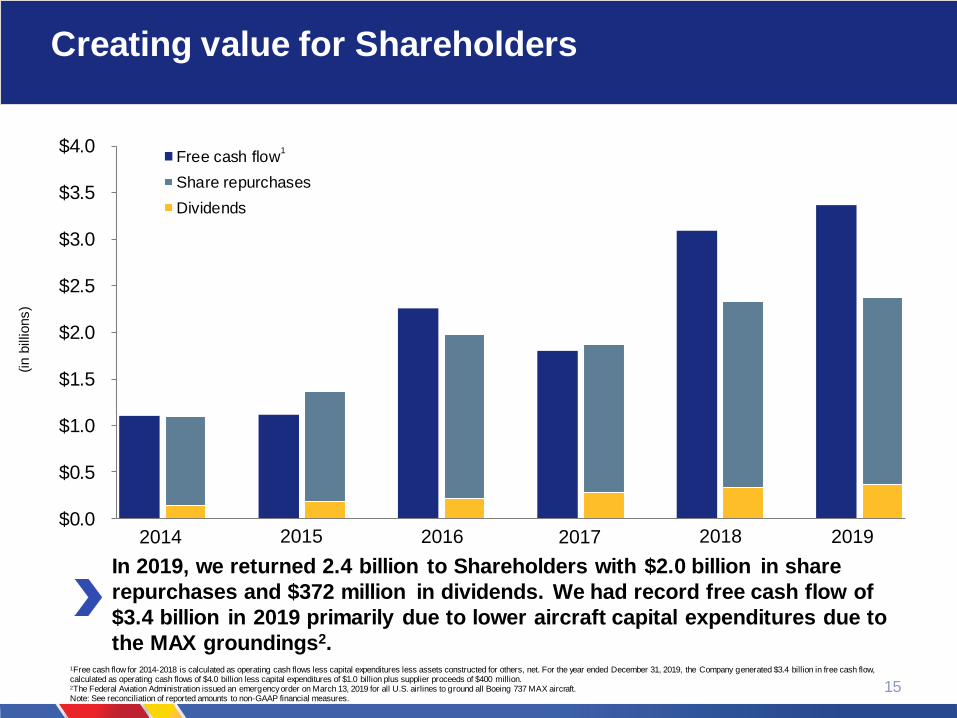
Creating value for Shareholders
15
1Free cash flow for 2014-2018 is calculated as operating cash flows less capital expenditures less assets constructed for others, net. For the year ended December 31, 2019, the Company generated $3.4 billion in free cash flow, calculated as operating cash flows of $4.0 billion less capital expenditures of $1.0 billion plus supplier proceeds of $400 million.2The Federal Aviation Administration issued an emergency order on March 13, 2019 for all U.S. airlines to ground all Boeing 737 MAX aircraft.Note: See reconciliation of reported amounts to non-GAAP financial measures.
In 2019, we returned 2.4 billion to Shareholders with $2.0 billion in share
repurchases and $372 million in dividends. We had record free cash flow of
$3.4 billion in 2019 primarily due to lower aircraft capital expenditures due to
the MAX groundings2.
(in b
illio
ns)
2014
1
2015 2016 2017 2018 2019
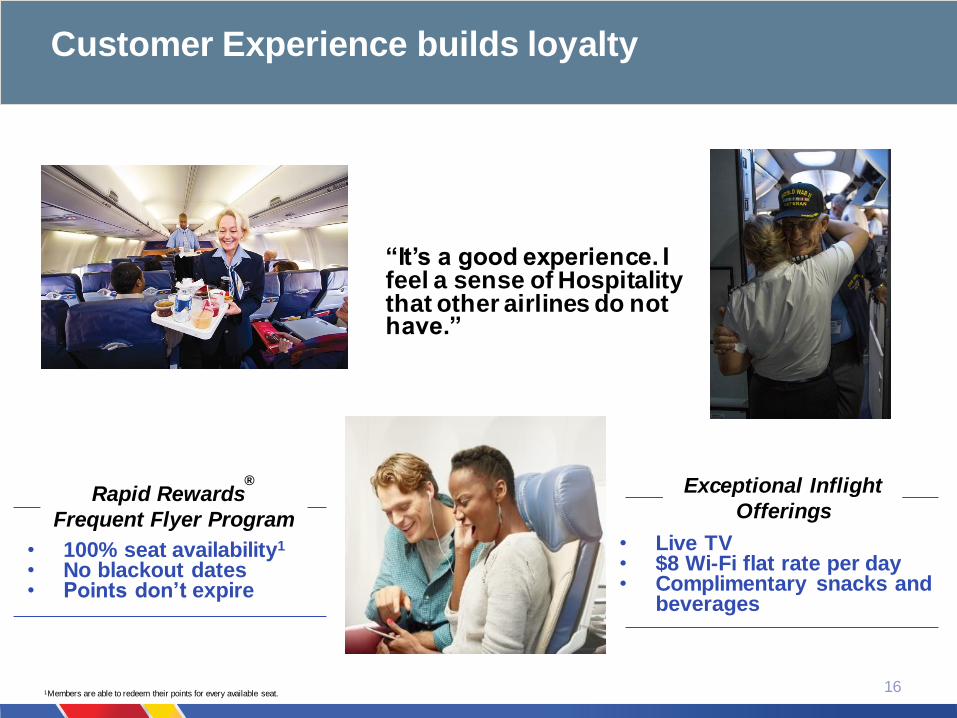
Customer Experience builds loyalty
16
“It’s a good experience. I feel a sense of Hospitality that other airlines do not have.”
• 100% seat availability1
• No blackout dates• Points don’t expire
Rapid Rewards®
Frequent Flyer Program• Live TV • $8 Wi-Fi flat rate per day• Complimentary snacks and
beverages
Exceptional Inflight
Offerings
1Members are able to redeem their points for every available seat.
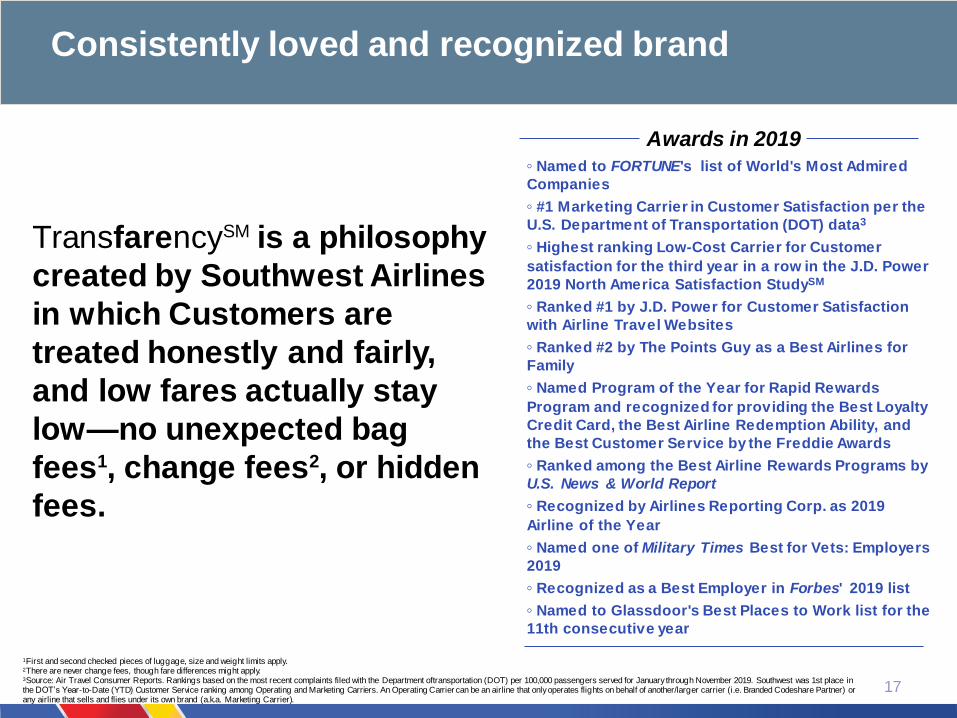
Consistently loved and recognized brand
◦ Named to FORTUNE's list of World's Most Admired
Companies
◦ #1 Marketing Carrier in Customer Satisfaction per the
U.S. Department of Transportation (DOT) data3
◦ Highest ranking Low-Cost Carrier for Customer
satisfaction for the third year in a row in the J.D. Power
2019 North America Satisfaction StudySM
◦ Ranked #1 by J.D. Power for Customer Satisfaction
with Airline Travel Websites
◦ Ranked #2 by The Points Guy as a Best Airlines for
Family
◦ Named Program of the Year for Rapid Rewards
Program and recognized for providing the Best Loyalty
Credit Card, the Best Airline Redemption Ability, and
the Best Customer Service by the Freddie Awards
◦ Ranked among the Best Airline Rewards Programs by
U.S. News & World Report
◦ Recognized by Airlines Reporting Corp. as 2019
Airline of the Year
◦ Named one of Military Times Best for Vets: Employers
2019
◦ Recognized as a Best Employer in Forbes' 2019 list
◦ Named to Glassdoor's Best Places to Work list for the
11th consecutive year
Awards in 2019
TransfarencySM is a philosophy
created by Southwest Airlines
in which Customers are
treated honestly and fairly,
and low fares actually stay
low—no unexpected bag
fees1, change fees2, or hidden
fees.
1First and second checked pieces of luggage, size and weight limits apply.2There are never change fees, though fare differences might apply.3Source: Air Travel Consumer Reports. Rankings based on the most recent complaints filed with the Department of transportation (DOT) per 100,000 passengers served for January through November 2019. Southwest was 1st place in the DOT’s Year-to-Date (YTD) Customer Service ranking among Operating and Marketing Carriers. An Operating Carrier can be an airline that only operates flights on behalf of another/larger carrier (i.e. Branded Codeshare Partner) orany airline that sells and flies under its own brand (a.k.a. Marketing Carrier).
17
18
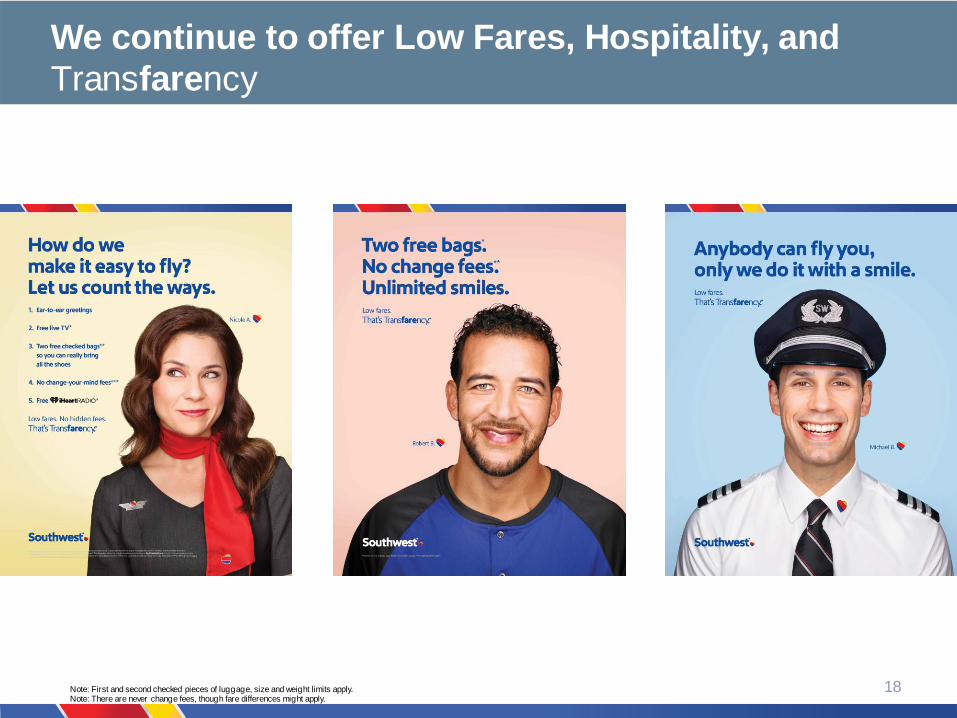
We continue to offer Low Fares, Hospitality, and
Transfarency
Note: First and second checked pieces of luggage, size and weight limits apply.Note: There are never change fees, though fare differences might apply.
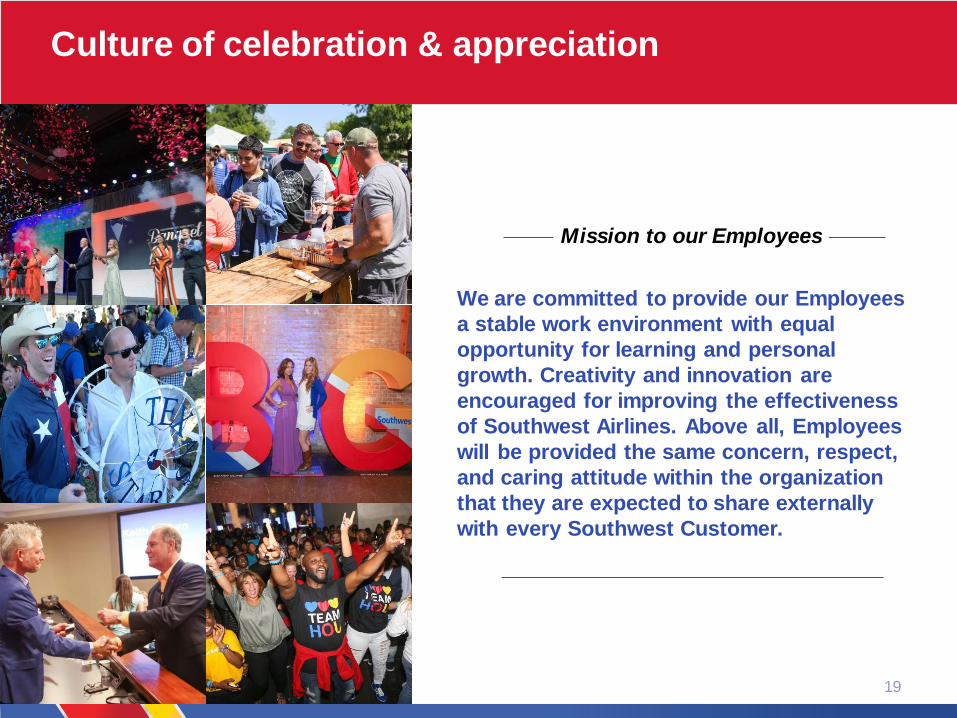
Culture of celebration & appreciation
19
Mission to our Employees
We are committed to provide our Employees
a stable work environment with equal
opportunity for learning and personal
growth. Creativity and innovation are
encouraged for improving the effectiveness
of Southwest Airlines. Above all, Employees
will be provided the same concern, respect,
and caring attitude within the organization
that they are expected to share externally
with every Southwest Customer.
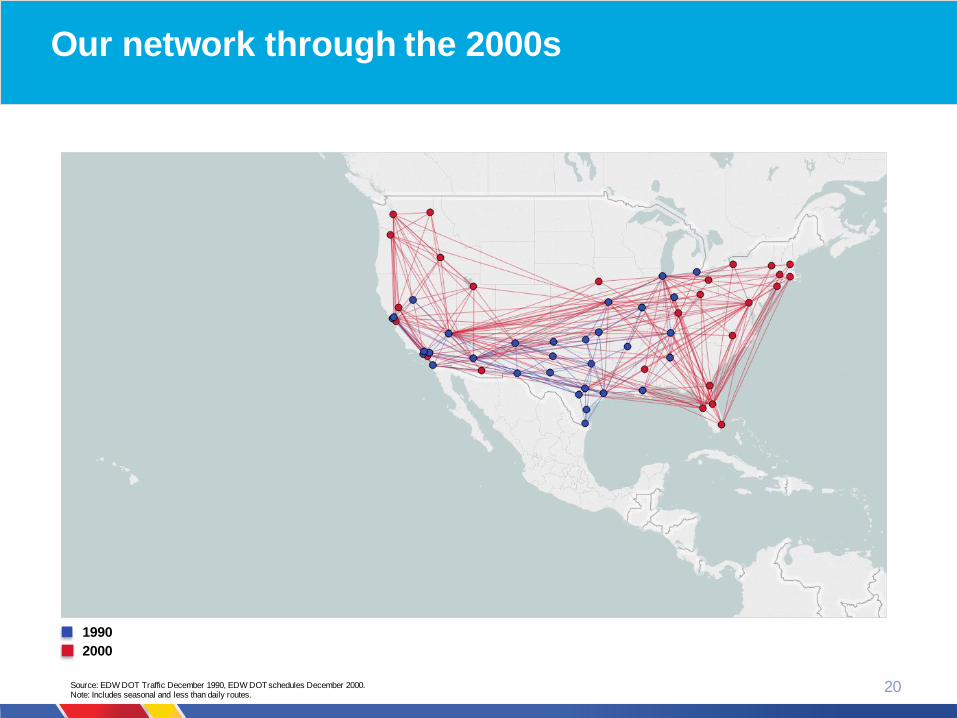
Our network through the 2000s
20
1990
2000
Source: EDW DOT Traffic December 1990, EDW DOT schedules December 2000.Note: Includes seasonal and less than daily routes.
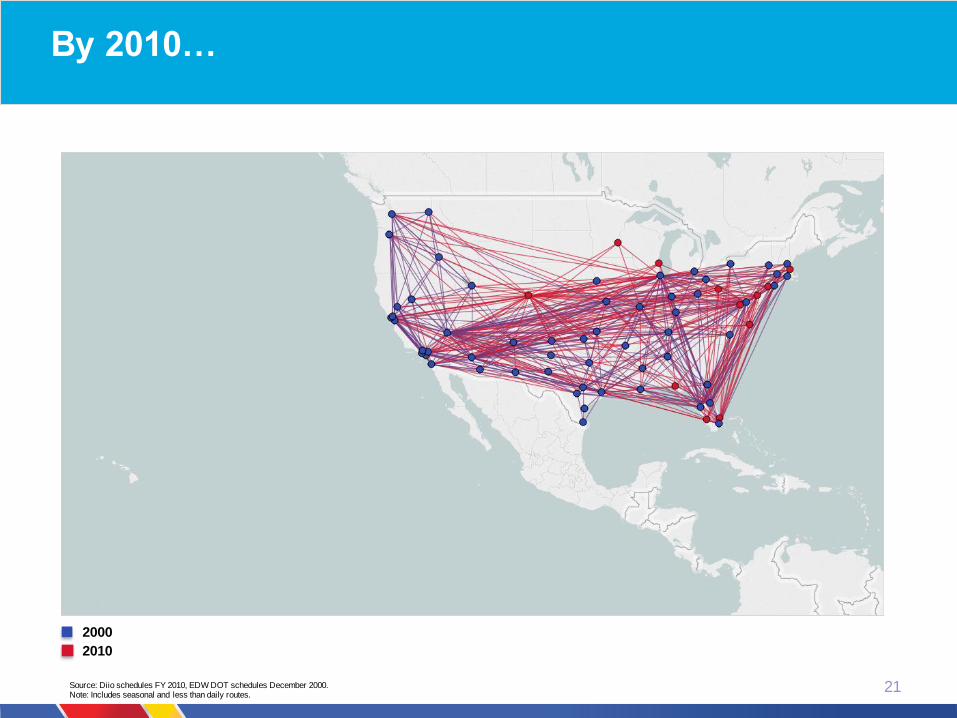
By 2010…
21
2000
2010
Source: Diio schedules FY 2010, EDW DOT schedules December 2000.Note: Includes seasonal and less than daily routes.
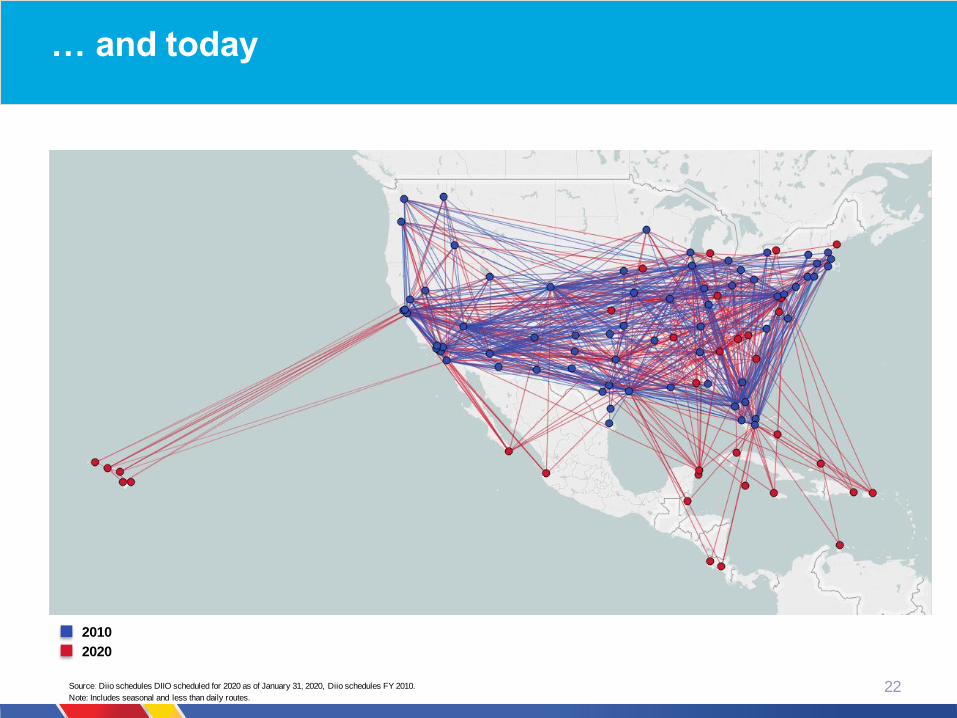
… and today
22
2010
2020
Source: Diio schedules DIIO scheduled for 2020 as of January 31, 2020, Diio schedules FY 2010.
Note: Includes seasonal and less than daily routes.
23
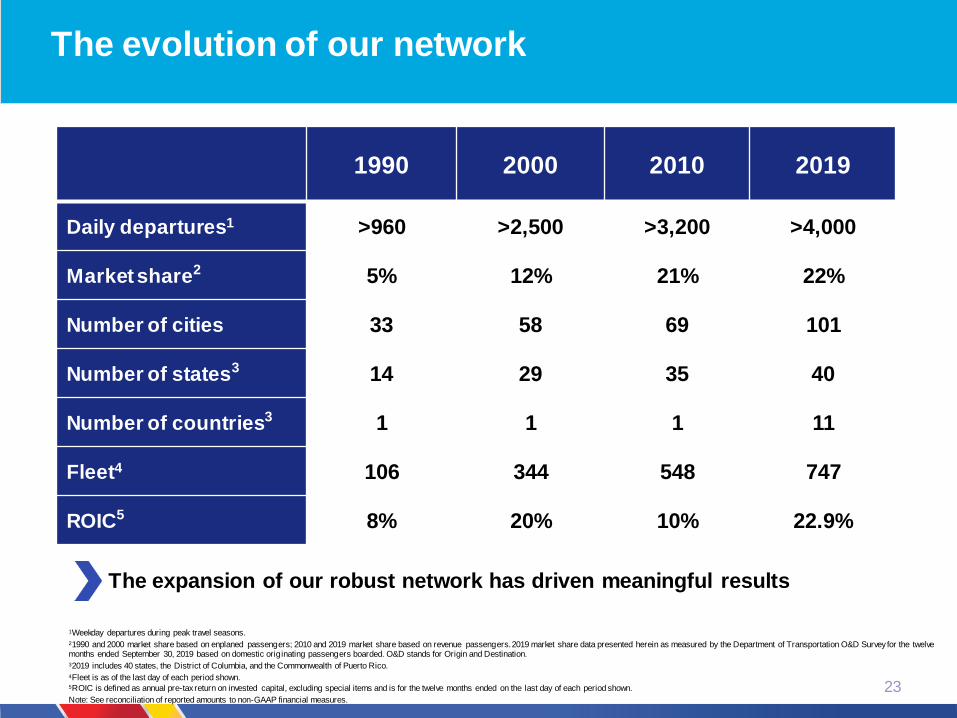
The expansion of our robust network has driven meaningful results
The evolution of our network
1990 2000 2010 2019
Daily departures1 >960 >2,500 >3,200 >4,000
Market share2 5% 12% 21% 22%
Number of cities 33 58 69 101
Number of states3 14 29 35 40
Number of countries3 1 1 1 11
Fleet4 106 344 548 747
ROIC5 8% 20% 10% 22.9%
1Weekday departures during peak travel seasons. 21990 and 2000 market share based on enplaned passengers; 2010 and 2019 market share based on revenue passengers. 2019 market share data presented herein as measured by the Department of Transportation O&D Survey for the twelve months ended September 30, 2019 based on domestic originating passengers boarded. O&D stands for Origin and Destination.32019 includes 40 states, the District of Columbia, and the Commonwealth of Puerto Rico. 4Fleet is as of the last day of each period shown.5ROIC is defined as annual pre-tax return on invested capital, excluding special items and is for the twelve months ended on the last day of each period shown.
Note: See reconciliation of reported amounts to non-GAAP financial measures.
24
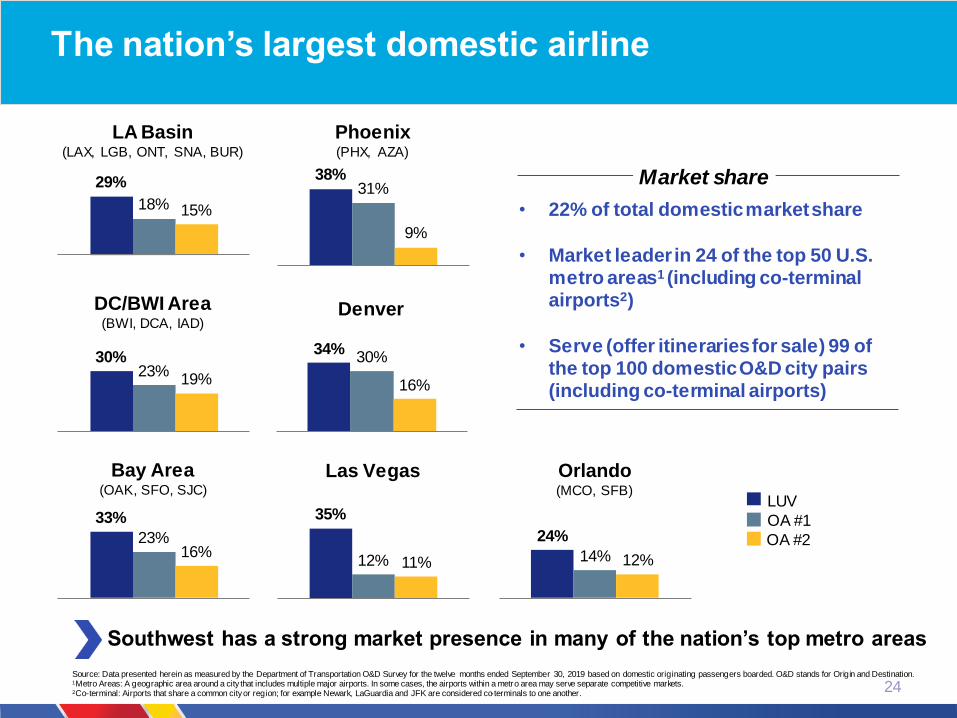
The nation’s largest domestic airline
29%
18% 15%
LA Basin (LAX, LGB, ONT, SNA, BUR)
24%
14% 12%
Orlando(MCO, SFB)
30%23%
19%
DC/BWI Area(BWI, DCA, IAD)
34%30%
16%
Denver
Source: Data presented herein as measured by the Department of Transportation O&D Survey for the twelve months ended September 30, 2019 based on domestic originating passengers boarded. O&D stands for Origin and Destination.1Metro Areas: A geographic area around a city that includes multiple major airports. In some cases, the airports within a metro area may serve separate competitive markets.2Co-terminal: Airports that share a common city or region; for example Newark, LaGuardia and JFK are considered co-terminals to one another.
• 22% of total domestic market share
• Market leader in 24 of the top 50 U.S. metro areas1 (including co-terminal airports2)
• Serve (offer itineraries for sale) 99 of the top 100 domestic O&D city pairs (including co-terminal airports)
Market share
LUV
OA #1
OA #2
Southwest has a strong market presence in many of the nation’s top metro areas
33%
23%16%
Bay Area(OAK, SFO, SJC)
35%
12% 11%
Las Vegas
38%31%
9%
Phoenix(PHX, AZA)
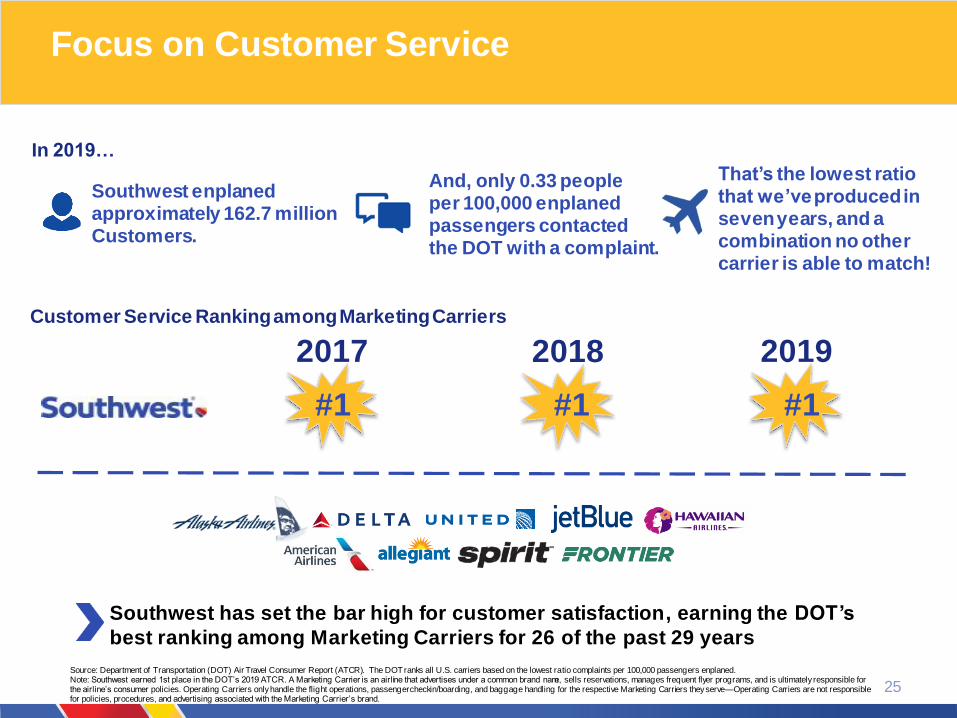
Focus on Customer Service
25
Southwest has set the bar high for customer satisfaction, earning the DOT’s
best ranking among Marketing Carriers for 26 of the past 29 years
2017 2018
Source: Department of Transportation (DOT) Air Travel Consumer Report (ATCR). The DOT ranks all U.S. carriers based on the lowest ratio complaints per 100,000 passengers enplaned.Note: Southwest earned 1st place in the DOT’s 2019 ATCR. A Marketing Carrier is an airline that advertises under a common brand name, sells reservations, manages frequent flyer programs, and is ultimately responsible for the airline’s consumer policies. Operating Carriers only handle the flight operations, passenger checkin/boarding, and baggage handling for the respective Marketing Carriers they serve—Operating Carriers are not responsiblefor policies, procedures, and advertising associated with the Marketing Carrier’s brand.
Customer Service Ranking among Marketing Carriers
Southwest enplaned approximately 162.7 million Customers.
And, only 0.33 people per 100,000 enplaned passengers contacted the DOT with a complaint.
That’s the lowest ratio that we’ve produced in seven years, and a combination no other carrier is able to match!
In 2019…
2019
#1 #1 #1
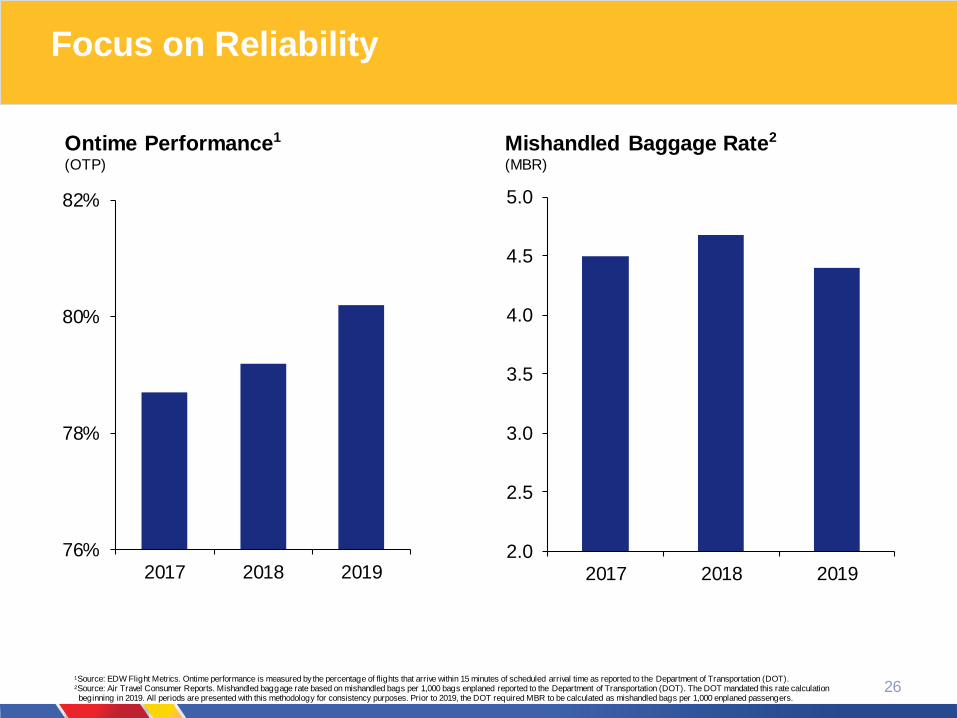
Focus on Reliability
26
2.0
2.5
3.0
3.5
4.0
4.5
5.0
2017 2018 2019
76%
78%
80%
82%
2017 2018 2019
Mishandled Baggage Rate2
(MBR)
Ontime Performance1
(OTP)
1Source: EDW Flight Metrics. Ontime performance is measured by the percentage of flights that arrive within 15 minutes of scheduled arrival time as reported to the Department of Transportation (DOT).2Source: Air Travel Consumer Reports. Mishandled baggage rate based on mishandled bags per 1,000 bags enplaned reported to the Department of Transportation (DOT). The DOT mandated this rate calculation beginning in 2019. All periods are presented with this methodology for consistency purposes. Prior to 2019, the DOT required MBR to be calculated as mishandled bags per 1,000 enplaned passengers.
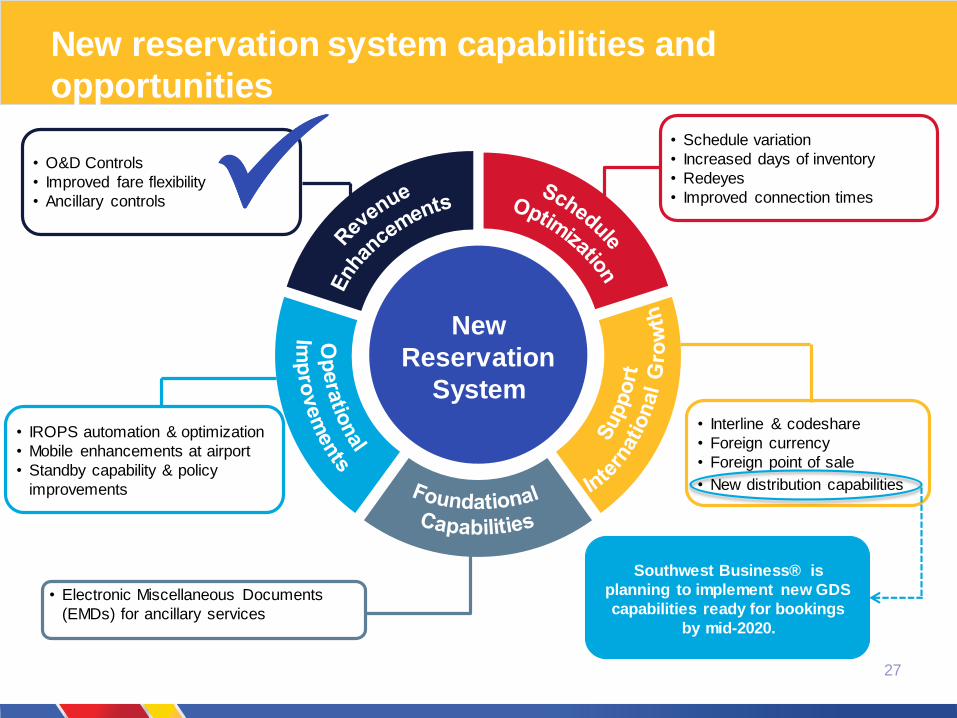
New reservation system capabilities and
opportunities
27
New
Reservation
System
• Electronic Miscellaneous Documents
(EMDs) for ancillary services
• Interline & codeshare
• Foreign currency
• Foreign point of sale
• New distribution capabilities
• O&D Controls
• Improved fare flexibility
• Ancillary controls
• IROPS automation & optimization
• Mobile enhancements at airport
• Standby capability & policy
improvements
• Schedule variation
• Increased days of inventory
• Redeyes
• Improved connection times
Southwest Business® is
planning to implement new GDS
capabilities ready for bookings
by mid-2020.
28
Purpose
Connect People to what’s important in
their lives through friendly, reliable, and
low-cost air travel.
Vision
To become the world’s most loved, most
efficient, and most profitable airline.
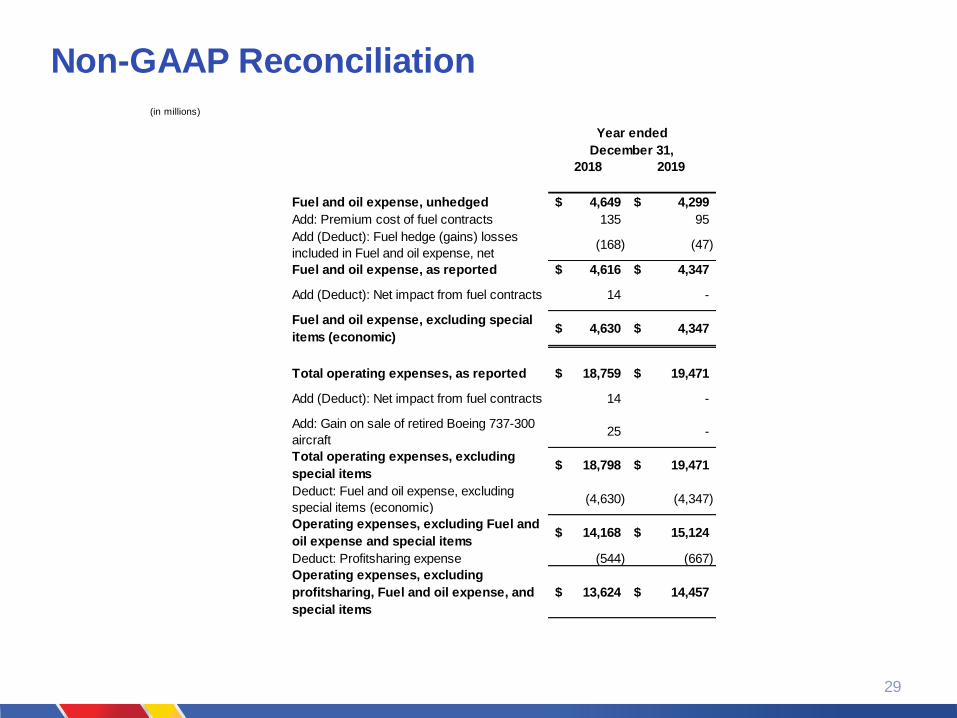
Non-GAAP Reconciliation
29
2018 2019
Fuel and oil expense, unhedged 4,649$ 4,299$
Add: Premium cost of fuel contracts 135 95
Add (Deduct): Fuel hedge (gains) losses
included in Fuel and oil expense, net(168) (47)
Fuel and oil expense, as reported 4,616$ 4,347$
Add (Deduct): Net impact from fuel contracts 14 -
Fuel and oil expense, excluding special
items (economic)4,630$ 4,347$
Total operating expenses, as reported 18,759$ 19,471$
Add (Deduct): Net impact from fuel contracts 14 -
Add: Gain on sale of retired Boeing 737-300
aircraft25 -
Total operating expenses, excluding
special items18,798$ 19,471$
Deduct: Fuel and oil expense, excluding
special items (economic)(4,630) (4,347)
Operating expenses, excluding Fuel and
oil expense and special items14,168$ 15,124$
Deduct: Profitsharing expense (544) (667)
Operating expenses, excluding
profitsharing, Fuel and oil expense, and
special items
13,624$ 14,457$
Year ended
December 31,
(in millions)
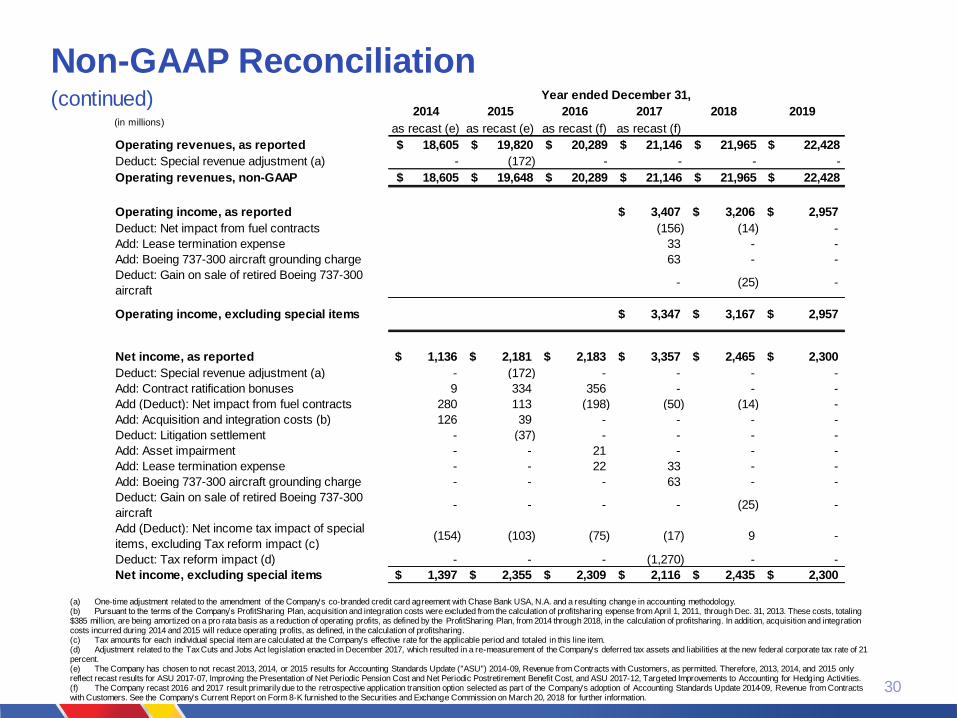
Non-GAAP Reconciliation (continued)
30
(a) One-time adjustment related to the amendment of the Company's co-branded credit card agreement with Chase Bank USA, N.A. and a resulting change in accounting methodology.(b) Pursuant to the terms of the Company’s ProfitSharing Plan, acquisition and integration costs were excluded from the calculation of profitsharing expense from April 1, 2011, through Dec. 31, 2013. These costs, totaling $385 million, are being amortized on a pro rata basis as a reduction of operating profits, as defined by the ProfitSharing Plan, from 2014 through 2018, in the calculation of profitsharing. In addition, acquisition and integration costs incurred during 2014 and 2015 will reduce operating profits, as defined, in the calculation of profitsharing.(c) Tax amounts for each individual special item are calculated at the Company's effective rate for the applicable period and totaled in this line item.(d) Adjustment related to the Tax Cuts and Jobs Act legislation enacted in December 2017, which resulted in a re-measurement of the Company's deferred tax assets and liabilities at the new federal corporate tax rate of 21 percent.(e) The Company has chosen to not recast 2013, 2014, or 2015 results for Accounting Standards Update ("ASU") 2014-09, Revenue from Contracts with Customers, as permitted. Therefore, 2013, 2014, and 2015 only reflect recast results for ASU 2017-07, Improving the Presentation of Net Periodic Pension Cost and Net Periodic Postretirement Benefit Cost, and ASU 2017-12, Targeted Improvements to Accounting for Hedging Activities.(f) The Company recast 2016 and 2017 result primarily due to the retrospective application transition option selected as part of the Company's adoption of Accounting Standards Update 2014-09, Revenue from Contracts with Customers. See the Company's Current Report on Form 8-K furnished to the Securities and Exchange Commission on March 20, 2018 for further information.
2014 2015 2016 2017 2018 2019
as recast (e) as recast (e) as recast (f) as recast (f)
Operating revenues, as reported $ 18,605 $ 19,820 $ 20,289 $ 21,146 $ 21,965 $ 22,428
Deduct: Special revenue adjustment (a) - (172) - - - -
Operating revenues, non-GAAP $ 18,605 $ 19,648 $ 20,289 $ 21,146 $ 21,965 $ 22,428
Operating income, as reported 2,168$ 3,999$ 3,522$ 3,407$ 3,206$ 2,957$
Deduct: Net impact from fuel contracts 28 (323) (201) (156) (14) -
Add: Lease termination expense - - 22 33 - -
Add: Boeing 737-300 aircraft grounding charge - - - 63 - -
Deduct: Gain on sale of retired Boeing 737-300
aircraft- - - - (25) -
Operating income, excluding special items 2,331$ 3,840$ 3,720$ 3,347$ 3,167$ 2,957$
Net income, as reported 1,136$ 2,181$ 2,183$ 3,357$ 2,465$ 2,300$
Deduct: Special revenue adjustment (a) - (172) - - - -
Add: Contract ratification bonuses 9 334 356 - - -
Add (Deduct): Net impact from fuel contracts 280 113 (198) (50) (14) -
Add: Acquisition and integration costs (b) 126 39 - - - -
Deduct: Litigation settlement - (37) - - - -
Add: Asset impairment - - 21 - - -
Add: Lease termination expense - - 22 33 - -
Add: Boeing 737-300 aircraft grounding charge - - - 63 - -
Deduct: Gain on sale of retired Boeing 737-300
aircraft- - - - (25) -
Add (Deduct): Net income tax impact of special
items, excluding Tax reform impact (c)(154) (103) (75) (17) 9 -
Deduct: Tax reform impact (d) - - - (1,270) - -
Net income, excluding special items 1,397$ 2,355$ 2,309$ 2,116$ 2,435$ 2,300$
Year ended December 31,
(in millions)
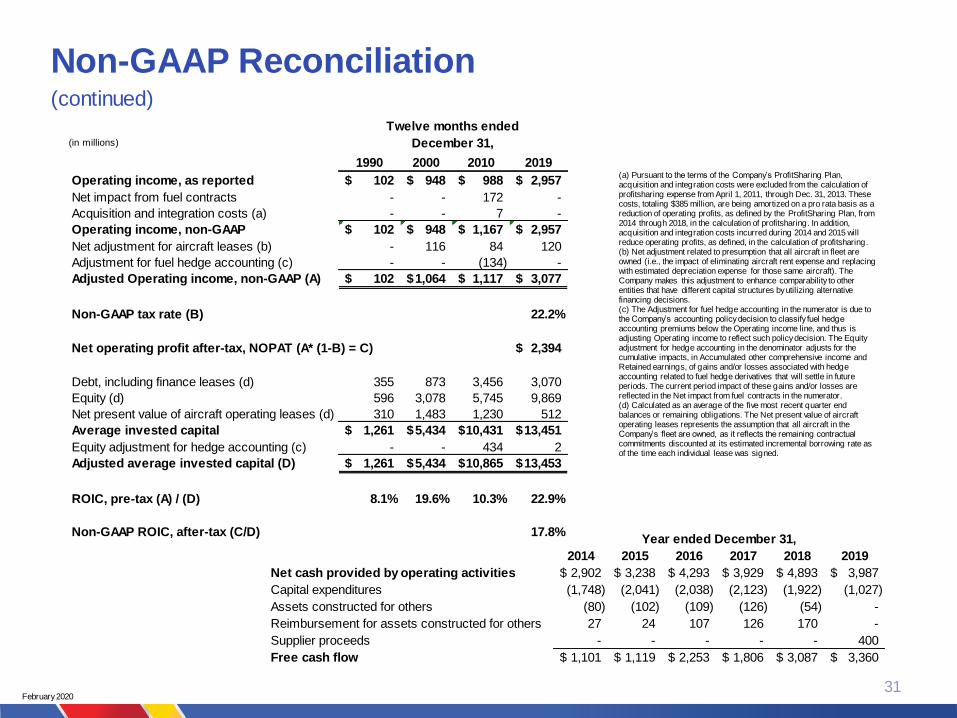
Non-GAAP Reconciliation (continued)
31February 2020
(a) Pursuant to the terms of the Company’s ProfitSharing Plan, acquisition and integration costs were excluded from the calculation of profitsharing expense from April 1, 2011, through Dec. 31, 2013. These costs, totaling $385 million, are being amortized on a pro rata basis as a reduction of operating profits, as defined by the ProfitSharing Plan, from 2014 through 2018, in the calculation of profitsharing. In addition, acquisition and integration costs incurred during 2014 and 2015 will reduce operating profits, as defined, in the calculation of profitsharing.(b) Net adjustment related to presumption that all aircraft in fleet are owned (i.e., the impact of eliminating aircraft rent expense and replacing with estimated depreciation expense for those same aircraft). The Company makes this adjustment to enhance comparability to other entities that have different capital structures by utilizing alternative financing decisions.(c) The Adjustment for fuel hedge accounting in the numerator is due to the Company’s accounting policy decision to classify fuel hedge accounting premiums below the Operating income line, and thus is adjusting Operating income to reflect such policy decision. The Equity adjustment for hedge accounting in the denominator adjusts for the cumulative impacts, in Accumulated other comprehensive income and Retained earnings, of gains and/or losses associated with hedge accounting related to fuel hedge derivatives that will settle in future periods. The current period impact of these gains and/or losses are reflected in the Net impact from fuel contracts in the numerator.(d) Calculated as an average of the five most recent quarter end balances or remaining obligations. The Net present value of aircraft operating leases represents the assumption that all aircraft in the Company’s fleet are owned, as it reflects the remaining contractual commitments discounted at its estimated incremental borrowing rate as of the time each individual lease was signed.
1990 2000 2010 2019
Operating income, as reported 102$ 948$ 988$ 2,957$
Net impact from fuel contracts - - 172 -
Acquisition and integration costs (a) - - 7 -
Operating income, non-GAAP 102$ 948$ 1,167$ 2,957$
Net adjustment for aircraft leases (b) - 116 84 120
Adjustment for fuel hedge accounting (c) - - (134) -
Adjusted Operating income, non-GAAP (A) 102$ 1,064$ 1,117$ 3,077$
Non-GAAP tax rate (B) 22.2%
Net operating profit after-tax, NOPAT (A* (1-B) = C) 2,394$
Debt, including finance leases (d) 355 873 3,456 3,070
Equity (d) 596 3,078 5,745 9,869
Net present value of aircraft operating leases (d) 310 1,483 1,230 512
Average invested capital 1,261$ 5,434$ 10,431$ 13,451$
Equity adjustment for hedge accounting (c) - - 434 2
Adjusted average invested capital (D) 1,261$ 5,434$ 10,865$ 13,453$
ROIC, pre-tax (A) / (D) 8.1% 19.6% 10.3% 22.9%
Non-GAAP ROIC, after-tax (C/D) 17.8%
Twelve months ended
December 31,
2014 2015 2016 2017 2018 2019
Net cash provided by operating activities 2,902$ 3,238$ 4,293$ 3,929$ 4,893$ 3,987$
Capital expenditures (1,748) (2,041) (2,038) (2,123) (1,922) (1,027)
Assets constructed for others (80) (102) (109) (126) (54) -
Reimbursement for assets constructed for others 27 24 107 126 170 -
Supplier proceeds - - - - - 400
Free cash flow 1,101$ 1,119$ 2,253$ 1,806$ 3,087$ 3,360$
Year ended December 31,
(in millions)